


Detection of COVID-19 in X-ray Images Using Densely Connected Squeeze Convolutional Neural Network (DCSCNN): Focusing on Interpretability and Explainability of the Black Box Model

 ,
,  ,
,  ,
,  , and
, and 
Abstract
1. Introduction
- Developed DCSCNN model for binary and multi-class classification of COVID-19 and other lung disease conditions.
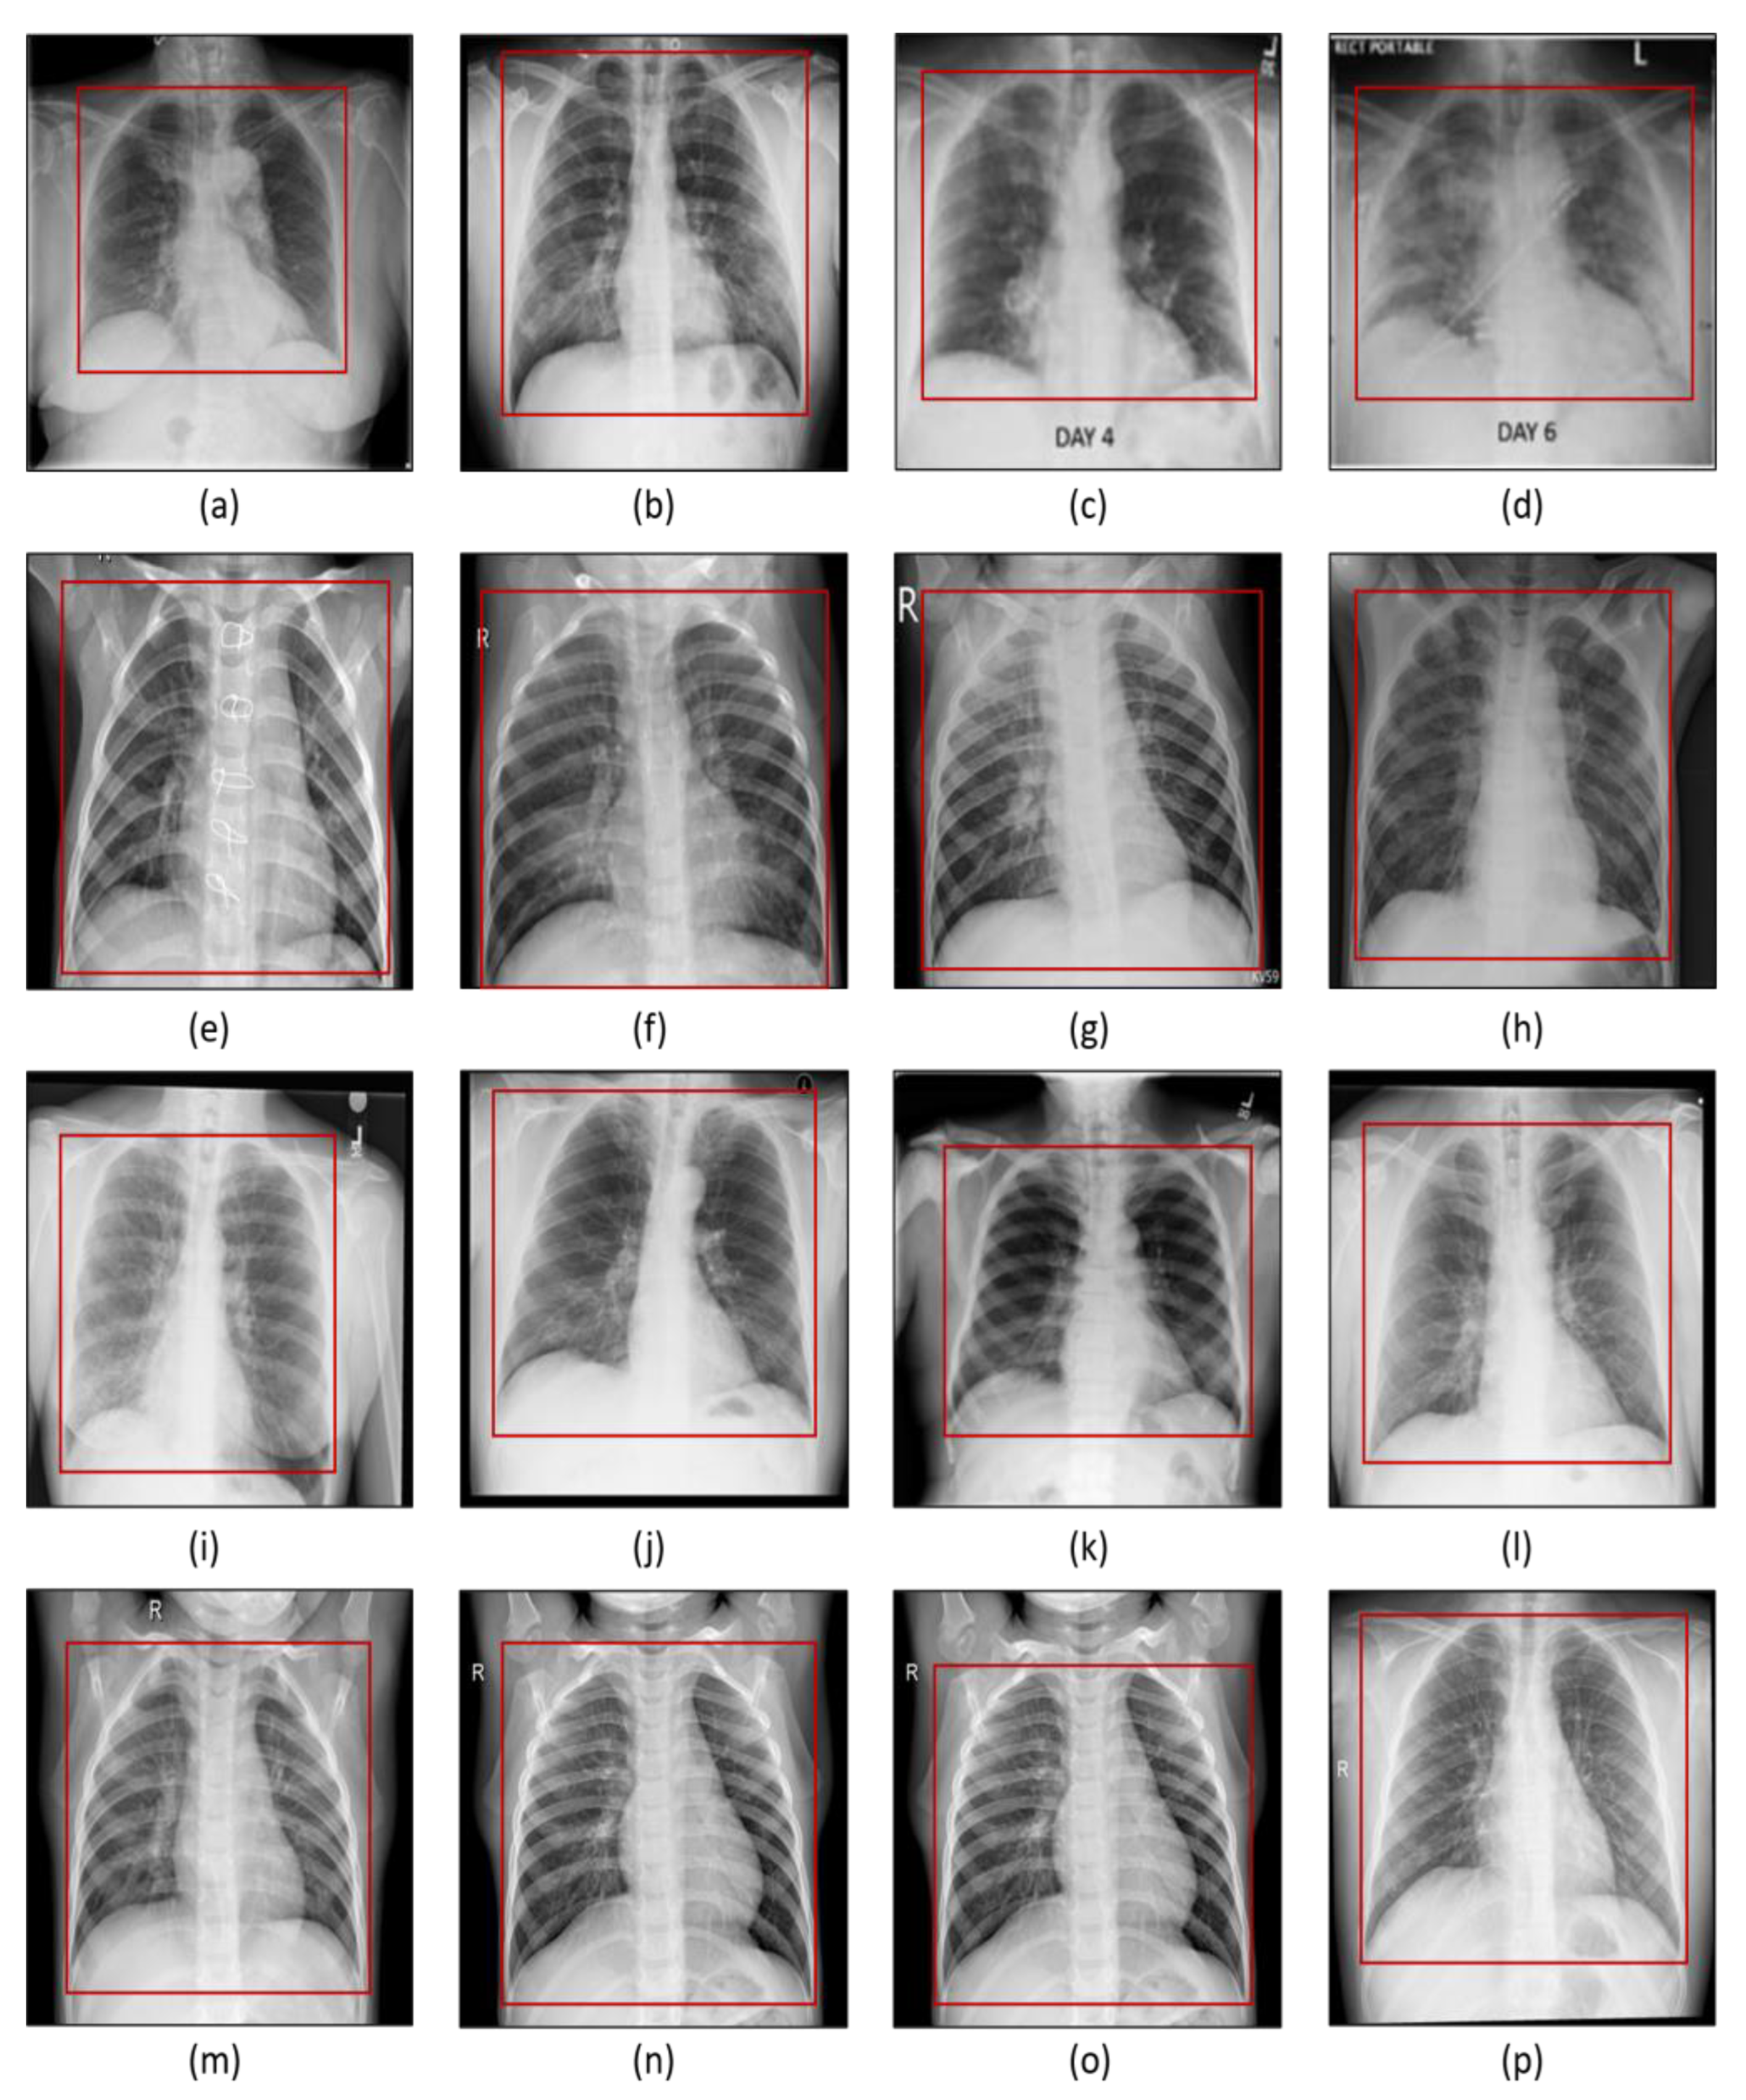
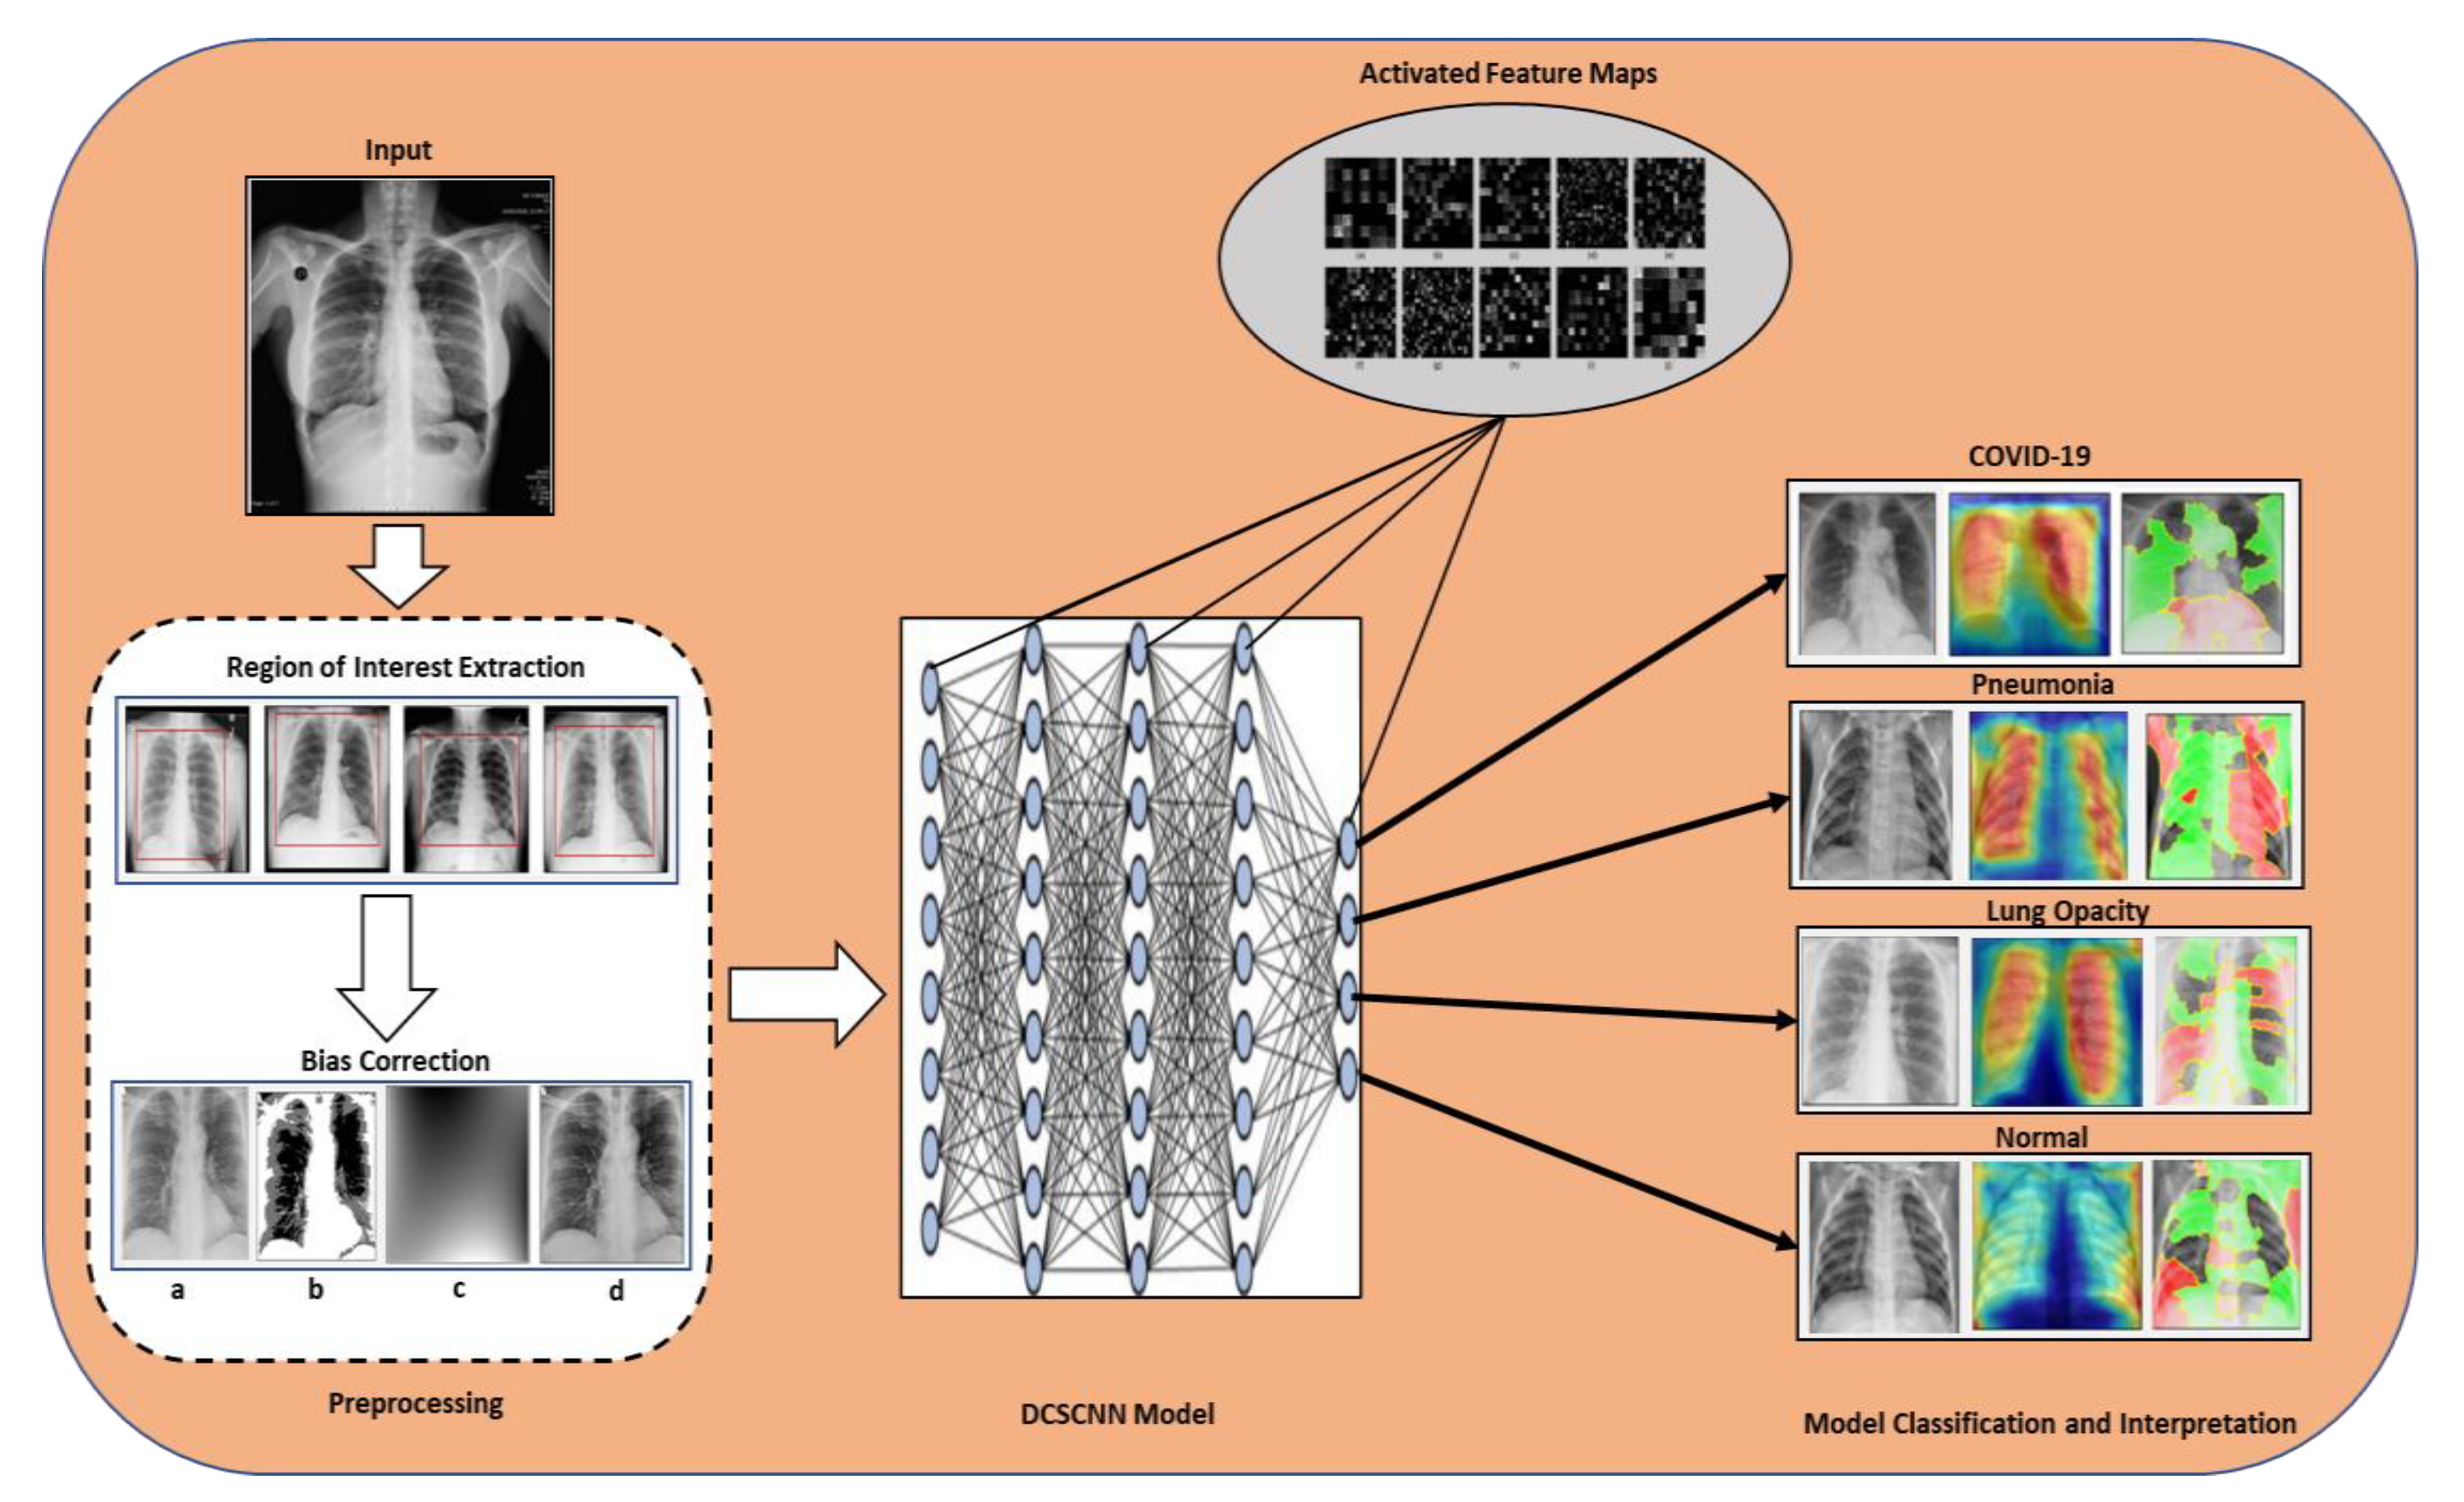
- Preprocessing of the X-ray images by performing intensity inhomogeneity correction to obtain the optimal performance of the model and correct the image intensity.
- Explainable artificial intelligence (XAI) techniques i.e., Grad-CAM and LIME techniques were utilized to interpret and explain the output of the proposed model.
- The classification was performed on chest X-ray images using supervised learning approaches.
- Seven types of classifications have been performed i.e., COVID vs. normal, COVID vs. lung opacity, lung opacity vs. normal, COVID vs. pneumonia, pneumonia vs. lung opacity, pneumonia vs. normal, and COVID vs. pneumonia vs. lung opacity vs. normal.
2. Related Works
3. Methods and Materials
3.1. Data Source and Description
3.1.1. COVID-19 Dataset
3.1.2. Normal Dataset
3.1.3. Lung Opacity Dataset
3.1.4. Pneumonia Dataset
3.2. Preprocessing
3.2.1. Bias Field Correction
Optimization of Multiplicative Intrinsic Componen
Minimization of Energy
3.3. Convolutional Neural Network
4. Experimental Results and Discussion
5. Conclusions
Supplementary Materials
Author Contributions
Funding
Institutional Review Board Statement
Informed Consent Statement
Data Availability Statement
Conflicts of Interest
References
- Tyrrell, D.; Bynoe, M. Cultivation of viruses from a high proportion of patients with colds. Lancet 1966, 1, 76–77. [Google Scholar] [CrossRef] [PubMed]
- Singh, M.; Bansal, V.; Feschotte, C. A single-cell RNA expression map of human coronavirus entry factors. Cell Rep. 2020, 32, 108175. [Google Scholar] [CrossRef] [PubMed]
- Siddell, S.G.; Anderson, R.; Cavanagh, D.; Fujiwara, K.; Klenk, H.D.; Macnaughton, M.R.; Pensaert, M.; Stohlman, S.A.; Sturman, L.; Van Der Zeijst, B.A. Coronaviridae. Intervirology 1983, 20, 181–189. [Google Scholar] [CrossRef] [PubMed]
- Phelan, A.L.; Katz, R.; Gostin, L.O. The novel coronavirus originating in Wuhan, China: Challenges for global health governance. JAMA 2020, 323, 709–710. [Google Scholar] [CrossRef]
- WHO. WHO Director-General’s Opening Remarks at the Media Briefing on COVID-19—11 March 2020. 2020. Available online: https://www.who.int/director-general/speeches/detail/who-director-general-s-opening-remarks-at-the-media-briefing-on-COVID-19---11-march-2020 (accessed on 5 August 2022).
- Lu, R.; Zhao, X.; Li, J.; Niu, P.; Yang, B.; Wu, H.; Wang, W.; Song, H.; Huang, B.; Zhu, N.; et al. Genomic characterisation and epidemiology of 2019 novel coronavirus: Implications for virus origins and receptor binding. Lancet 2020, 395, 565–574. [Google Scholar] [CrossRef]
- Karim, S.S.A.; Karim, Q.A. Omicron SARS-CoV-2 variant: A new chapter in the COVID-19 pandemic. Lancet 2021, 398, 2126–2128. [Google Scholar] [CrossRef]
- CDC COVID-19 Response Team. SARS-CoV-2 B. 1.1. 529 (Omicron) Variant—United States, December 1–8, 2021. Morb. Mortal. Wkly. Rep. 2021, 70, 1731. [Google Scholar] [CrossRef]
- Costanzo, M.; de Giglio, M.A.R.; Roviello, G.N. Anti-Coronavirus Vaccines: Past Investigations on SARS-CoV-1 and MERS-CoV, the Approved Vaccines from BioNTech/Pfizer, Moderna, Oxford/AstraZeneca and others under Development Against SARSCoV-2 Infection. Curr. Med. Chem. 2022, 29, 4–18. [Google Scholar] [CrossRef]
- Kupferschmidt, K.; Wadman, M. Delta Variant Triggers New Phase in the Pandemic; American Association for the Advancement of Science: Washington, DC, USA, 2021. [Google Scholar]
- Mohapatra, R.K.; Pintilie, L.; Kandi, V.; Sarangi, A.K.; Das, D.; Sahu, R.; Perekhoda, L. The recent challenges of highly contagious COVID-19, causing respiratory infections: Symptoms, diagnosis, transmission, possible vaccines, animal models, and immunotherapy. Chem. Biol. Drug Des. 2020, 96, 1187–1208. [Google Scholar] [CrossRef]
- Xie, Z. Pay attention to SARS-CoV-2 infection in children. Pediatr. Investig. 2020, 4, 1. [Google Scholar] [CrossRef]
- Dawson, P.; Rabold, E.M.; Laws, R.L.; Conners, E.E.; Gharpure, R.; Yin, S.; Buono, S.A.; Dasu, T.; Bhattacharyya, S.; Westergaard, R.P.; et al. Loss of taste and smell as distinguishing symptoms of coronavirus disease 2019. Clin. Infect. Dis. 2021, 72, 682–685. [Google Scholar] [CrossRef] [PubMed]
- WHO. WHO Coronavirus (COVID-19) Dashboard. 5 August 2021. Available online: https://covid19.who.int/ (accessed on 6 August 2021).
- Ai, T.; Yang, Z.; Hou, H.; Zhan, C.; Chen, C.; Lv, W.; Tao, Q.; Sun, Z.; Xia, L. Correlation of chest CT and RT-PCR testing for coronavirus disease 2019 (COVID-19) in China: A report of 1014 cases. Radiology 2020, 296, E32–E40. [Google Scholar] [CrossRef] [PubMed]
- Wang, W.; Xu, Y.; Gao, R.; Lu, R.; Han, K.; Wu, G.; Tan, W. Detection of SARS-CoV-2 in different types of clinical specimens. Jama 2020, 323, 1843–1844. [Google Scholar] [CrossRef] [PubMed]
- Yang, T.; Wang, Y.C.; Shen, C.F.; Cheng, C.M. Point-of-care RNA-based diagnostic device for COVID-19. Diagnostics 2020, 10, 165. [Google Scholar] [CrossRef]
- Wang, D.; Hu, B.; Hu, C.; Zhu, F.; Liu, X.; Zhang, J.; Wang, B.; Xiang, H.; Cheng, Z.; Xiong, Y.; et al. Clinical characteristics of 138 hospitalized patients with 2019 novel coronavirus–infected pneumonia in Wuhan, China. JAMA 2020, 323, 1061–1069. [Google Scholar] [CrossRef]
- Fang, Y.; Zhang, H.; Xie, J.; Lin, M.; Ying, L.; Pang, P.; Ji, W. Sensitivity of chest CT for COVID-19: Comparison to RT-PCR. Radiology 2020, 296, E115–E117. [Google Scholar] [CrossRef]
- Antin, B.; Kravitz, J.; Martayan, E. Detecting Pneumonia in Chest X-rays with Supervised Learning. Semanticscholar.org. 2017. Available online: http://cs229.stanford.edu/proj2017/final-reports/5231221.pdf (accessed on 5 August 2022).
- Jaiswal, A.K.; Tiwari, P.; Kumar, S.; Gupta, D.; Khanna, A.; Rodrigues, J.J. Identifying pneumonia in chest X-rays: A deep learning approach. Measurement 2019, 145, 511–518. [Google Scholar] [CrossRef]
- Ali, J.; Ali, Q.; Hafeez, M.M.; Malik, A. Clinical features, diagnosis and treatment of COVID-19. Biol. Clin. Sci. Res. J. 2020, 2020, e031. [Google Scholar] [CrossRef]
- Tsikala Vafea, M.; Atalla, E.; Georgakas, J.; Shehadeh, F.; Mylona, E.K.; Kalligeros, M.; Mylonakis, E. Emerging technologies for use in the study, diagnosis, and treatment of patients with COVID-19. Cell. Mol. Bioeng. 2020, 13, 249–257. [Google Scholar] [CrossRef]
- Narin, A.; Kaya, C.; Pamuk, Z. Automatic detection of coronavirus disease (COVID-19) using X-ray images and deep convolutional neural networks. Pattern Anal. Appl. 2021, 24, 1207–1220. [Google Scholar] [CrossRef]
- Wang, S.; Kang, B.; Ma, J.; Zeng, X.; Xiao, M.; Guo, J.; Cai, M.; Yang, J.; Li, Y.; Meng, X.; et al. A deep learning algorithm using CT images to screen for Corona Virus Disease (COVID-19). Eur. Radiol. 2021, 31, 6096–6104. [Google Scholar] [CrossRef] [PubMed]
- Shan, F.; Gao, Y.; Wang, J.; Shi, W.; Shi, N.; Han, M.; Xue, Z.; Shen, D.; Shi, Y. Lung infection quantification of COVID-19 in CT images with deep learning. arXiv 2020, arXiv:2003.04655. [Google Scholar]
- Sethy, P.K.; Behera, S.K. Detection of coronavirus disease (COVID-19) based on deep features. Preprints 2020, 2020030300. [Google Scholar] [CrossRef]
- Alakus, T.B.; Turkoglu, I. Comparison of deep learning approaches to predict COVID-19 infection. Chaos Solitons Fractals 2020, 140, 110120. [Google Scholar] [CrossRef] [PubMed]
- Apostolopoulos, I.D.; Mpesiana, T.A. COVID-19: Automatic detection from X-ray images utilizing transfer learning with convolutional neural networks. Phys. Eng. Sci. Med. 2020, 43, 635–640. [Google Scholar] [CrossRef]
- Amyar, A.; Modzelewski, R.; Li, H.; Ruan, S. Multi-task deep learning based CT imaging analysis for COVID-19 pneumonia: Classification and segmentation. Comput. Biol. Med. 2020, 126, 104037. [Google Scholar] [CrossRef]
- Jain, G.; Mittal, D.; Thakur, D.; Mittal, M.K. A deep learning approach to detect COVID-19 coronavirus with X-ray images. Biocybern. Biomed. Eng. 2020, 40, 1391–1405. [Google Scholar] [CrossRef]
- Ali, S.; Hussain, A.; Aich, S.; Park, M.S.; Chung, M.P.; Jeong, S.H.; Song, J.W.; Lee, J.H.; Kim, H.C. A Soft Voting Ensemble-Based Model for the Early Prediction of Idiopathic Pulmonary Fibrosis (IPF) Disease Severity in Lungs Disease Patients. Life 2021, 11, 1092. [Google Scholar] [CrossRef]
- Hussain, A.; Choi, H.E.; Kim, H.J.; Aich, S.; Saqlain, M.; Kim, H.C. Forecast the Exacerbation in Patients of Chronic Obstructive Pulmonary Disease with Clinical Indicators Using Machine Learning Techniques. Diagnostics 2021, 11, 829. [Google Scholar] [CrossRef]
- Jafar, A.; Hameed, M.T.; Akram, N.; Waqas, U.; Kim, H.S.; Naqvi, R.A. CardioNet: Automatic Semantic Segmentation to Calculate the Cardiothoracic Ratio for Cardiomegaly and Other Chest Diseases. J. Pers. Med. 2022, 12, 988. [Google Scholar] [CrossRef]
- Sharif, S.M.; Naqvi, R.A.; Biswas, M.; Loh, W.K. Deep Perceptual Enhancement for Medical Image Analysis. IEEE J. Biomed. Health Inform. 2022, 26, 4826–4836. [Google Scholar] [CrossRef] [PubMed]
- Naqvi, R.A.; Hussain, D.; Loh, W.K. Artificial intelligence-based semantic segmentation of ocular regions for biometrics and healthcare applications. CMC-Comput. Mater. Contin. 2021, 66, 715–732. [Google Scholar] [CrossRef]
- Siddhartha, M.; Santra, A. COVIDLite: A depth-wise separable deep neural network with white balance and CLAHE for detection of COVID-19. arXiv 2020, arXiv:2006.13873. [Google Scholar]
- Yang, G.; Ye, Q.; Xia, J. Unbox the black-box for the medical explainable ai via multi-modal and multi-centre data fusion: A mini-review, two showcases and beyond. Inf. Fusion 2022, 77, 29–52. [Google Scholar] [CrossRef] [PubMed]
- Tsiknakis, N.; Trivizakis, E.; Vassalou, E.E.; Papadakis, G.Z.; Spandidos, D.A.; Tsatsakis, A.; Sánchez-García, J.; López-González, R.; Papanikolaou, N.; Karantanas, A.H.; et al. Interpretable artificial intelligence framework for COVID-19 screening on chest X-rays. Exp. Ther. Med. 2020, 20, 727–735. [Google Scholar] [CrossRef] [PubMed]
- Selvaraju, R.R.; Cogswell, M.; Das, A.; Vedantam, R.; Parikh, D.; Batra, D. Grad-cam: Visual explanations from deep networks via gradient-based localization. In Proceedings of the IEEE International Conference on Computer Vision, Venice, Italy, 22–29 October 2017. [Google Scholar]
- Aslan, M.F.; Sabanci, K.; Durdu, A.; Unlersen, M.F. COVID-19 diagnosis using state-of-the-art CNN architecture features and Bayesian Optimization. Comput. Biol. Med. 2022, 142, 105244. [Google Scholar] [CrossRef]
- Tiwari, S.; Jain, A. A lightweight capsule network architecture for detection of COVID-19 from lung CT scans. Int. J. Imaging Syst. Technol. 2022, 32, 419–434. [Google Scholar] [CrossRef]
- Wang, L.; Lin, Z.Q.; Wong, A. Covid-net: A tailored deep convolutional neural network design for detection of COVID-19 cases from chest X-ray images. Sci. Rep. 2020, 10, 1–12. [Google Scholar] [CrossRef]
- Oh, Y.; Park, S.; Ye, J.C. Deep learning COVID-19 features on CXR using limited training data sets. IEEE Trans. Med. Imaging 2020, 39, 2688–2700. [Google Scholar] [CrossRef]
- Li, X.; Li, C.; Zhu, D. Covid-mobilexpert: On-device COVID-19 screening using snapshots of chest X-ray. arXiv 2020, arXiv:2004.03042. [Google Scholar]
- Alves, M.A.; Castro, G.Z.; Oliveira, B.A.; Ferreira, L.A.; Ramírez, J.A.; Silva, R.; Guimarães, F.G. Explaining machine learning based diagnosis of COVID-19 from routine blood tests with decision trees and criteria graphs. Comput. Biol. Med. 2021, 132, 104335. [Google Scholar] [CrossRef] [PubMed]
- Banerjee, A.; Ray, S.; Vorselaars, B.; Kitson, J.; Mamalakis, M.; Weeks, S.; Baker, M.; Mackenzie, L.S. Use of machine learning and artificial intelligence to predict SARS-CoV-2 infection from full blood counts in a population. Int. Immunopharmacol. 2020, 86, 106705. [Google Scholar] [CrossRef] [PubMed]
- Abbas, A.; Abdelsamea, M.M.; Gaber, M.M. Classification of COVID-19 in chest X-ray images using DeTraC deep convolutional neural network. Appl. Intell. 2021, 51, 854–864. [Google Scholar] [CrossRef] [PubMed]
- de Freitas Barbosa, V.A.; Gomes, J.C.; de Santana, M.A.; Albuquerque, J.E.; de Souza, R.G.; de Souza, R.E.; dos Santos, W.P. Heg. IA: An intelligent system to support diagnosis of COVID-19 based on blood tests. Res. Biomed. Eng. 2022, 38, 99–116. [Google Scholar] [CrossRef]
- BIMCV. BIMCV-COVID19, Datasets Related to COVID19’s Pathology. 2021. Available online: https://bimcv.cipf.es/bimcv-projects/bimcv-covid19/#1590858128006-9e640421-6711 (accessed on 13 August 2021).
- COVID-19-Image-Repository. 2021. Available online: https://github.com/ml-workgroup/COVID-19-image-repository/tree/master/png (accessed on 5 August 2021).
- RSNA. Pneumonia Detection Challenge. Available online: https://www.kaggle.com/c/rsna-pneumonia-detection-challenge/data (accessed on 5 August 2021).
- Kaggle. Paultimothymooney. Available online: https://www.kaggle.com/paultimothymooney/chest-xray-pneumonia (accessed on 5 August 2021).
- Juntu, J.; Sijbers, J.; Dyck, D.V.; Gielen, J. Bias Field Correction for MRI Images, in Computer Recognition Systems; Springer: Berlin/Heidelberg, Germany, 2005; pp. 543–551. [Google Scholar]
- Li, C.; Gore, J.C.; Davatzikos, C. Multiplicative intrinsic component optimization (MICO) for MRI bias field estimation and tissue segmentation. Magn. Reson. Imaging 2014, 32, 913–923. [Google Scholar] [CrossRef]
- Ahmed, M.N.; Yamany, S.M.; Mohamed, N.; Farag, A.A.; Moriarty, T. A modified fuzzy c-means algorithm for bias field estimation and segmentation of MRI data. IEEE Trans. Med. Imaging 2002, 21, 193–199. [Google Scholar] [CrossRef]
- Ketkar, N. Introduction to Keras. Deep learning with Python; Apress: Berkeley, CA, USA, 2017; pp. 97–111. [Google Scholar]
- Zhang, Z. Improved adam optimizer for deep neural networks. In Proceedings of the 2018 IEEE/ACM 26th International Symposium on Quality of Service (IWQoS), Banff, AB, Canada, 4–6 June 2018. [Google Scholar]
- Iandola, F.; Moskewicz, M.; Karayev, S.; Girshick, R.; Darrell, T.; Keutzer, K. Densenet: Implementing efficient convnet descriptor pyramids. arXiv 2014, arXiv:1404.1869. [Google Scholar]
- Iandola, F.N.; Han, S.; Moskewicz, M.W.; Ashraf, K.; Dally, W.J.; Keutzer, K. SqueezeNet: AlexNet-level accuracy with 50x fewer parameters and <0.5 MB model size. arXiv 2016, arXiv:1602.07360. [Google Scholar]
- Panwar, H.; Gupta, P.K.; Siddiqui, M.K.; Morales-Menendez, R.; Bhardwaj, P.; Singh, V. A deep learning and grad-CAM based color visualization approach for fast detection of COVID-19 cases using chest X-ray and CT-Scan images. Chaos Solitons Fractals 2020, 140, 110190. [Google Scholar] [CrossRef]
- Magesh, P.R.; Myloth, R.D.; Tom, R.J. An explainable machine learning model for early detection of Parkinson’s disease using LIME on DaTSCAN imagery. Comput. Biol. Med. 2020, 126, 104041. [Google Scholar] [CrossRef]


| Authors | Technique Used | Accuracy |
|---|---|---|
| L Wang et al. [43] | COVID-NET | 93.3% |
| Y Oh et al. [44] | Patch-based CNN | 93.3% |
| X Li et al. [45] | COVID-MobileXpert | 93.5% |
| MA Alves et al. [46] | Decision Tree explainer, RF | 88% |
| A Banerjee et al. [47] | RF, LR, GLMNET, ANN | 81–87% |
| A Abbas et al. [48] | Decompose, Transfer, and Compos | 95.12% |
| VA de Freitas Barbosa et al. [49] | XMLP, SVM, RT, RF, BN, NB | 95.159% |
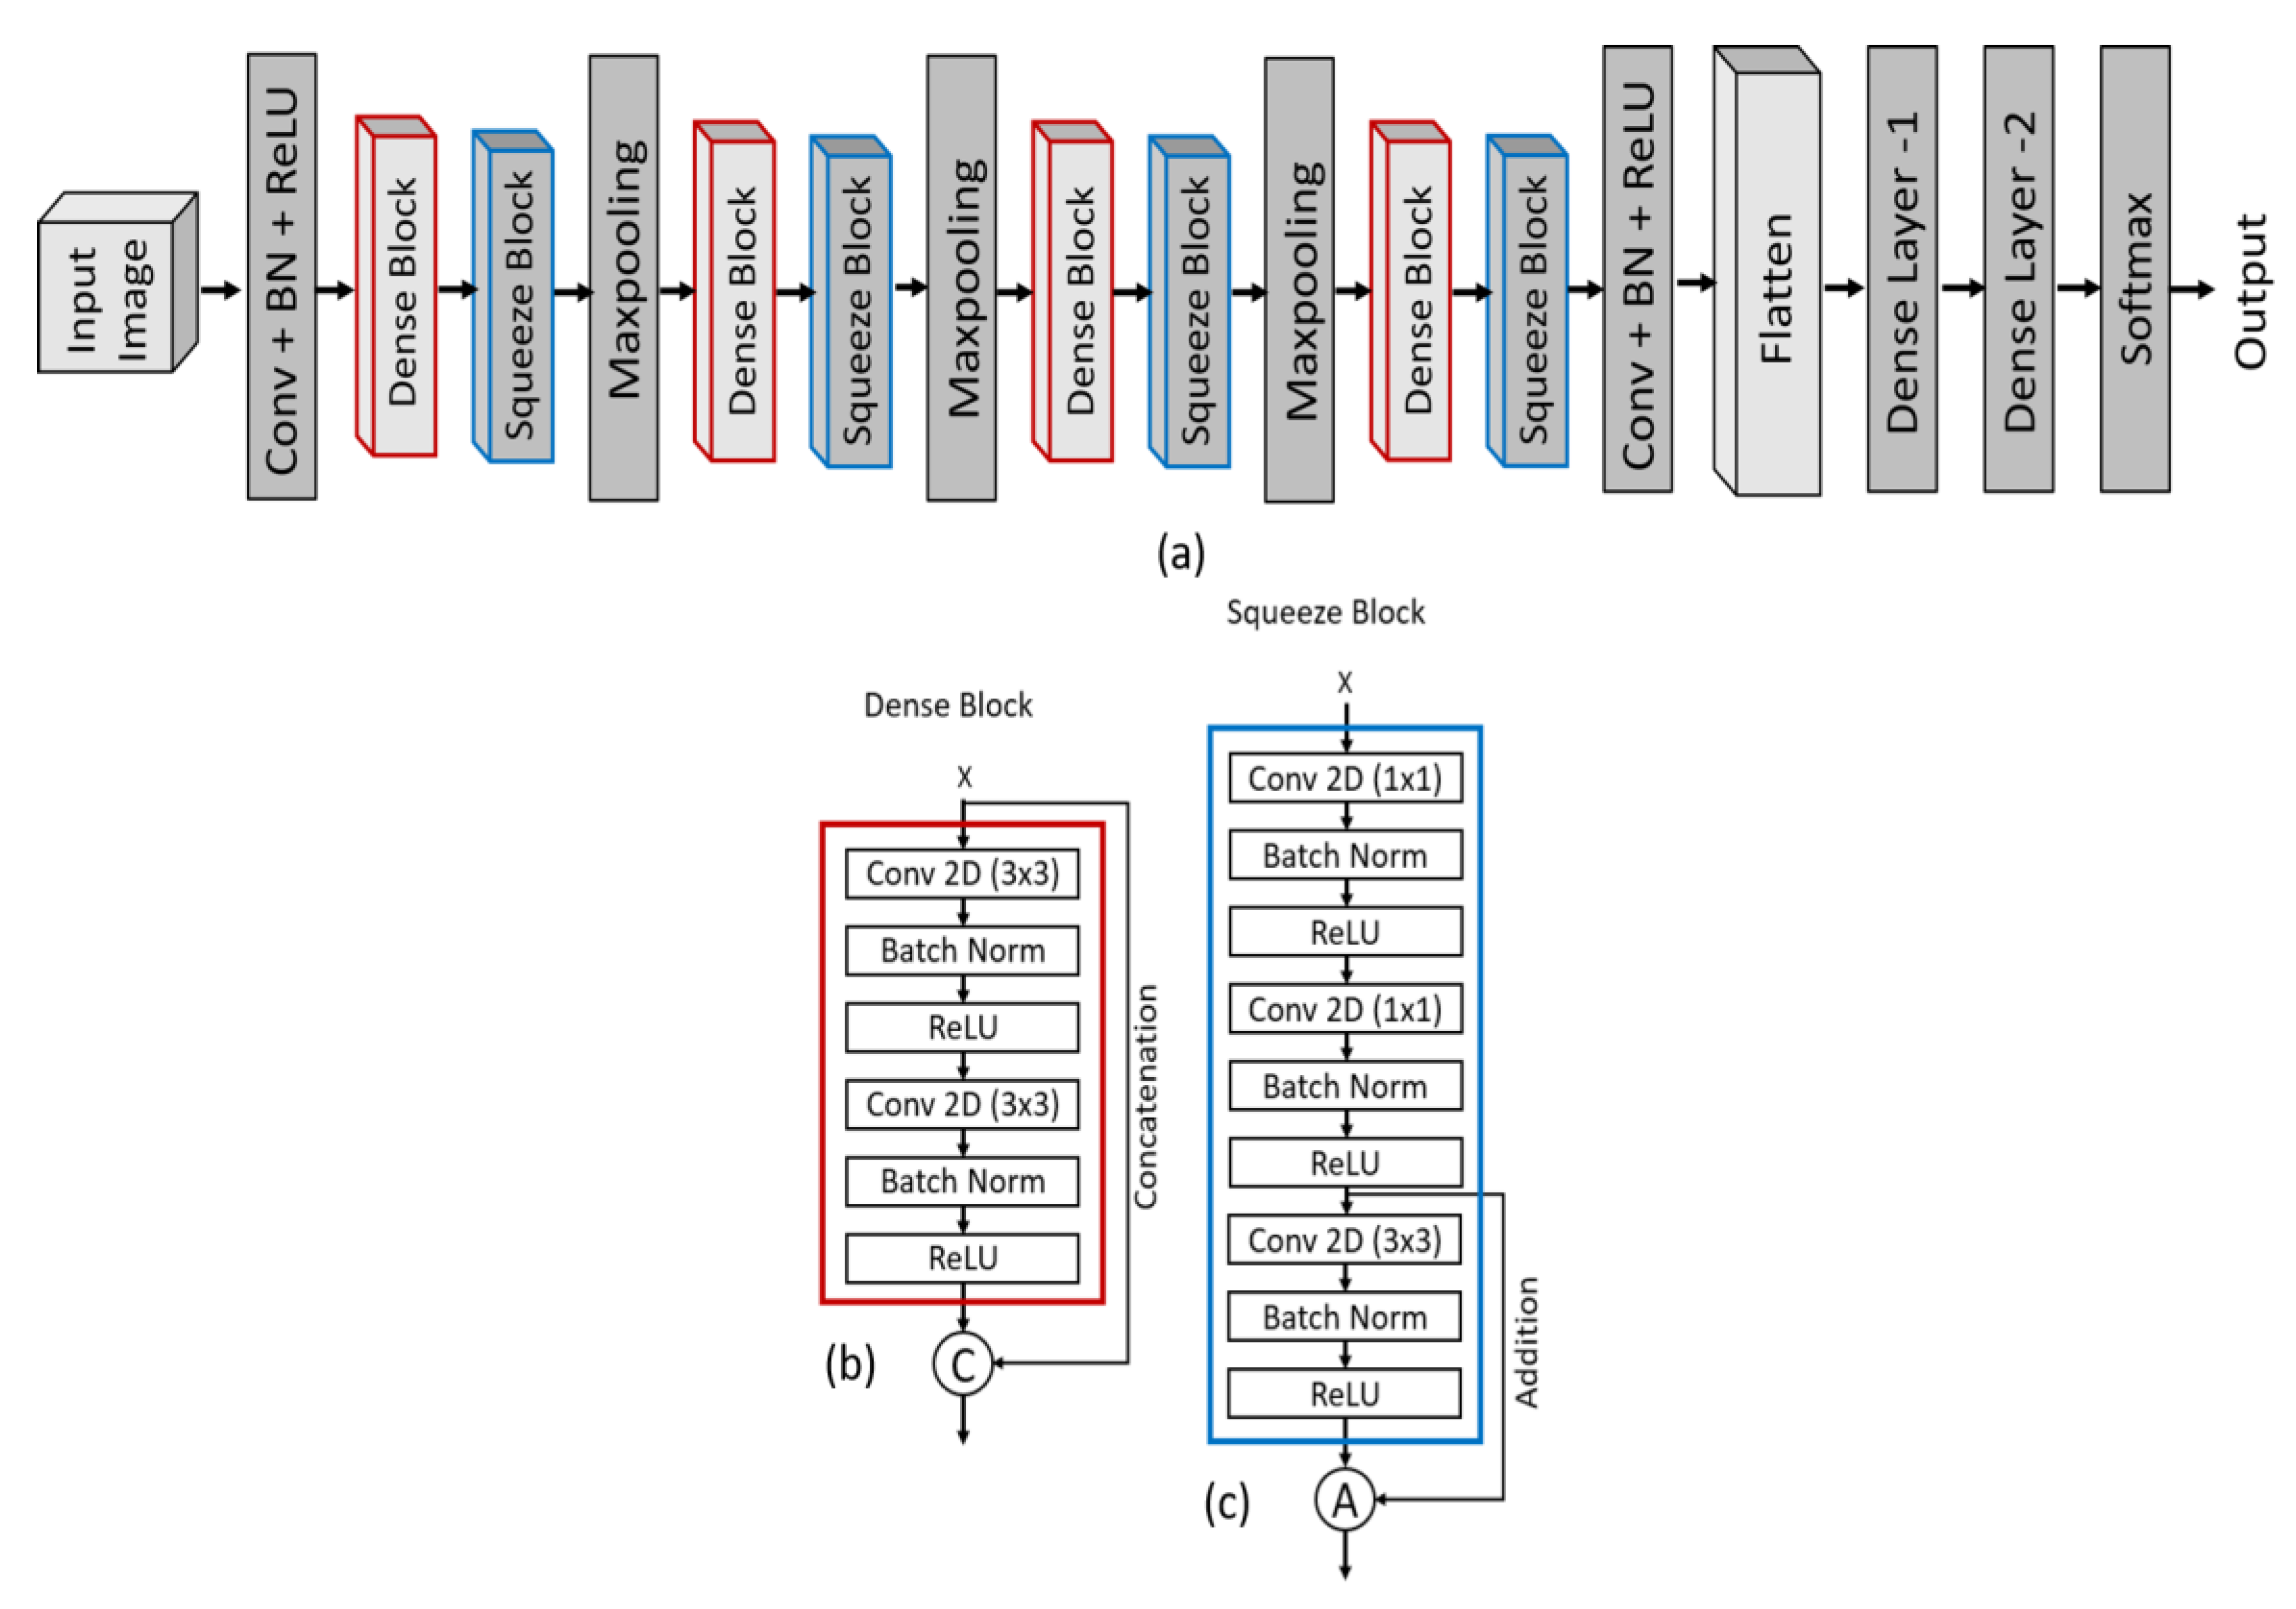
| Layers | Output Size | DCSCNN |
|---|---|---|
| Input | 256 × 256 | - |
| Convolution (1) | 128 × 128 | 5 × 5 conv, stride 2, filter 64 |
| Dense Block (1) | 128 × 128 | [3 × 3 conv] × 2, filter 128, 128 |
| Squeeze Block (1) | 128 × 128 | , filter 64, 128, 128 |
| Max Pooling (1) | 128 × 128 | 2 × 2, stride 2 |
| Dense Block (2) | 64 × 64 | [3 × 3 conv] × 2, filter 256, 512 |
| Squeeze Block (2) | 64 × 64 | , filter 128, 256, 256 |
| Max Pooling (2) | 32 × 32 | 2 × 2, stride 2 |
| Dense Block (3) | 32 × 32 | [3 × 3 conv] × 2, filter 512, 256 |
| Squeeze Block (3) | 32 × 32 | , filter 256, 512, 512 |
| Max Pooling (3) | 16 × 16 | 2 × 2, stride 2 |
| Dense Block (4) | 16 × 16 | [3 × 3 conv] × 2, filter 128, 128 |
| Squeeze Block (4) | 16 × 16 | , filter 64, 128, 128 |
| Convolution (2) | 16 × 16 | 1 × 1 conv, filter 64 |
| Classification Block | 16 × 16 | FC (32) |
| FC (16) | ||
| FC (2 & 4), SoftMax |
| Dataset | Accuracy (%) | Precision (%) | Recall (%) | F1-Score | K (%) |
|---|---|---|---|---|---|
| COVID-19 vs. Normal | 98.8 | 98.8 | 98.8 | 98.8 | 97.6 |
| COVID-19 vs. Lung Opacity | 98.2 | 98.2 | 98.3 | 98.3 | 96.4 |
| Normal vs. Lung Opacity | 97.2 | 97.2 | 97.3 | 97.3 | 94.4 |
| COVID-19 vs. Pneumonia | 96.4 | 96.4 | 96.6 | 96.5 | 92.8 |
| Lung Opacity vs. Pneumonia | 95.8 | 95.8 | 96.1 | 95.9 | 91.6 |
| Normal vs. Pneumonia | 97.4 | 97.4 | 97.5 | 97.4 | 94.8 |
| COVID-19 vs. Pneumonia vs. Lung Opacity vs.Normal | 94.7 | 94.7 | 94.8 | 94.8 | 92.8 |
Publisher’s Note: MDPI stays neutral with regard to jurisdictional claims in published maps and institutional affiliations. |
© 2022 by the authors. Licensee MDPI, Basel, Switzerland. This article is an open access article distributed under the terms and conditions of the Creative Commons Attribution (CC BY) license (https://creativecommons.org/licenses/by/4.0/).
Share and Cite
Ali, S.; Hussain, A.; Bhattacharjee, S.; Athar, A.; Abdullah; Kim, H.-C. Detection of COVID-19 in X-ray Images Using Densely Connected Squeeze Convolutional Neural Network (DCSCNN): Focusing on Interpretability and Explainability of the Black Box Model. Sensors 2022, 22, 9983. https://doi.org/10.3390/s22249983
Ali S, Hussain A, Bhattacharjee S, Athar A, Abdullah, Kim H-C. Detection of COVID-19 in X-ray Images Using Densely Connected Squeeze Convolutional Neural Network (DCSCNN): Focusing on Interpretability and Explainability of the Black Box Model. Sensors. 2022; 22(24):9983. https://doi.org/10.3390/s22249983
Chicago/Turabian StyleAli, Sikandar, Ali Hussain, Subrata Bhattacharjee, Ali Athar, Abdullah, and Hee-Cheol Kim. 2022. "Detection of COVID-19 in X-ray Images Using Densely Connected Squeeze Convolutional Neural Network (DCSCNN): Focusing on Interpretability and Explainability of the Black Box Model" Sensors 22, no. 24: 9983. https://doi.org/10.3390/s22249983
APA StyleAli, S., Hussain, A., Bhattacharjee, S., Athar, A., Abdullah, & Kim, H.-C. (2022). Detection of COVID-19 in X-ray Images Using Densely Connected Squeeze Convolutional Neural Network (DCSCNN): Focusing on Interpretability and Explainability of the Black Box Model. Sensors, 22(24), 9983. https://doi.org/10.3390/s22249983