
Fast Detection of Different Water Contaminants by Raman Spectroscopy and Surface-Enhanced Raman Spectroscopy


Abstract
1. Introduction
- (1)
- eutrophication of surface waters for agricultural and urban runoff and industrial sewage and waste;
- (2)
- air (and water) pollution as a result of incomplete combustion or pyrolysis of organic material;
- (3)
- Presence of microorganisms, in particular harmful bacteria such as the Enterobacteriaceae, Enterococcaceae, Streptococcaceae and Vibrionaceae families.
2. Materials and Methods
- (1)
- The eutrophication of surface waters due to agricultural and urban runoff and sewage and industrial waste. This can lead to harmful algal blooms due to the availability of nutrients such as nitrogen, phosphorus or sulfur [22,23]. Massive and prolonged algal bloom leads to hypoxia, resulting in aquatic life die-off or large pollution of water by microcystins. Contamination of drinking water sources requires a multiple-barrier approach in removing diverse contaminants, either natural and/or anthropogenic, which is often expensive;
- (2)
- (3)
- The presence of microorganisms, in particular harmful bacterial species like Entero-bacteriaceae, Enterococcaceae, Streptococcaceae, and Vibrionaceae families. The presence of pathogenic microorganisms in groundwater is important because, due to the recent prolonged periods of drought and the pressing demand for water for crops, the Food and Agriculture Organization of the United Nations (FAO) estimates that 70% of water consumption is designated to agriculture, so there is a general guideline to use wastewater for irrigation. Despite the fact that this approach would help to preserve the freshwater sources and recycle the nutrients present in wastewater, it would pose the problem of the presence of harmful pathogens on fruits and vegetables, causing severe diseases in humans [26];
- (4)
- The massive use of pesticides. They are nowadays widely used in agriculture to prevent or eliminate the action of insects on agricultural products [27,28]. However, some studies show that pesticides may have negative effects on consumers [29,30,31], so a fast detection of pesticide residues is of increasing importance because their intensive use and their persistence made them widespread in the environment, and some traces have also been revealed in the aquifers destined for human consumption.
3. Results and Discussion
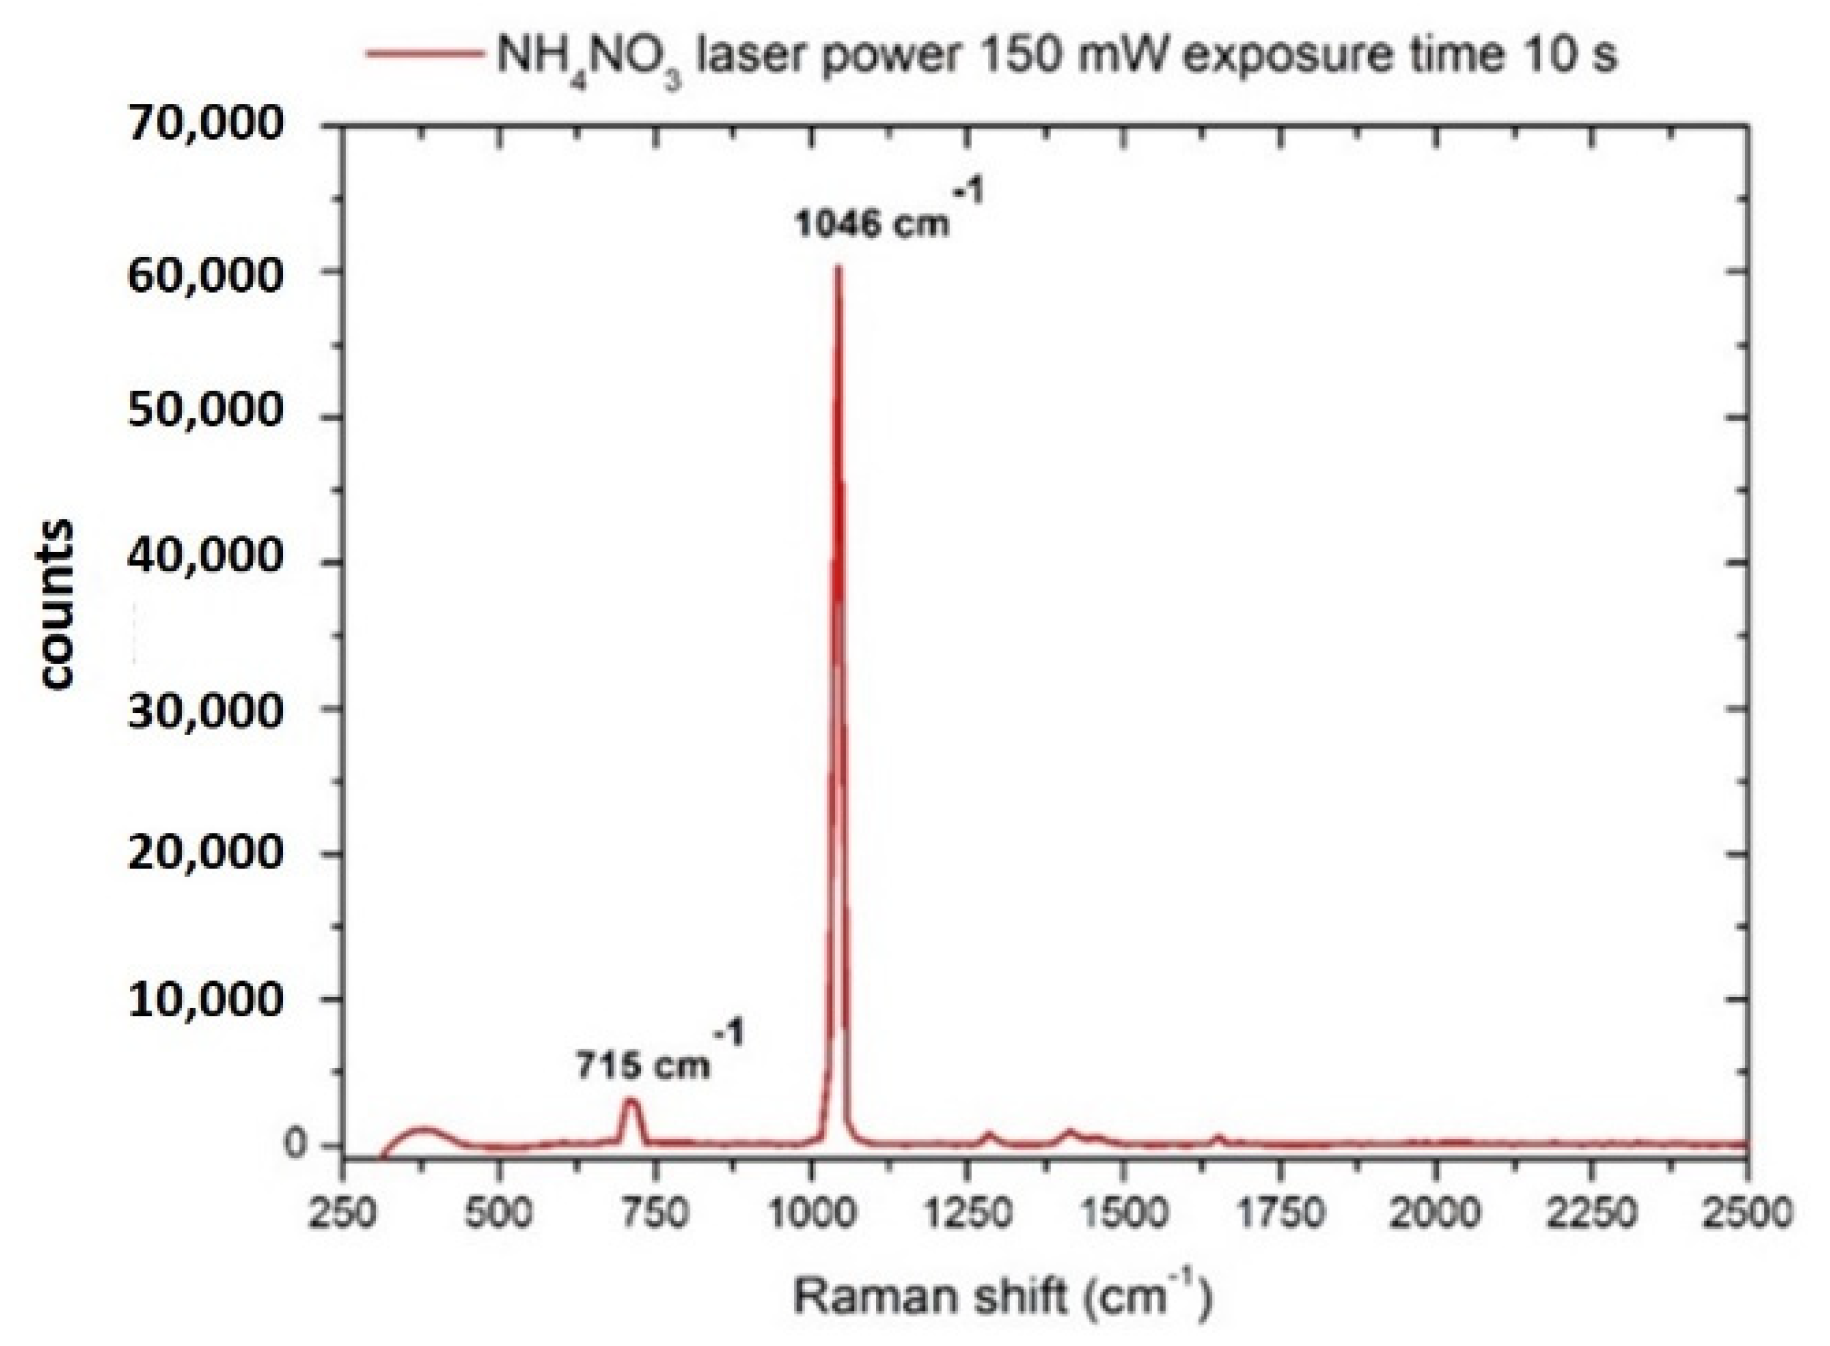
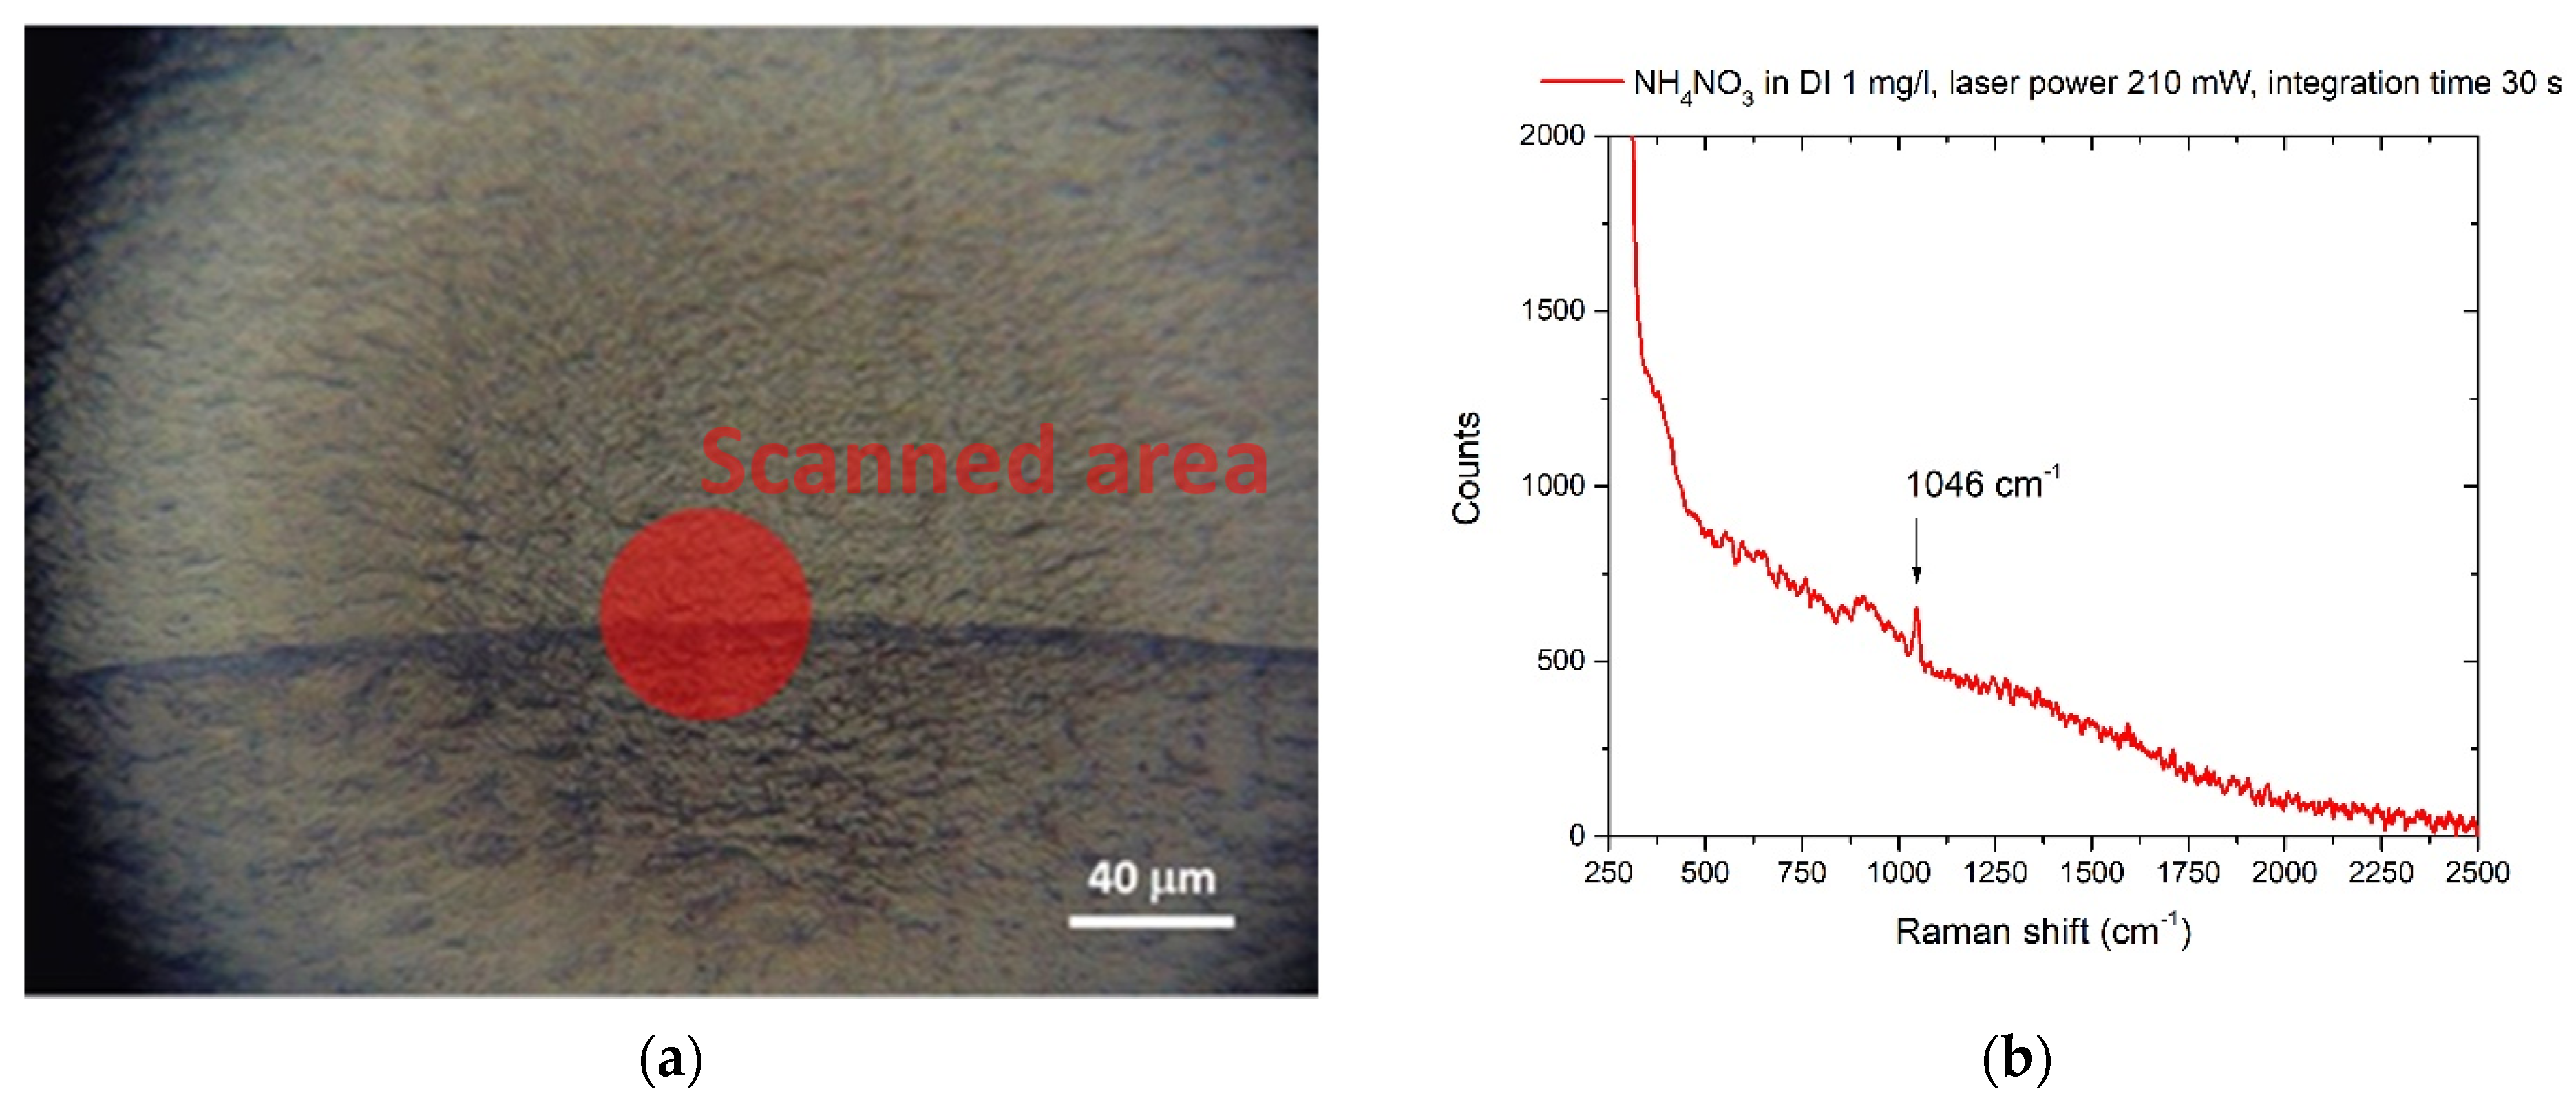
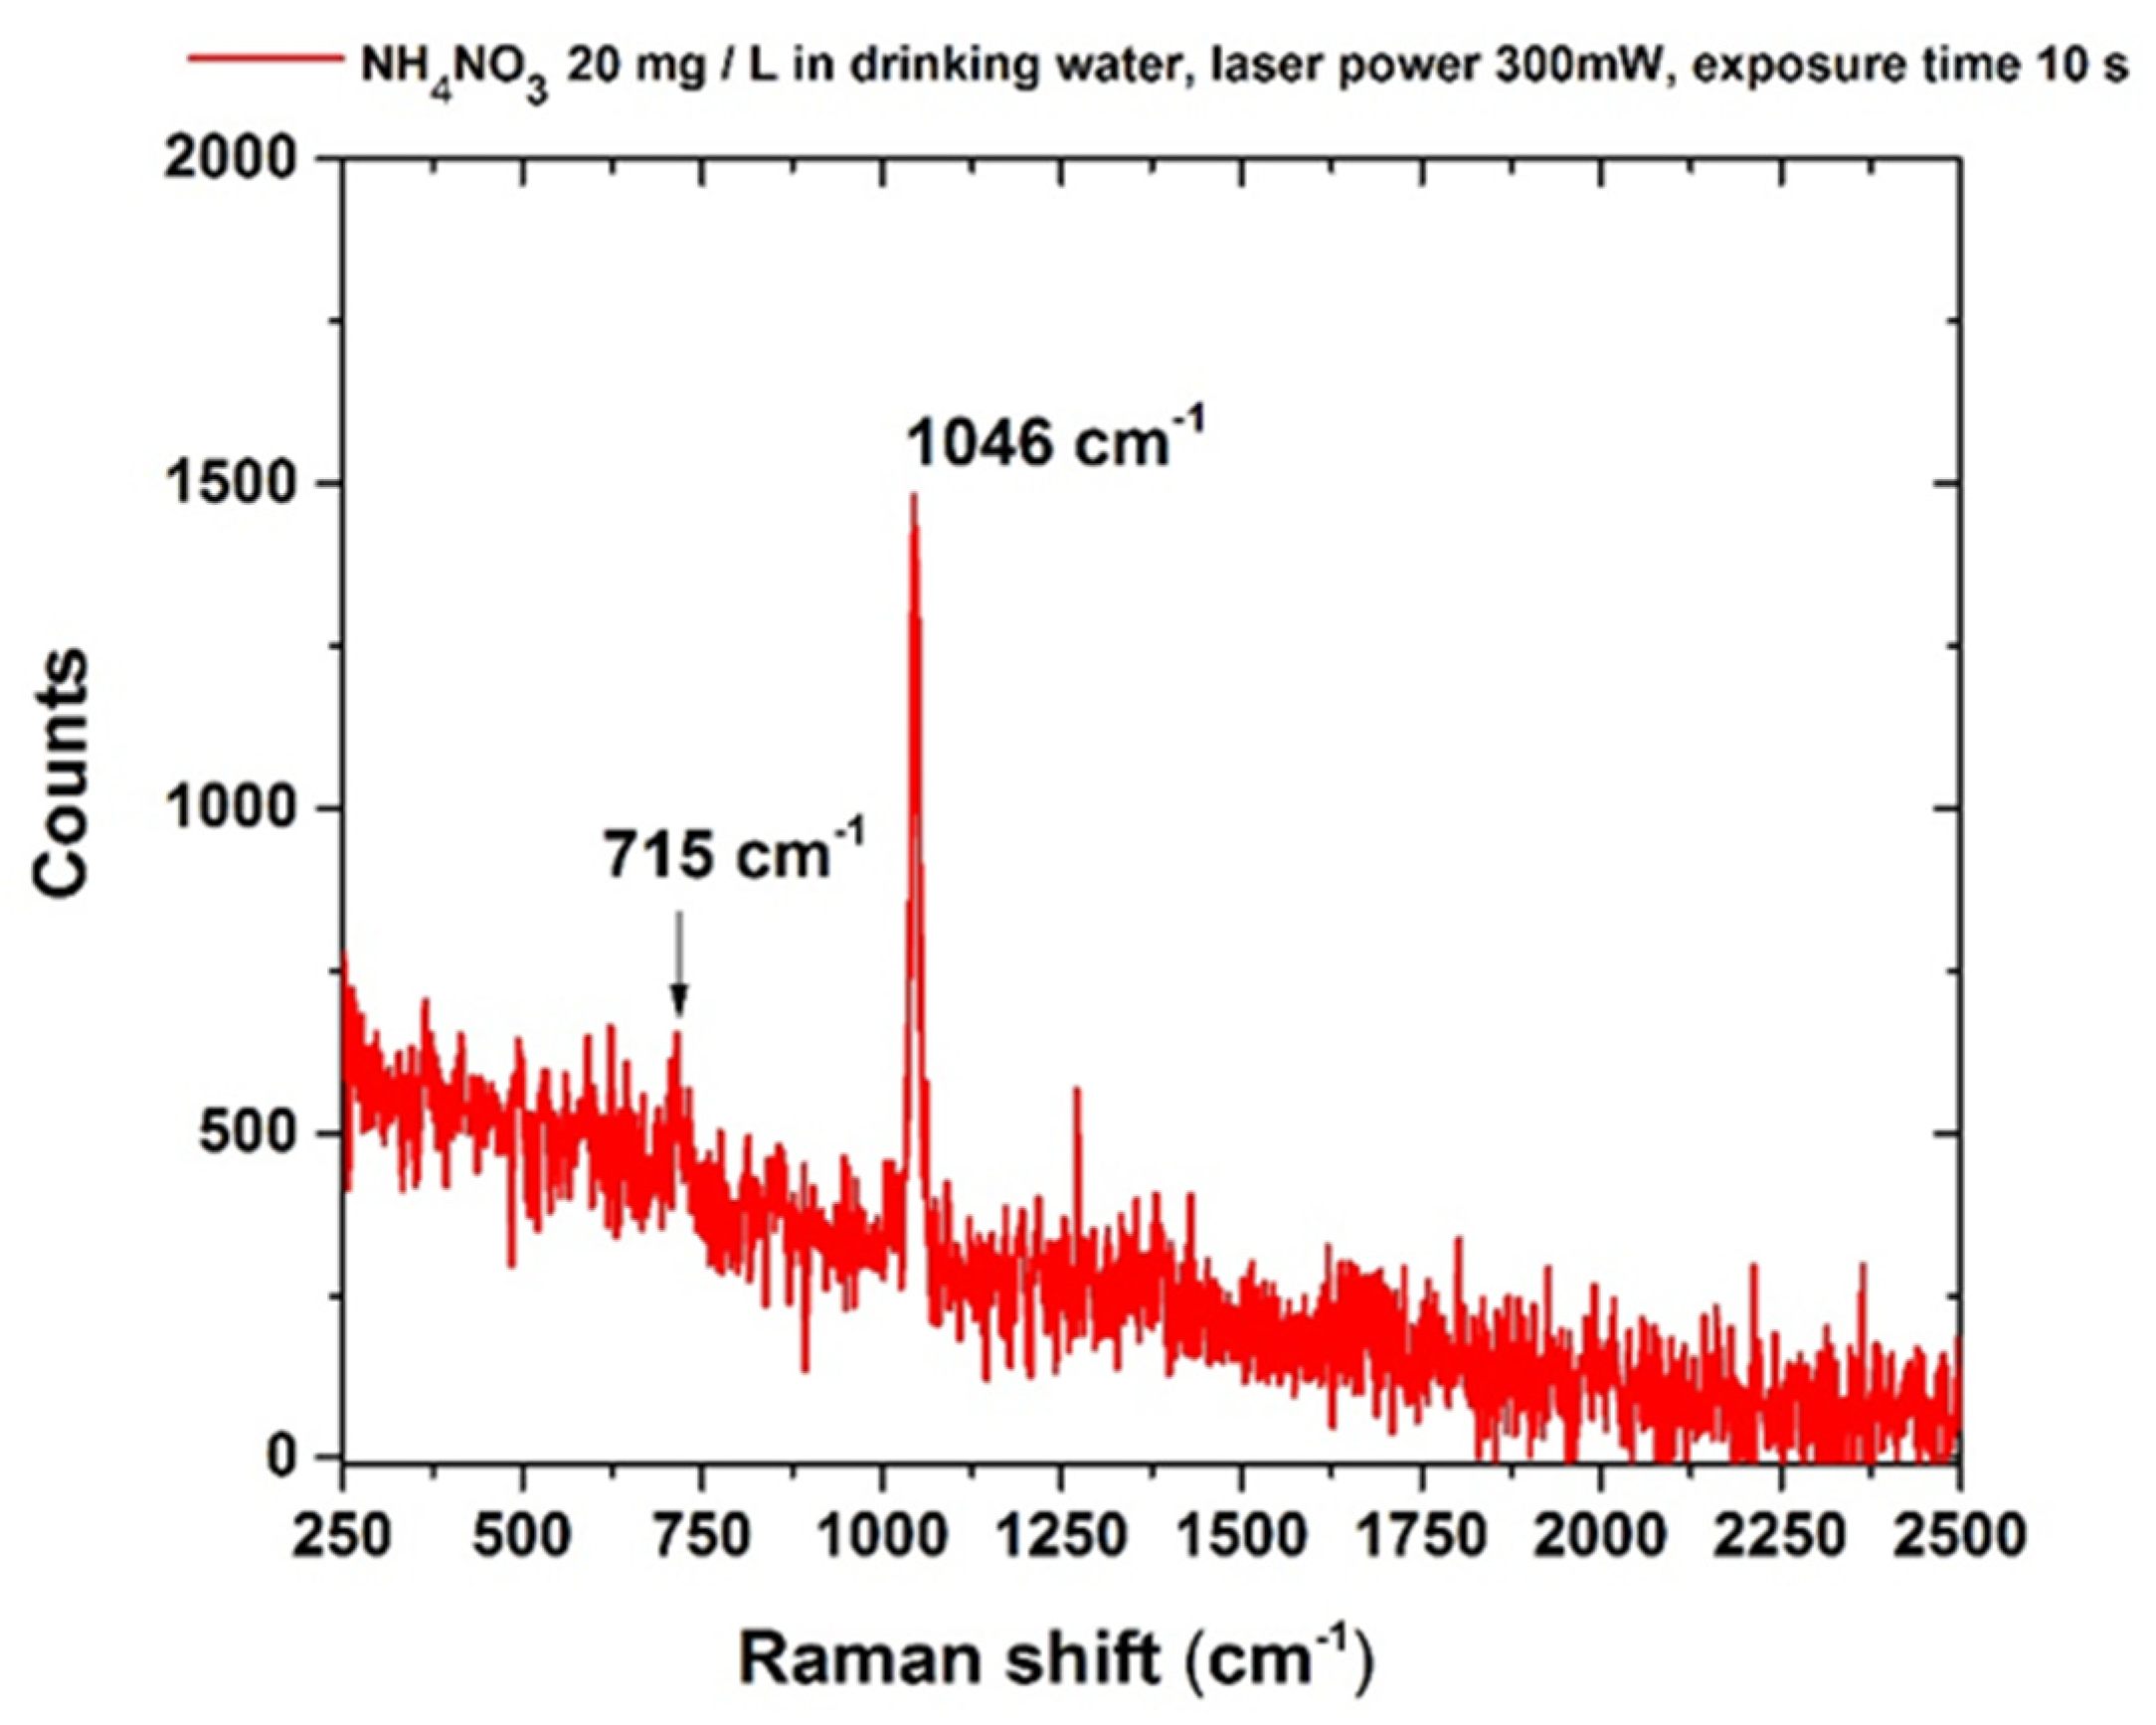
3.1. Nitrates
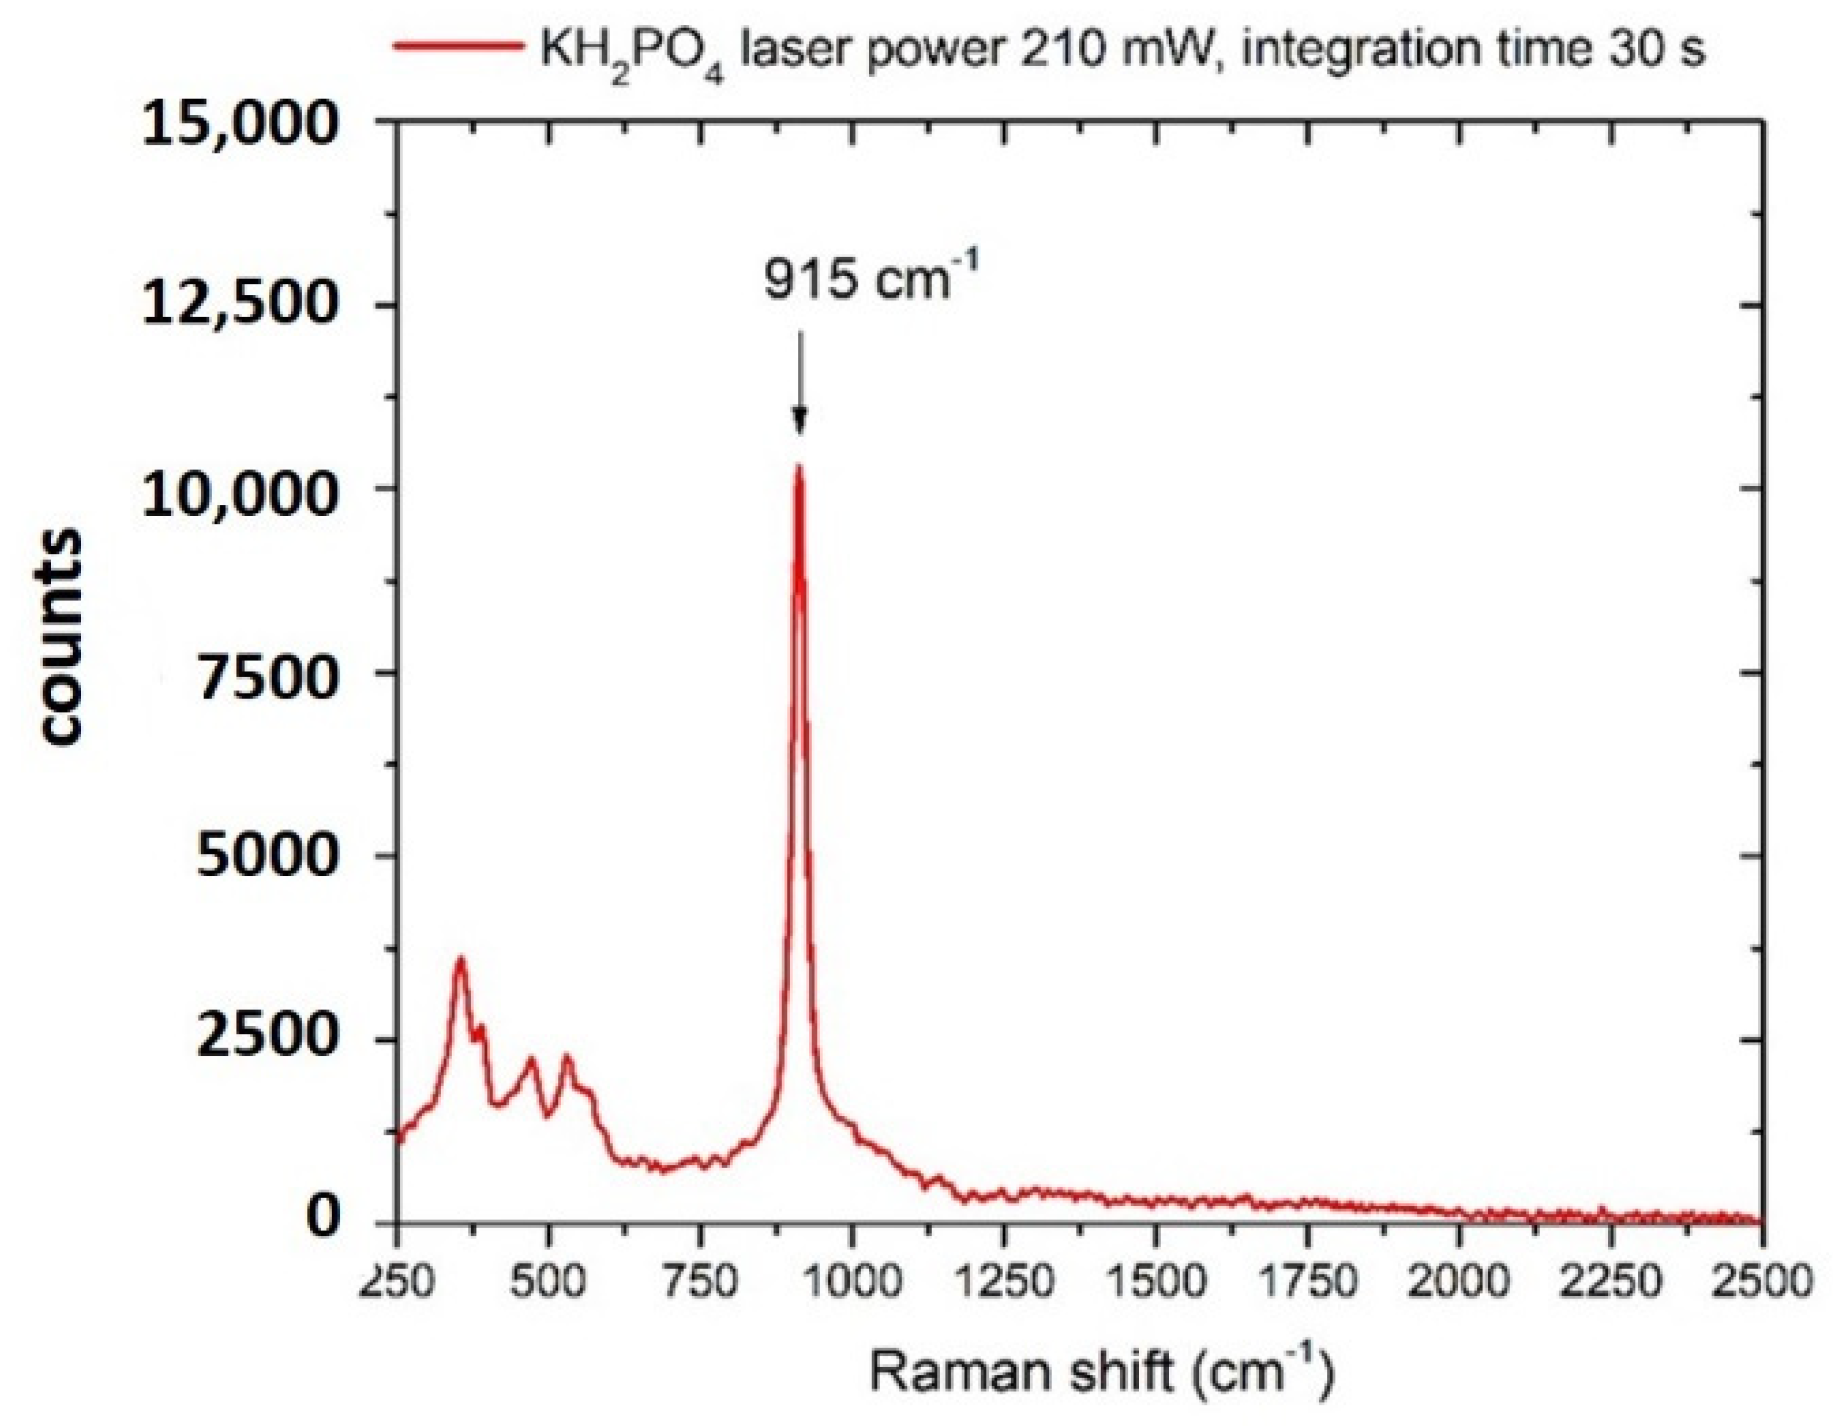
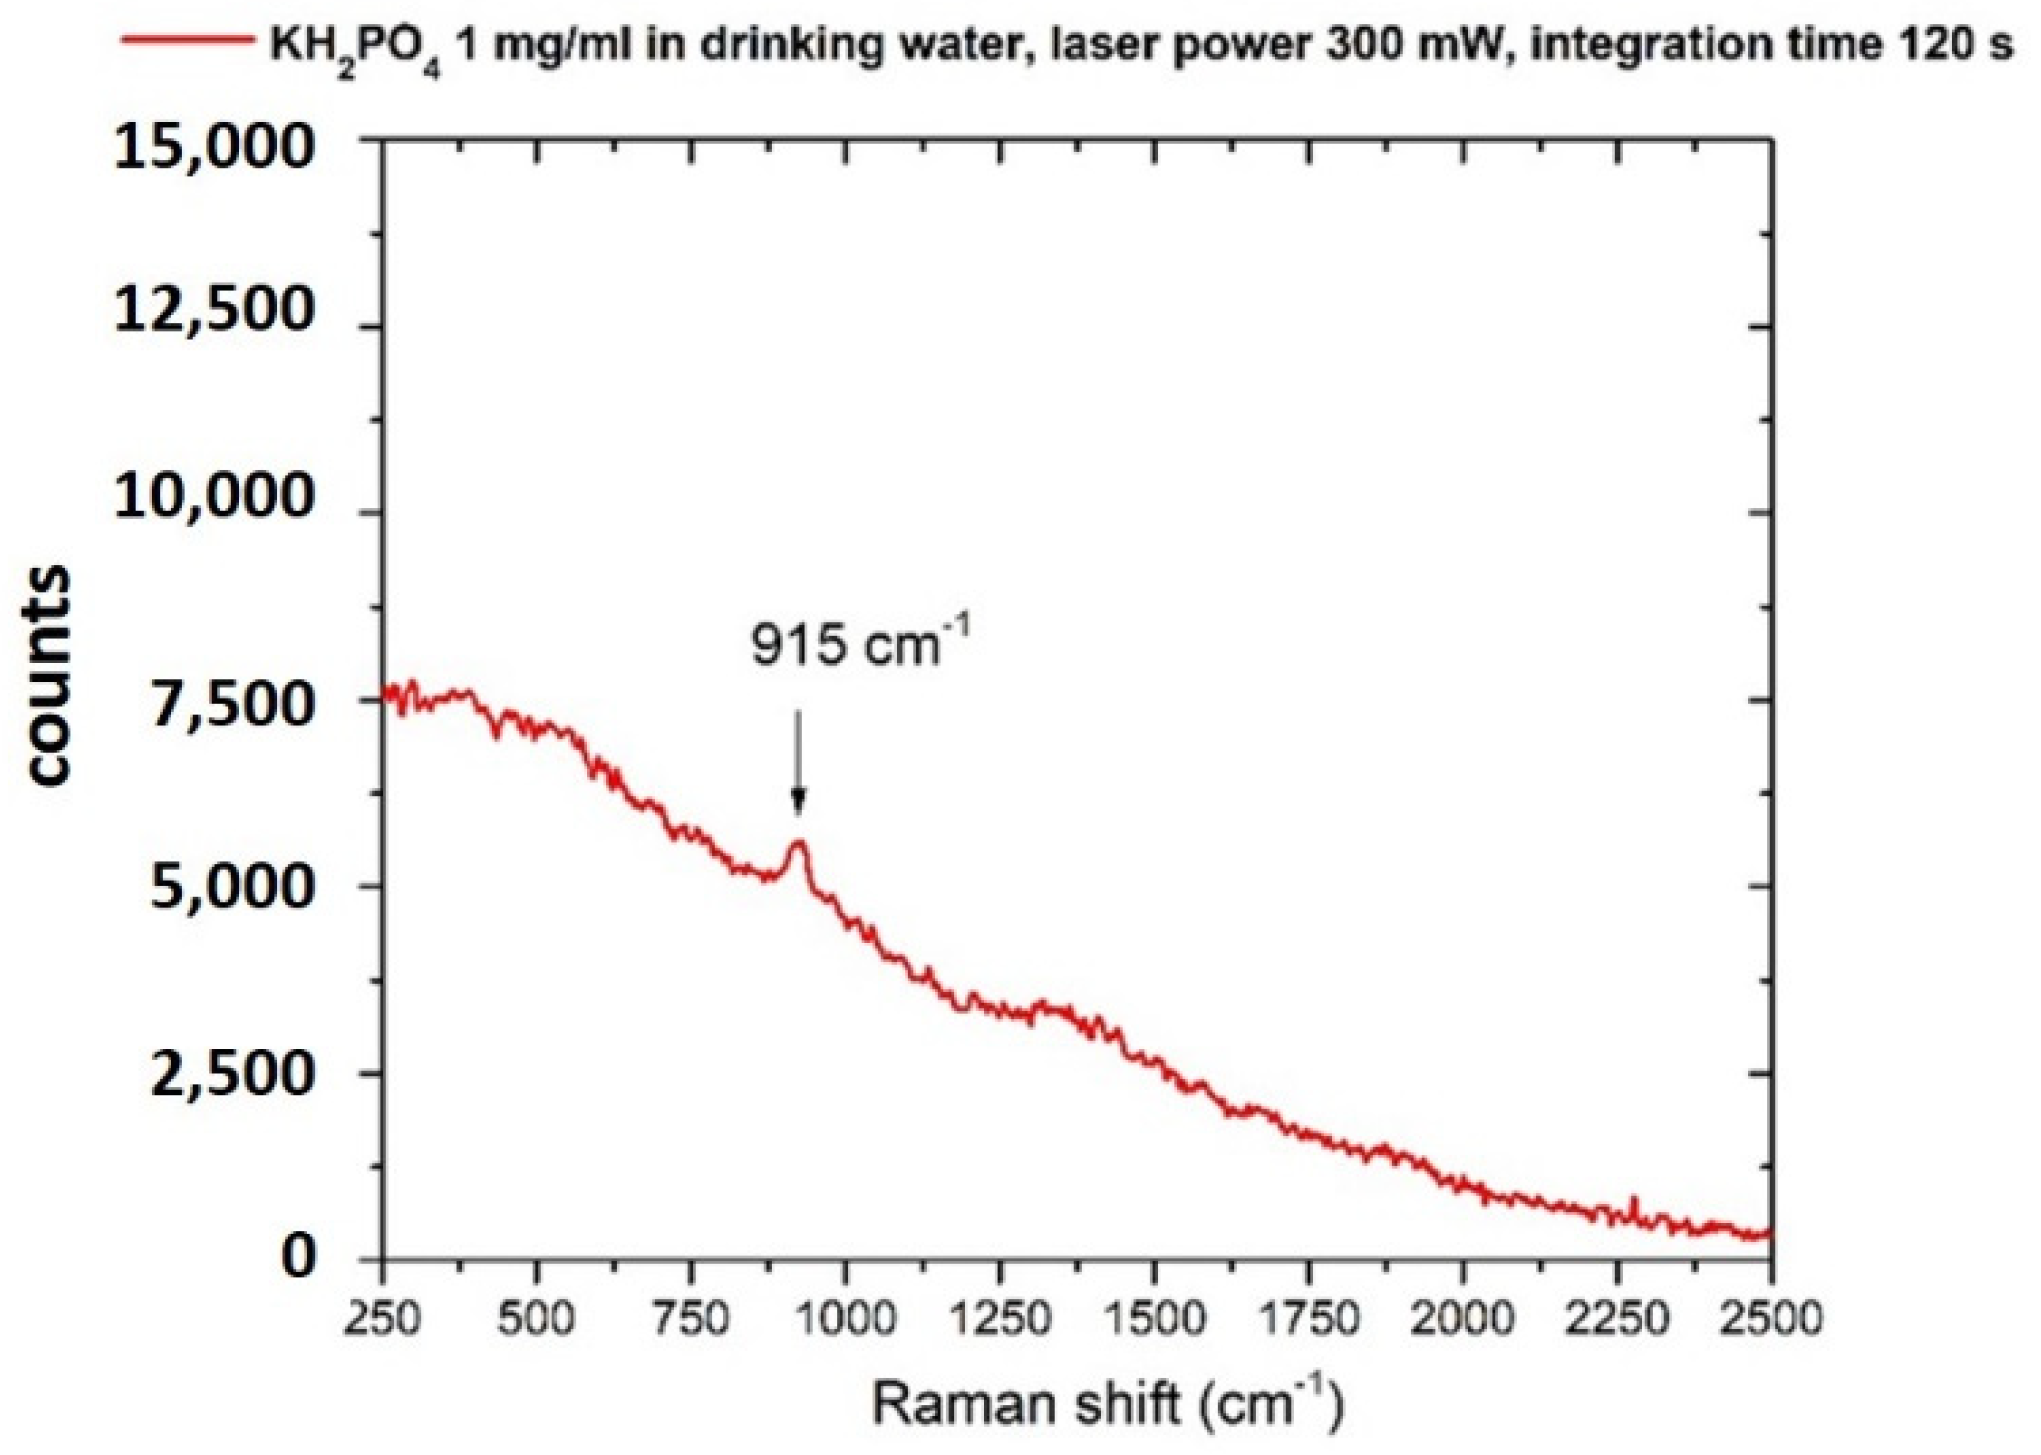
3.2. Phosphates
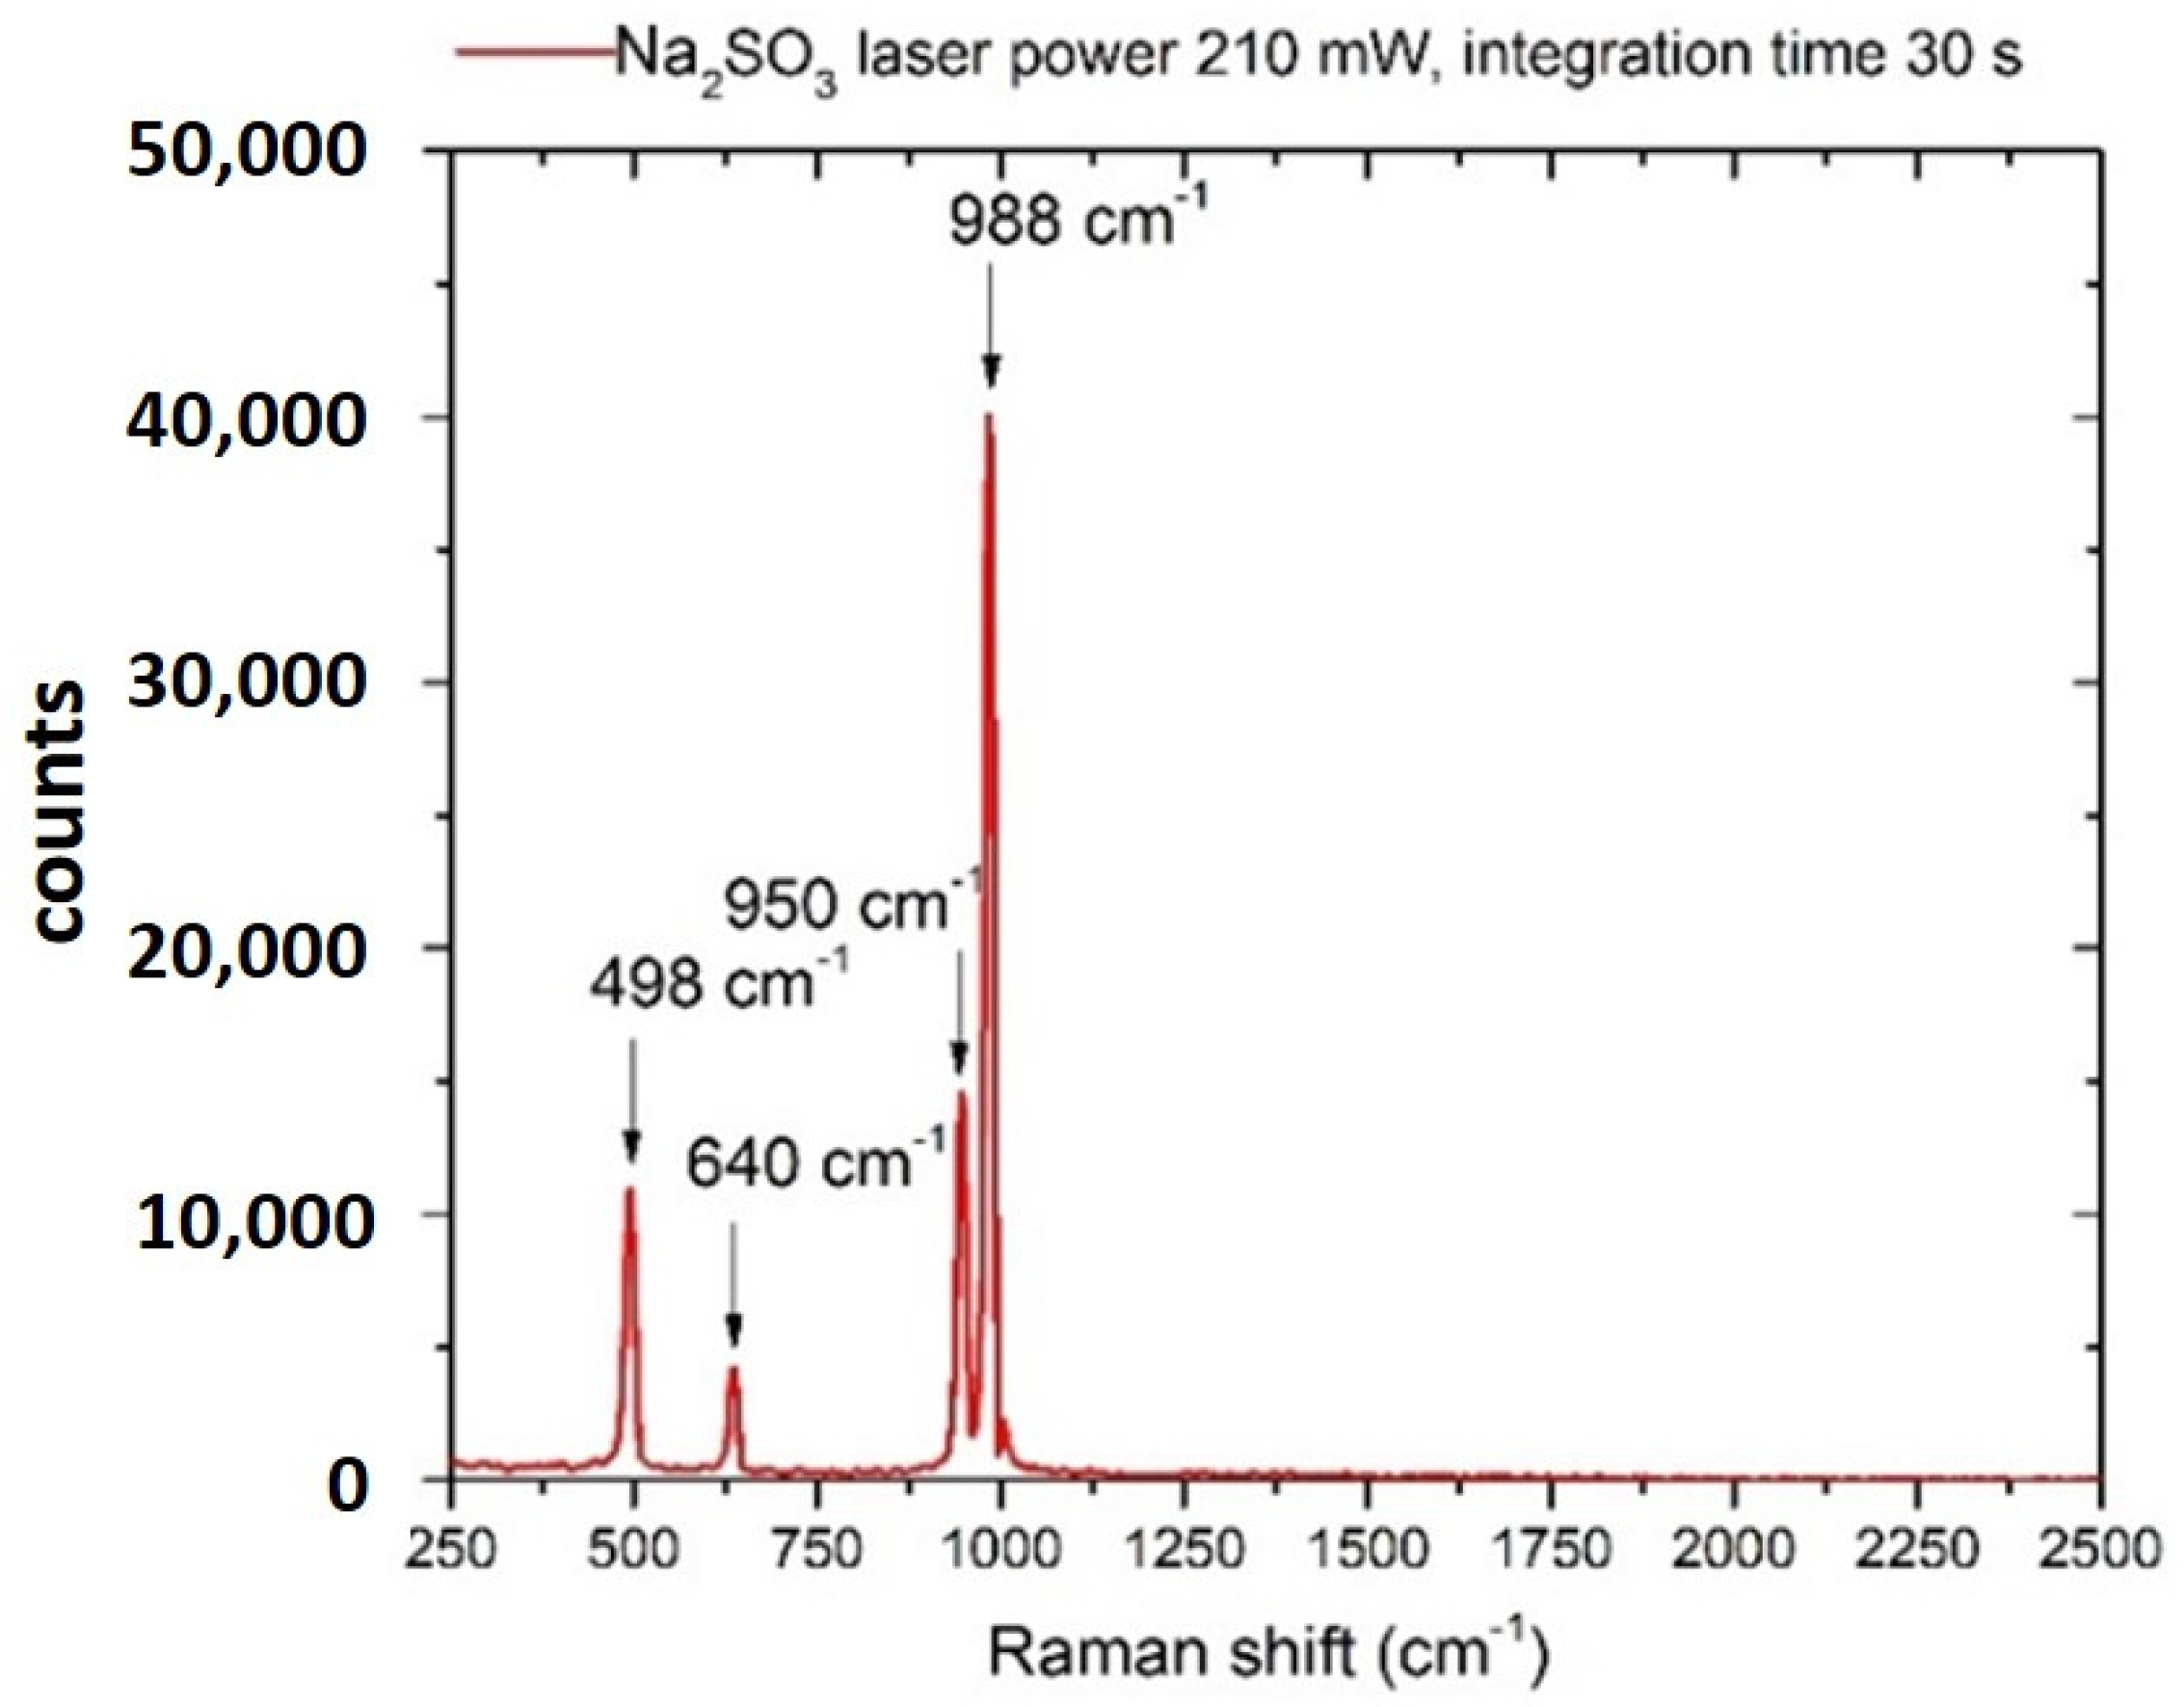
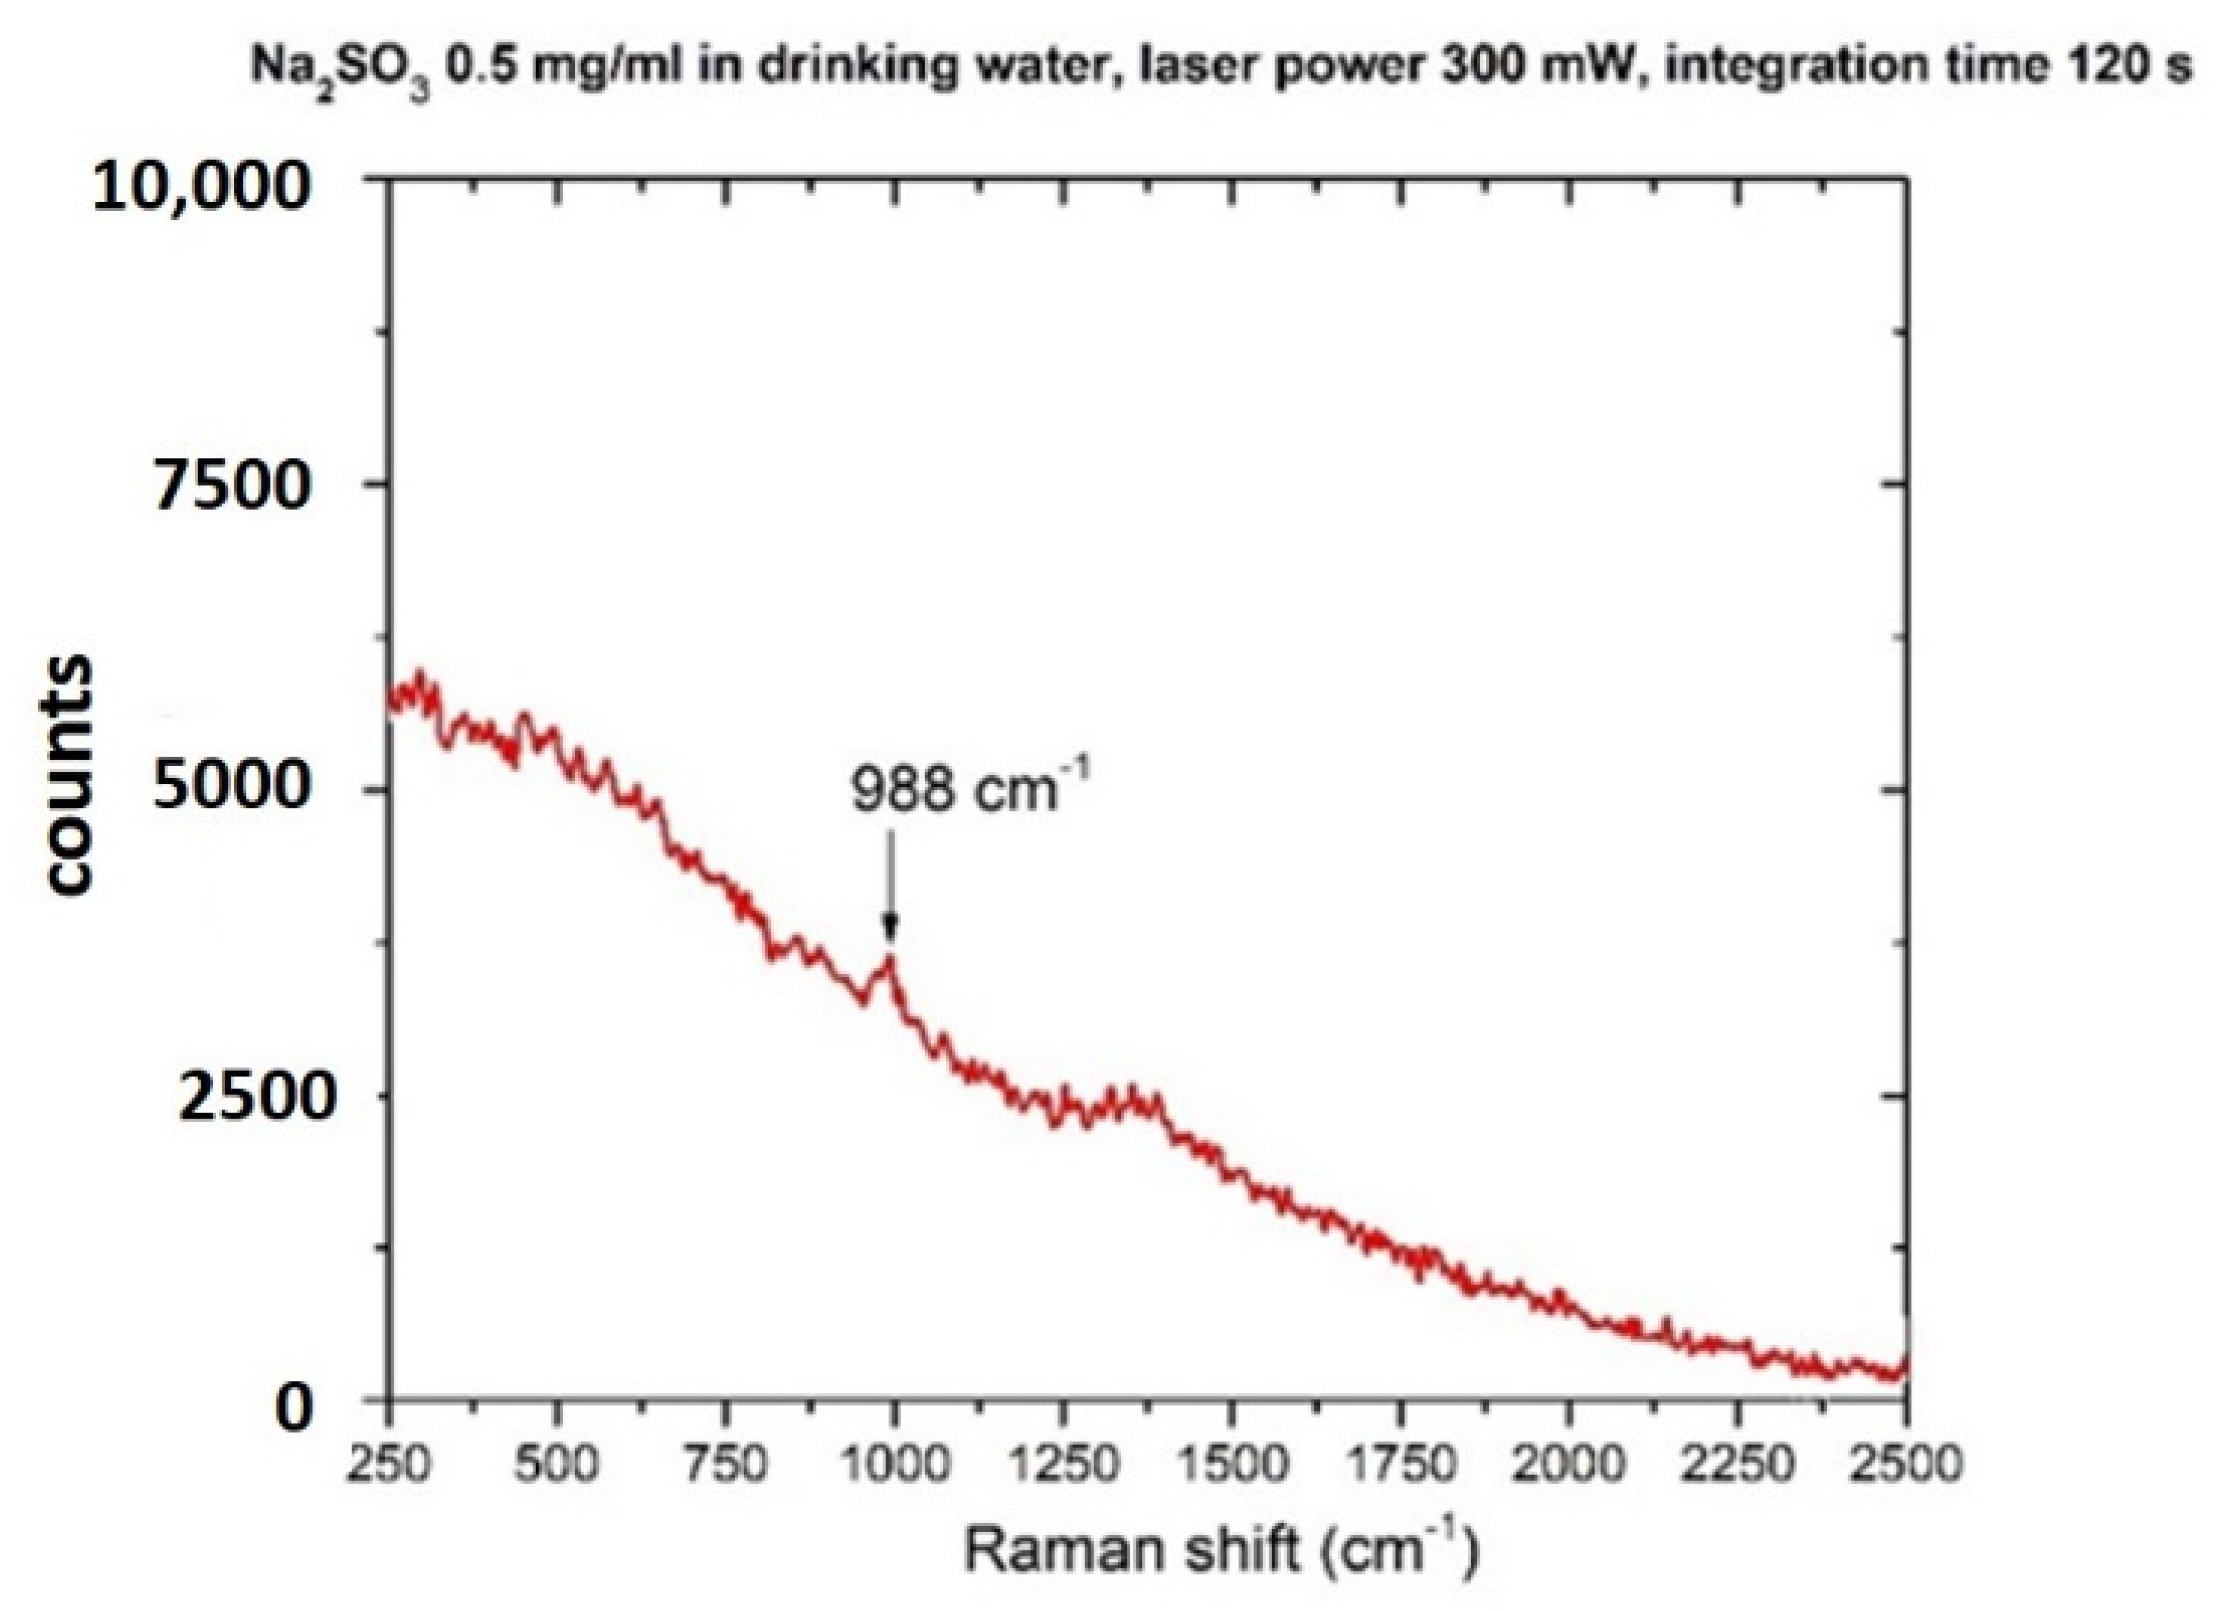
3.3. Sulphites
3.4. Polycyclic Aromatic Hydrocarbons
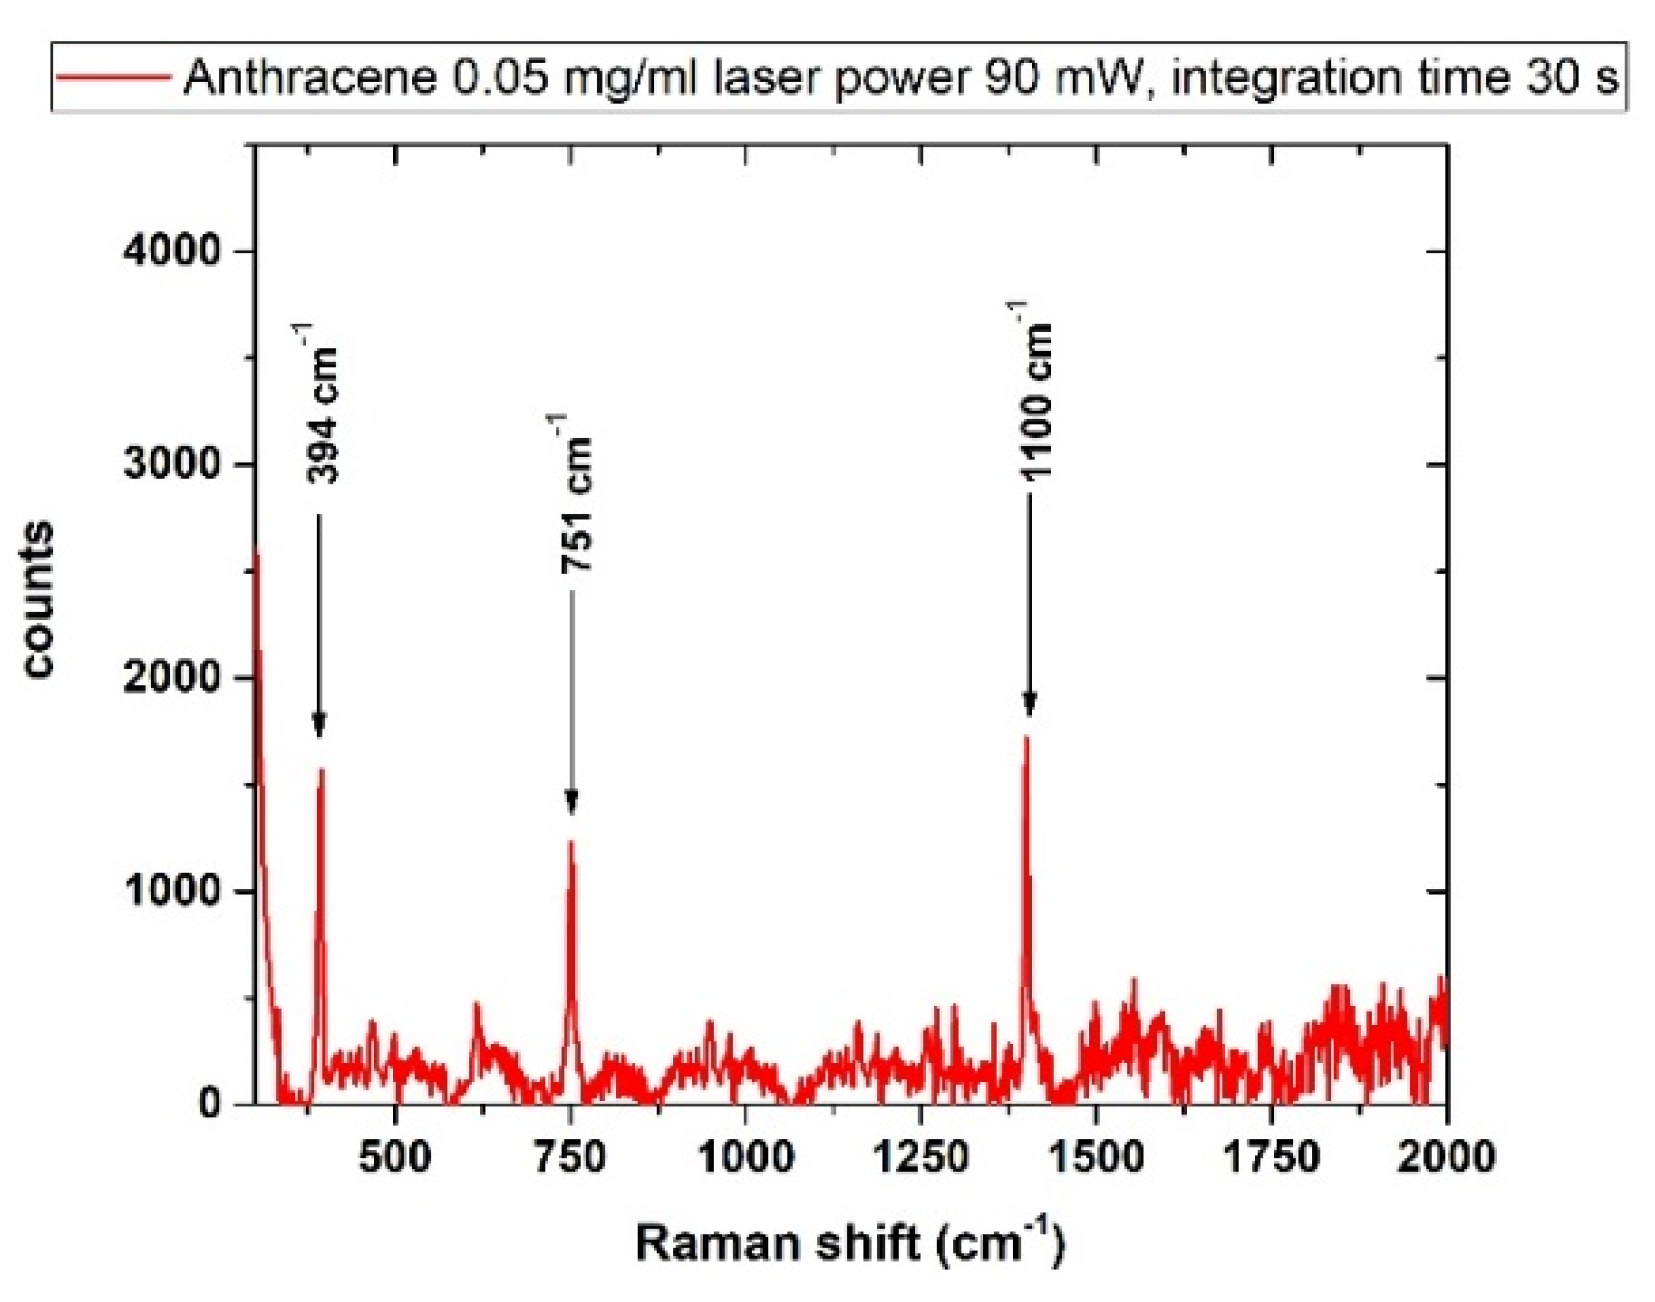
3.4.1. Anthracene
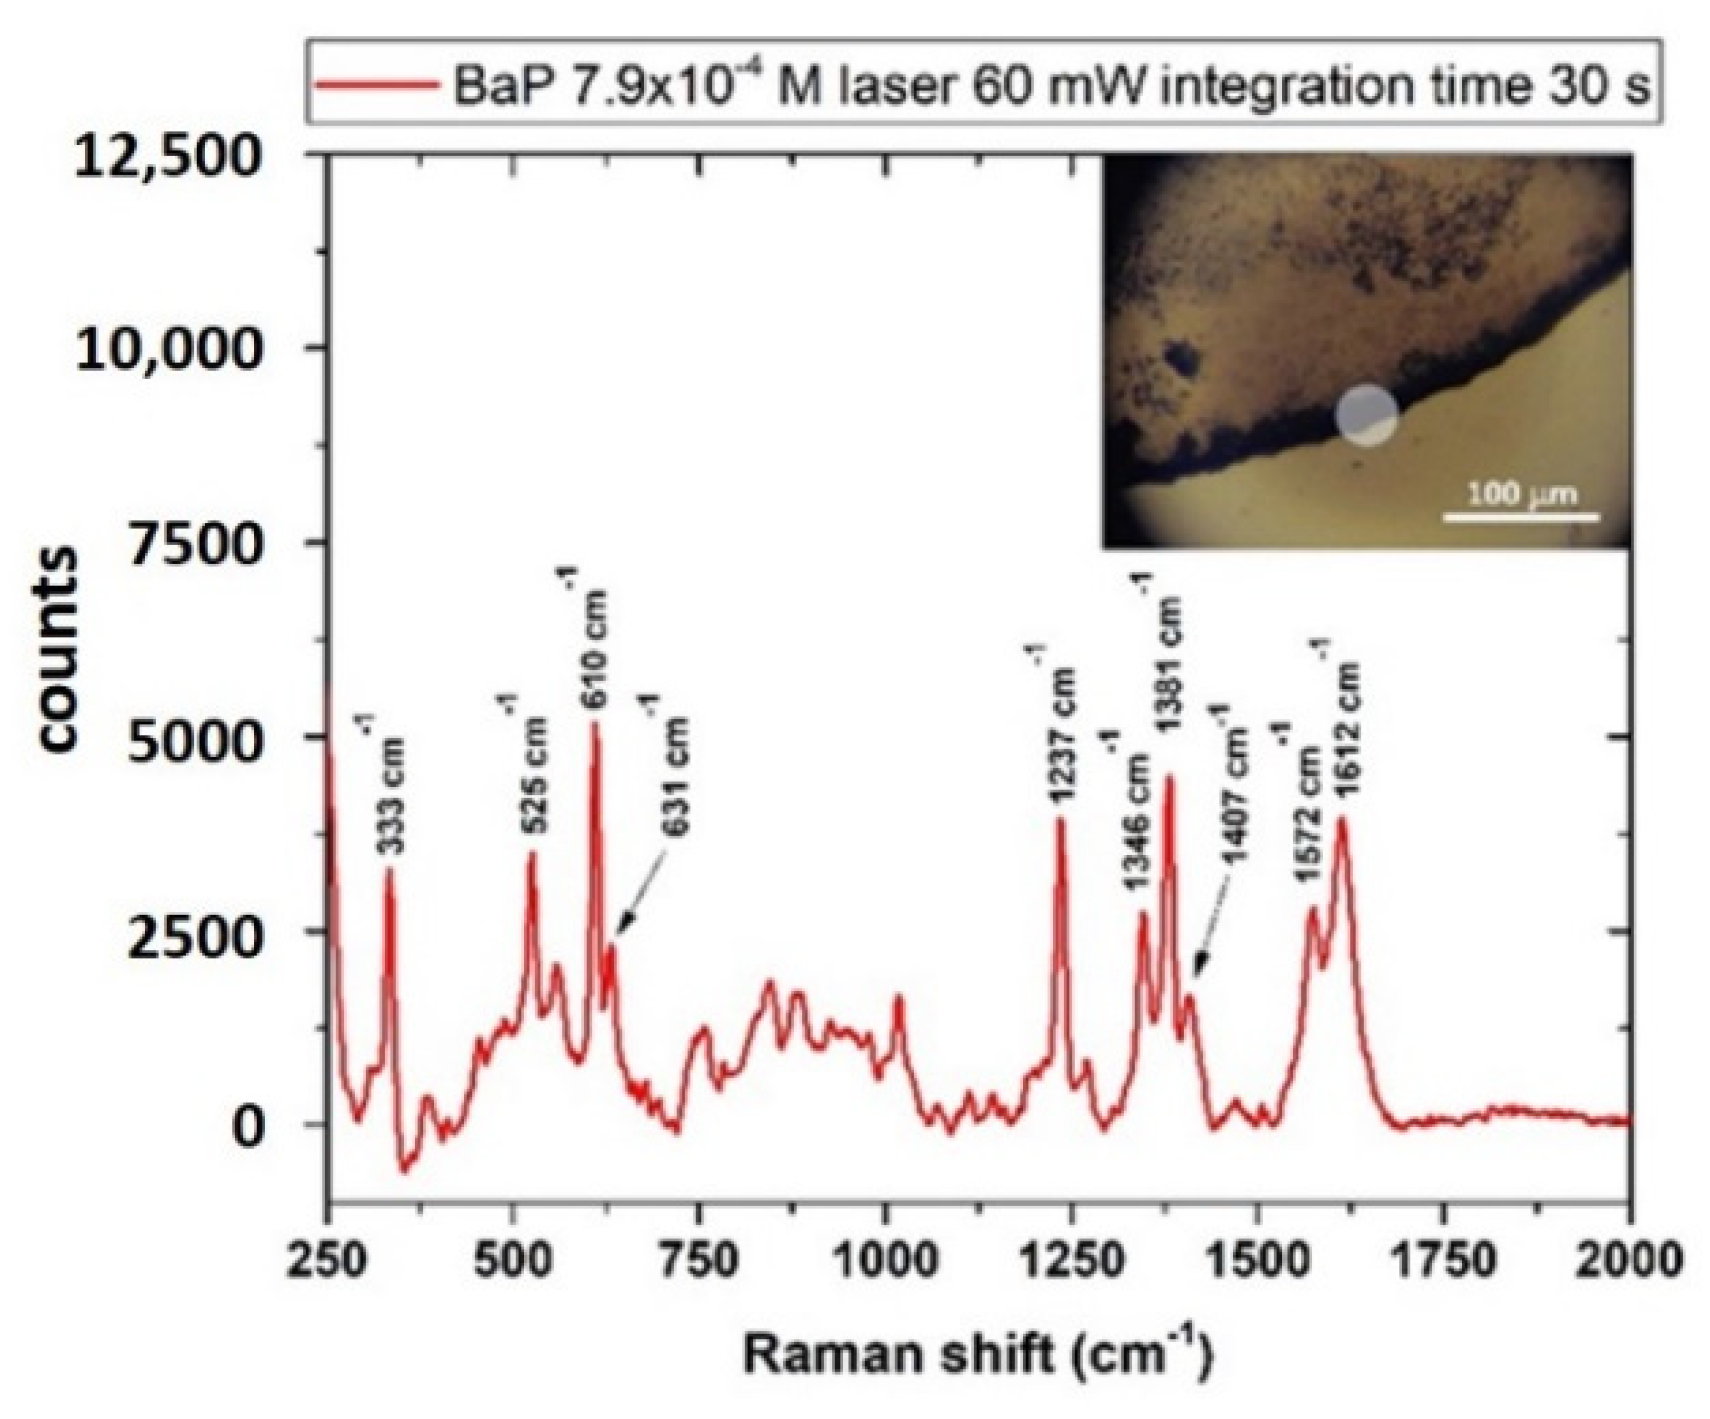
3.4.2. Benzo[a]Pyrene (BaP)
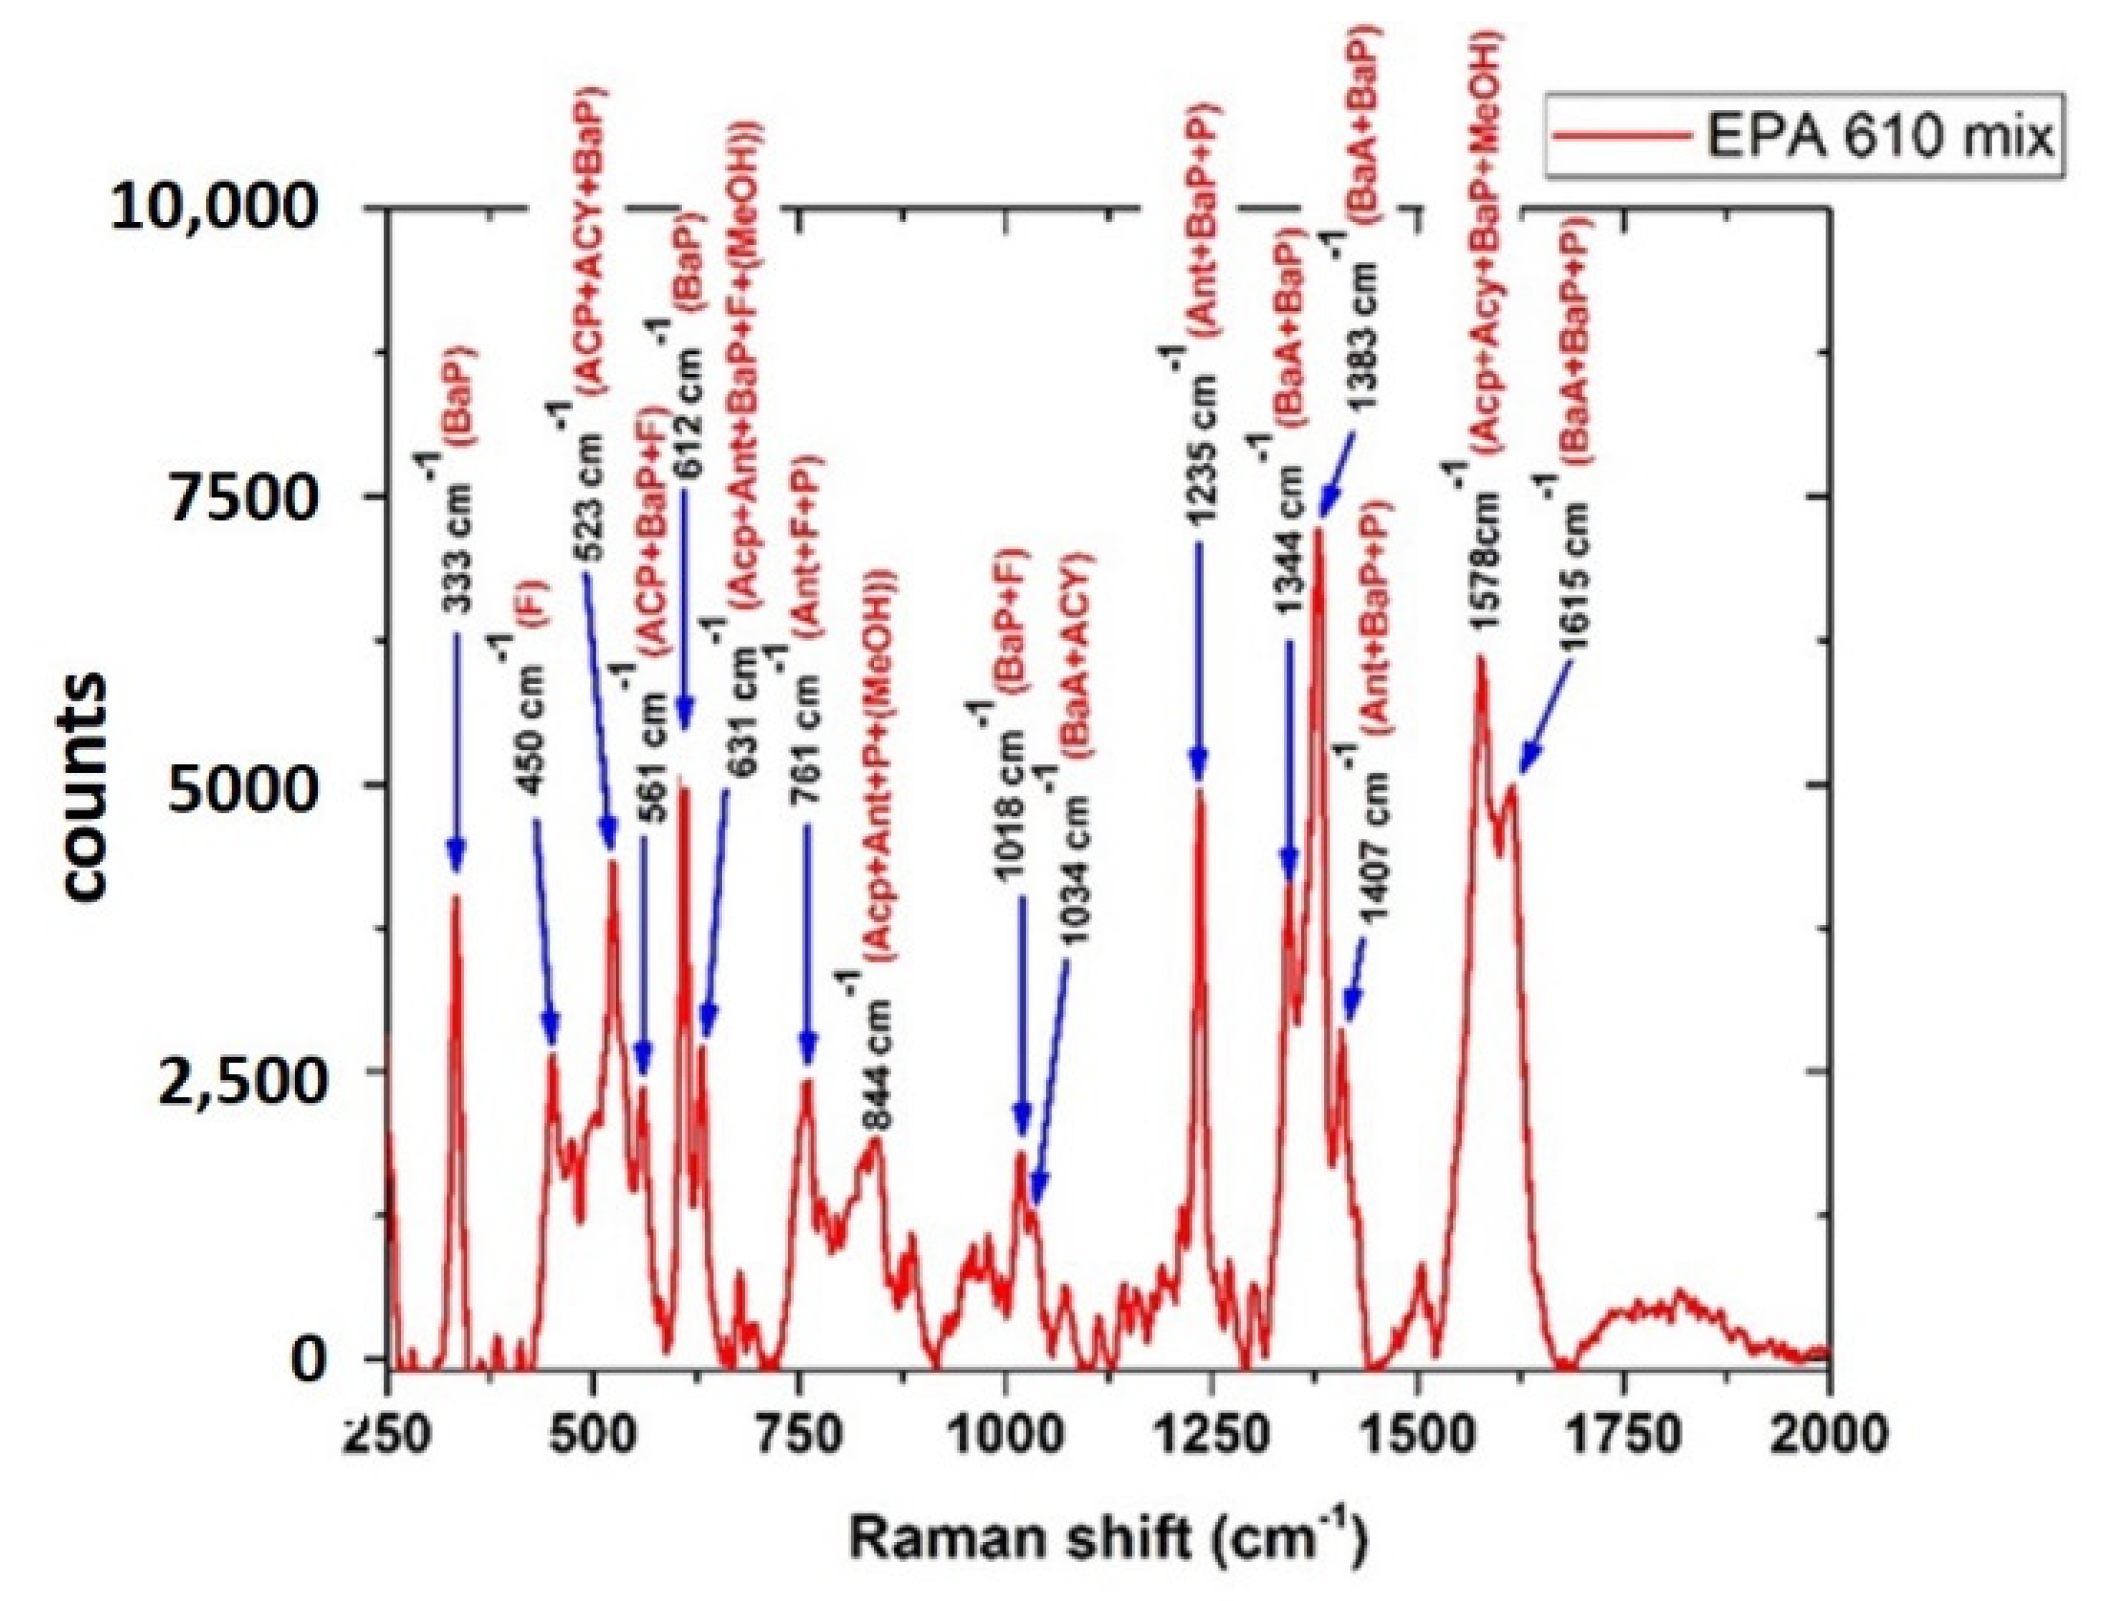
3.4.3. PAHs Mix
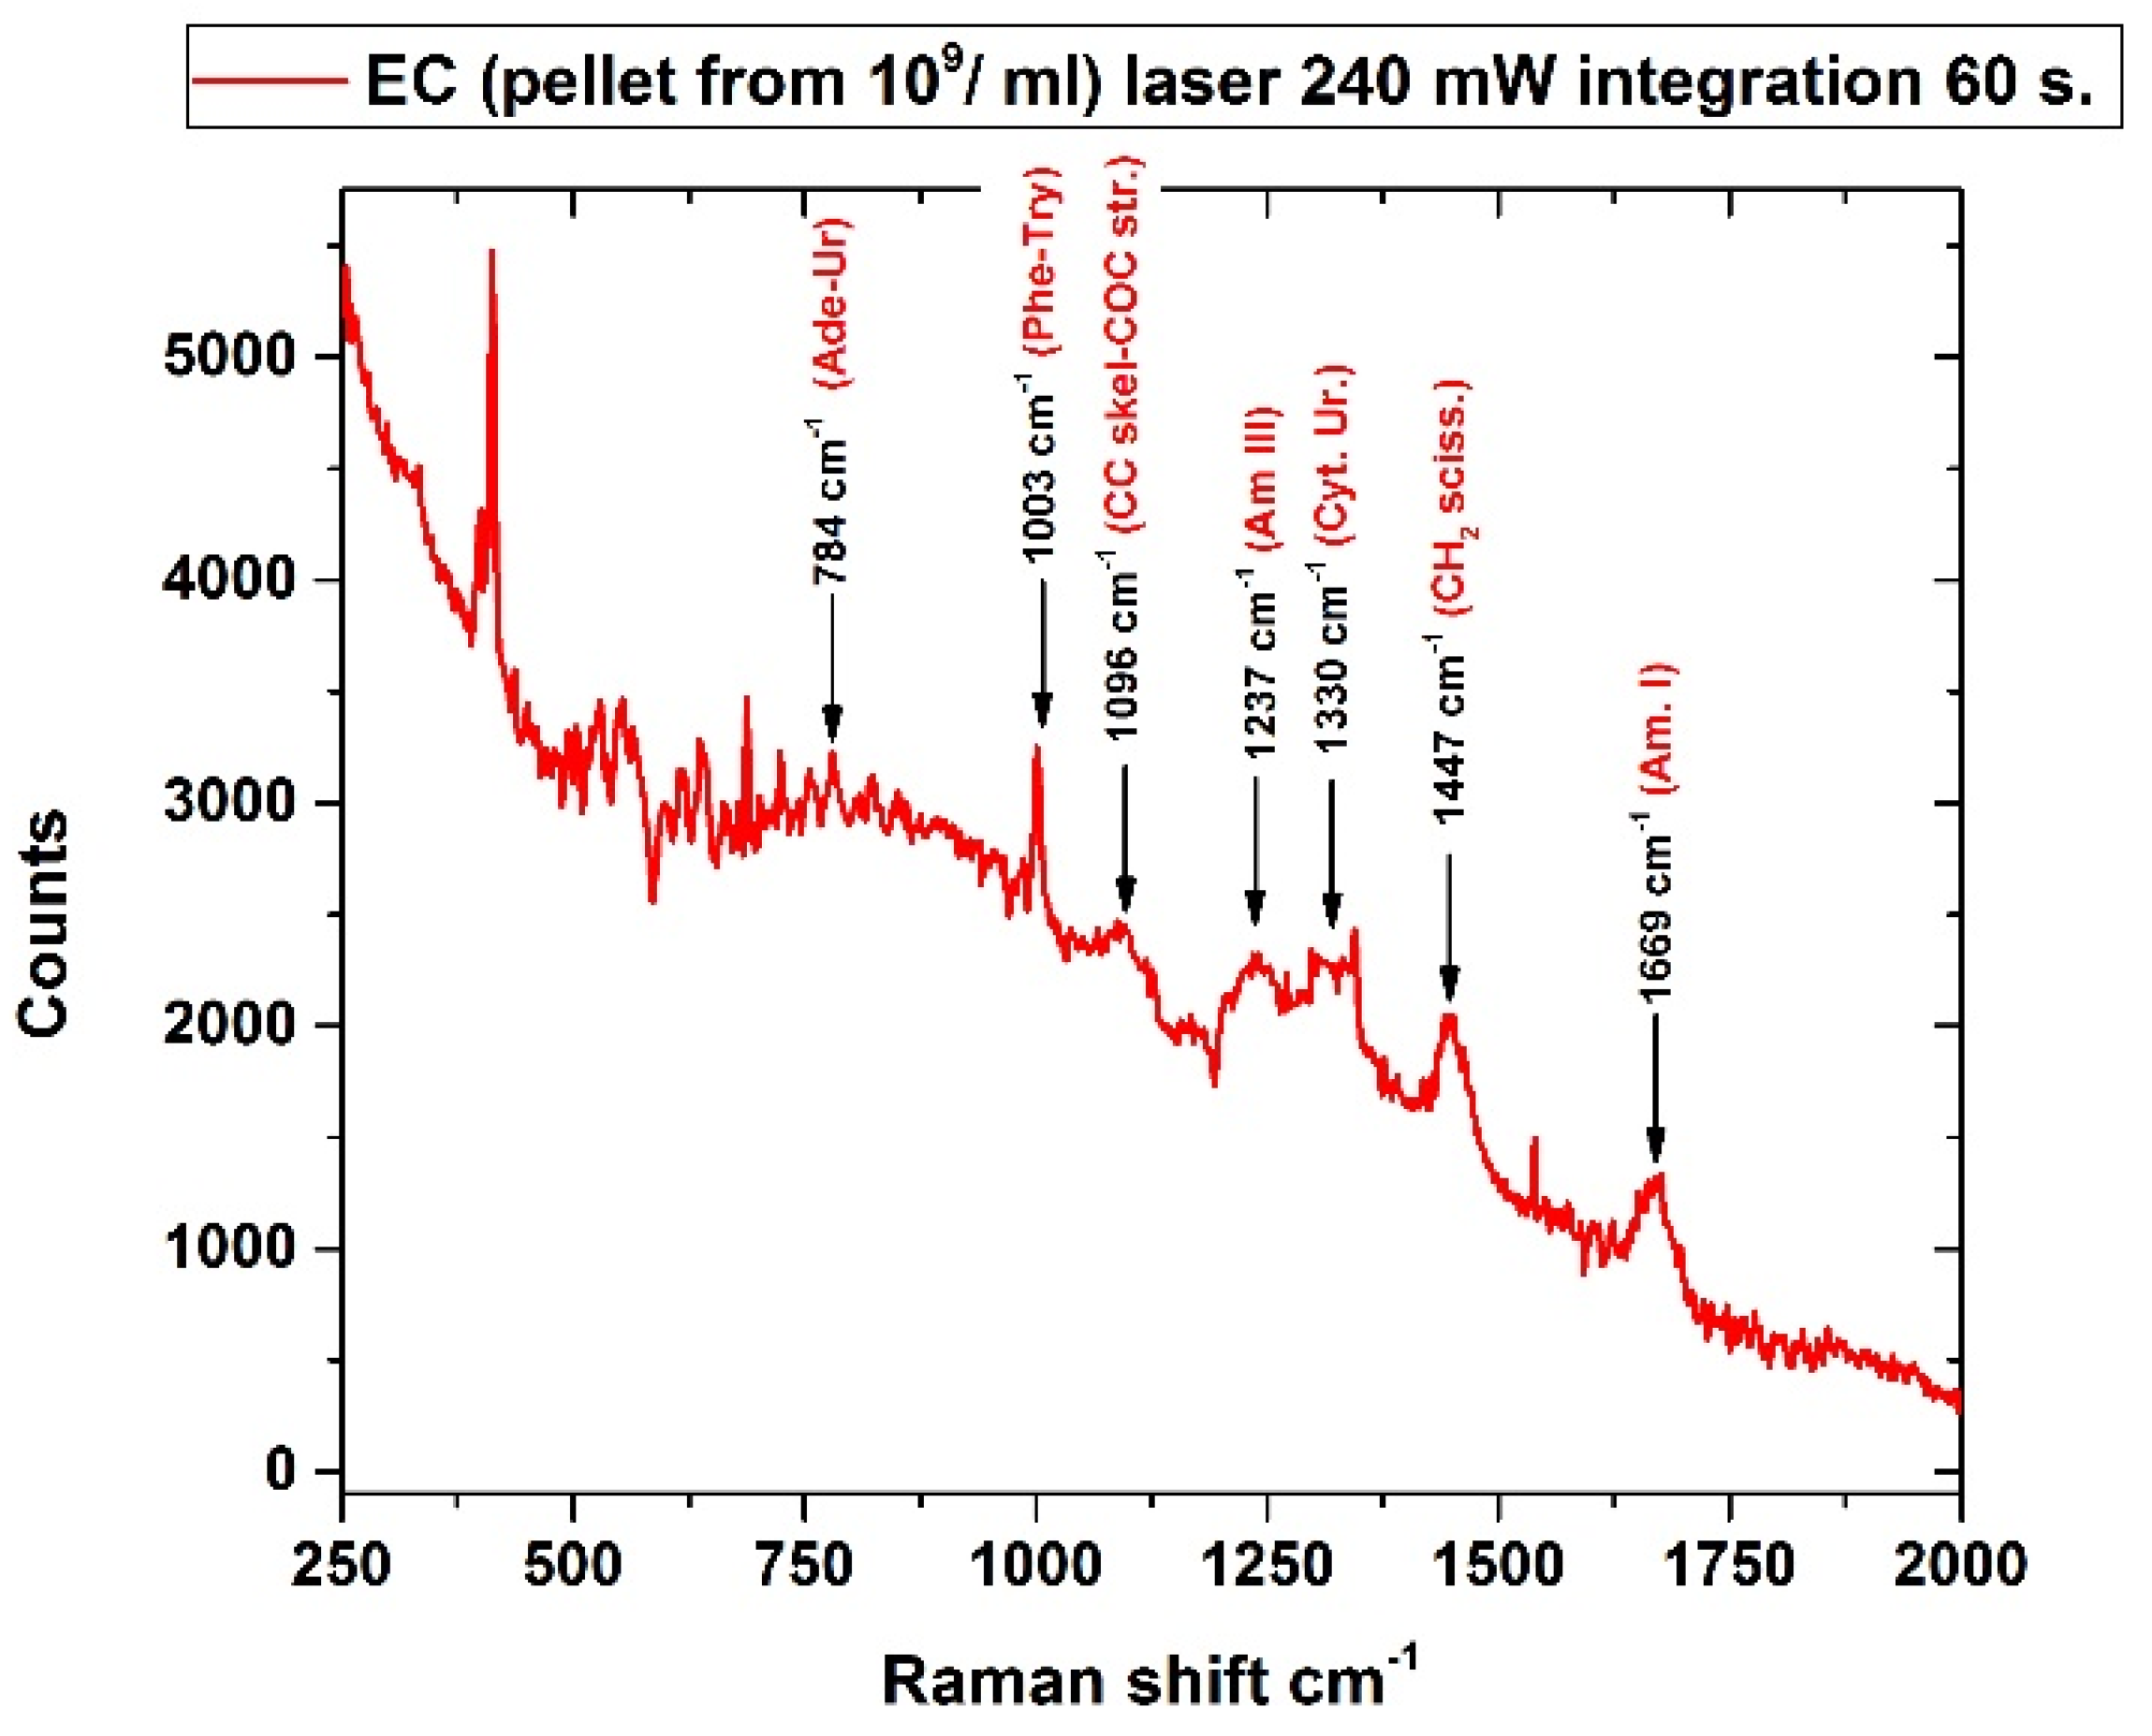
3.5. Escherichia Coli
3.6. Pesticides
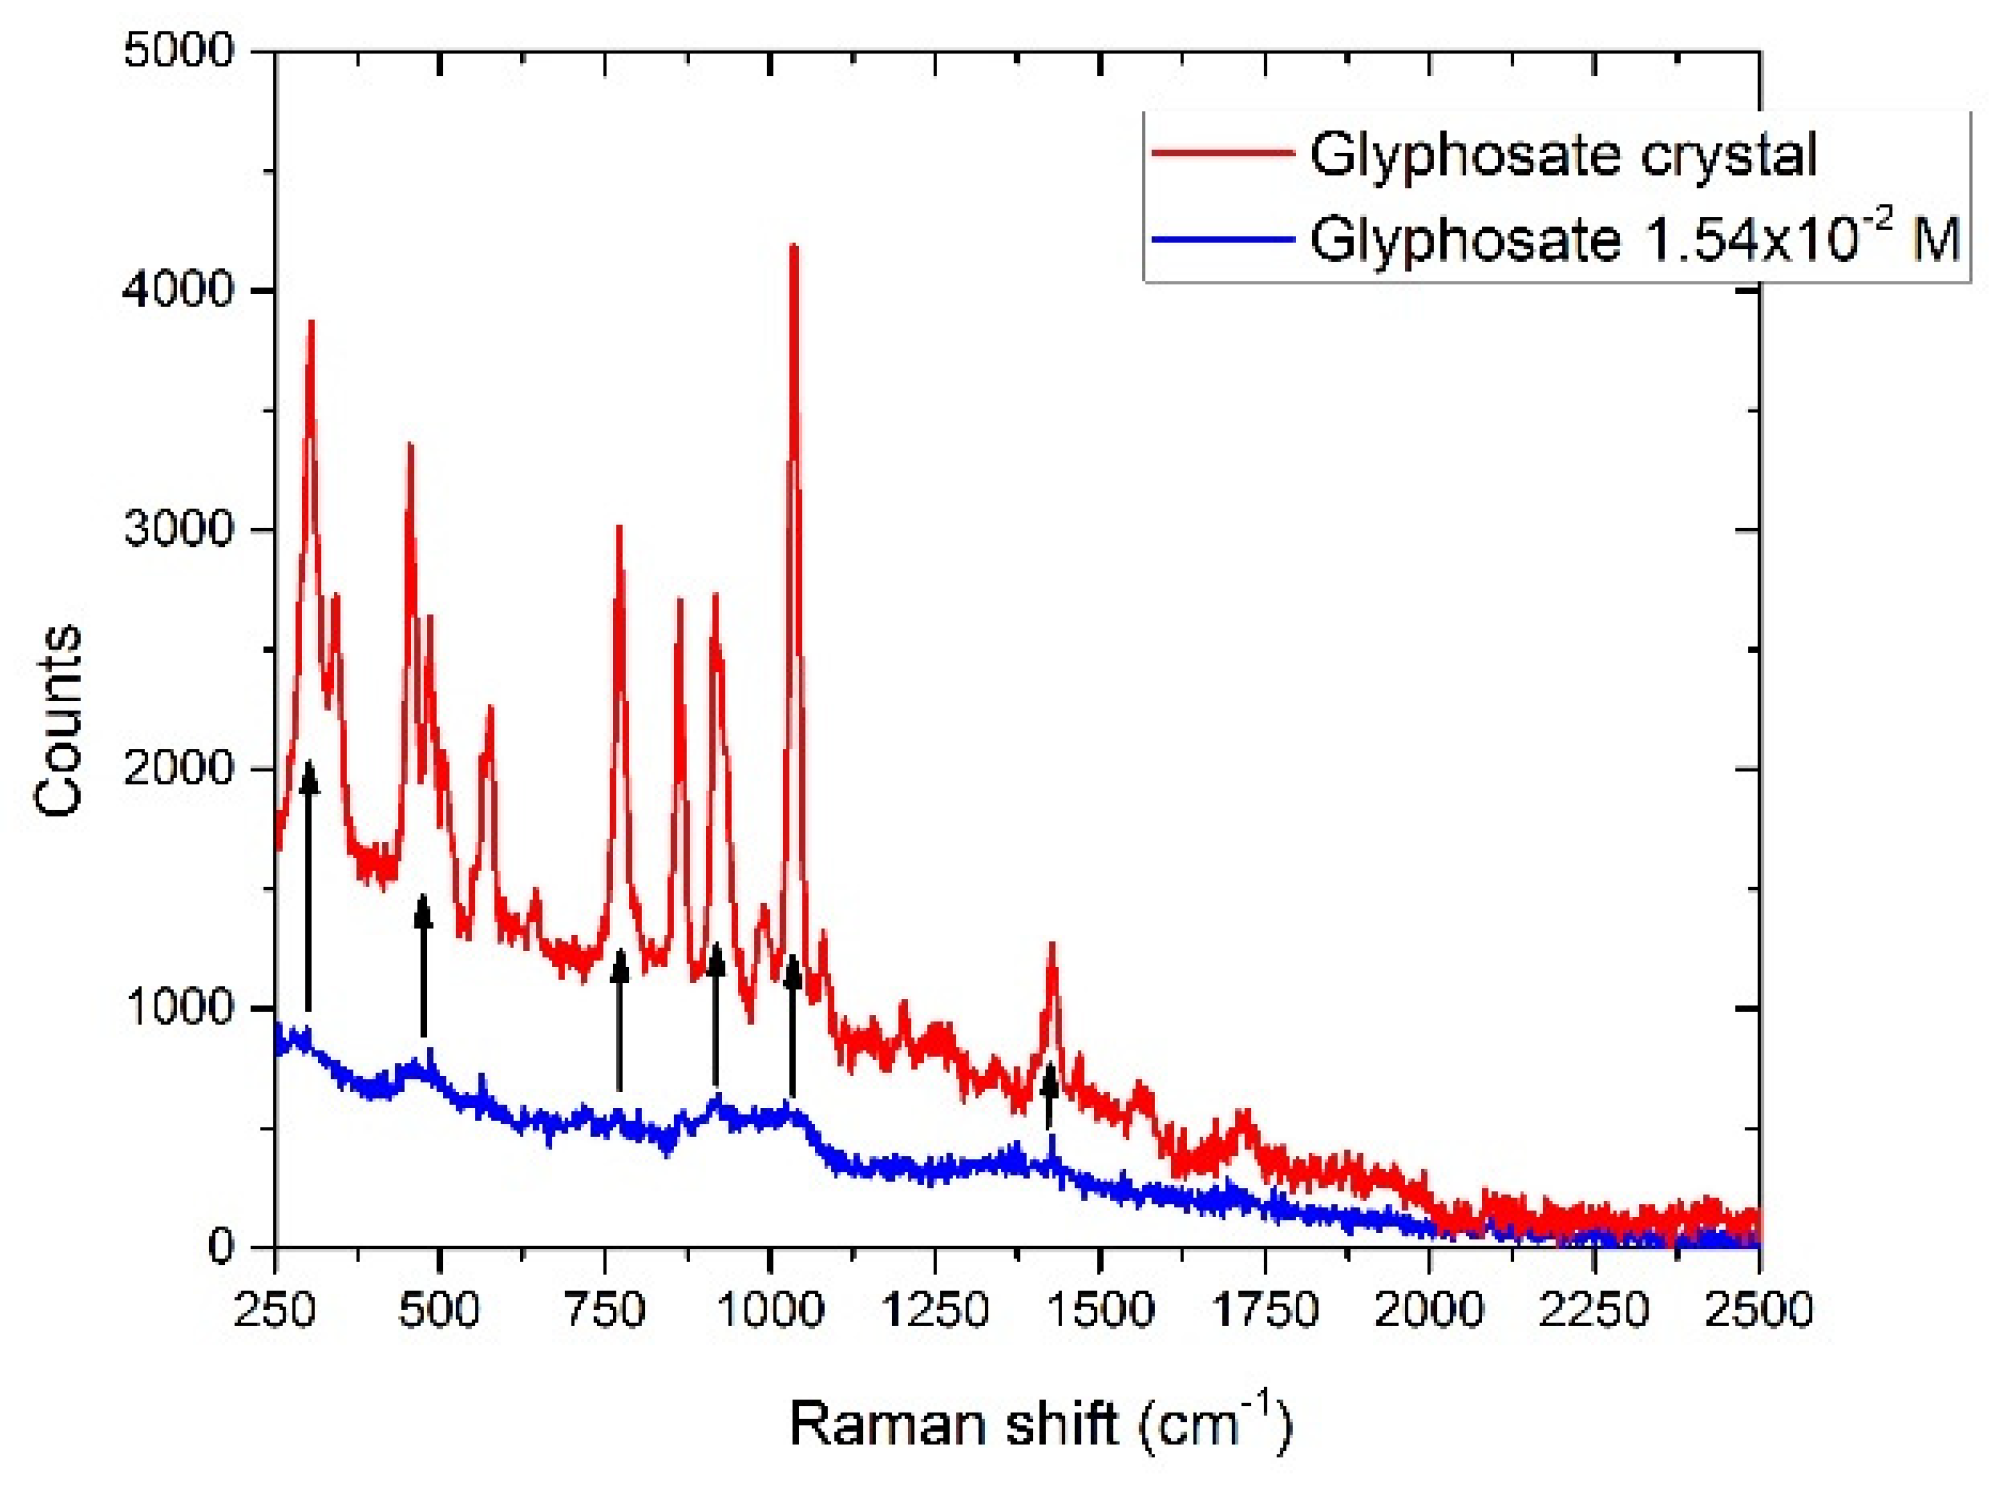
3.6.1. Glyphosate
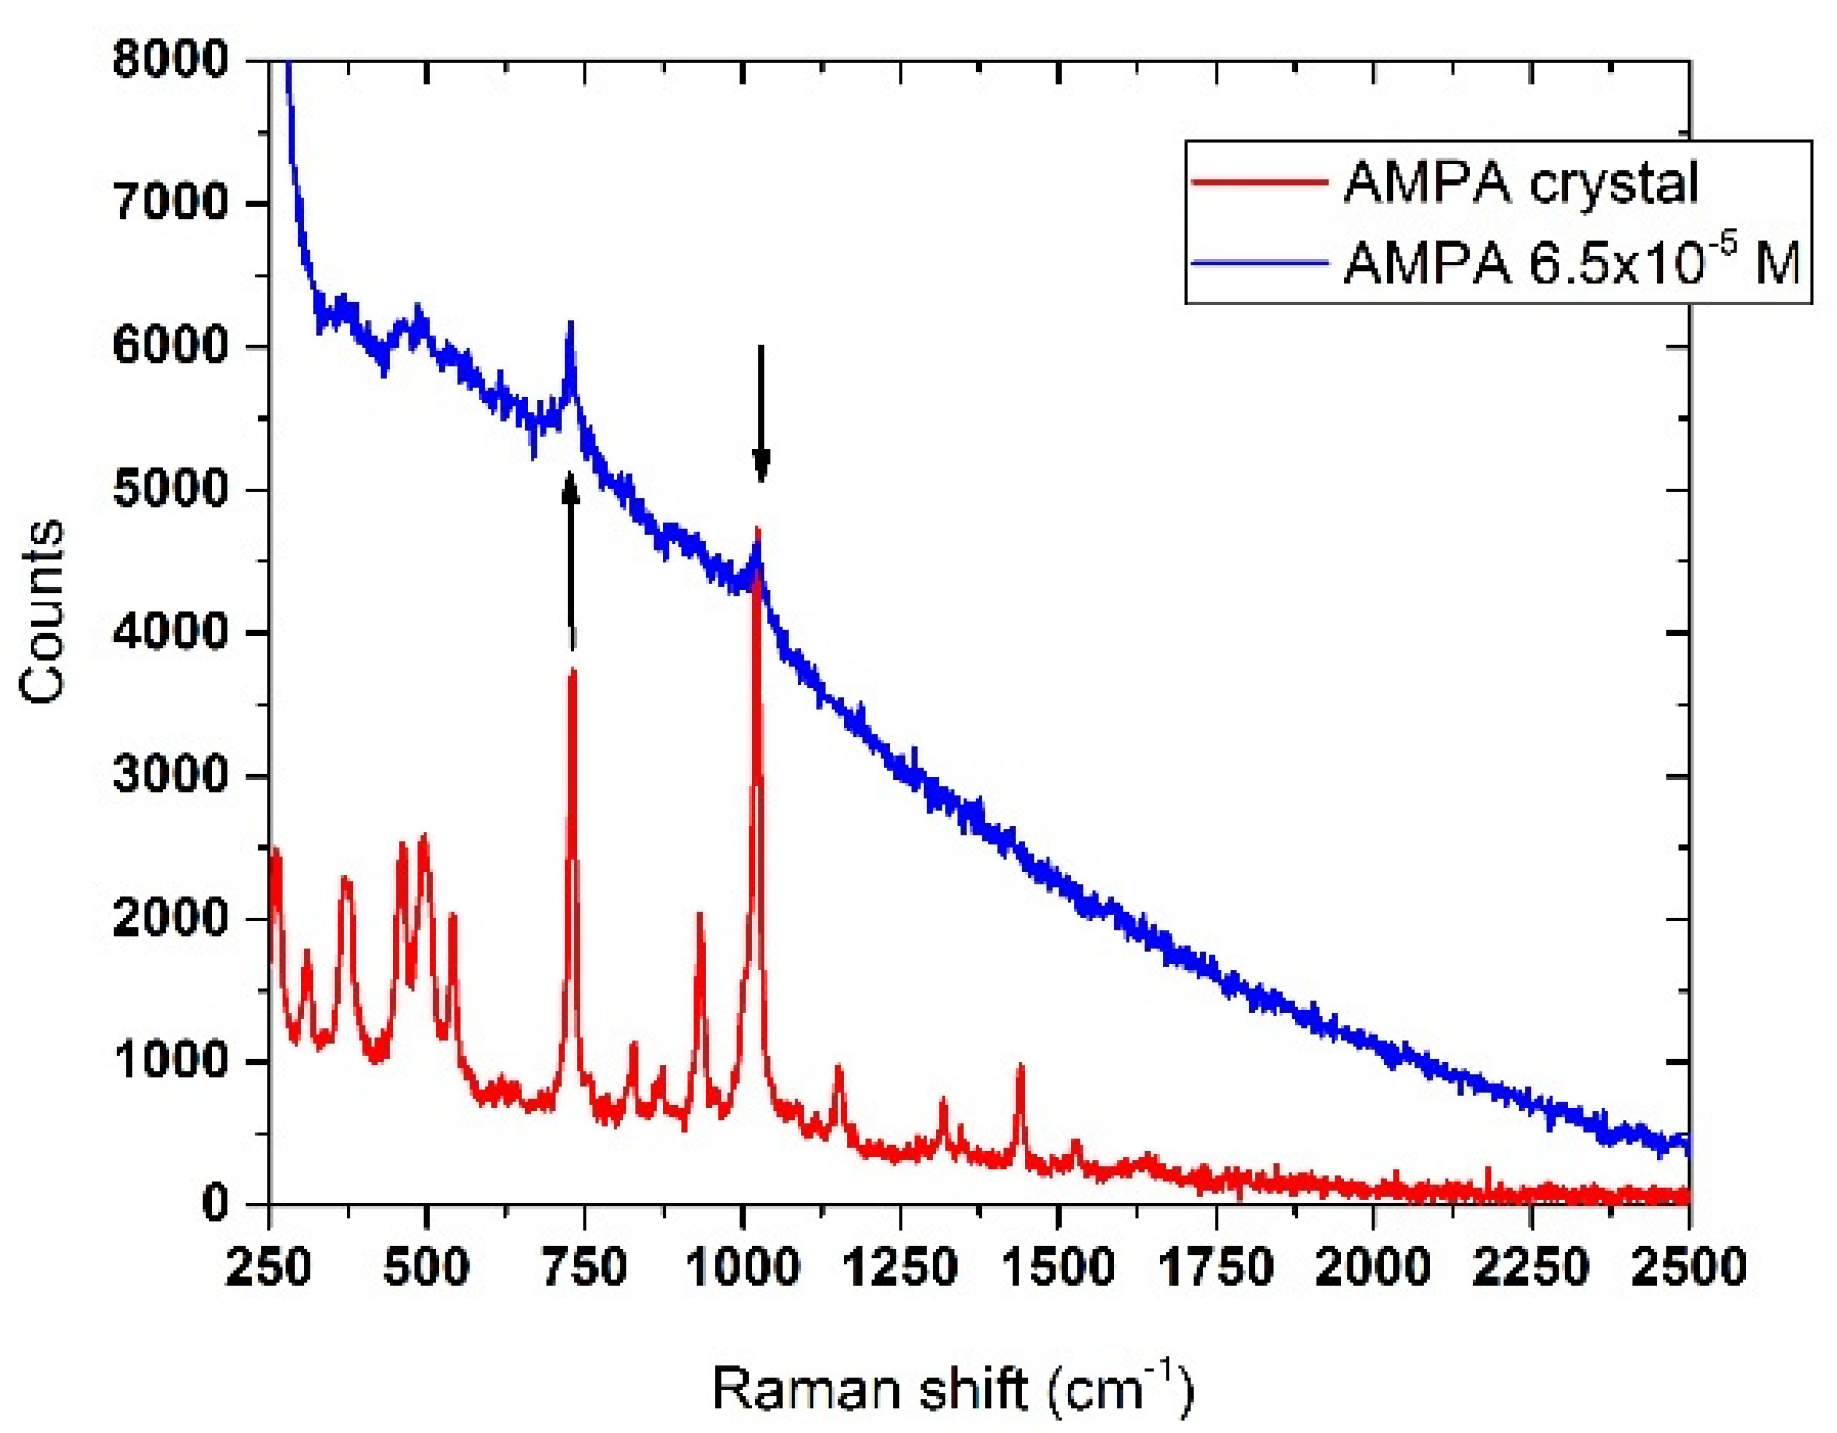
3.6.2. AMPA
4. Conclusions
Author Contributions
Funding
Institutional Review Board Statement
Informed Consent Statement
Conflicts of Interest
References
- Lin, H.; Yang, H.; Xu, X. Effects of Water Pollution on Human Health and Disease Heterogeneity: A Review. Front. Environ. Sci. 2022, 10, 88246. [Google Scholar] [CrossRef]
- Bashir, I.; Lone, F.A.; Bhat, R.A.; Mir, S.A.; Dar, Z.A.; Dar, S.A. Concerns and Threats of Contamination on Aquatic Ecosystems. In Bioremediation and Biotechnology; Hakeem, K., Bhat, R., Qadri, H., Eds.; Springer: Cham, Switzerland, 2020; Volume 27, pp. 1–26. [Google Scholar] [CrossRef]
- Hampel, M.; Blasco, J.; Segner, H. Molecular and cellular effects of contamination in aquatic ecosystems. Environ. Sci. Pollut. Res. 2015, 22, 17261–17266. [Google Scholar] [CrossRef] [PubMed]
- Kennedy, V.S. Thermal Pollution. In Encyclopedia of Energy; Cleveland, C.J., Ed.; Springer: Boston, MA, USA, 2004; Volume 6, pp. 79–89. [Google Scholar] [CrossRef]
- Shi, W.; Zhuang, W.-E.; Hur, J.; Yang, L. Monitoring dissolved organic matter in wastewater and drinking water treatments using spectroscopic analysis and ultra-high resolution mass spectrometry. Water Res. 2021, 188, 116406. [Google Scholar] [CrossRef] [PubMed]
- Yuan, G.C.; Lin, K.; Chang, A.L. Determination of trace mercury in environmental samples by cold vapor atomic fluorescence spectrometry after cloud point extraction. Microchim. Acta 2010, 171, 313–319. [Google Scholar] [CrossRef]
- Yu, J.; Cao, Y.; Shi, F.; Shi, J.; Hou, D.; Huang, P.; Zhang, G.; Zhang, H. Detection and Identification of Organic Pollutants in Drinking Water from Fluorescence Spectra Based on Deep Learning Using Convolutional Autoencoder. Water 2021, 13, 2633. [Google Scholar] [CrossRef]
- Giger, W.; Ahel, M.; Schaffner, C. Determination of Organic Water Pollutants by the Combined Use of High-Performance Liquid Chromatography and High-Resolution Gas Chromatography. In Analysis of Organic Micropollutants in Water; Angeletti, G., Bjørseth, A., Eds.; Springer: Dordrecht, The Netherlands, 1984; pp. 91–109. [Google Scholar] [CrossRef]
- Borrull, J.; Colom, A.; Fabregas, J.; Borrull, F.; Pocurull, E. Liquid chromatography tandem mass spectrometry determination of 34 priority and emerging pollutants in water from the influent and effluent of a drinking water treatment plant. J. Chromatogr. A 2020, 1621, 461090. [Google Scholar] [CrossRef]
- Guo, Y.; Liu, C.; Ye, R.; Duan, Q. Advances on Water Quality Detection by UV-Vis Spectroscopy. Appl. Sci. 2020, 10, 6874. [Google Scholar] [CrossRef]
- Gowen, A.; Tsenkova, R.; Bruen, M.; Odonnell, C.P. Vibrational Spectroscopy for Analysis of Water for Human Use and in Aquatic Ecosystems. Crit. Rev. Environ. Sci. Technol. 2012, 42, 2546–2573. [Google Scholar] [CrossRef]
- Karandashev, V.K.; Leikin, A.Y.; Khvostikov, V.A.; Kutseva, N.K.; Pirogova, S.V. Water analysis by inductively coupled plasma mass spectrometry. Inorg. Mater. 2016, 52, 1391–1404. [Google Scholar] [CrossRef]
- Jones, S.R.; Garbarino, J.R. Methods of Analysis by the U.S. Geological Survey National Water Quality Laboratory-Determination of Arsenic and Selenium in Water and Sediment by Graphite Furnace Atomic Absorption Spectrometry; open file report, 98–639; U.S. Dept. of the Interior: Washington, DC, USA; U.S. Geological Survey: Denver, CO, USA, 1999; pp. 1–47. [Google Scholar] [CrossRef][Green Version]
- Ipeaiyeda, A.R.; Ayoade, A.R. Flame atomic absorption spectrometric determination of heavy metals in aqueous solution and surface water preceded by co-precipitation procedure with copper(II) 8-hydroxyquinoline. Appl. Water Sci. 2017, 7, 4449–4459. [Google Scholar] [CrossRef]
- Smith, E.; Dent, G. Modern Raman Spectroscopy. In A Practical Approach; John Wiley & Sons Ltd.: Chichester, UK, 2005; ISBN 0-471-49668-5. [Google Scholar]
- Larkin, P. Infrared and Raman Spectroscopy. In Principles and Spectral Interpretation, 2nd ed.; Elsevier: Waltham, MA, USA, 2017; ISBN 9780128042090. [Google Scholar]
- Eckenrode, B.A.; Bartick, E.G.; Harvey, S.D.; Vucelick, M.E.; Wright, B.W.; Huff, R.A. Portable Raman spectroscopy systems for field analysis. For. Sci. Comm. 2001, 3, 218801. [Google Scholar]
- Le Ru, E.C.; Etchegoin, P.G. Principles of Surface-Enhanced Raman Spectroscopy, and Related Plasmonic Effects, 1st ed.; Elsevier: Amsterdam, The Netherlands, 2009; ISBN 9780080931555. [Google Scholar]
- Etchegoin, P.G.; Le Ru, E.C. A perspective on single molecule SERS: Current status and future challenges. Phys. Chem. Chem. Phys. 2008, 10, 6079–6089. [Google Scholar] [CrossRef] [PubMed]
- Xu, J.; Du, J.; Jing, C.; Zhang, Y.; Cui, J. Facile Detection of Polycyclic Aromatic Hydrocarbons by a Surface-Enhanced Raman Scattering Sensor Based on the Au Coffee Ring Effect. ACS Appl. Mater. Interfaces 2014, 6, 6891–6897. [Google Scholar] [CrossRef] [PubMed]
- Deegan, R.D.; Bakajin, O.; Dupont, T.F.; Huber, G.; Nagel, S.R.; Witten, T.A. Capillary flow as the cause of ring stains from dried liquid drops. Nature 1997, 389, 827–829. [Google Scholar] [CrossRef]
- Yang, X.; Wu, X.; Hao, H.L.; He, Z.L. Mechanisms and assessment of water eutrophication. J. Zhejiang Univ. Sci. B. 2008, 9, 197–209. [Google Scholar] [CrossRef]
- Nixon, S.W. 1995 Coastal marine eutrophication: A definition, social causes, and future concerns. Ophelia 1995, 41, 199–219. [Google Scholar] [CrossRef]
- El-Naggar, N.A.; Emara, H.I.; Moawad, M.N.; Soliman, Y.A.; El-Sayed, A. Detection of polycyclic aromatic hydrocarbons along Alexandria’s coastal water, Egyptian Mediterranean Sea. Egypt. Jou. Acq. Res. 2018, 44, 9–14. [Google Scholar] [CrossRef]
- Baird, W.M.; Hooven, L.A.; Mahadevan, B. Carcinogenic polycyclic aromatic hydrocarbon-DNA adducts and mechanism of action. Environ. Mol. Mutagen. 2005, 45, 106–114. [Google Scholar] [CrossRef]
- Naidoo, S.; Olaniran, A.O. Treated Wastewater Effluent as a Source of Microbial Pollution of Surface Water Resources. Int. Jou. Environ. Res. Public Health 2013, 11, 249–270. [Google Scholar] [CrossRef]
- Tilman, D.; Cassman, K.G.; Matson, P.A.; Naylor, R.; Polasky, S. Agricultural sustainability and intensive production practices. Nature 2002, 418, 671–677. [Google Scholar] [CrossRef]
- Isman, M.B. Botanical insecticides, deterrents, and repellents in modern agriculture and an increasingly regulated world. Annu. Rev. Entomol. 2006, 51, 45–66. [Google Scholar] [CrossRef] [PubMed]
- Agostini, L.P.; Dettogni, R.S.; dos Reis, R.S.; Stur, E.; dos Santos, E.V.; Ventorim, D.P.; Garcia, F.M.; Cardoso, R.C.; Graceli, J.B.; Louro, I.D. Effects of glyphosate exposure on human health: Insights from epidemiological and in vitro studies. Sci. Total Environ. 2020, 705, 135808. [Google Scholar] [CrossRef] [PubMed]
- Meftaul, I.M.D.; Venkateswarlu, K.; Dharmarajan, R.; Annamalai, P.; Asaduzzaman; Parven, A.; Megharaj, M. Controversies over human health and ecological impacts of glyphosate: Is it to be banned in modern agriculture? Environ. Pollut. 2020, 263, 114372. [Google Scholar] [CrossRef] [PubMed]
- Hoppin, J.A.; Umbach, D.M.; Long, S.; Rinsky, J.L.; Henneberger, P.K.; Salo, P.M.; Zeldin, D.; London, S.; Alavanja, M.C.R.; Blair, A.; et al. Respiratory disease in United States farmers. Occup. Environ. Med. 2014, 71, 484–489. [Google Scholar] [CrossRef] [PubMed]
- Vitousek, P.M.; Aber, J.D.; Howarth, R.W.; Likens, G.E.; Matson, P.A.; Schindler, D.W.; Schlesinger, W.H.; Tilman, D.G. Human alteration of the global nitrogen cycle: Sources and consequences. Ecol. Appl. 1997, 7, 735–750. [Google Scholar] [CrossRef]
- Wolfe, A.H.; Patz, J.H. Reactive Nitrogen and Human Health: Acute and Long-term Implications. Ambio 2002, 31, 120–125. [Google Scholar] [CrossRef]
- Italian Legislative Decree 2 February 2001, n. 31 (dlgs-31-2001). Available online: https://www.gazzettaufficiale.it/eli/id/2001/03/03/001G0074/sg (accessed on 16 September 2022).
- WHO. Guidelines for Drinking-Water Quality. Available online: https://apps.who.int/iris/bitstream/handle/10665/254637/9789241549950-eng.pdf (accessed on 7 August 2022).
- Zhao, X.; Wu, Y.; Xing, D.; Ren, Z.; Ye, L. Enhanced abatement of organic contaminants by zero-valent copper and sulfite. Environ. Chem. Lett. 2020, 18, 237–241. [Google Scholar] [CrossRef]
- Chen, L.; Huang, X.; Tang, M.; Zhou, D.; Wu, F. Rapid dephosphorylation of glyphosate by Cu-catalyzed sulfite oxidation involving sulfate and hydroxyl radicals. Environ. Chem. Lett. 2018, 16, 1507–1511. [Google Scholar] [CrossRef]
- Kularatne, K.I.A.; Dissanayake, D.P.; Mahanama, K.R.R. Contribution of dissolved sulfates and sulfites in hydrogen sulfide emission from stagnant water bodies in Sri Lanka. Chemosphere 2003, 52, 901–907. [Google Scholar] [CrossRef]
- Yin, L.Q.; Yuan, D.X.; Zhang, M. Determination of sulfite in water samples by flow injection analysis with fluorescence detection. Chin. Chem. Lett. 2010, 21, 1457–1461. [Google Scholar] [CrossRef]
- Pan, J.-J.; Jiang, J.; Xu, R.-K. Removal of Cr(VI) from aqueous solutions by Na2SO3/FeSO4 combined with peanut straw biochar. Chemosphere 2014, 101, 71–76. [Google Scholar] [CrossRef] [PubMed]
- Iwasawa, S.; Kikuchi, Y.; Nishiwaki, Y.; Nakano, M.; Michikawa, T.; Tsuboi, T.; Tanaka, S.; Uemura, T.; Ishigami, A.; Nakashima, H.; et al. Effects of SO 2 on Respiratory System of Adult Miyakejima Resident 2 Years after Returning to the Island. J. Occup. Health 2009, 51, 38–47. [Google Scholar] [CrossRef] [PubMed]
- Olivella, M.A.; Ribalta, T.G.; De Febrer, A.R.; Mollet, J.M.; Heras, F.X.C.D.L. Distribution of polycyclic aromatic hydrocarbons in riverine waters after Mediterranean forest fires. Sci. Total Environ. 2006, 355, 156–166. [Google Scholar] [CrossRef] [PubMed]
- IARC Monographs on the Identification of Carcinogenic Hazards to Humans Agents Classified by the IARC Monographs, Volumes 1–132. Available online: https://monographs.iarc.who.int/agents-classified-by-the-iarc/ (accessed on 18 September 2022).
- Ngabe, B.; Bidleman, T.F.; Scott, G.I. Polycyclic aromatic hydrocarbons in storm runoff from urban and coastal South Carolina. Sci. Total Environ. 2000, 255, 1–9. [Google Scholar] [CrossRef]
- Olivella, M. Polycyclic aromatic hydrocarbons in rainwater and surface waters of Lake Maggiore, a subalpine lake in Northern Italy. Chemosphere 2006, 63, 116–131. [Google Scholar] [CrossRef]
- Tronczyński, J.; Munschy, C.; Héas-Moisan, K.; Guiot, N.; Truquet, I.; Olivier, N.; Men, S.; Furaut, A. Contamination of the Bay of Biscay by polycyclic aromatic hydrocarbons (PAHs) following the T/V “Erika” oil spill. Aquat. Living Resour. 2004, 17, 243–259. [Google Scholar] [CrossRef]
- Park, J.-S.; Wade, T.L.; Sweet, S.T. Atmospheric deposition of PAHs, PCBs, and organochlorine pesticides to Corpus Christi Bay, Texas. Atmos. Environ. 2002, 36, 1707–1720. [Google Scholar] [CrossRef]
- Mari, M.; Harrison, R.M.; Schuhmacher, M.; Domingo, J.L.; Pongpiachan, S. Inferences over the sources and processes affecting polycyclic aromatic hydrocarbons in the atmosphere derived from measured data. Sci. Total Environ. 2010, 408, 2387–2393. [Google Scholar] [CrossRef]
- Kongprajug, A.; Denpetkul, T.; Chyerochana, N.; Mongkolsuk, S.; Sirikanchana, K. Human Fecal Pollution Monitoring and Microbial Risk Assessment for Water Reuse Potential in a Coastal Industrial–Residential Mixed-Use Watershed. Front. Microbiol. 2021, 20, 647602. [Google Scholar] [CrossRef]
- IARC Monograph 2015, 112. Available online: https://monographs.iarc.fr/wpcontent/uploads/2018/07/mono112.pdf (accessed on 28 October 2022).
- Moore, L.J.; Fuentes, L.; Rodgers, J.H.; Bowerman, W.W.; Yarrow, G.K.; Chao, W.Y.; Bridges, W.C. Relative toxicity of the components of the original formulation of Roundup® to five North American anurans. Ecotoxicol. Environ. Safe 2012, 78, 128–133. [Google Scholar] [CrossRef]
- Daouk, S.; Copin, P.-J.; Rossi, L.; Chèvre, N.; Pfeifer, H.-R. Dynamics and environmental risk assessment of the herbicide glyphosate and its metabolite AMPA in a small vineyard river of the Lake Geneva catchment. Environ. Toxicol. Chem. 2013, 32, 2035–2044. [Google Scholar] [CrossRef] [PubMed]
- Guilherme, S.; Santos, M.A.; Gaivao, I.; Pacheco, M. DNA and chromosomal damage induced in fish (Anguilla anguilla L.) by aminomethylphosphonic acid (AMPA)—The major environmental breakdown product of glyphosate. Environ. Sci. Pollut. Res. 2014, 21, 8730–8739. [Google Scholar] [CrossRef] [PubMed]
- Okada, E.; Allinson, M.; Barral, M.P.; Clarke, B.; Allinson, G. Glyphosate and aminomethylphosphonic acid (AMPA) are commonly found in urban streams and wetlands of Melbourne, Australia. Water Res. 2019, 168, 115139. [Google Scholar] [CrossRef] [PubMed]
- Masiol, M.; Giannì, B.; Prete, M. Herbicides in river water across the northeastern Italy: Occurrence and spatial patterns of glyphosate, aminomethylphosphonic acid, and glufosinate ammonium. Environ. Sci. Pollut. Res. Int 2018, 25, 24368–24378. [Google Scholar] [CrossRef]
- Fontana, M.D.; Mabrouk, K.B.; Kauffmann, T.H. Raman spectroscopic sensors for inorganic salts. Spectrosc. Prop. Inorg. Organomet. Compd. 2013, 44, 40–67. [Google Scholar] [CrossRef]
- Mosier-Boss, P.A.; Lieberman, S.H. Detection of Anions by Normal Raman Spectroscopy and Surface-Enhanced Raman Spectroscopy of Cationic-Coated Substrates. Appl. Spectroscop. 2003, 57, 1129–1137. [Google Scholar] [CrossRef]
- Liu, W.; Xia, H.; Wang, X.; Ling, Z.; Xu, J.; Wei, Y.; Liu, Y.; Han, H. Spectroscopic manifestation for the isotopic substitution in potassium dihydrogen phosphate. J. Alloy. Compd. 2007, 430, 226–231. [Google Scholar] [CrossRef]
- Litke, D.W. Review of Phosphorus Control Measures in the United States and Their Effects on Water Quality; Water-Resources Investigations Report 99–4007; U.S. Geological Survey: Denver, CO, USA, 1999; pp. 1–38. [Google Scholar] [CrossRef]
- Johnstone, H.F.; Mattern, J.A.; Fernelius, W.C. Sulfites and Pyrosulfites of the Alkali Metals. Inorg. Synth. 1946, 2, 162–167. [Google Scholar] [CrossRef]
- FAO. The State of the World’s Land and Water Resources for Food and Agriculture—Systems at Breaking Point; Main report; FAO: Rome, Italy, 2022. [Google Scholar] [CrossRef]
- ECHA, European Chemical Agency. Available online: https://echa.europa.eu/it/substance-information/-/substanceinfo/100.084.153 (accessed on 8 August 2022).
- Chen, J.; Huang, Y.-W.; Zhao, Y. Characterization of polycyclic aromatic hydrocarbons using Raman and surface-enhanced Raman spectroscopy. Jou. Raman Spectrosc. 2014, 46, 64–69. [Google Scholar] [CrossRef]
- Sadikovic, B.; Rodenhiser, D. Benzopyrene exposure disrupts DNA methylation and growth dynamics in breast cancer cells. Toxicol. Appl. Pharmacol. 2006, 216, 458–468. [Google Scholar] [CrossRef]
- Chart, H.; Smith, H.; La Ragione, R.; Woodward, M. An investigation into the pathogenic properties of Escherichia coli strains BLR, BL21, DH5alpha and EQ1. J. Appl. Microbiol. 2000, 89, 1048–1058. [Google Scholar] [CrossRef] [PubMed]
- Nurliyana, M.R.; Sahdan, M.; Wibowo, K.; Muslihati, A.; Saim, H.; Ahmad, S.; Sari, Y.; Mansor, Z. The Detection Method of Escherichia coli in Water Resources: A Review. J. Phys. Conf. Ser. 2018, 995, 012065. [Google Scholar] [CrossRef]
- Hamasha, K.; Mohaidat, Q.; Putnam, R.A.; Woodman, R.C.; Palchaudhuri, S.; Rehse, S.J. Sensitive and specific discrimination of pathogenic and nonpathogenic Escherichia coli using Raman spectroscopy—A comparison of two multivariate analysis techniques. Biomed. Opt. Express 2013, 4, 481–489. [Google Scholar] [CrossRef] [PubMed]
- Kusić, D.; Kampe, B.; Rösch, P.; Popp, J. Identification of water pathogens by Raman microspectroscopy. Water Res. 2014, 48, 179–189. [Google Scholar] [CrossRef]
- Costa, J.C.S.; Ando, R.A.; Sant’Ana, A.C.; Corio, P. Surface-enhanced Raman spectroscopy studies of organophosphorous model molecules and pesticides. Phys. Chem. Chem. Phys. 2012, 14, 15645–15651. [Google Scholar] [CrossRef]


| Description | Concentration (μg/mL) |
|---|---|
| Acenaphthene | 1000 |
| Acenaphthylene | 2000 |
| Anthracene | 100 |
| Benz(a)anthracene | 100 |
| Benzo(b)fluoranthene | 200 |
| Benzo(k)fluoranthene | 100 |
| Benzo(ghi)perylene | 200 |
| Benzo(a)pyrene | 100 |
| Chrysene | 100 |
| Dibenz[a,h]anthracene | 200 |
| Fluoranthene | 200 |
| Fluorene | 200 |
| Indenol [1,2.3-ca] pyrene | 100 |
| Naphthalene | 1000 |
| Phenanthrene | 100 |
| Pyrene | 100 |
| Contaminant | Concentration (mg/L) |
|---|---|
| Nitrates | 20 |
| Phosphates | 1000 |
| Sulfites | 500 |
| Anthracene | 50 |
| Benzo[a]pyrene | 200 |
| PHAs mix | 100–2000 * |
| Escherichia Coli ** | 109 *** |
| Glyphosate | 2.6 × 10³ |
| AMPA | 7.2 |
Publisher’s Note: MDPI stays neutral with regard to jurisdictional claims in published maps and institutional affiliations. |
© 2022 by the authors. Licensee MDPI, Basel, Switzerland. This article is an open access article distributed under the terms and conditions of the Creative Commons Attribution (CC BY) license (https://creativecommons.org/licenses/by/4.0/).
Share and Cite
Almaviva, S.; Artuso, F.; Giardina, I.; Lai, A.; Pasquo, A. Fast Detection of Different Water Contaminants by Raman Spectroscopy and Surface-Enhanced Raman Spectroscopy. Sensors 2022, 22, 8338. https://doi.org/10.3390/s22218338
Almaviva S, Artuso F, Giardina I, Lai A, Pasquo A. Fast Detection of Different Water Contaminants by Raman Spectroscopy and Surface-Enhanced Raman Spectroscopy. Sensors. 2022; 22(21):8338. https://doi.org/10.3390/s22218338
Chicago/Turabian StyleAlmaviva, Salvatore, Florinda Artuso, Isabella Giardina, Antonia Lai, and Alessandra Pasquo. 2022. "Fast Detection of Different Water Contaminants by Raman Spectroscopy and Surface-Enhanced Raman Spectroscopy" Sensors 22, no. 21: 8338. https://doi.org/10.3390/s22218338
APA StyleAlmaviva, S., Artuso, F., Giardina, I., Lai, A., & Pasquo, A. (2022). Fast Detection of Different Water Contaminants by Raman Spectroscopy and Surface-Enhanced Raman Spectroscopy. Sensors, 22(21), 8338. https://doi.org/10.3390/s22218338