1. Introduction
Accidents such as fires caused by old factory lines or machine failures are frequent, and occurrences in technology factories and electronics factories are more likely to affect the national or even global supply chain. The PCB industry is regarded as the most dangerous industry in the electronics industry because of its high-temperature process, complex pipelines, and many chemicals in the field. If the safety of the factory operation cannot be guaranteed, it will lead to a waste of human resources and high-value machines, which will lead to the failure of the factory to produce profits smoothly. The importance of industrial safety is the key to the stable growth of an enterprise. Visible or even invisible hidden dangers in the workshop must be detected and inspected to ensure the personal safety of operators and the property safety of high-value machines and equipment. Therefore, the demand for thermal imaging cameras for industrial use continues to increase. However, the cost of industrial thermal imaging cameras is much higher than that of other sensors. For most owners, it is a high investment, resulting in a low penetration rate in practical applications. Therefore, most factories still use manual labor. Regular testing results in personnel still having to travel to the front lines for operations, increasing the number of hours personnel are exposed to hazards and risks. In technical detection, the thermal imager mainly measures the surface temperature. Therefore, for many existing thermal imaging cameras in the market, temperature measurements with different depths of field cannot be achieved.
In this paper, automated optical inspection (AOI) equipment and a thermal imager heat source detection system are used. In order to improve the temperature measurement error at different distances, it is equipped with an Intel Real Sense Depth Camera D435, which can effectively grasp the distance from the heat source to the camera, and perform temperature distance compensation to ensure that the measured temperature is correct and accurate. In grasping the location and distance of the heat source, through the theoretical basis of Planck’s black body radiation law and Stefan–Boltzmann law, a deep camera with a thermal sense imaging system can be developed that can measure the temperature at different distances, so as to ensure that the temperature of the heat source can be captured.
According to the current thermal overflow phenomenon in chip packaging, the purpose is to more accurately compensate and improve the temperature measured at different distances through the extension results in this research. Additionally, through the method of non-single-point measurement of temperature, the far-infrared spectroscopy measurement of AOI in the future will be improved. Provide better compensation calculation methods for industrial accidents, packaging processes, wafer heating, and other projects.
This study is based on the calculation of the stereo vision distance measurement of the depth camera, the long-wave infrared measurement of the thermal imager, and the Planck black body radiation as the basis to obtain the exact temperature of the measured object at each distance. Through binocular stereo calibration, the corresponding positions of the two cameras are calculated to ensure that the measurement points are correct.
Optical stereo vision measurement technology can be divided into active measurement and passive measurement. Active measurement can be divided into continuous-wave lasers and pulsed lasers for time-of-flight ranging [
1,
2], triangular ranging and coded structured light, linear structured light, and spot structured light for structured light ranging [
3]. Passive measurement includes the focusing method and defocusing method of monocular stereo vision, binocular stereo vision, and multi-eye stereo vision [
4,
5]. The difference between the active measurement and the passive measurement is that the active measurement uses infrared light or other signals that it emits and then receives back to obtain the actual distance to the object to be measured. The passive measurement uses the distance between the camera and the camera to calculate the actual distance to the object to be measured.
Binocular stereo calibration is based on the above-mentioned binocular stereo vision [
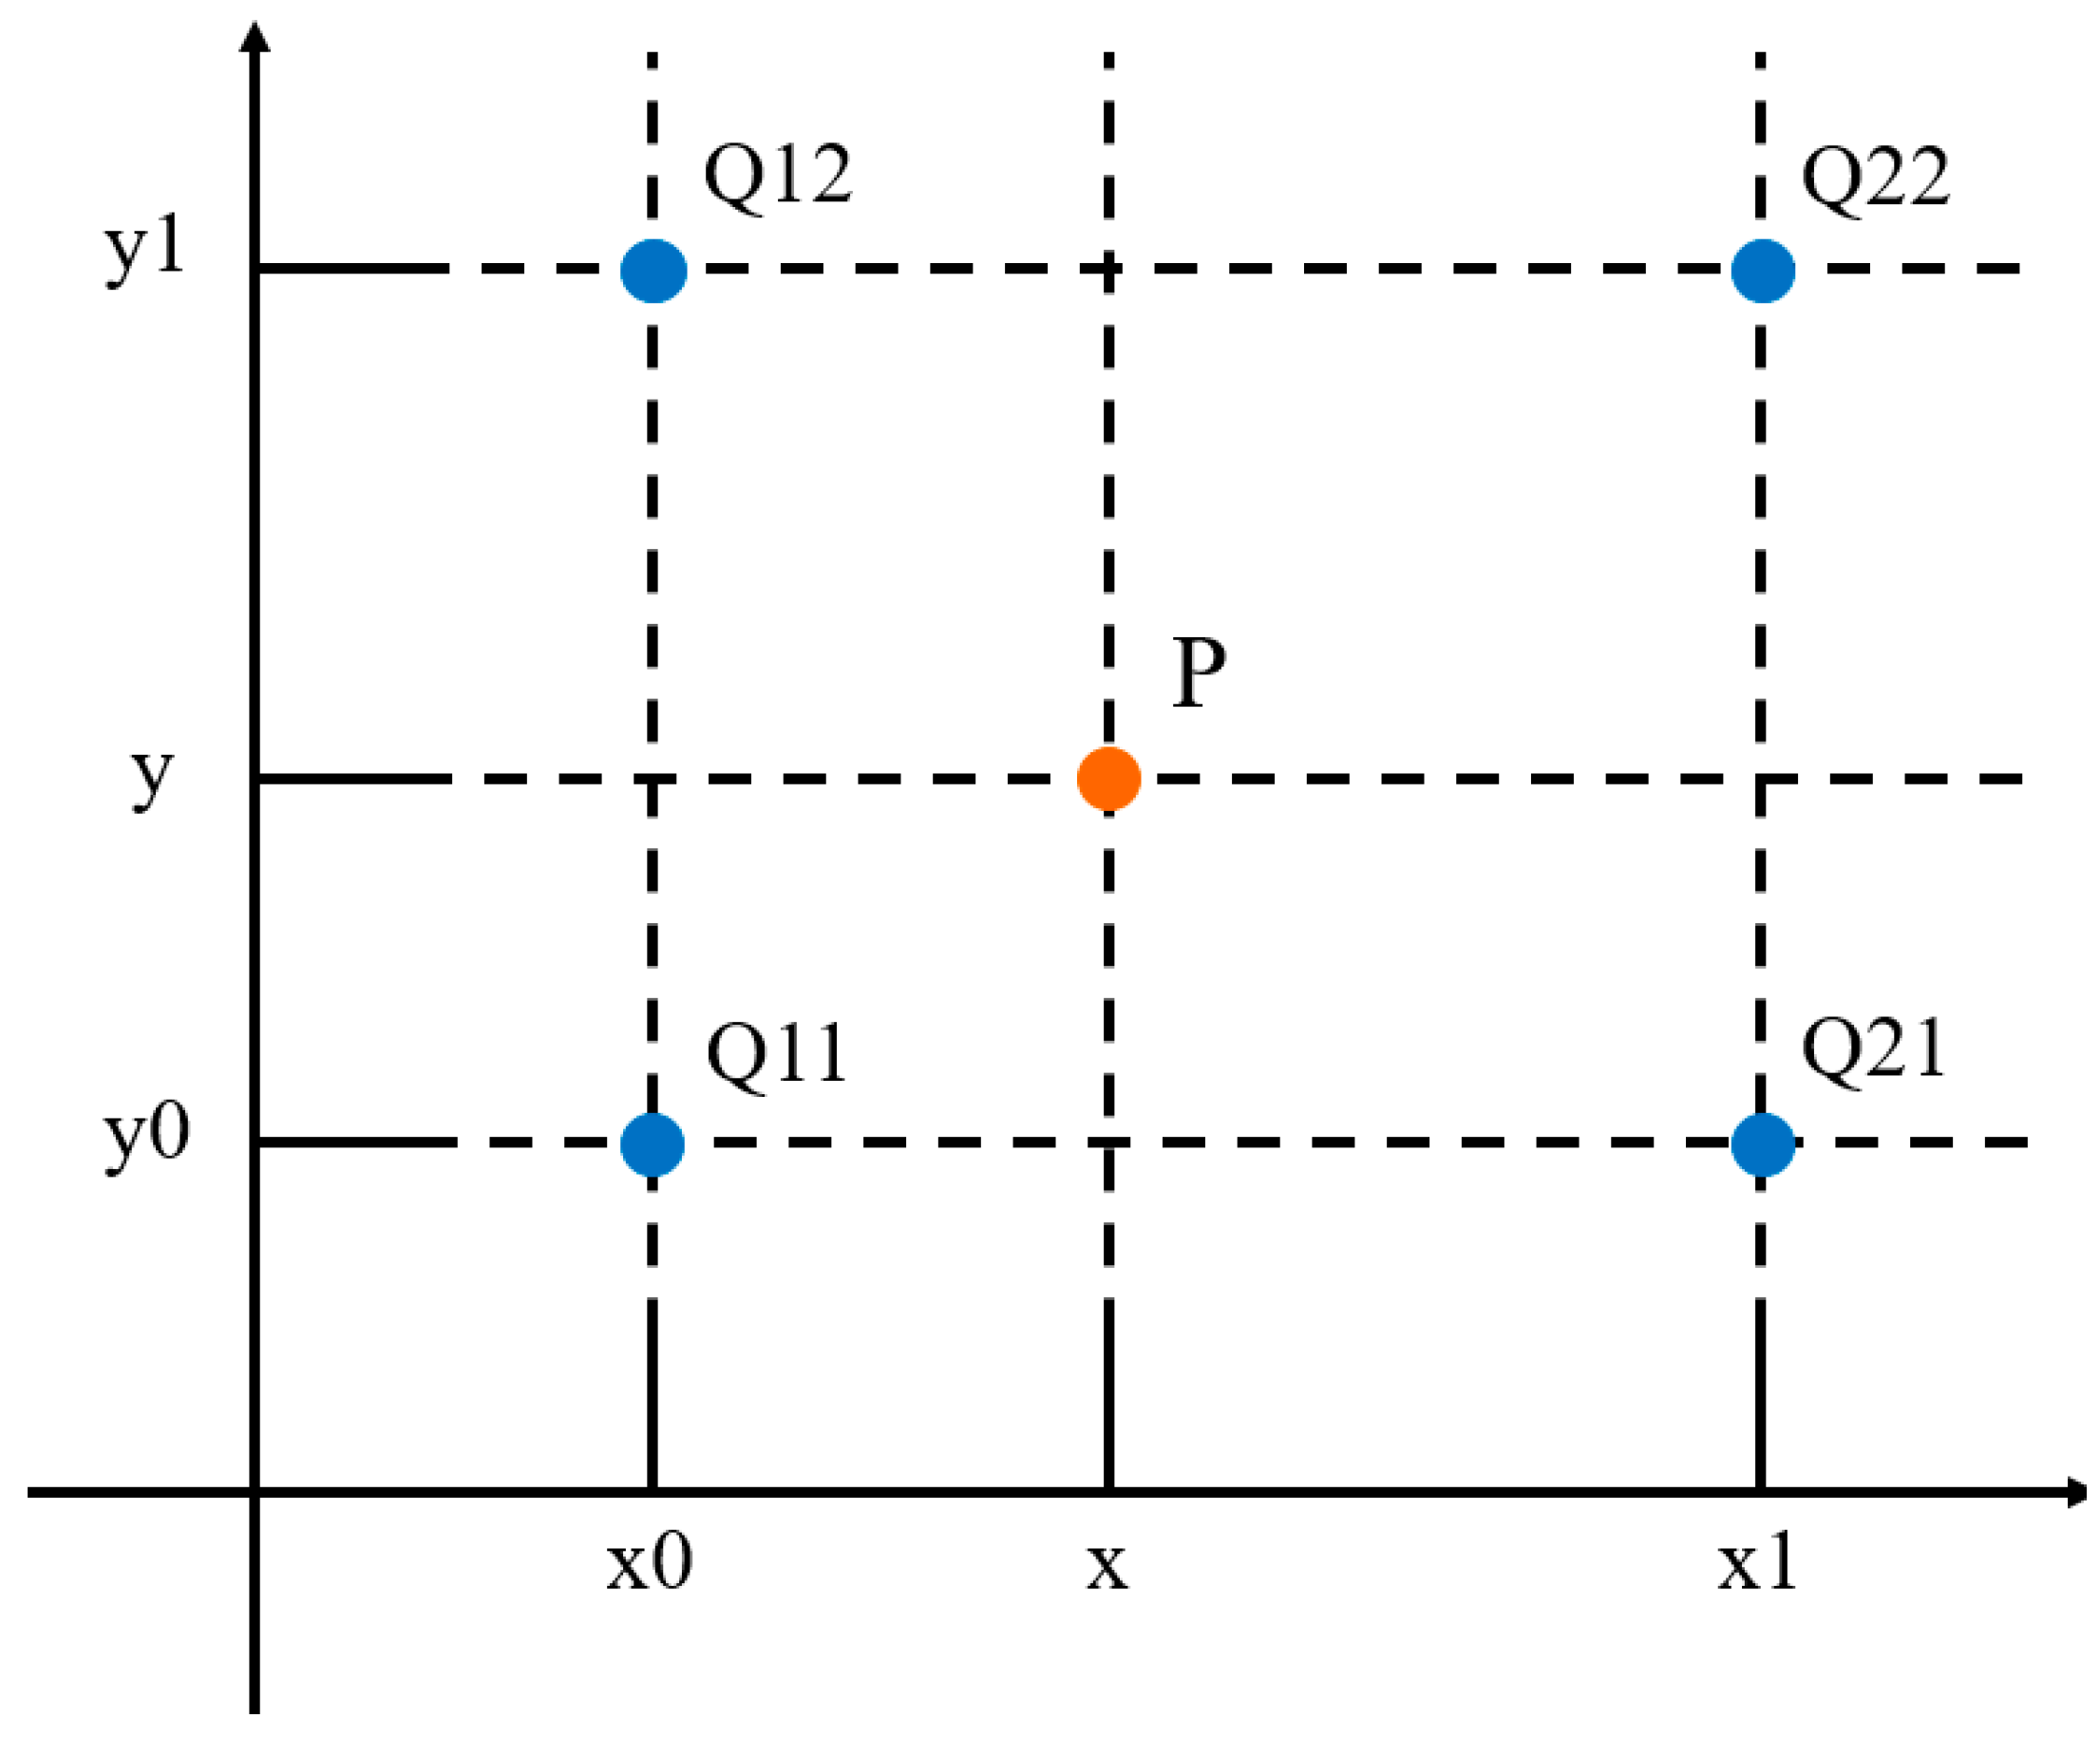
6]. However, the lens pixels of the depth camera and the thermal imager are different. It is necessary to increase the image pixels of the thermal imager through the image interpolation method to achieve the same pixel condition of the two cameras. and there is a way to perform binocular stereo calibration. Image interpolation can be divided into nearest-neighbor interpolation, bilinear interpolation, and bicubic interpolation in linear interpolation. The edge information-based and wavelet coefficient-based can be found in nonlinear interpolation. For measurement requirements, the fastest nearest-neighbor interpolation method can be selected [
7,
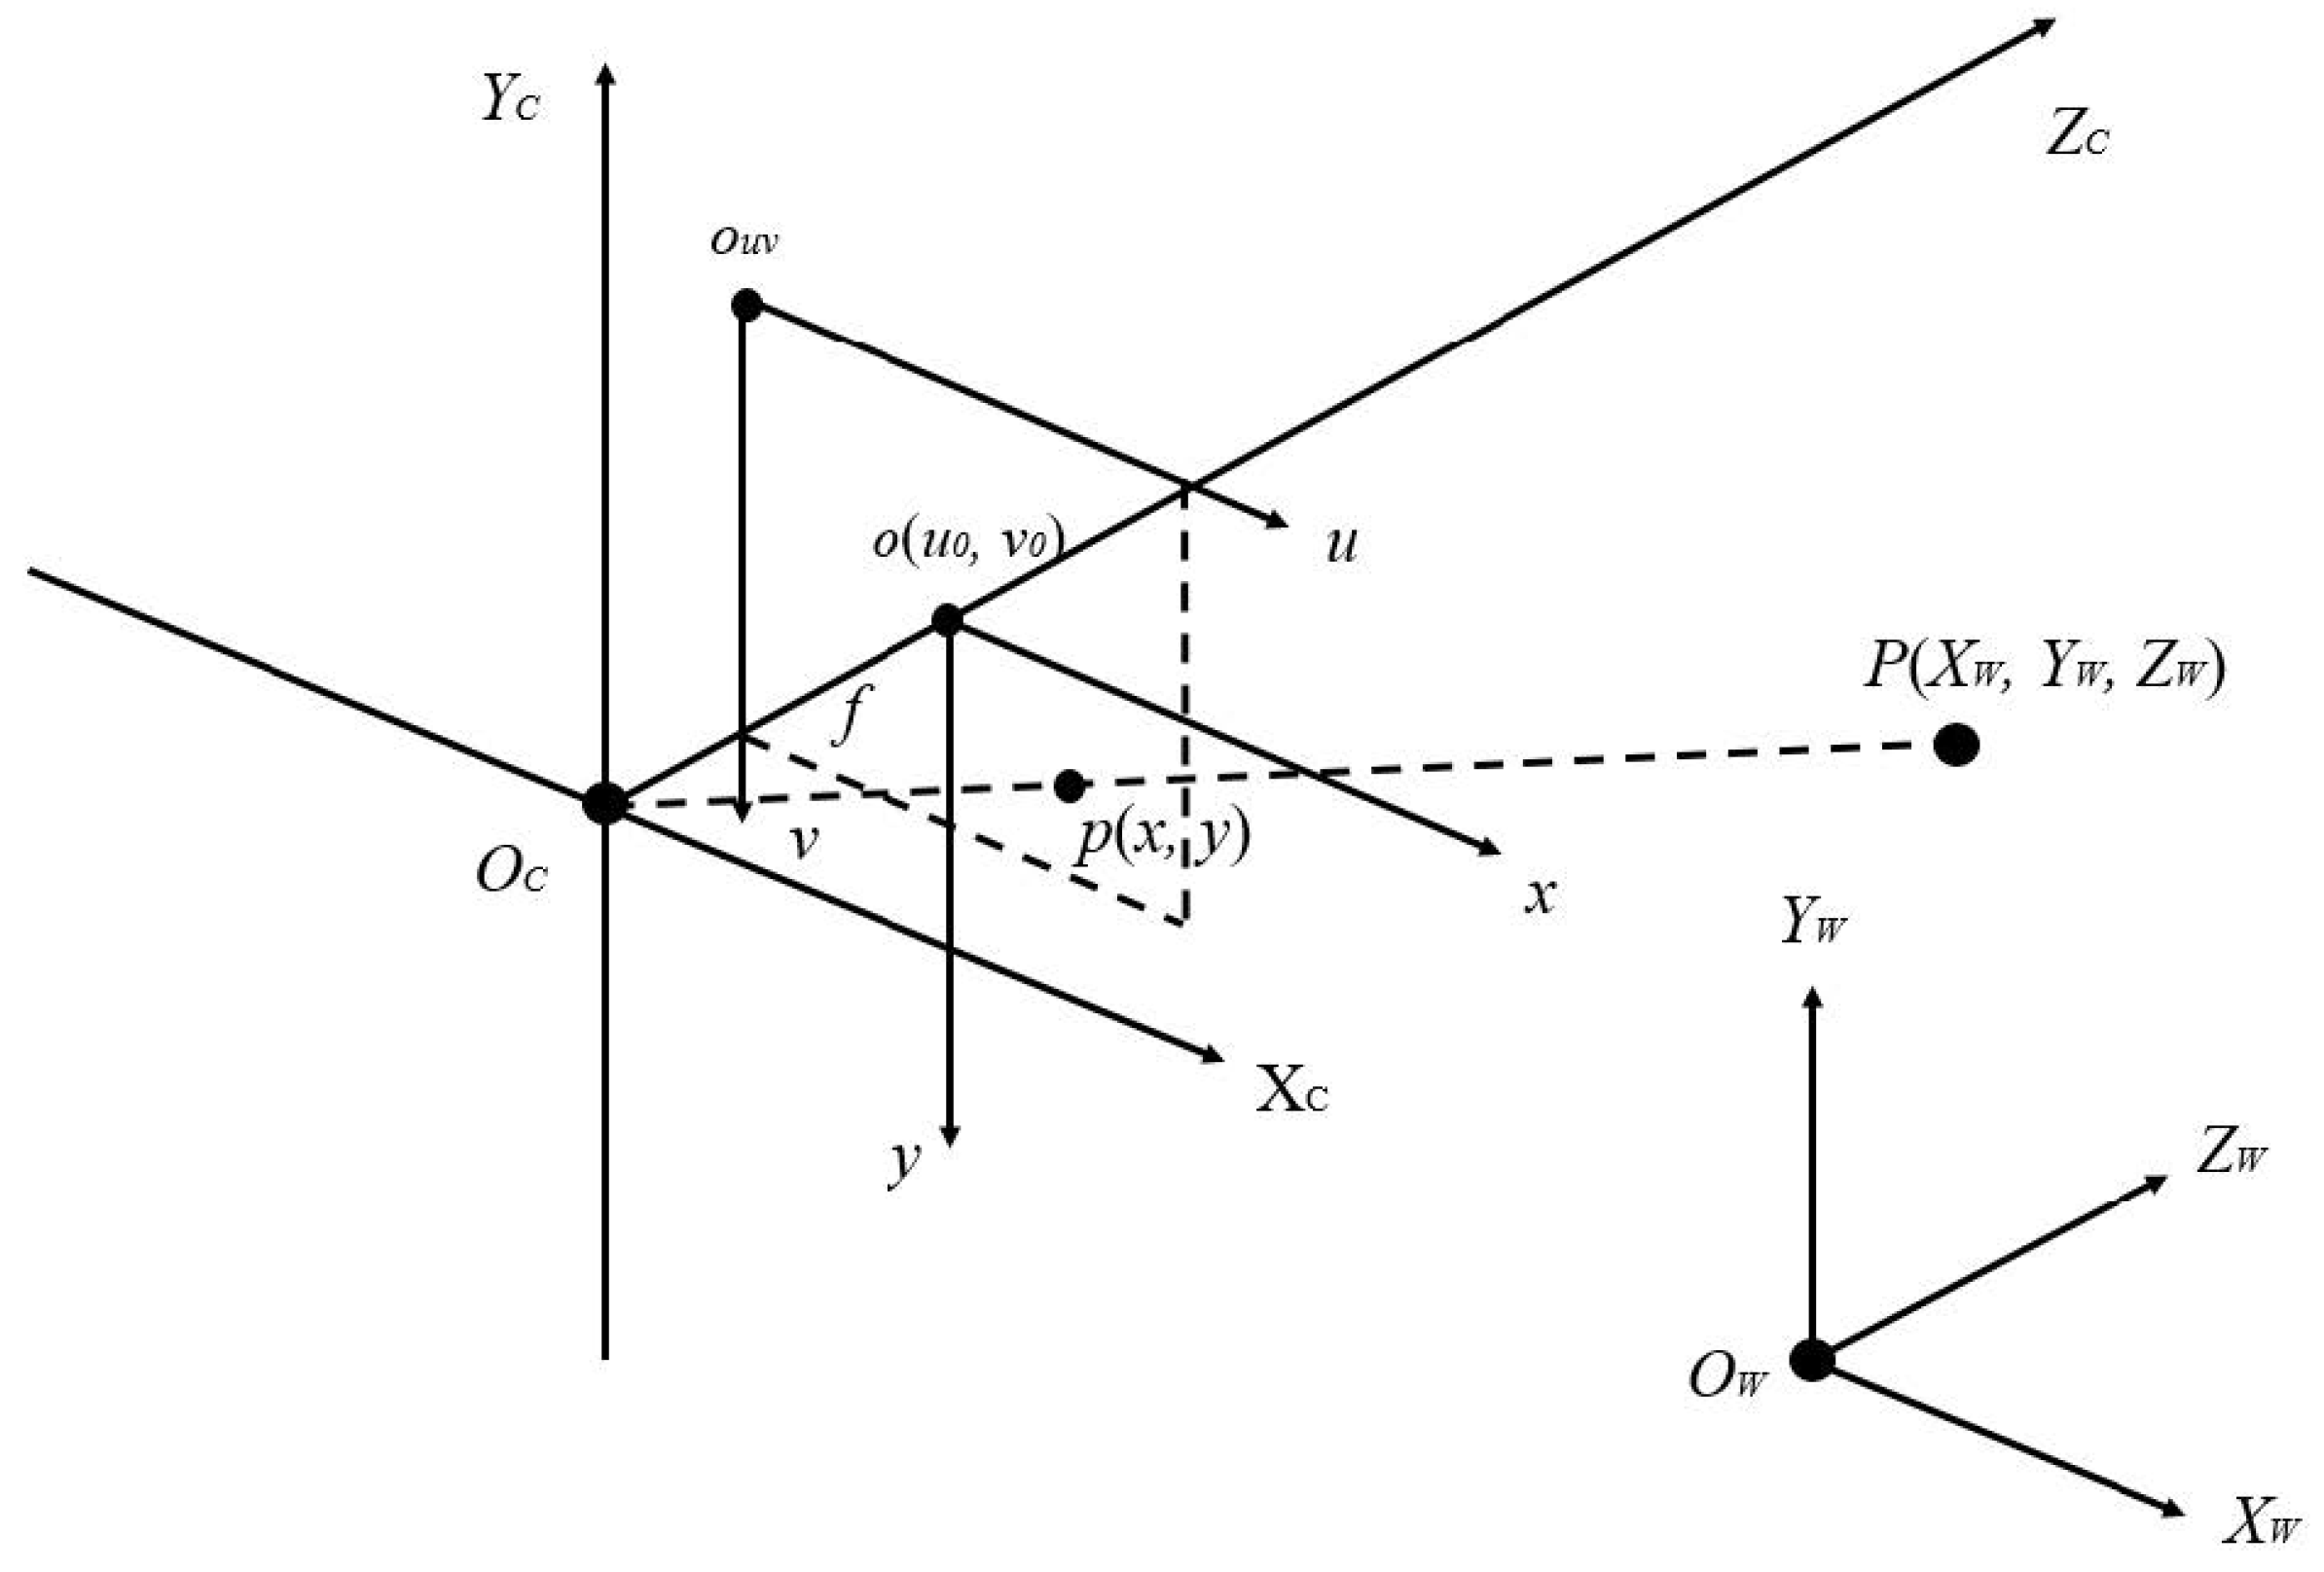
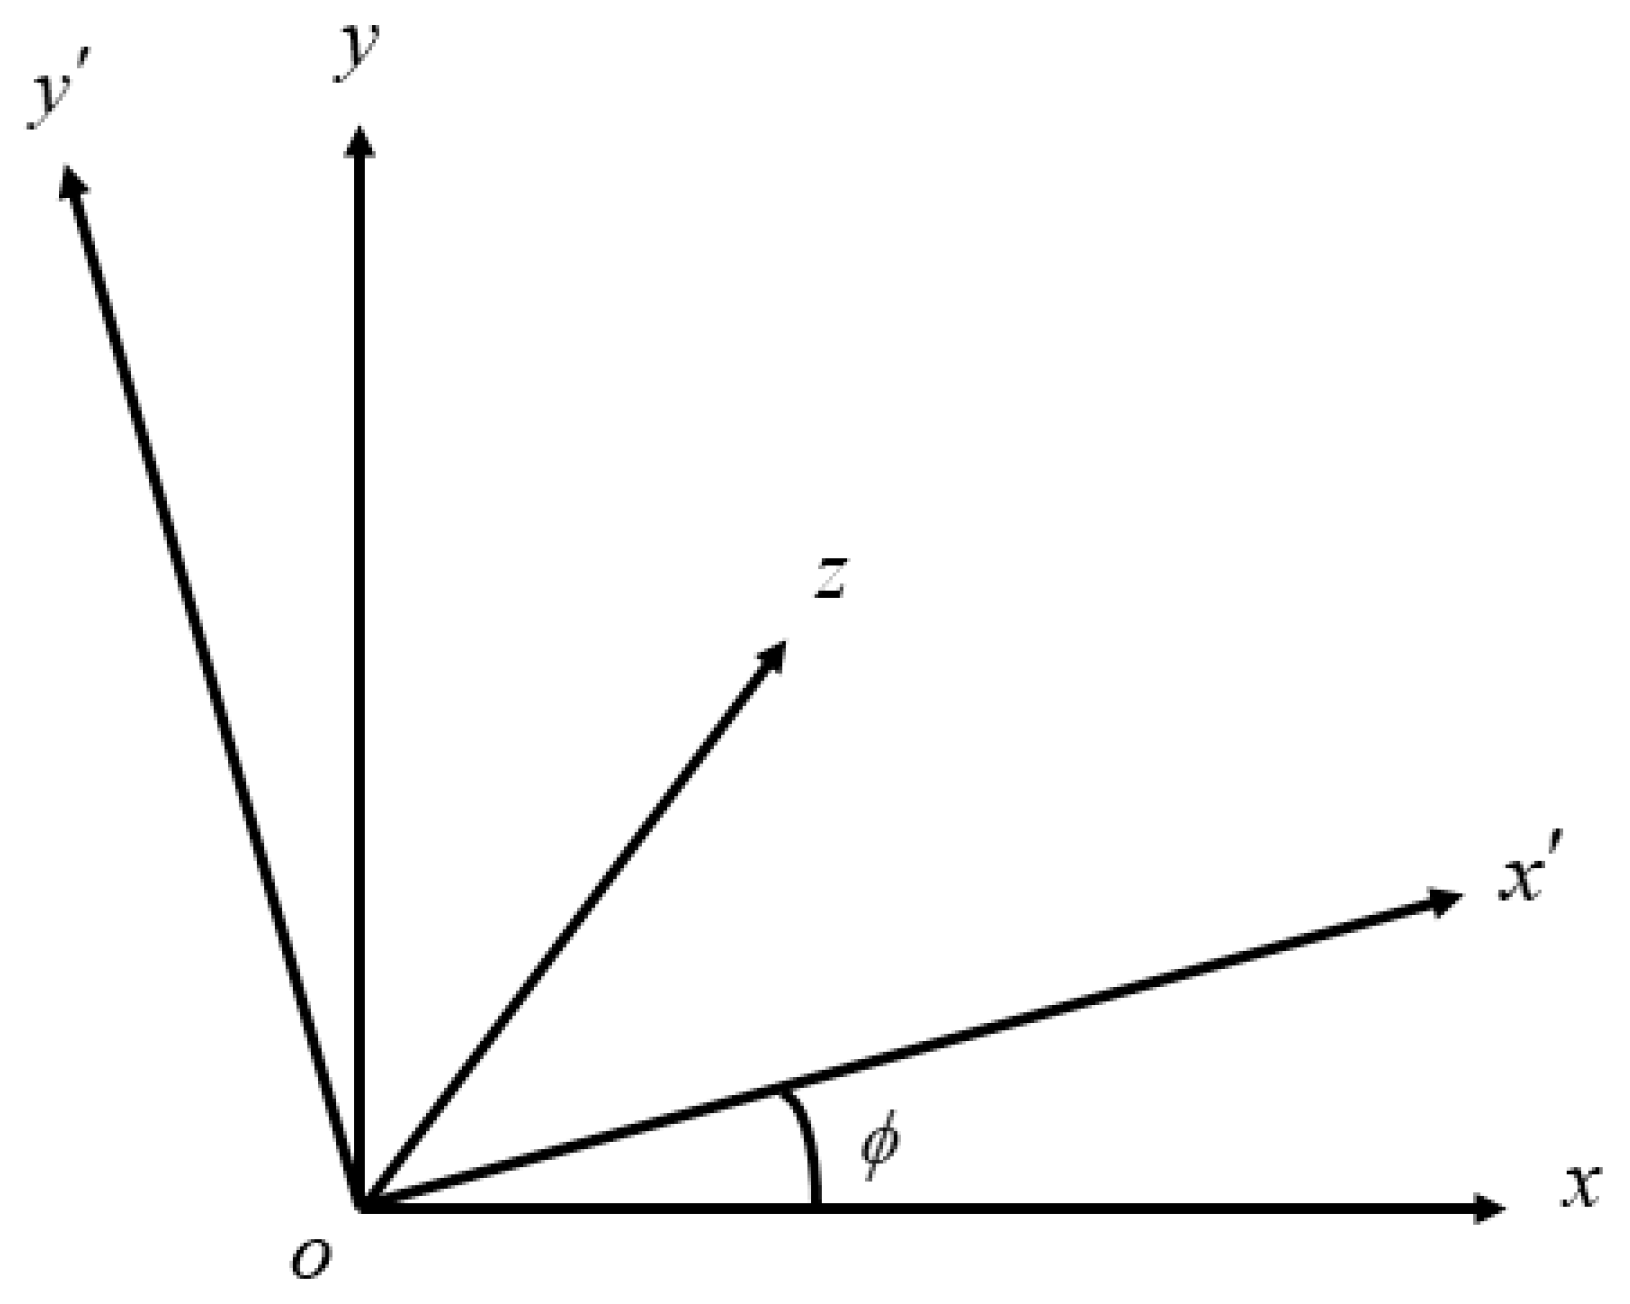
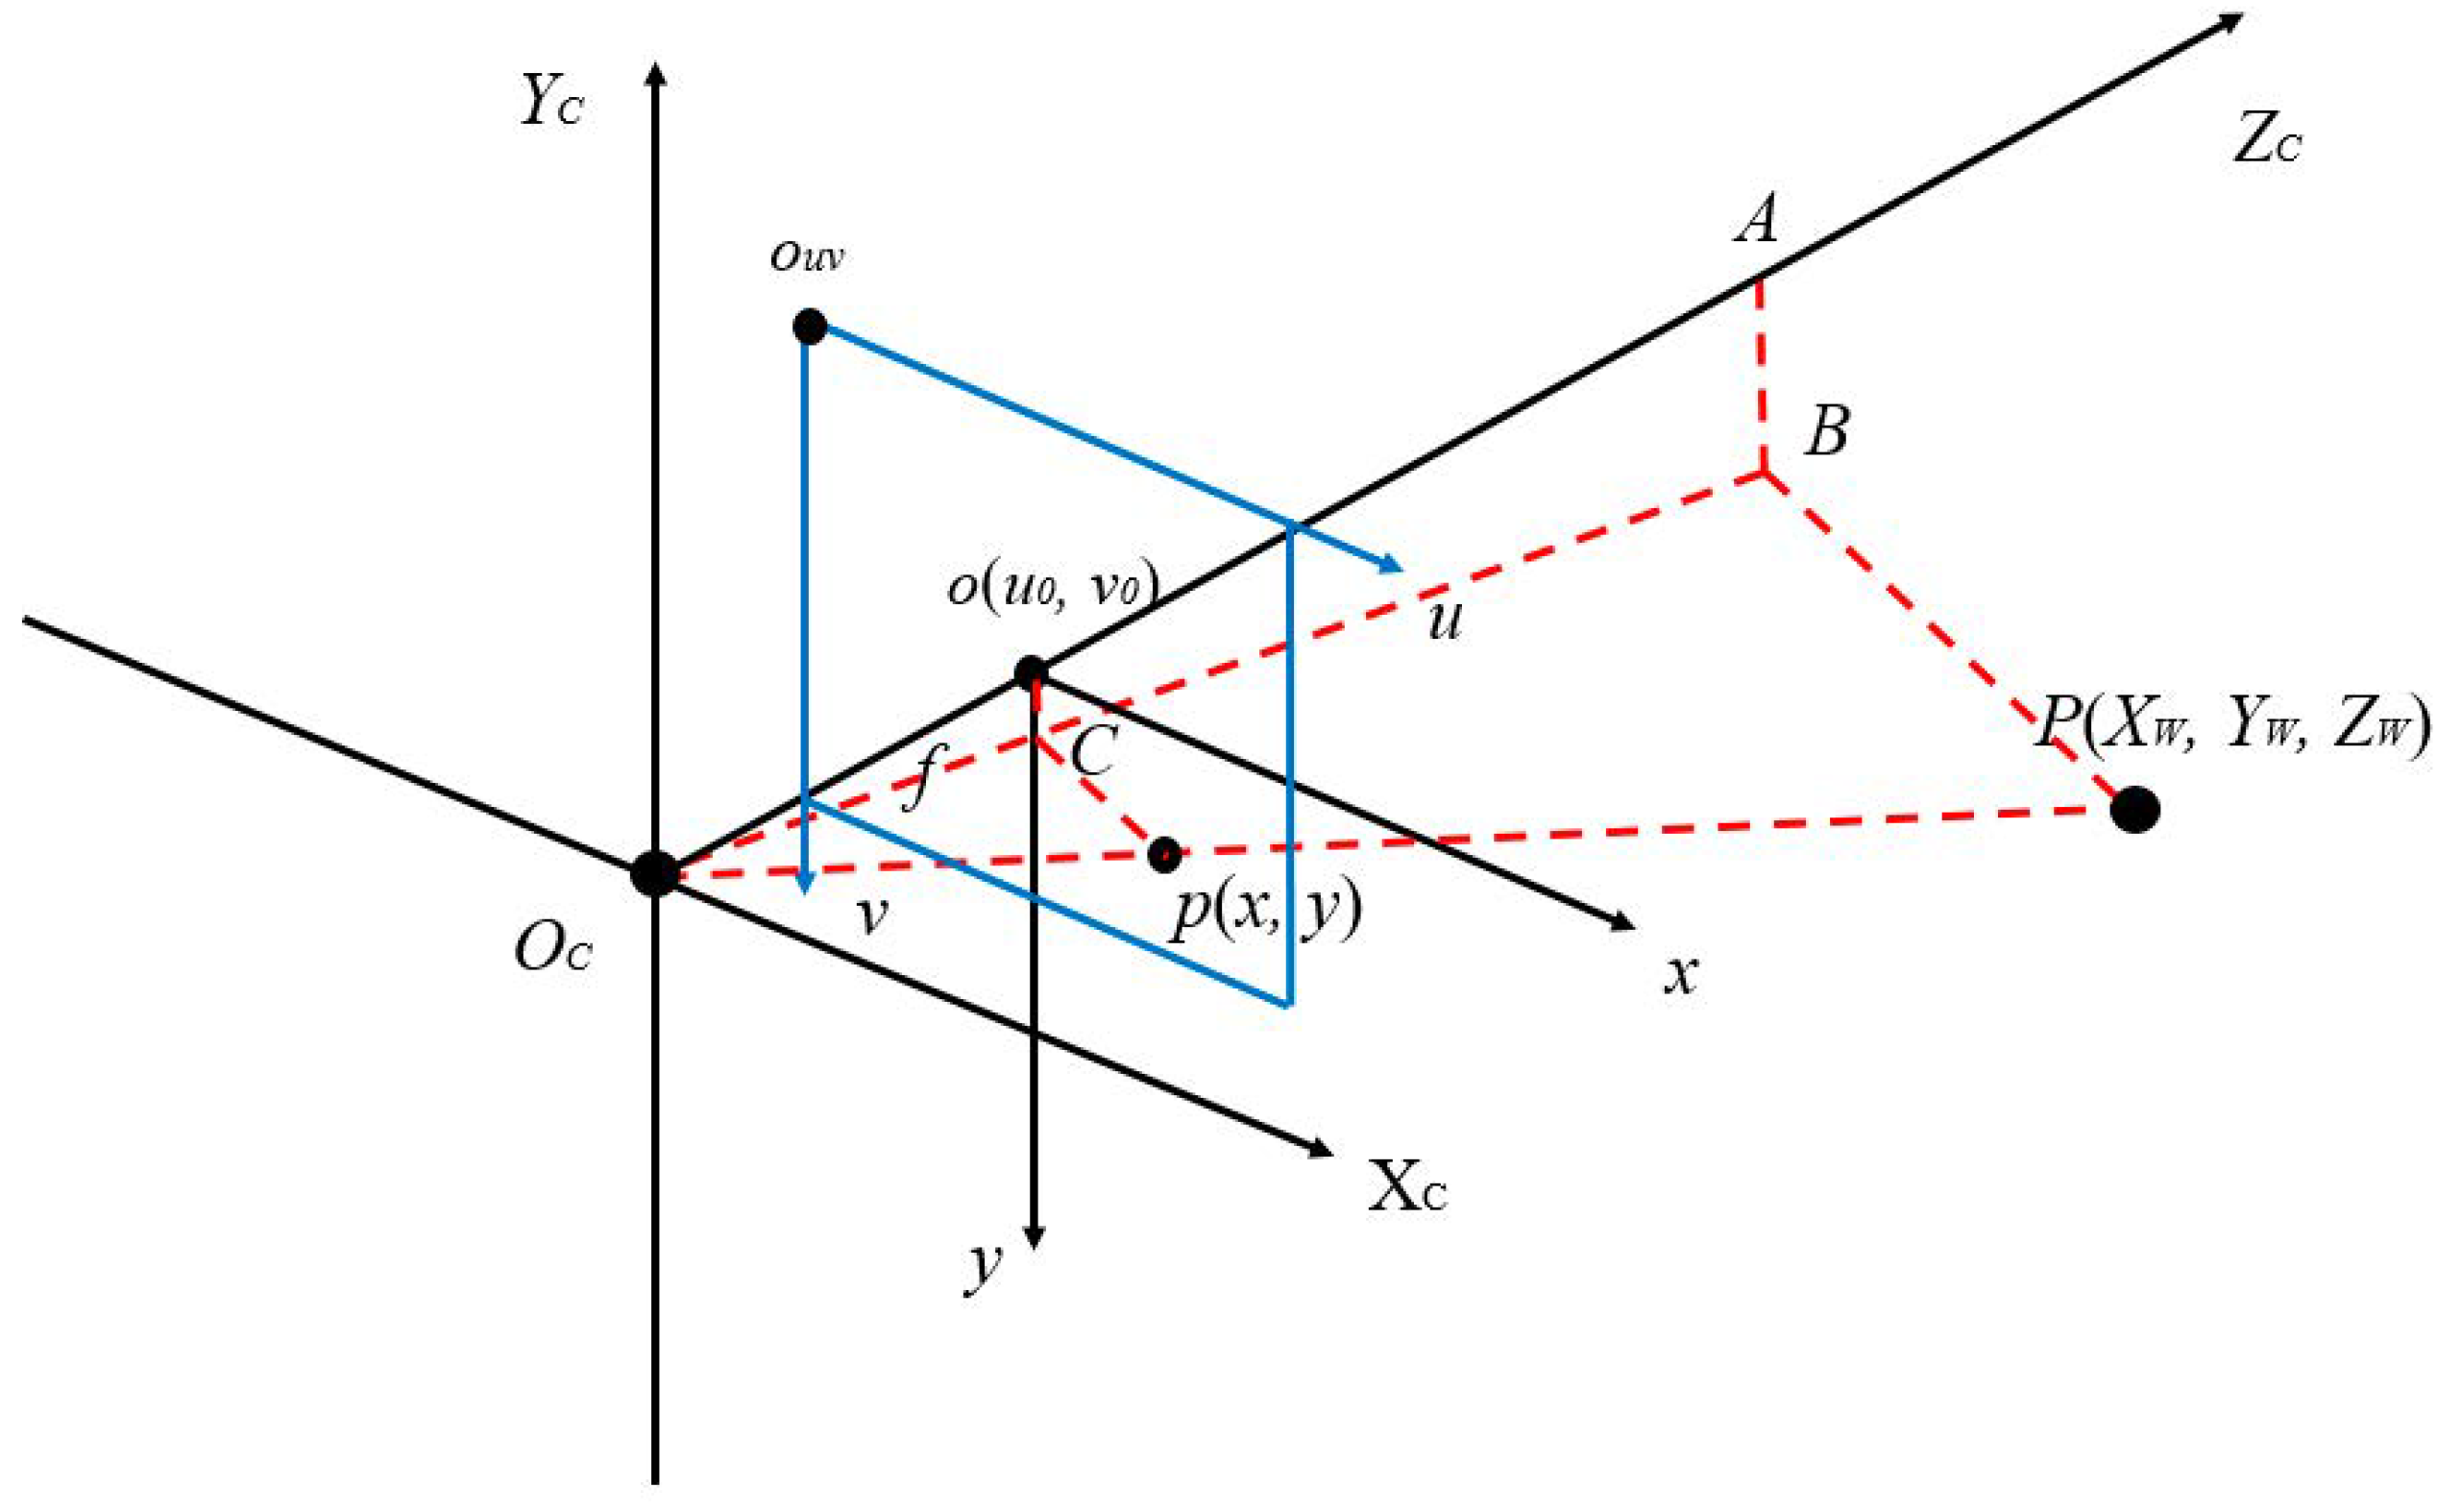
8]. In this study, based on the data of the depth distance being known, the world coordinate system of the image captured by the camera is projected back to the camera coordinate system, the image coordinate system, and finally to the pixel coordinate system. Through the analysis of corresponding coordinate systems, the relationship between the depth camera and the thermal imager can be obtained.
The temperature measurement of the thermal imager in this study is based on the theory of blackbody radiation. Blackbody radiation is the electromagnetic radiation emitted by a blackbody in a thermodynamic equilibrium state, and the spectrum emitted by blackbody radiation depends on the temperature. It is well known that the energy wavelength of blackbody radiation is only related to temperature. The electromagnetic radiation emitted by a black body at the same temperature is higher than that of other objects. However, black bodies do not exist in real life, and the radiation in ideal and real life conditions is different, but the relationship between temperature and frequency corresponding to the black body radiation theory still exists. In this study, through the characteristics of Planck’s black body radiation law and Stefan–Boltzmann’s law [
9,
10], the degradation compensation coefficient of the measured object and the lens machine was obtained [
11]. Take the black body radiant energy density whose wavelength is the independent variable as the measurement basis. By adding the wavelength-independent variable of the distance between the measured object and the lens, and adding the radiant energy density of the wavelength from vanadium oxide to germanium glass, the final measured temperature result can be obtained [
12,
13]. This study uses Planck’s law of blackbody radiation as the theoretical basis for thermal imaging, and extracts the far-infrared radiation information from the vanadium oxide sensing signal of each pixel in the thermal imager, and then converts it into temperature information. The attenuation of the far-infrared radiation wave during transmission is compensated by the Boltzmann constant and Planck’s black body radiation function [
14,
15].
The algorithm proposed in [
16] can be effectively used for outlier detection and initial motion estimation in the RANSAC loop. The method can effectively solve the problem of image offset during depth measurements, and can further correct the offset problem of 3D images, which is a very critical image preprocessing method. The method of [
17] can be used to solve more accurate 3D deformation, and to compensate for very complex environments such as underwater, polarized light, image distortion, light polarization, and other external influencing factors. This method can help this research to allow for the existence of more external imaging factors in future technological development, and ensure the conduct of the experiment.
In [
18], a more accurate and suitable image localization method in various situations is proposed, and to achieve higher accuracy than traditional methods. The method [
18] requires a small number of images for a short time to measure, which can be of great help for depth cameras. Especially, the frame rate of the depth camera reaches 60 fps, and through the technique of [
18], the distance and the object under testing can be more effectively corrected repeatedly. The method of [
18] can more effectively solve the problem when there is external environmental interference.
In a further in-depth discussion of the “object to be measured” purely based on the distance identification method, the method presented in [
19] overcomes many challenges in complex lighting conditions, glare, light refraction, motion blur, and many other special problems. Ref. [
19] provides Faster R-CNN, Cascade R-CNN, RetinaNet, YOLO-V3, CornerNet, and FCOS for image learning and comparison. It is an excellent solution for situations with a large number of images and a large amount of deformation of the object to be measured, as well as a large amount of glare or other factors that interfere with the measurement in the experimental environment. Since there are a large number of possible interference factors in the far-infrared radiation and the depth camera in this study when facing the object under test, the theory in this study will retain its possible assumptions, but the experimental environment must eliminate the above interference problems as much as possible.
In this study, the distance measurement experiment and distance compensation method will be carried out, and the distance of the camera will be verified at the same time by setting the temperature of the target as a constant in the experiment, measuring distances at different angles, and comparing the temperature differences before and after compensation. Among them are the original temperature of the contained vanadium oxide and the temperature of the target. The compensation method was carried out through the normal distribution of the error after the experiment. Through the compensation function obtained in this study, with more temperature data collection at different distances, the measured temperature at different distances can be effectively compensated, and a more accurate database analysis can be established. Through the proposed technology, it can be effectively used in an industrial safety inspection. Whether it is the capture of heat sources in indoor spaces or the control of product quality, the deep thermal imaging system proposed by this study can be used to overcome the temperature attenuation at different distances, and to measure the exact temperature of each point.
This research is mainly aimed at the limited hardware conditions of vanadium oxide and multi-vision depth cameras, and the proposed solution was also carried out with limited hardware resources. The main purpose was to conduct relevant research based on the equipment most used in the industry, rather than to carry out special experiments using special specifications or high-value equipment. Compared with the related literature studied in recent years, this paper can provide a contribution that can improve the regional temperature measurement in the stage of limited resources or periodic equipment replacement.
The outline of this paper is developed as follows.
Section 2 describes the hardware of the selected depth camera, and performs transformation operations on the coordinate system corresponding to the image distance, and at the same time calculates the center point of the image to be measured, and then obtains the function of distance compensation. In
Section 3, based on the hardware structure of the thermal imager, the temperature transfer function can be obtained according to Planck’s law of black body radiation and Stefan–Boltzmann’s law. In
Section 4, experimental results are given to verify the effect of the proposed method. Finally in
Section 5, concluding remarks are stated.
3. Long-wave Infrared Radiation Measurement and the Temperature Transfer Function
In this study, the thermal imaging vanadium oxide Lepton3 [
13,
14] produced by FLIR was selected as uncooled vanadium oxide. A plastic heating plate was used as the test object, and the main heating element was a brass thin plate. Considering that the thickness of the outer plastic plate is less than 0.5 mm, the emissivity of the plastic plate is difficult to be calculated [
21]. The Stefan–Boltzmann law was used to calculate the net rate of radiative heat exchange between a black body and the surrounding medium [
11]. However, for a surface that is not a black body, the radiation intensity of the spectrum does not completely follow the Planck distribution, and the radiation also radiates in a specific direction, so the Stefan–Boltzmann law of a non-black body can be given as
where
A is the surface area of the black body,
ε is the emissivity of the radiating surface,
σ is the Stefan-Boltzmann constant,
TS is the absolute temperature of the black body, and
TA is the absolute temperature of the surrounding medium. Emissivity is the ratio between surface emissivity and black body radiation at the same temperature. Material emissivity is generally between 0 and 1.0, with an ideal reflector having an emissivity of 0 and a black body emissivity of 1.0. Considering the material properties of emissivity, surface temperature, and smoothness, the emissivity of the test object in this study is 0.03. Note that the Stefan–Boltzmann constant is 5.67 × 10
−8 Js
−1 m
−2 K
−4.
The plastic heating plate of the test object in this study can be heated to a maximum temperature of 39 °C under a room temperature of 25 °C. Taking this into Wien’s displacement law [
15], the wavelength peak value can be obtained as
The sensitivity of the vanadium oxide used in this study is between 7000 and 14,000 nm, and when the Lepton radiation measurement mode is turned on, the 14-bit pixel value of the Lepton can remain stable. Since the radiation amount of the photosensitive band in vanadium oxide is linear, the image data provided by the thermal imager can also be linear. From the ambient temperature and the Planck curve, the output signal
S of the thermal imager can be obtained as
where
h is Planck’s constant,
c is the speed of light,
KB is the Boltzmann constant, and
TK is the absolute temperature. However, considering calculated in discrete data, (16) can be rewritten as
where
R,
B,
F, and
O are related parameters generated during calibration [
22].
In this study, this thermal imager vanadium oxide system effectively measures the object at a distance of 0.4 to 0.8 m from the camera for calibration, and measures 1 to 3 m with high gain compensation. Taking the average value of the ROI in the image, the original expected range of the parameters of
R,
B,
F, and
O can be analyzed [
23]. The value of the
F is usually 1, unless the measured range is high than the ambient temperature, and the value of the
B is 1428. The correction values for
R and
O are 231,160 and 6094.211 respectively. The target temperature
TT (temperature in degrees Celsius) for each frame can be obtained as
In this paper, the distance measurement experiment and distance compensation method was carried out, and the distance of the camera was verified at the same time, by setting the temperature of the target as a constant in the experiment, measuring distances at different angles, and comparing the temperature difference before and after compensation. Among them are the original temperature on the contained vanadium oxide and the temperature of the target. The compensation method was carried out through the normal distribution of the error after the experiment.
4. Experimental Analysis
Figure 9 shows the experimental setup. The FLIR development version of Lepton’s Uncooled Vox micro bolometer without the temperature calibration function was adopted, where the pixel size is 17 µm and the frames per second is 8.6 Hz. The thermal spectral range in longwave infrared was 8 µm to 14 µm. Temperature accuracy was in the temperature range of −10 °C to 140 °C. Thermal sensitivity was less than 50 mK. For shuttered configurations, the shutter assembly periodically blocks radiation from the scene and presents a uniform thermal signal to the sensor array, allowing an update to internal correction terms used to improve image quality. For applications in which there is little to no movement of the Lepton camera relative to the scene, the shutter assembly is recommended. The shutter assembly is less essential, although still capable of providing slight improvement to image quality, particularly at start-up or the ambient temperature varying rapidly. The shutter was also used as a reference for improved radiometric performance.
Figure 10 shows the normalized response as a function of signal wavelength for the vanadium oxide array for each pixel.
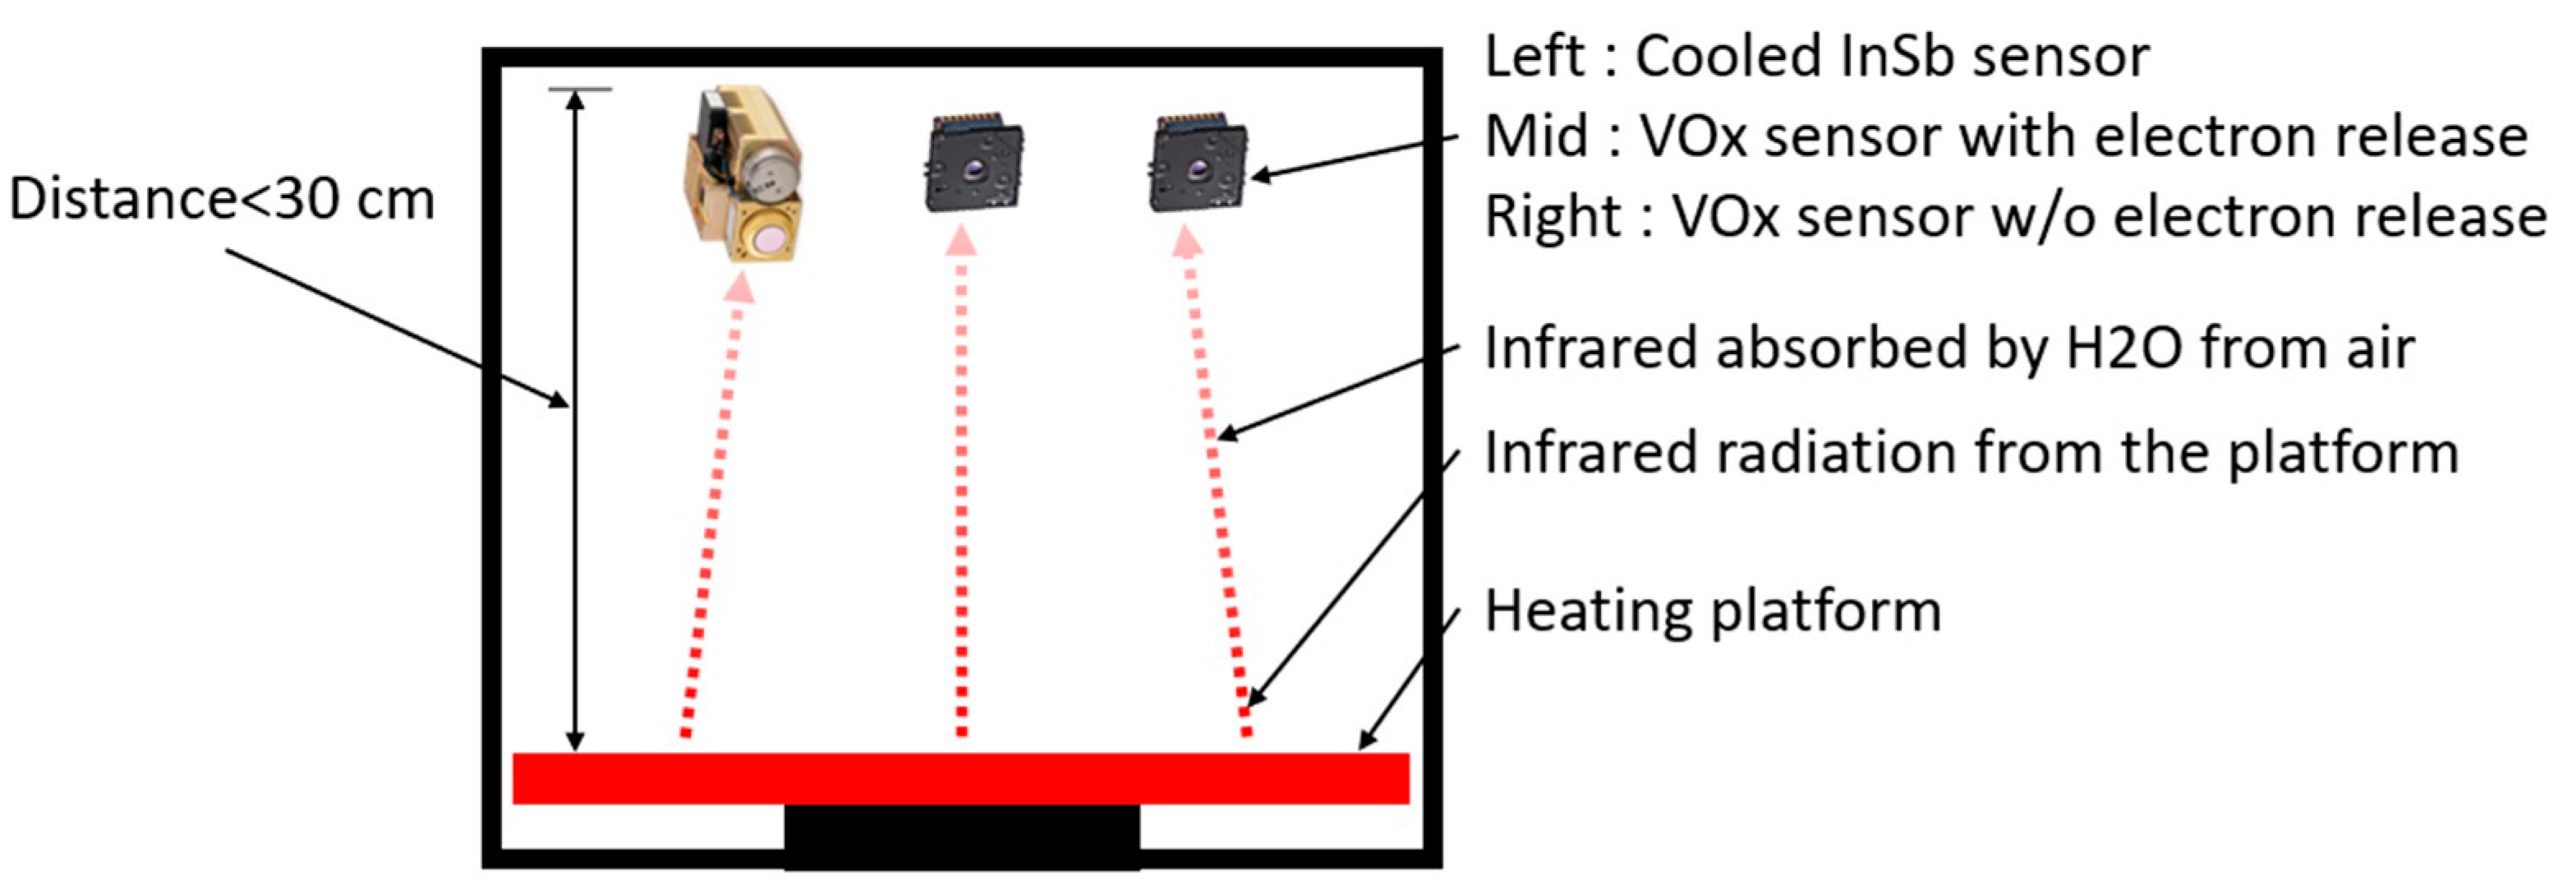
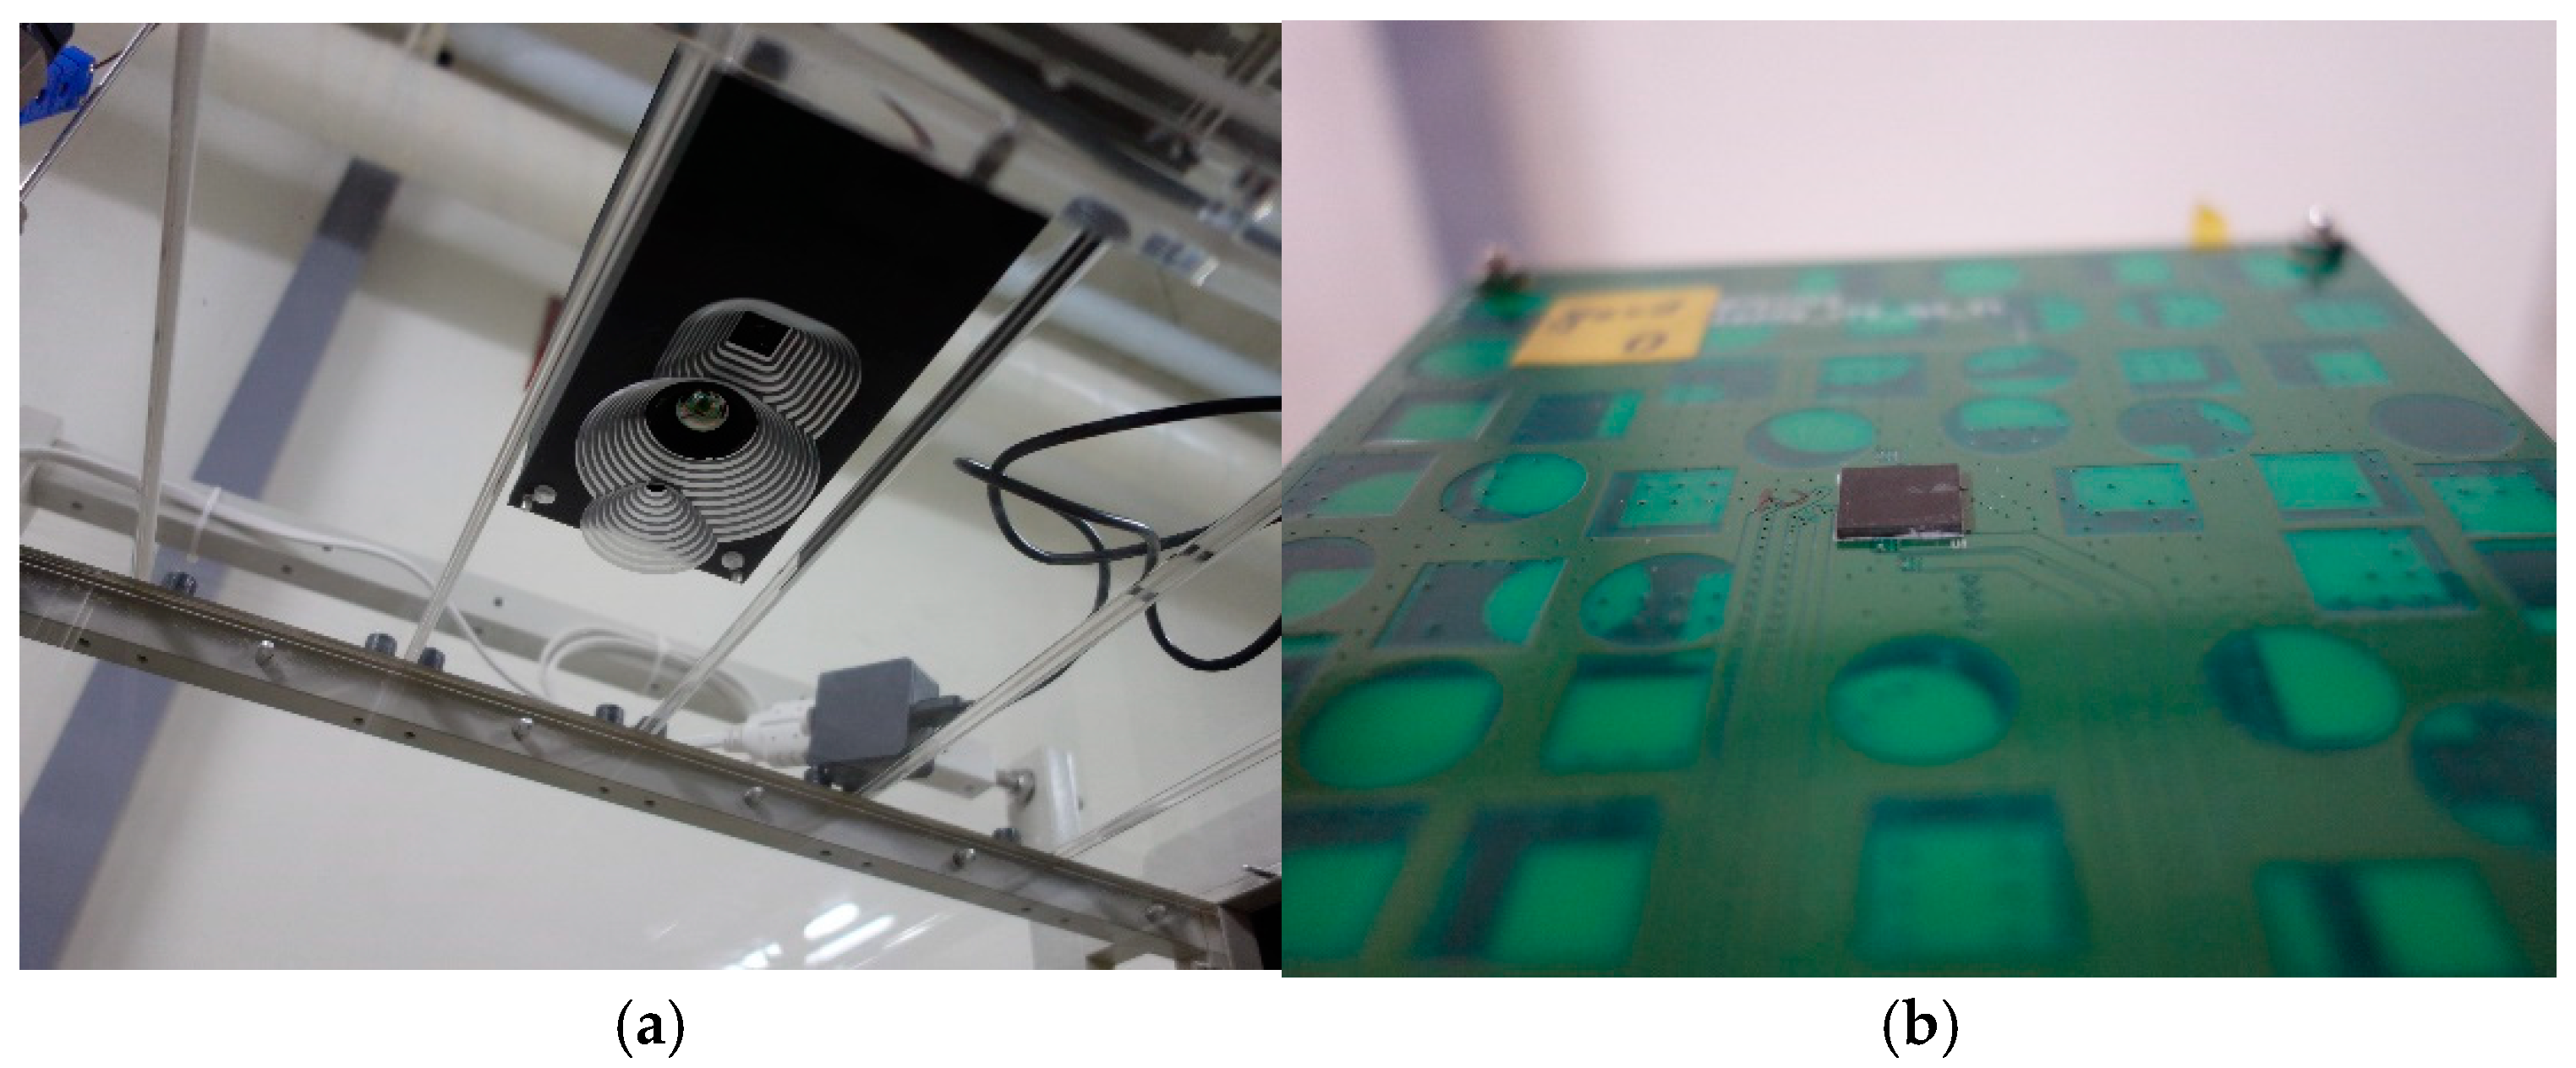
In this study, a confined space was used and the vanadium oxide sensor was placed on the top as shown in
Figure 11. The environment was not a vacuum but was an airtight environment, approaching the state of air molecules that are static and non-flowing. The surface of the circuit board was the chip mount and the chip to be tested, and the temperature sensor and other sensors were installed on the back. The bottom surface was a heating platform, and the infrared radiation of the heating platform was used for measurement. Because this enclosed space is not a vacuum during the measurement process, the infrared radiation can be absorbed by water molecules in the air. To reduce errors, the distance from the sensor to the platform should be smaller than 30 cm.
Through the proposed binocular vision integration, the overlapping images of the depth camera and the thermal imager were taken out to obtain the measurement center of the image. The image of
Figure 12a was obtained by the visible camera, where the 445 datapoints were recorded. The image of
Figure 12b was provided by the depth camera, where the distance of 1.5 m to the center point can be obtained. The black color area shows that the distance position cannot be located at the moment. The light blue part is the protrusion of the flat-panel heater protrusions.
Figure 12c is an image of the thermal imager, where the numerical value of 30,141.5 is represented by
Kelvin degree.
The environmental conditions of the study were room temperature of 25 °C and humidity of 50%. The target object was a heating plate with a constant temperature of 39 °C. The reason why 39 degrees Celsius was selected as the constant test temperature is that the temperature change of 39 degrees Celsius is more constant and stable according to the change between the ambient temperature and the test panel. In addition, the vanadium oxide sensor used in this study has a low-gain data output between 25 degrees Celsius and 55 degrees Celsius, and therefore measurement accuracy will be higher, and it will be more helpful to the experiment. The main variables in this study are distance and vanadium oxide temperature. Therefore, the temperature of the tested body was selected that had the least influence on the overall experiment.
The temperature data at different distances can be obtained by adjusting the distance between the depth camera and the test object. We set five differential distances, i.e., 0.5, 1.0, 1.5, 2.0, 2.5 m, as the distance references. The collected data of the thermal imager were used to observe the influence of the vanadium oxide temperature on the actual temperature measurement. Note that 6000 pieces of data were obtained at each distance, and the actual temperature of the vanadium oxide was extracted for analysis.
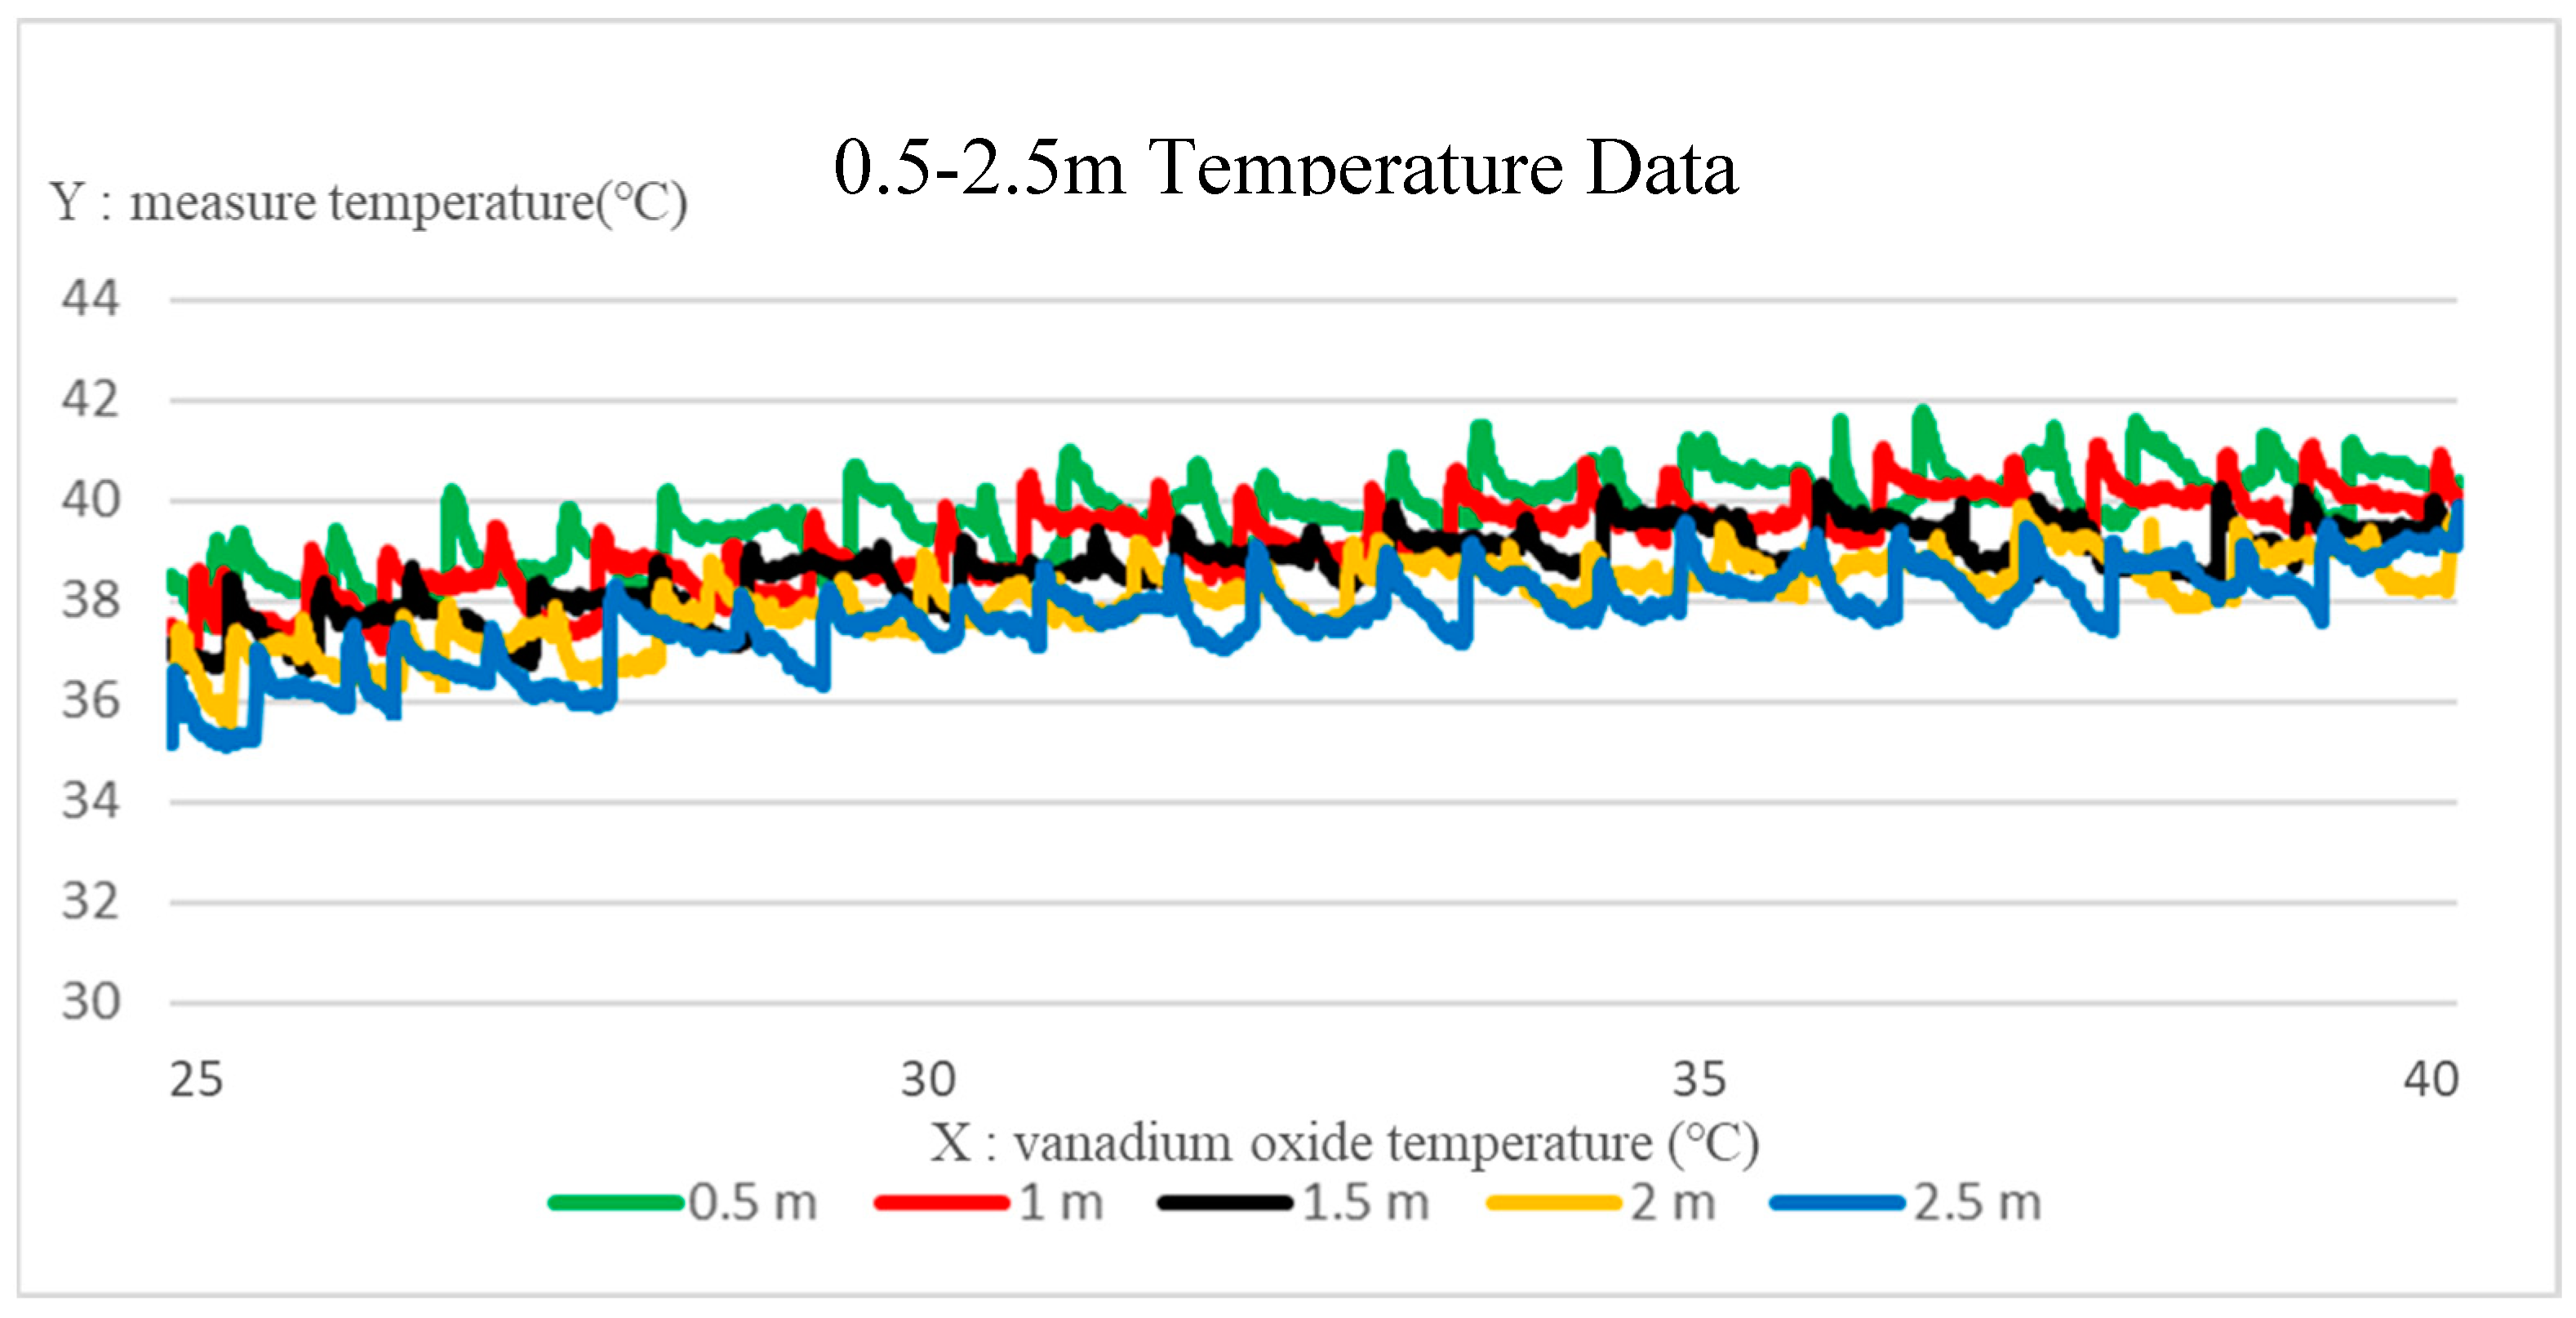
Figure 13 is a comparison of the temperature data collected by the deep thermal imaging system at a distance of 0.5~2.5 m from the target object. The
x-axis is the selected vanadium oxide temperature range of 25~40 °C, and the
y-axis is the actual measured temperature. It can be found that the temperature is inversely proportional to the increase in the distance. Taking the target object at 39 °C, the compensation was performed for the temperature data difference at each distance, where the compensation functions of the distance at 0.5–2.5 m are given as (20). Through the obtained compensation Equation (20), the compensation results of the depth thermal imaging system at various distances can be shown in
Figure 14.
As shown in
Table 1, the temperatures of the vanadium oxide being 25–40 °C, the actual measured temperatures for varying vanadium oxide temperatures at a distance of 0.5 m are given. The average temperature is 39.986 °C, and the error is close to 0.035%.
As shown in
Table 2, at the temperatures of the vanadium oxide being 25–40 °C, the actual measured temperatures for varying vanadium oxide temperatures at a distance of 1.0 m are given. The average temperature is 39.039 °C, and the error is about 0.1%.
As shown in
Table 3, at the temperatures of the vanadium oxide being 25–40 °C, the actual measured temperatures for varying vanadium oxide temperatures at a distance of 1.5 m are given. The average temperature is 39.013 °C, and the error is about 0.033%.
As shown in
Table 4, at the temperatures of the vanadium oxide being 25–40 °C, the actual temperature values measured for each vanadium oxide temperature at a distance of 2.0 m are averaged, and the temperature numerical errors are all between 39 ± 0.3, The total average temperature is 39.010 °C, and the error value is only 0.026%.
As shown in
Table 5, the temperatures of the vanadium oxide being 25–40 °C, the actual measured temperatures for varying vanadium oxide temperatures at a distance of 2.5 m are given. The average temperature is 39.022 °C, and the error is only 0.056%.
From the results, it can be clearly seen that the actual measured temperature at each distance is proportional to the temperature of the thermal image vanadium oxide, while the actual measured temperature is inversely proportional to the distance of the test object. By the proposed compensation function at each distance, the compensation temperature at varying vanadium oxide temperatures can be obtained. As shown in
Table 6, the errors between the average temperature at each distance and the constant temperature of the target object at 39 °C are all less than 0.1%.
