
Simultaneous Multiplexed Quantification of Banned Sudan Dyes Using Surface Enhanced Raman Scattering and Chemometrics

 , , ,
, , ,
Abstract
1. Introduction
2. Materials and Methods
2.1. Chemicals and Solvents
2.2. Preparation of Citrate-Reduced Gold Colloid
2.3. Preparation of Sudan Dye Solutions
2.4. SERS Measurements
2.5. Data Analysis
- (i)
- Four separate PLS-R models (based on PLS1) were generated to predict each of the four dyes in the quadruplex individually. A single output Y-variable encoded the concentration of the dye in each of the PLS models.
- (ii)
- A single PLS-R model was generated to predict all four dyes simultaneously where 4 outputs (Y-data) were used (in PLS2) to encode the concentration of each of the 4 dyes in the quadruplex mixtures.
3. Results and Discussion
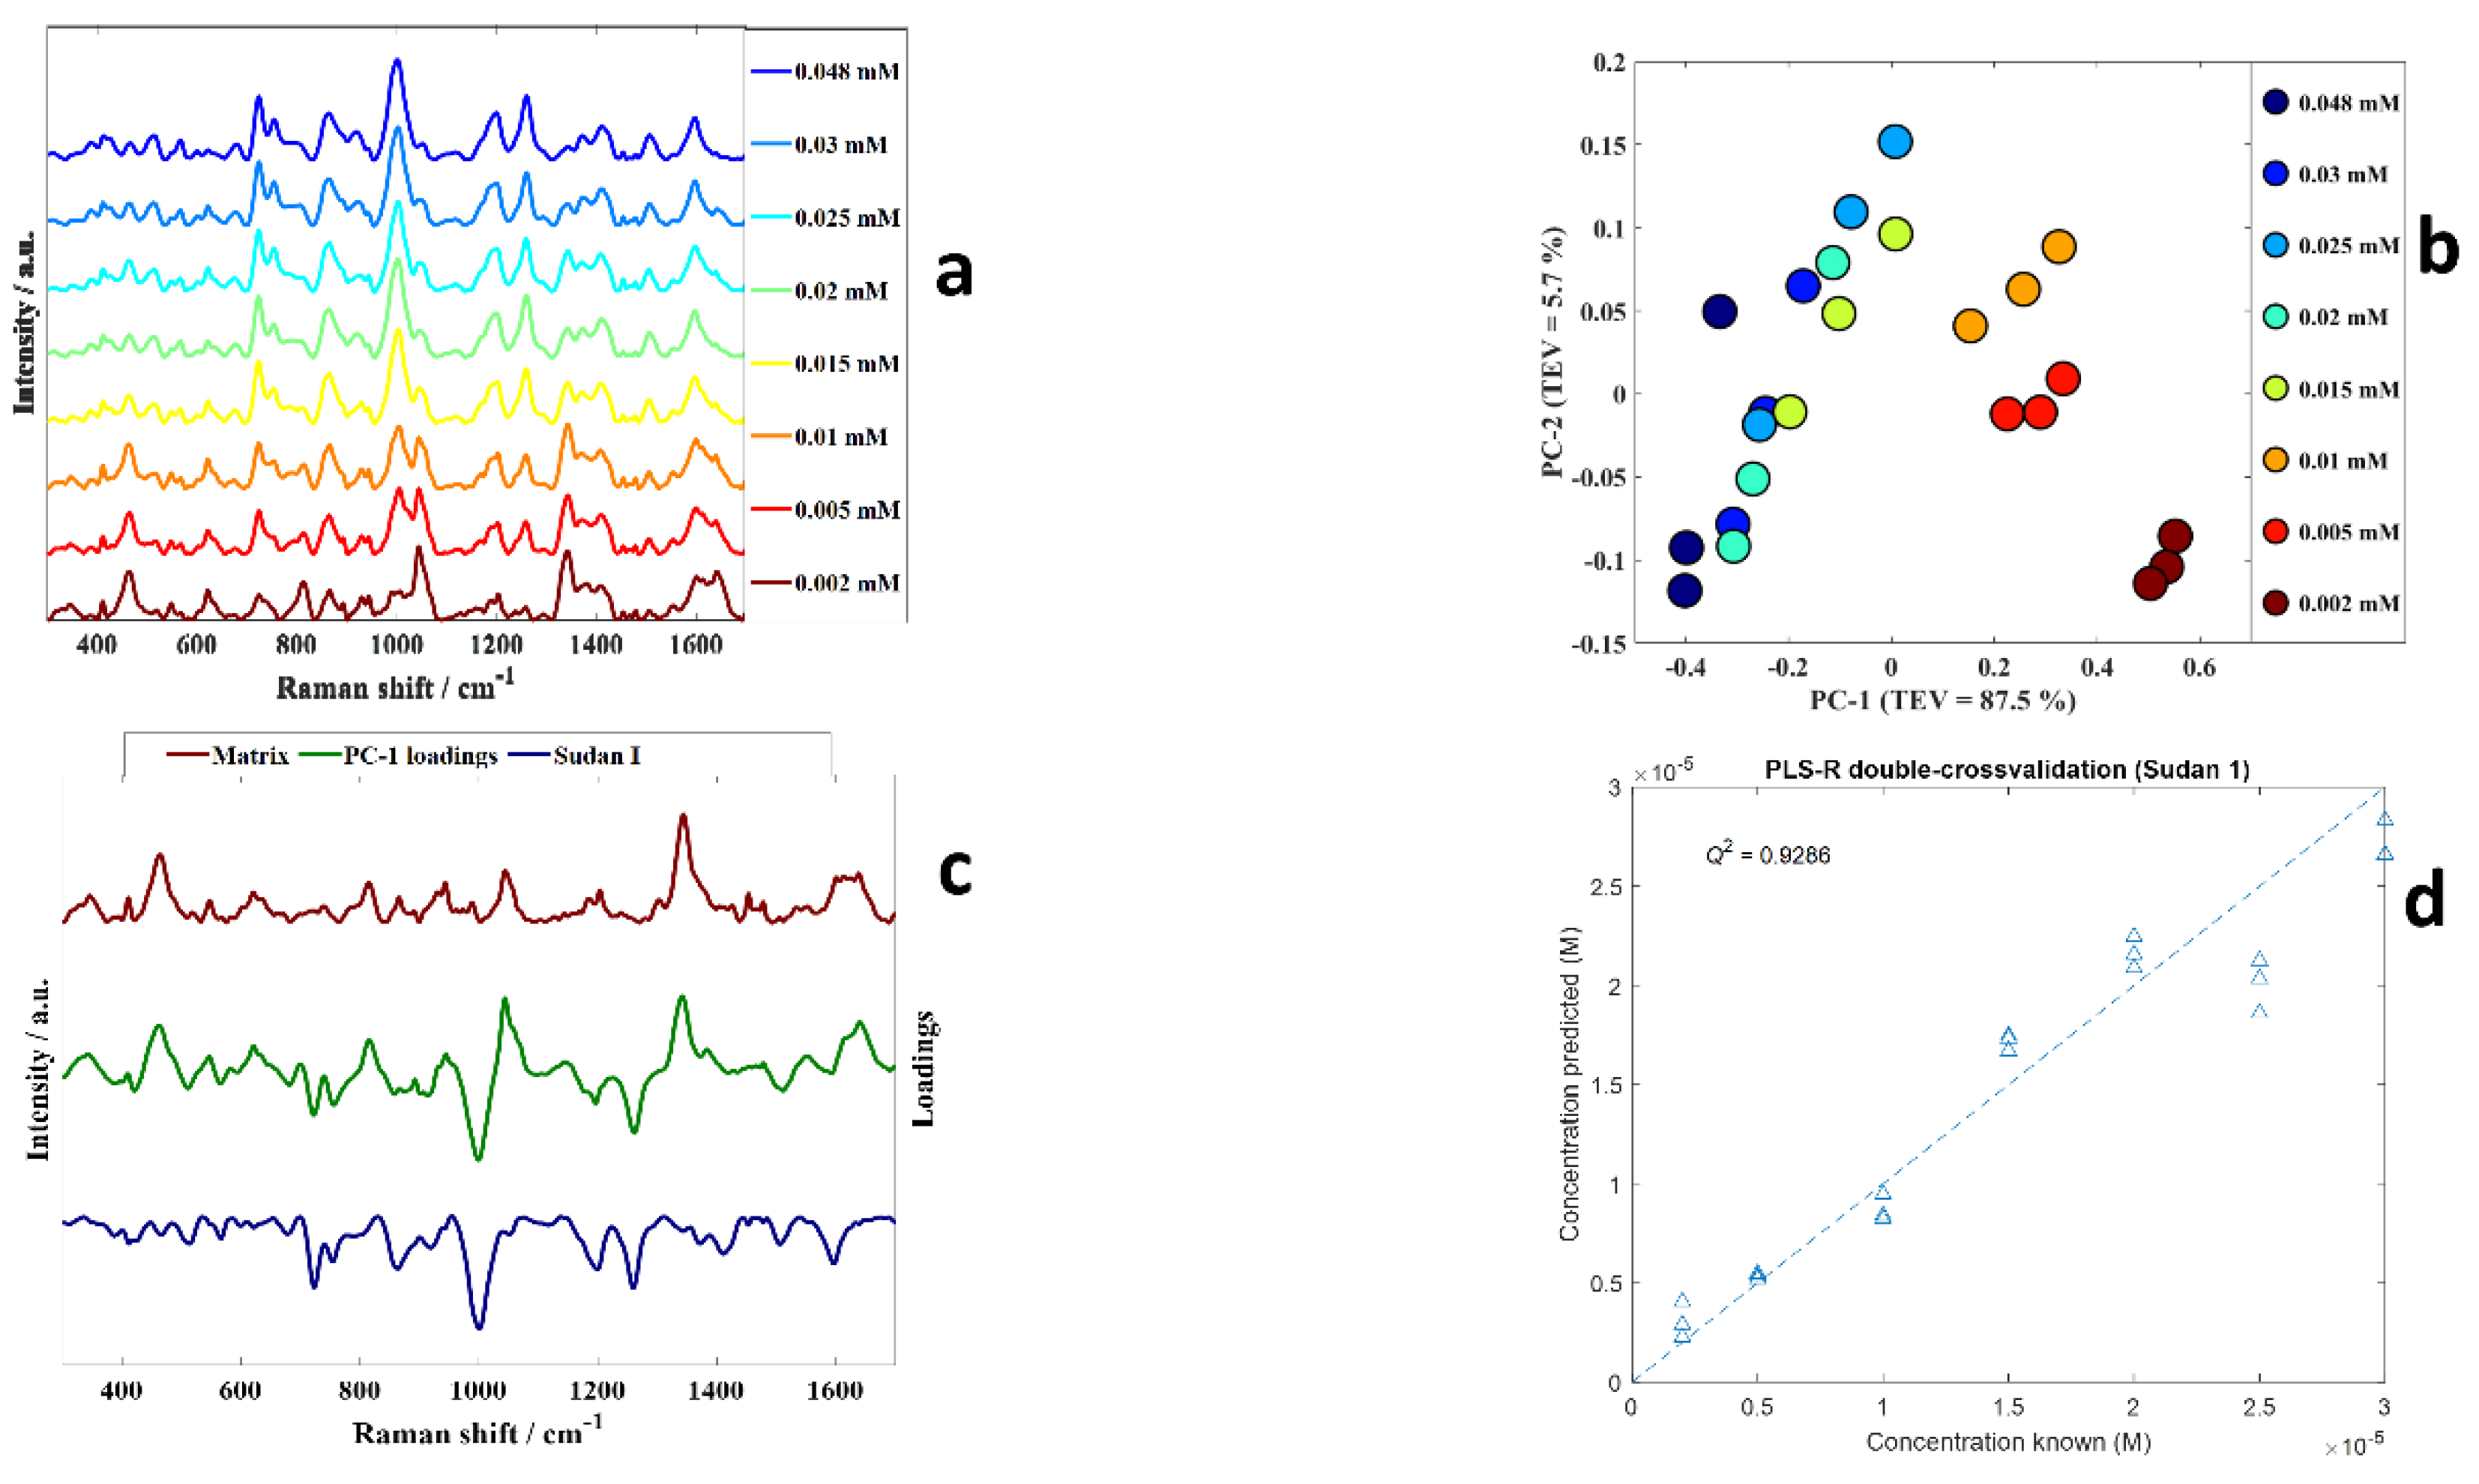
3.1. Quantification of Individual Sudan Dyes
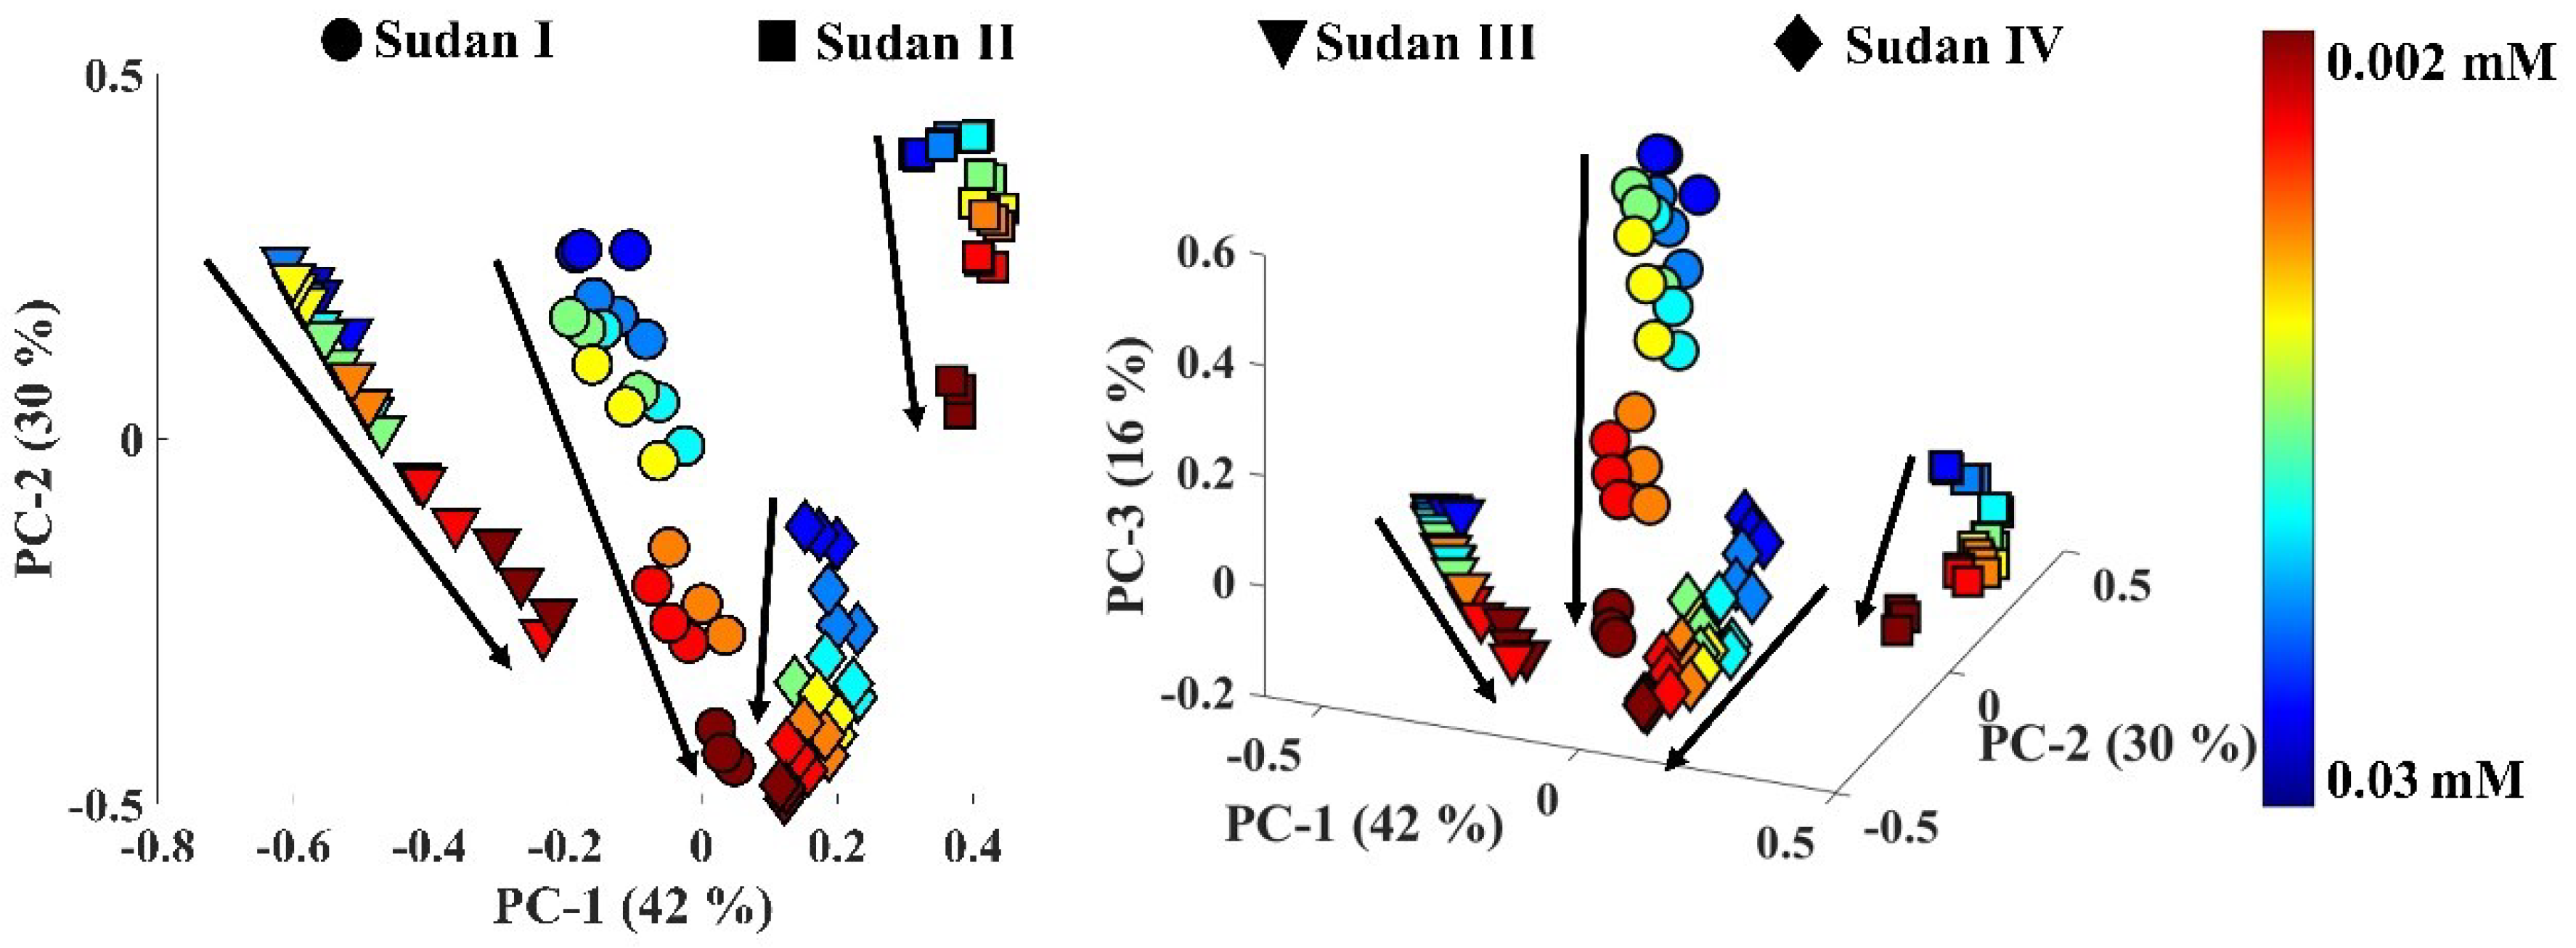
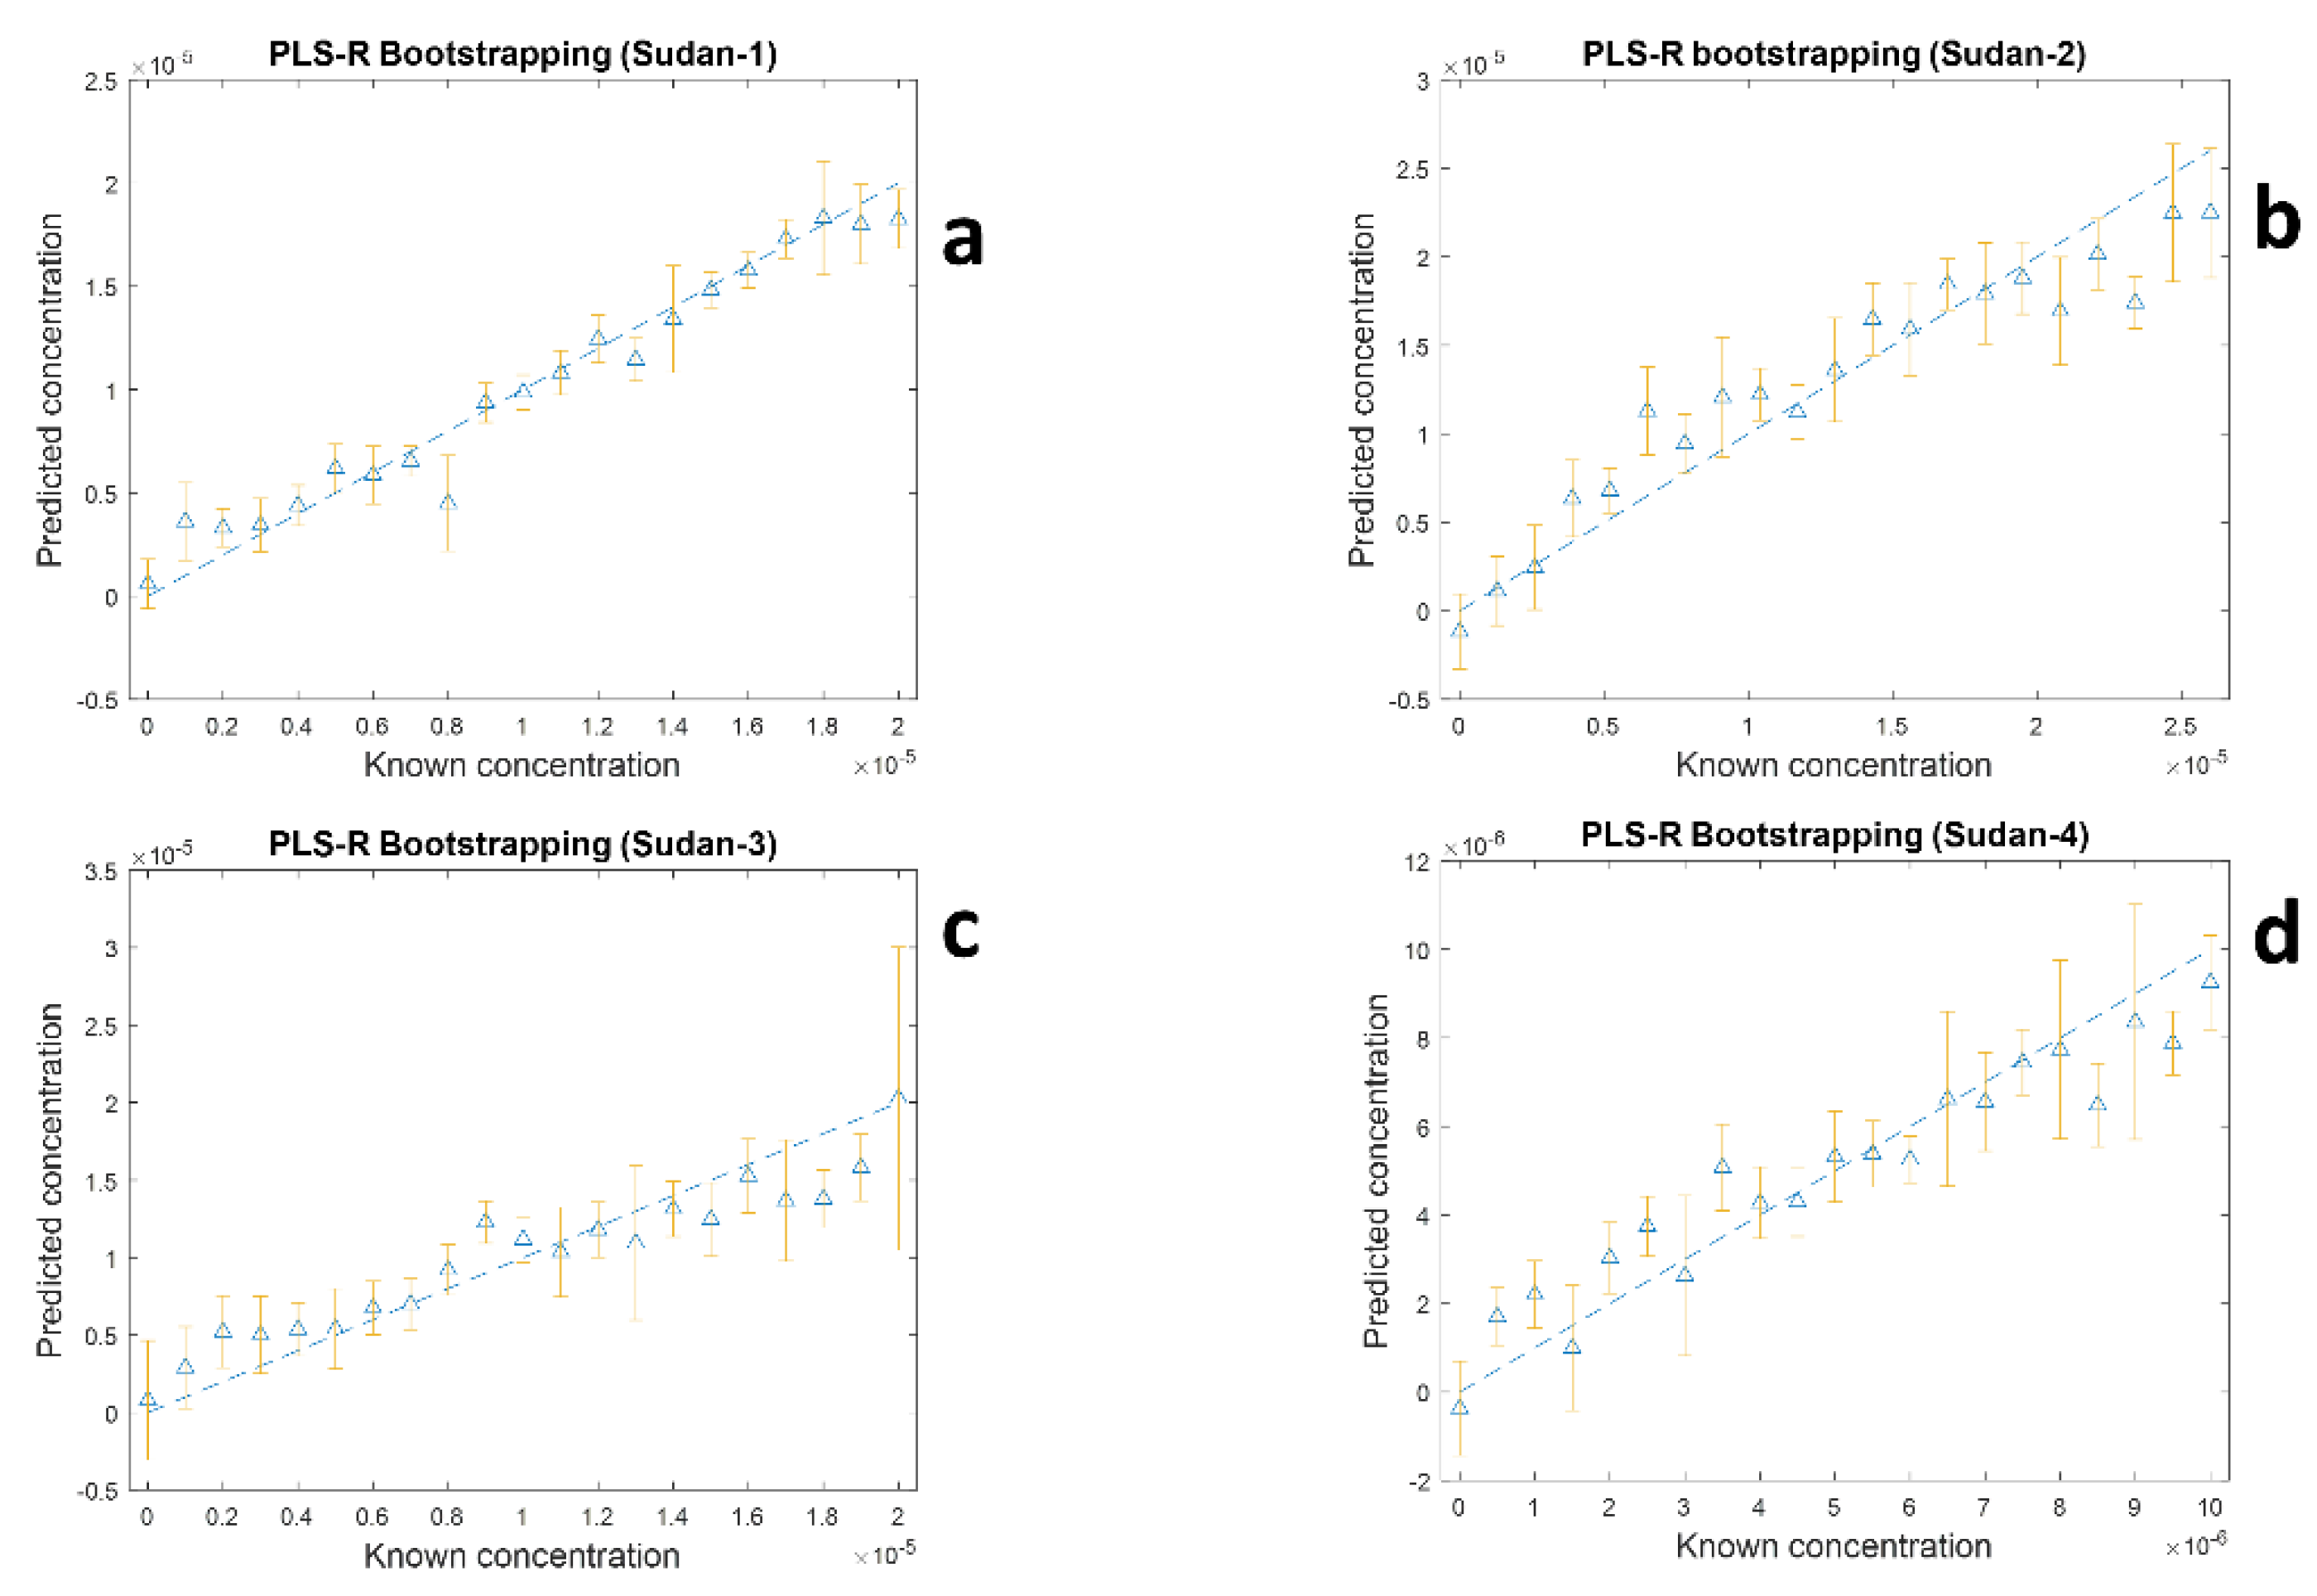
3.2. Simultaneous Multiplexed Quantification of Sudan I–IV Dyes
4. Conclusions
Supplementary Materials
Author Contributions
Funding
Data Availability Statement
Acknowledgments
Conflicts of Interest
References
- Ansari, S. Application of magnetic molecularly imprinted polymer as a versatile and highly selective tool in food and environmental analysis: Recent developments and trends. Trends Anal. Chem. 2017, 90, 89–106. [Google Scholar] [CrossRef]
- Chaikhan, P.; Udnan, Y.; Ampiah-Bonney, R.J.; Chaiyasith, W.C. Fast sequential multi element analysis of lead and cadmium in canned food samples using effervescent tablet-assisted switchable solvent based liquid phase microextraction (EA-SS-LPME) coupled with high-resolution continuum source flame atomic absorption spectrometry (HR-CS-FAAS). Food Chem. 2022, 375, 131857. [Google Scholar]
- Bisgin, A.; Narin, I.; Ucan, M.; Soylak, M. A new cloud point extraction procedure for determination of trace amount crystal violet in wastewater by UV-VIS. Spectrometry. Oxid. Commun. 2015, 38, 232–240. [Google Scholar]
- Nishad, J.; Dutta, A.; Saha, S.; Rudra, S.G.; Varghese, E.; Sharma, R.; Tomar, M.; Kumar, M.; Kaur, C. Ultrasound-assisted development of stable grapefruit peel polyphenolic nano-emulsion: Optimization and application in improving oxidative stability of mustard oil. Food Chem. 2021, 334, 127561. [Google Scholar] [CrossRef] [PubMed]
- Ertaş, E.; Özer, H.; Alasalvar, C. A rapid HPLC method for determination of Sudan dyes and Para Red in red chilli pepper. Food Chem. 2007, 105, 756–760. [Google Scholar] [CrossRef]
- Andoh, S.S.; Nyave, K.; Asamoah, B.; Kanyathare, B.; Nuutinen, T.; Mingle, C.; Peiponen, K.-E.; Roussey, M. Optical screening for presence of banned Sudan III and Sudan IV dyes in edible palm oils. Food Addit. Contam. 2020, 37, 1049–1060. [Google Scholar] [CrossRef] [PubMed]
- Rebane, R.; Leito, I.; Yurchenko, S.; Herodes, K. A review of analytical techniques for determination of Sudan I–IV dyes in food matrixes. J. Chromatogr. A 2010, 1217, 2747–2757. [Google Scholar] [CrossRef]
- Murphy, C.J.; Sau, T.K.; Gole, A.M.; Orendorff, C.J.; Gao, J.; Gou, L.; Hunyadi, S.E.; Li, T. Anisotropic metal nanoparticles: Synthesis, assembly, and optical applications. J. Phys. Chem. B 2005, 109, 13857–13870. [Google Scholar] [CrossRef]
- Gurr, E. Synthetic Dyes in Biology, Medicine and Chemistry; Elsevier: Amsterdam, The Netherlands, 2012. [Google Scholar]
- Wu, L.P.; Li, Y.F.; Huang, C.Z.; Zhang, Q. Visual detection of Sudan dyes based on the plasmon resonance light scattering signals of silver nanoparticles. Anal. Chem. 2006, 78, 5570–5577. [Google Scholar] [CrossRef] [PubMed]
- Soylak, M.; Baran, S.; Uzcan, F. Ultrasound assisted deep eutectic solvent based liquid phase microextraction for the preconcentration and spectrophotometric determination of amaranth (E123) in water and food samples. Instrum. Sci. Technol. 2022, 50, 203–218. [Google Scholar] [CrossRef]
- Awadelkarim, K.D.; Mariani-Costantini, R.; Elwali, N.E. Cancer in the Sudan: An overview of the current status of knowledge on tumor patterns and risk factors. Sci. Total Environ. 2012, 423, 214–228. [Google Scholar] [CrossRef]
- Pan, Y.; Lai, K.; Fan, Y.; Li, C.; Pei, L.; Rasco, B.A.; Huang, Y. Determination of tert-butylhydroquinone in vegetable oils using surface-enhanced Raman spectroscopy. J. Food Sci. 2014, 79, T1225–T1230. [Google Scholar] [CrossRef]
- Lyons, G.; Sharma, S.; Aubry, A.; Carmichael, E.; Annett, R. A preliminary evaluation of the use of mid infrared spectroscopy to develop calibration equations for determining faecal composition, intake and digestibility in sheep. Anim. Feed Sci. Technol. 2016, 221, 44–53. [Google Scholar] [CrossRef]
- Fan, Y.; Lai, K.; Rasco, B.A.; Huang, Y. Analyses of phosmet residues in apples with surface-enhanced Raman spectroscopy. Food Control 2014, 37, 153–157. [Google Scholar] [CrossRef]
- Nie, X.; Xie, Y.; Wang, Q.; Wei, H.; Xie, C.; Li, Y.; Wang, B.; Li, Y. Rapid Determination of Sudan Dyes in chilli products using ultra high performance supercritical fluid chromatography-photodiode array detection. CYTA J. Food 2021, 19, 560–570. [Google Scholar] [CrossRef]
- Ávila, M.; Zougagh, M.; Escarpa, A.; Ríos, Á. Determination of Sudan dyes in food samples using supercritical fluid extraction–capillary liquid chromatography. J. Supercrit. Fluids 2011, 55, 977–982. [Google Scholar] [CrossRef]
- Ma, X.; Chao, M.; Wang, Z. Electrochemical determination of Sudan I in food samples at graphene modified glassy carbon electrode based on the enhancement effect of sodium dodecyl sulphonate. Food Chem. 2013, 138, 739–744. [Google Scholar] [CrossRef] [PubMed]
- Chen, N.Y.; Li, H.F.; Gao, Z.F.; Qu, F.; Li, N.B.; Luo, H.Q. Utilizing polyethyleneimine-capped silver nanoclusters as a new fluorescence probe for Sudan I–IV sensing in ethanol based on fluorescence resonance energy transfer. Sens. Actuators B Chem. 2014, 193, 730–736. [Google Scholar] [CrossRef]
- Dao, T.C.; Luong, T.Q.N.; Cao, T.A.; Kieu, N.M. Detection of a Sudan dye at low concentrations by surface-enhanced Raman spectroscopy using silver nanoparticles. Commun. Phys. 2019, 29, 521–526. [Google Scholar] [CrossRef]
- Chen, K.; Shen, Z.; Luo, J.; Wang, X.; Sun, R. Quaternized chitosan/silver nanoparticles composite as a SERS substrate for detecting tricyclazole and Sudan, I. Appl. Surf. Sci. 2015, 351, 466–473. [Google Scholar] [CrossRef]
- Cheung, W.; Shadi, I.T.; Xu, Y.; Goodacre, R. Quantitative analysis of the banned food dye Sudan-1 using surface enhanced Raman scattering with multivariate chemometrics. J. Phys. Chem. C 2010, 114, 7285–7290. [Google Scholar] [CrossRef]
- Le Ru, E.; Etchegoin, P. Principles of Surface-Enhanced Raman Spectroscopy: And Related Plasmonic Effects; Elsevier: Amsterdam, The Netherlands, 2008. [Google Scholar]
- Fang, Y.; Yang, H.; Jiang, P.; Dlott, D.D. The distributions of enhancement factors in close-packed and nonclose-packed surface-enhanced Raman substrates. J. Raman Spectrosc. 2012, 43, 389–395. [Google Scholar] [CrossRef]
- Di Anibal, C.V.; Marsal, L.F.; Callao, M.P.; Ruisanchez, I. Surface Enhanced Raman Spectroscopy (SERS) and multivariate analysis as a screening tool for detecting Sudan I dye in culinary spices. Spectrochim. Acta A Mol. Biomol. Spectrosc. 2012, 87, 135–141. [Google Scholar] [CrossRef] [PubMed]
- Zhu, C.; Meng, G.; Huang, Q.; Huang, Z. Vertically aligned Ag nanoplate-assembled film as a sensitive and reproducible SERS substrate for the detection of PCB-77. J. Hazard Mater. 2012, 211, 389–395. [Google Scholar] [CrossRef] [PubMed]
- Clarke, S.J.; Littleford, R.E.; Smith, W.E.; Goodacre, R. Rapid monitoring of antibiotics using Raman and surface enhanced Raman spectroscopy. Analyst 2005, 130, 1019–1026. [Google Scholar] [CrossRef]
- Lee, P.; Meisel, D. Adsorption and surface-enhanced Raman of dyes on silver and gold sols. J. Phys. Chem. A 1982, 86, 3391–3395. [Google Scholar] [CrossRef]
- Huntington, D.; Lyrintzis, C. Improvements to and limitations of Latin hypercube sampling. Probabilistic Eng. Mech. 1998, 13, 245–253. [Google Scholar] [CrossRef]
- Richardson, P.I.; Muhamadali, H.; Ellis, D.I.; Goodacre, R. Rapid quantification of the adulteration of fresh coconut water by dilution and sugars using Raman spectroscopy and chemometrics. Food Chem. 2019, 272, 157–164. [Google Scholar] [CrossRef]
- Esbensen, K.H.; Geladi, P. Principal component analysis: Concept, geometrical interpretation, mathematical background, algorithms, history, practice. In Comprehensive Chemometrics: Chemical and Biochemical Data Analysis; Brown, S.D., Tauler, R., Walczak, B., Eds.; Elsevier: Amsterdam, The Netherlands, 2009; Volume 2, pp. 211–226. [Google Scholar]
- Martens, H.; Naes, T. Multivariate Calibration; John Wiley & Sons: Hoboken, NJ, USA, 1992. [Google Scholar]
- Barnes, R.J.; Dhanoa, M.S.; Lister, S.J. Standard normal variate transformation and de-trending of near-infrared diffuse reflectance spectra. Appl. Spectrosc. 1989, 43, 772–777. [Google Scholar] [CrossRef]
- Szymańska, E.; Saccenti, E.; Smilde, A.K.; Westerhuis, J.A. Double-check: Validation of diagnostic statistics for PLS-DA models in metabolomics studies. Metabolomics 2012, 8, 3–16. [Google Scholar] [CrossRef]
- Blanco, M.; Castillo, M.; Peinado, A.; Beneyto, R. Determination of low analyte concentrations by near-infrared spectroscopy: Effect of spectral pretreatments and estimation of multivariate detection limits. Anal. Chim. Acta 2007, 581, 318–323. [Google Scholar] [CrossRef] [PubMed]
- Ellis, D.I.; Brewster, V.L.; Dunn, W.B.; Allwood, J.W.; Golovanov, A.P.; Goodacre, R. Fingerprinting food: Current technologies for the detection of food adulteration and contamination. Chem. Soc. Rev. 2012, 41, 5706–5727. [Google Scholar] [CrossRef] [PubMed]
- Efron, B.; Tibshirani, R.J. An Introduction to the Bootstrap; CRC Press: Boca Raton, FL, USA, 1994. [Google Scholar]
- Lai, K.; Zhang, Y.; Du, R.; Zhai, F.; Rasco, B.A.; Huang, Y. Determination of chloramphenicol and crystal violet with surface enhanced Raman spectroscopy. Sens. Instrum. Food Qual. Saf. 2011, 5, 19–24. [Google Scholar] [CrossRef]
- Lombardi, J.R.; Birke, R.L. A unified view of surface-enhanced Raman scattering. Acc. Chem. Res. 2009, 42, 734–742. [Google Scholar] [CrossRef]
- Lombardi, J.R.; Birke, R.L. A unified approach to surface-enhanced Raman spectroscopy. J. Phys. Chem. C 2008, 112, 5605–5617. [Google Scholar] [CrossRef]
- Stewart, A.; Zheng, S.; McCourt, M.R.; Bell, S.E. Controlling assembly of mixed thiol monolayers on silver nanoparticles to tune their surface properties. ACS Nano 2012, 6, 3718–3726. [Google Scholar] [CrossRef]
- Goodacre, R.; Neal, M.J.; Kell, D.B. Rapid and quantitative analysis of the pyrolysis mass spectra of complex binary and tertiary mixtures using multivariate calibration and artificial neural networks. Anal. Chem. 1994, 66, 1070–1085. [Google Scholar] [CrossRef]
- Haughey, S.A.; Galvin-King, P.; Ho, Y.-C.; Bell, S.E.; Elliott, C.T. The feasibility of using near infrared and Raman spectroscopic techniques to detect fraudulent adulteration of chili powders with Sudan dye. Food Control 2015, 48, 75–83. [Google Scholar] [CrossRef]


| LoD (M) * | Q2 | RMSECV (M) | |
|---|---|---|---|
| Sudan I | 6.27 × 10⁻⁶ | 0.9286 | 2.5616 × 10⁻⁶ |
| Sudan II | 5.35 × 10⁻⁵ | 0.9206 | 2.0324 × 10⁻⁶ |
| Sudan III | 9.40 × 10⁻⁶ | 0.8676 | 3.4886 × 10⁻⁶ |
| Sudan IV | 1.84 × 10⁻⁶ | 0.9705 | 7.1678 × 10⁻⁷ |
| Sudan I | Sudan II | Sudan III | Sudan IV | |
|---|---|---|---|---|
| Results from four individual PLS1 models * | ||||
| R2 | 0.7835 | 0.7228 | 0.5645 | 0.6035 |
| Q2 | 0.8593 | 0.7255 | 0.5207 | 0.5940 |
| RMSECV (M) | 2.667 × 10⁻⁶ | 3.929 × 10⁻⁶ | 3.789 × 10⁻⁶ | 1.816 × 10⁻⁶ |
| RMSEP (M) | 2.150 × 10⁻⁶ | 3.908 × 10⁻⁶ | 3.953 × 10⁻⁶ | 1.816 × 10⁻⁶ |
| Results from one PLS2 model with four (Y) outputs § | ||||
| R2 | 0.7303 | 0.6884 | 0.5101 | 0.5071 |
| Q2 | 0.8329 | 0.7288 | 0.5032 | 0.5459 |
| RMSECV (M) | 3.000 × 10⁻⁶ | 4.174 × 10⁻⁶ | 4.007 × 10⁻⁶ | 2.015 × 10⁻⁶ |
| RMSEP (M) | 2.308 × 10⁻⁶ | 3.895 × 10⁻⁶ | 4.023 × 10⁻⁶ | 1.905 × 10⁻⁶ |
Publisher’s Note: MDPI stays neutral with regard to jurisdictional claims in published maps and institutional affiliations. |
© 2022 by the authors. Licensee MDPI, Basel, Switzerland. This article is an open access article distributed under the terms and conditions of the Creative Commons Attribution (CC BY) license (https://creativecommons.org/licenses/by/4.0/).
Share and Cite
Alomar, T.S.; AlMasoud, N.; Xu, Y.; Lima, C.; Akbali, B.; Maher, S.; Goodacre, R. Simultaneous Multiplexed Quantification of Banned Sudan Dyes Using Surface Enhanced Raman Scattering and Chemometrics. Sensors 2022, 22, 7832. https://doi.org/10.3390/s22207832
Alomar TS, AlMasoud N, Xu Y, Lima C, Akbali B, Maher S, Goodacre R. Simultaneous Multiplexed Quantification of Banned Sudan Dyes Using Surface Enhanced Raman Scattering and Chemometrics. Sensors. 2022; 22(20):7832. https://doi.org/10.3390/s22207832
Chicago/Turabian StyleAlomar, Taghrid S., Najla AlMasoud, Yun Xu, Cassio Lima, Baris Akbali, Simon Maher, and Royston Goodacre. 2022. "Simultaneous Multiplexed Quantification of Banned Sudan Dyes Using Surface Enhanced Raman Scattering and Chemometrics" Sensors 22, no. 20: 7832. https://doi.org/10.3390/s22207832
APA StyleAlomar, T. S., AlMasoud, N., Xu, Y., Lima, C., Akbali, B., Maher, S., & Goodacre, R. (2022). Simultaneous Multiplexed Quantification of Banned Sudan Dyes Using Surface Enhanced Raman Scattering and Chemometrics. Sensors, 22(20), 7832. https://doi.org/10.3390/s22207832