
Developing GLAD Parameters to Control the Deposition of Nanostructured Thin Film


Abstract
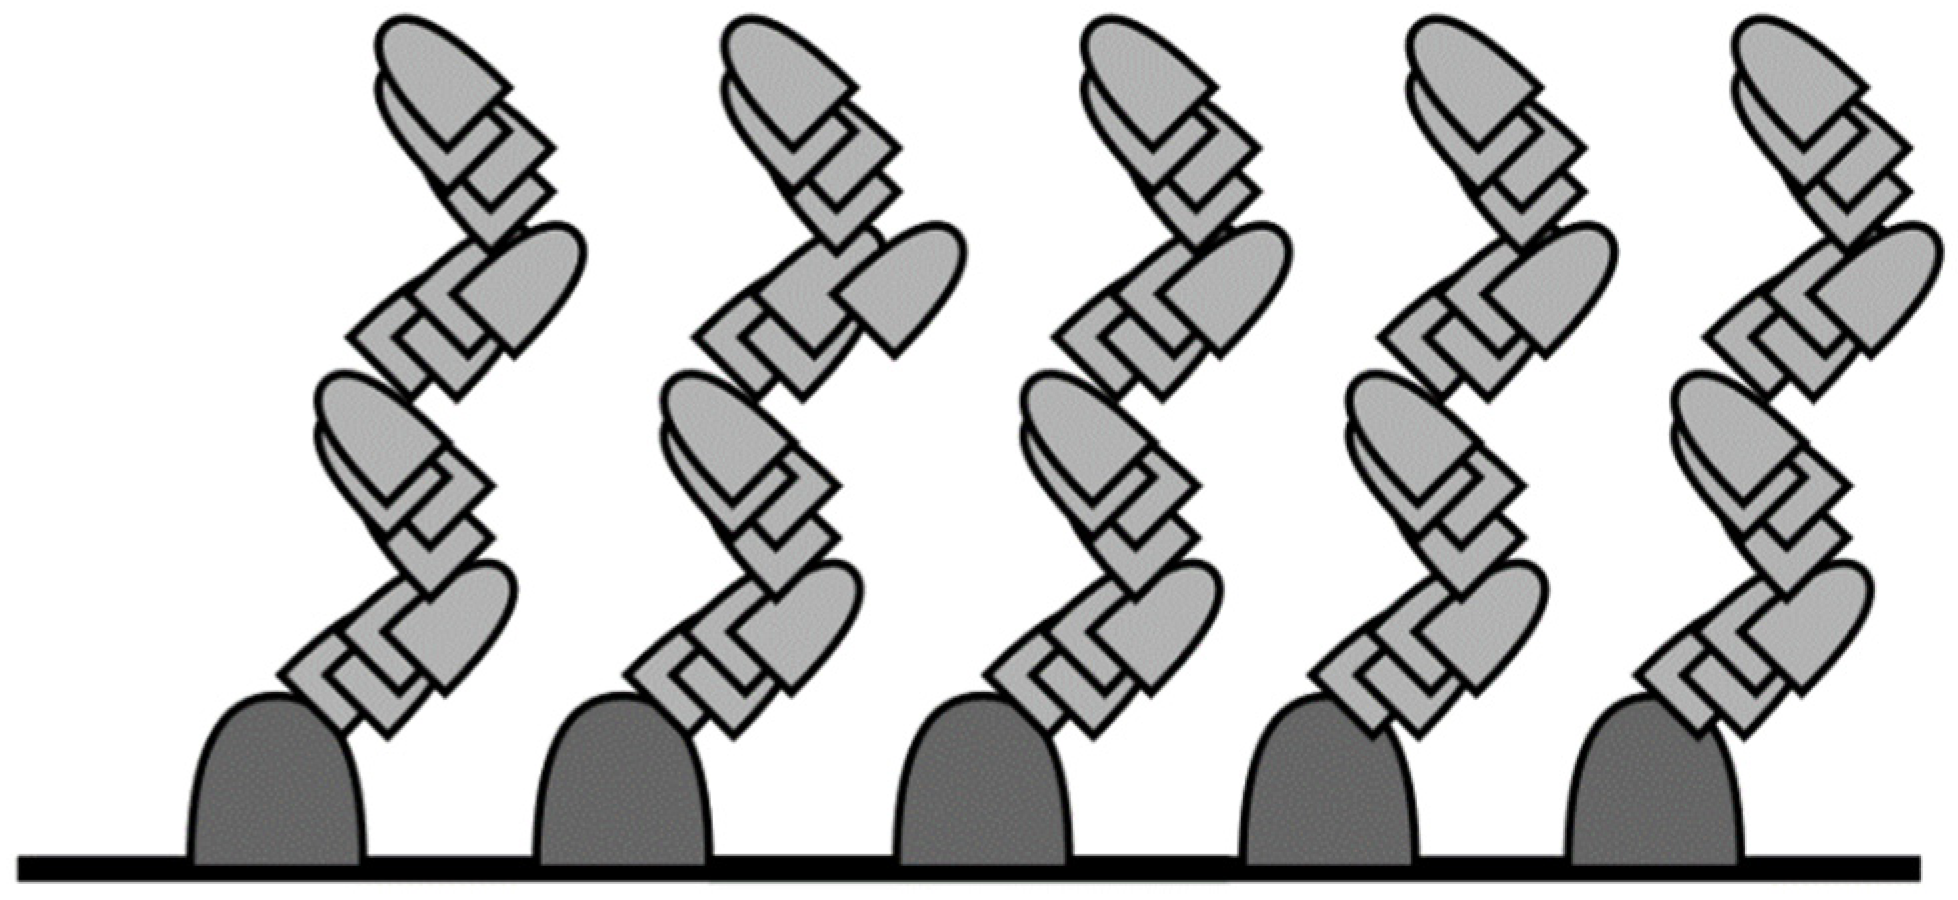
:1. Introduction
2. Materials and Methods
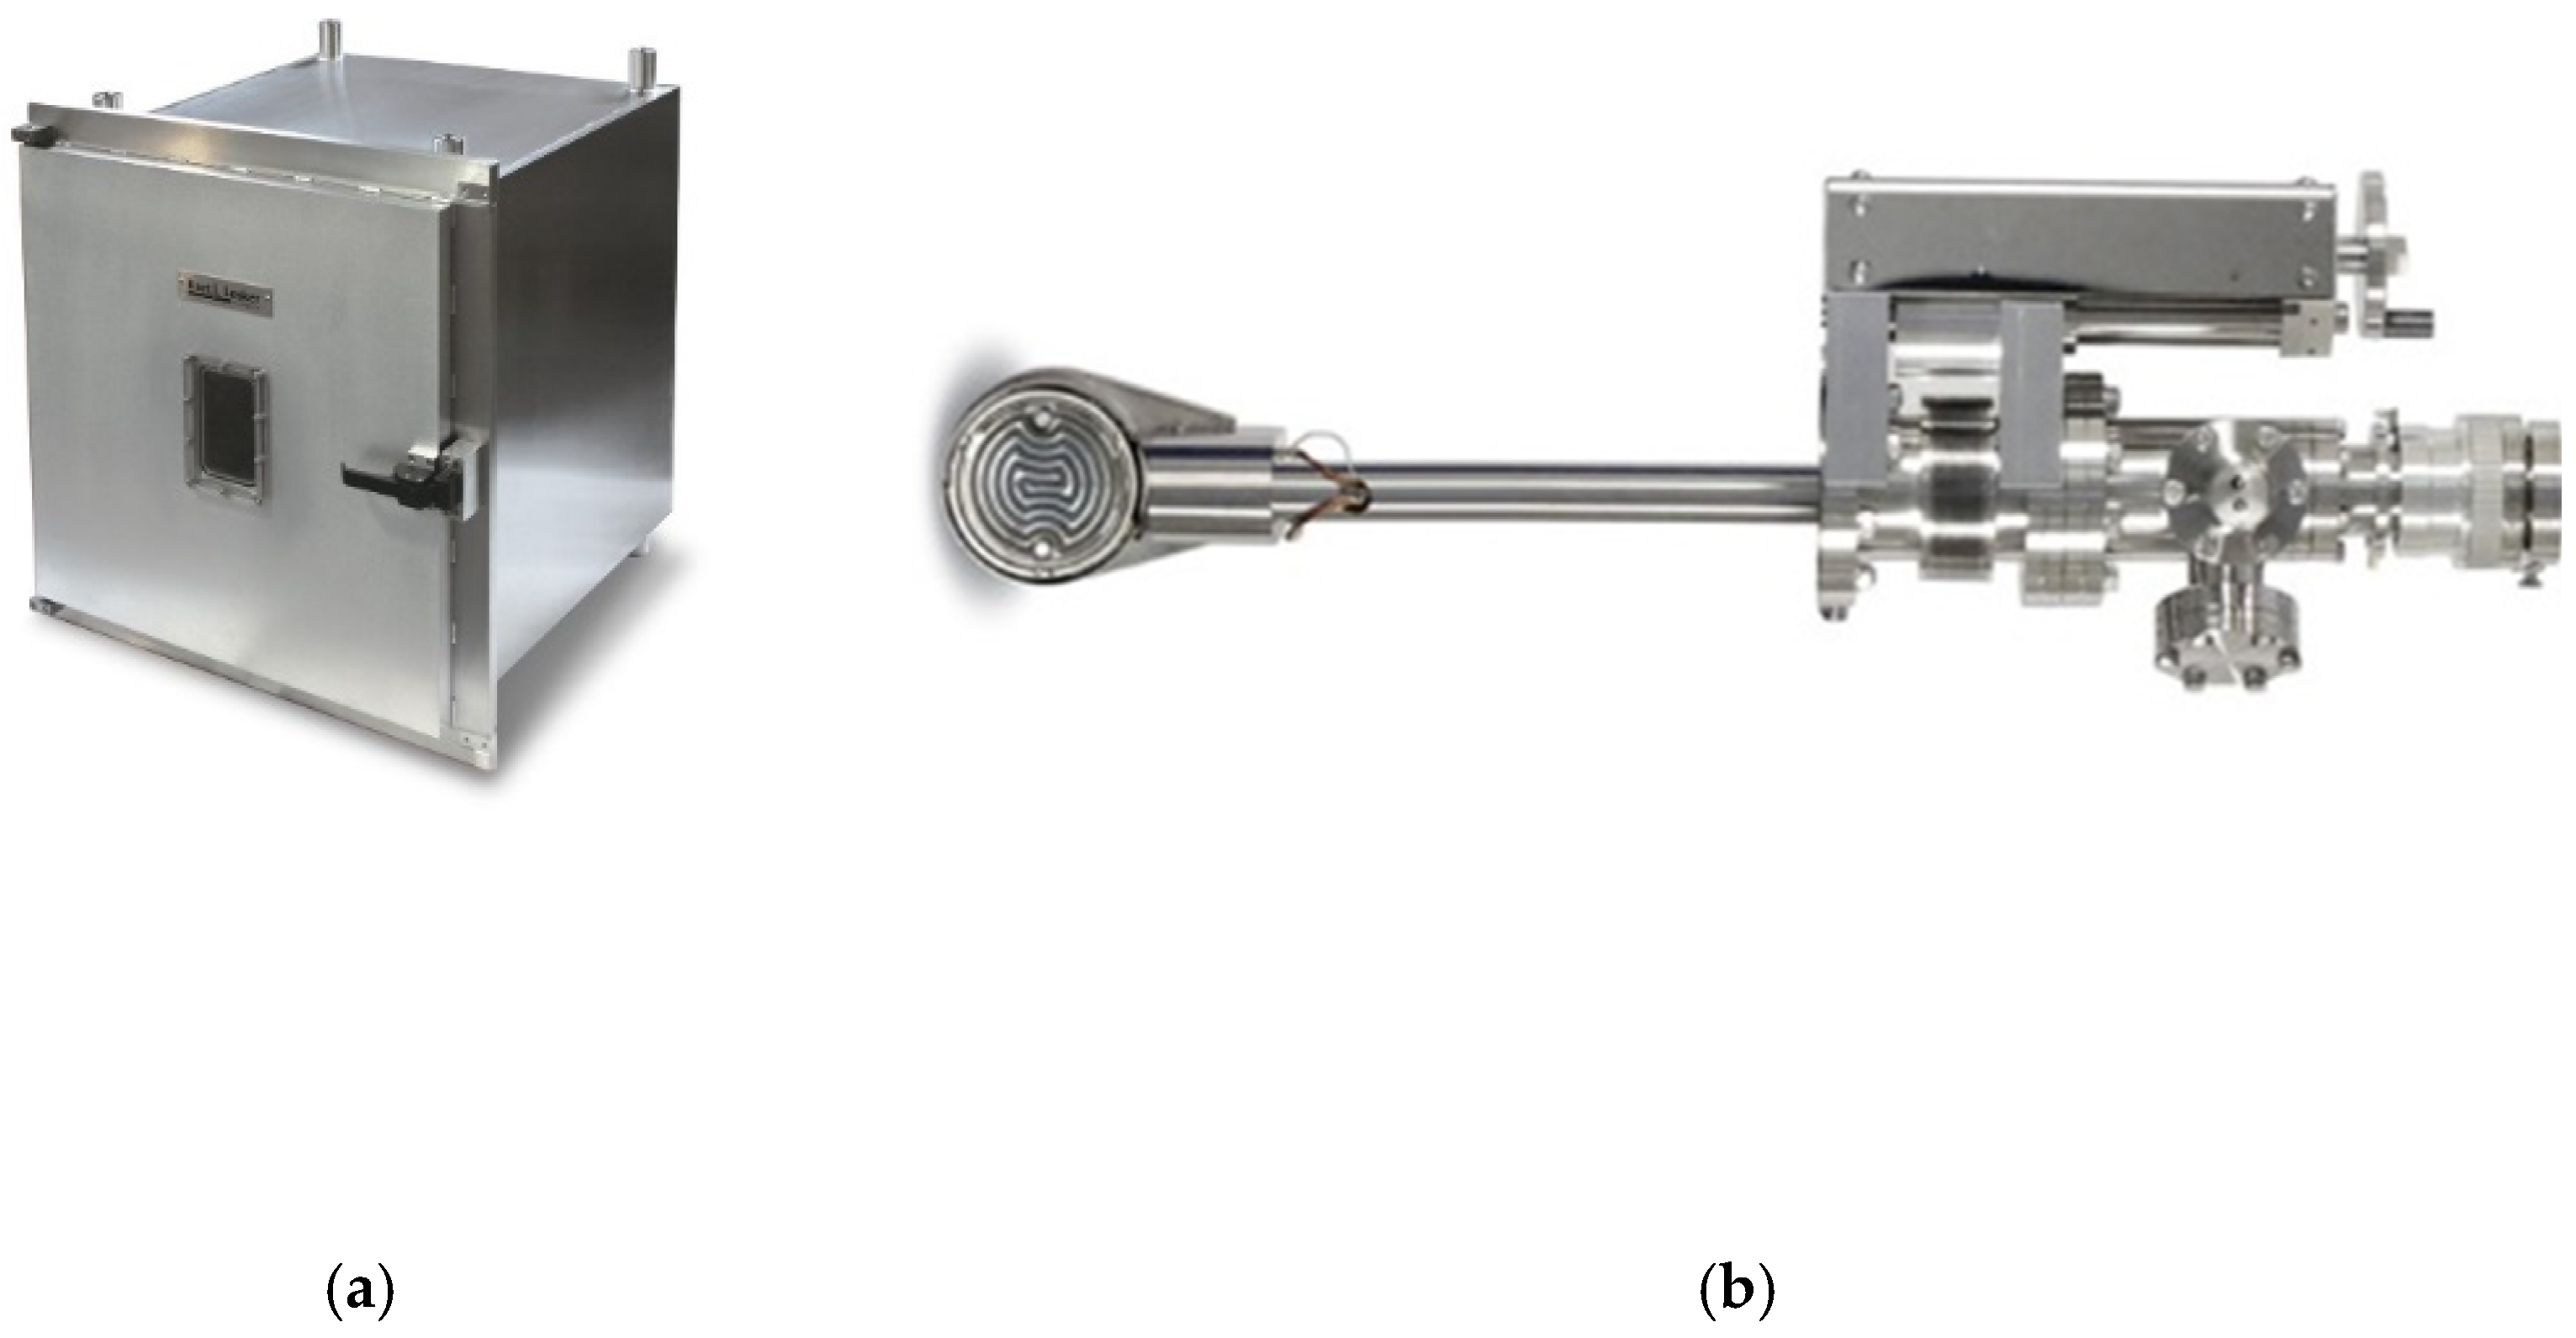
2.1. Commercially Supplied: Deposition Chamber
2.2. Commercially Supplied: Manipulator
2.3. Commercially Supplied: Magnetrons
2.4. Commercially Supplied: Vacuum Pump
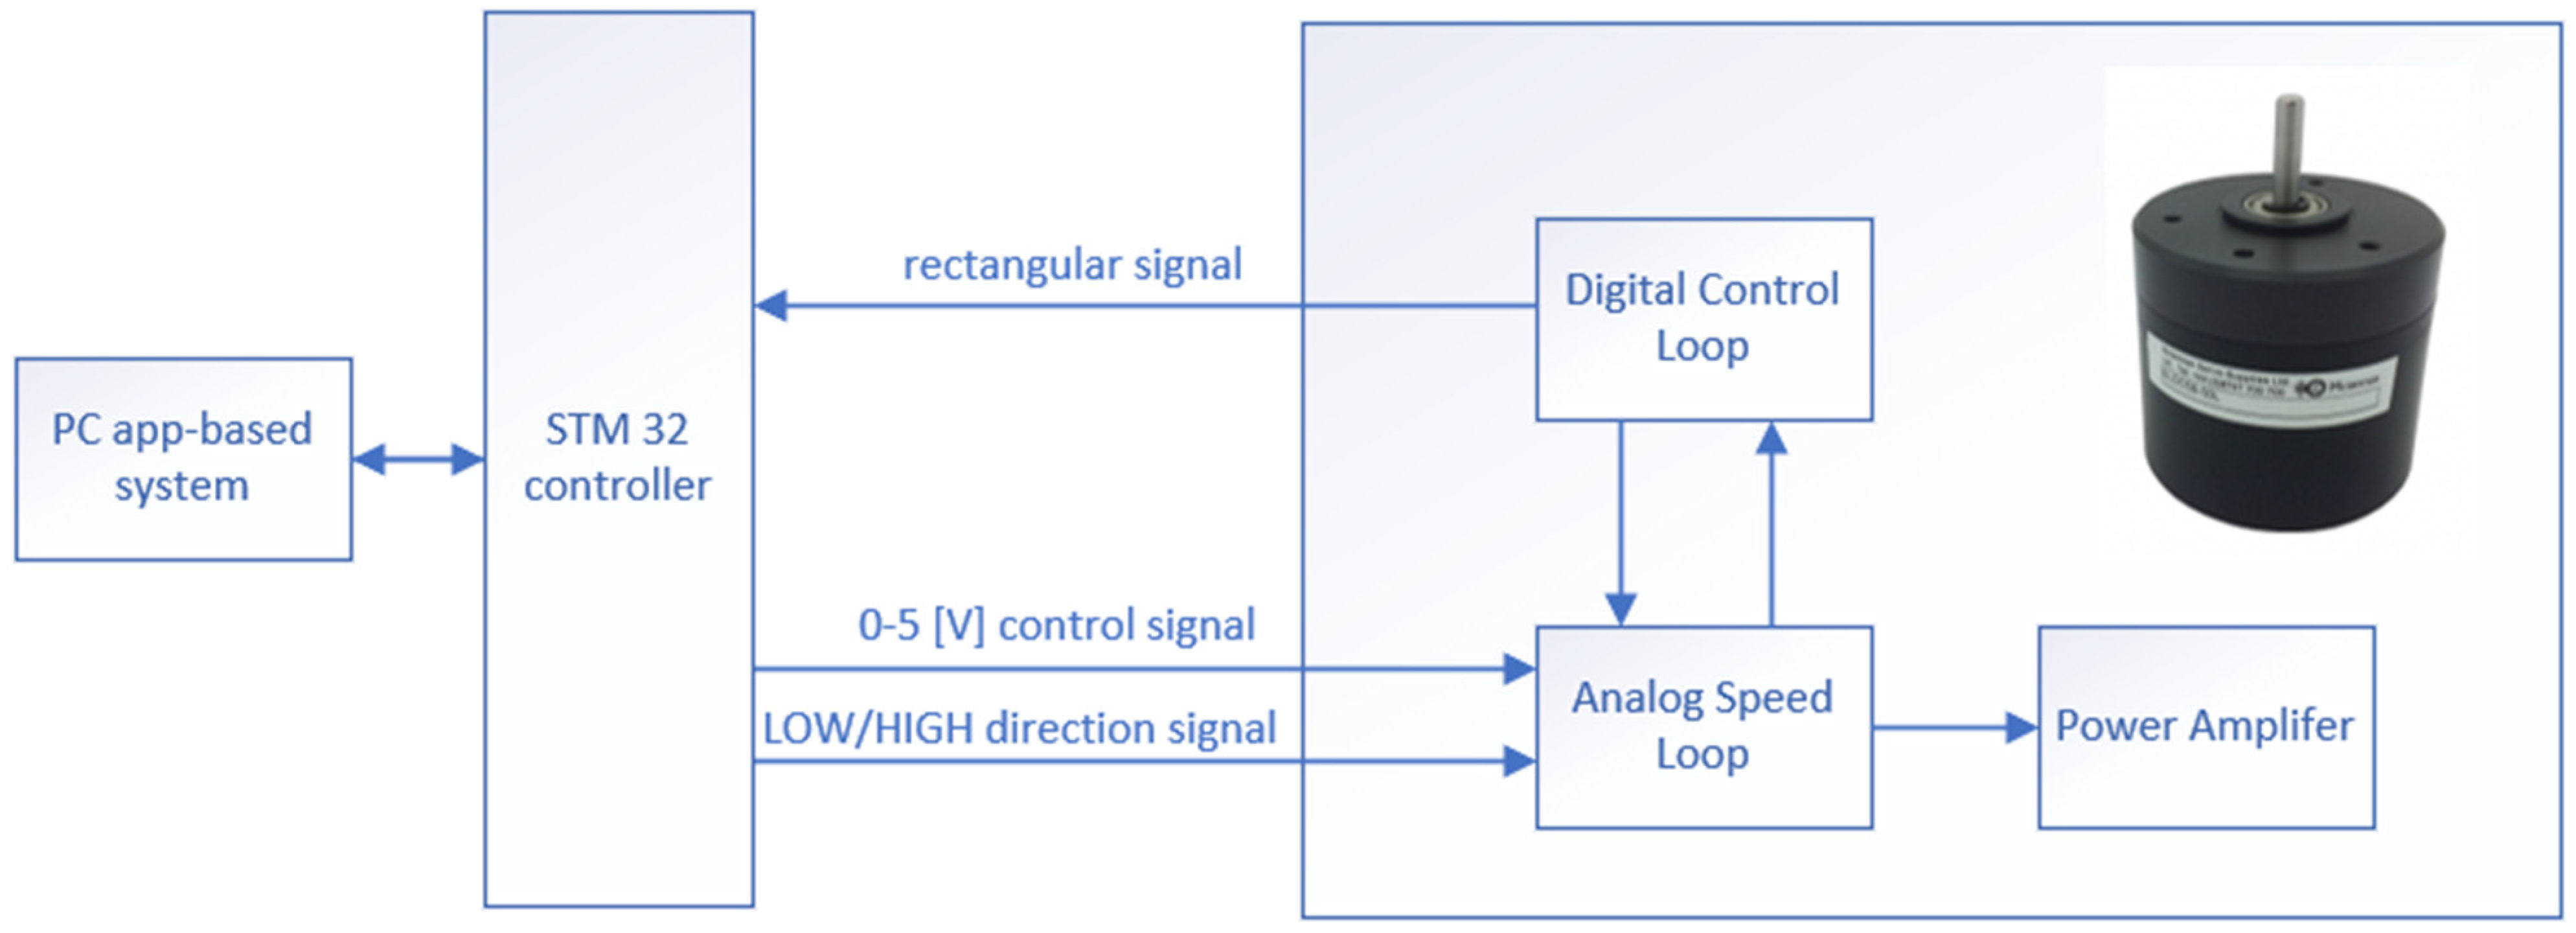
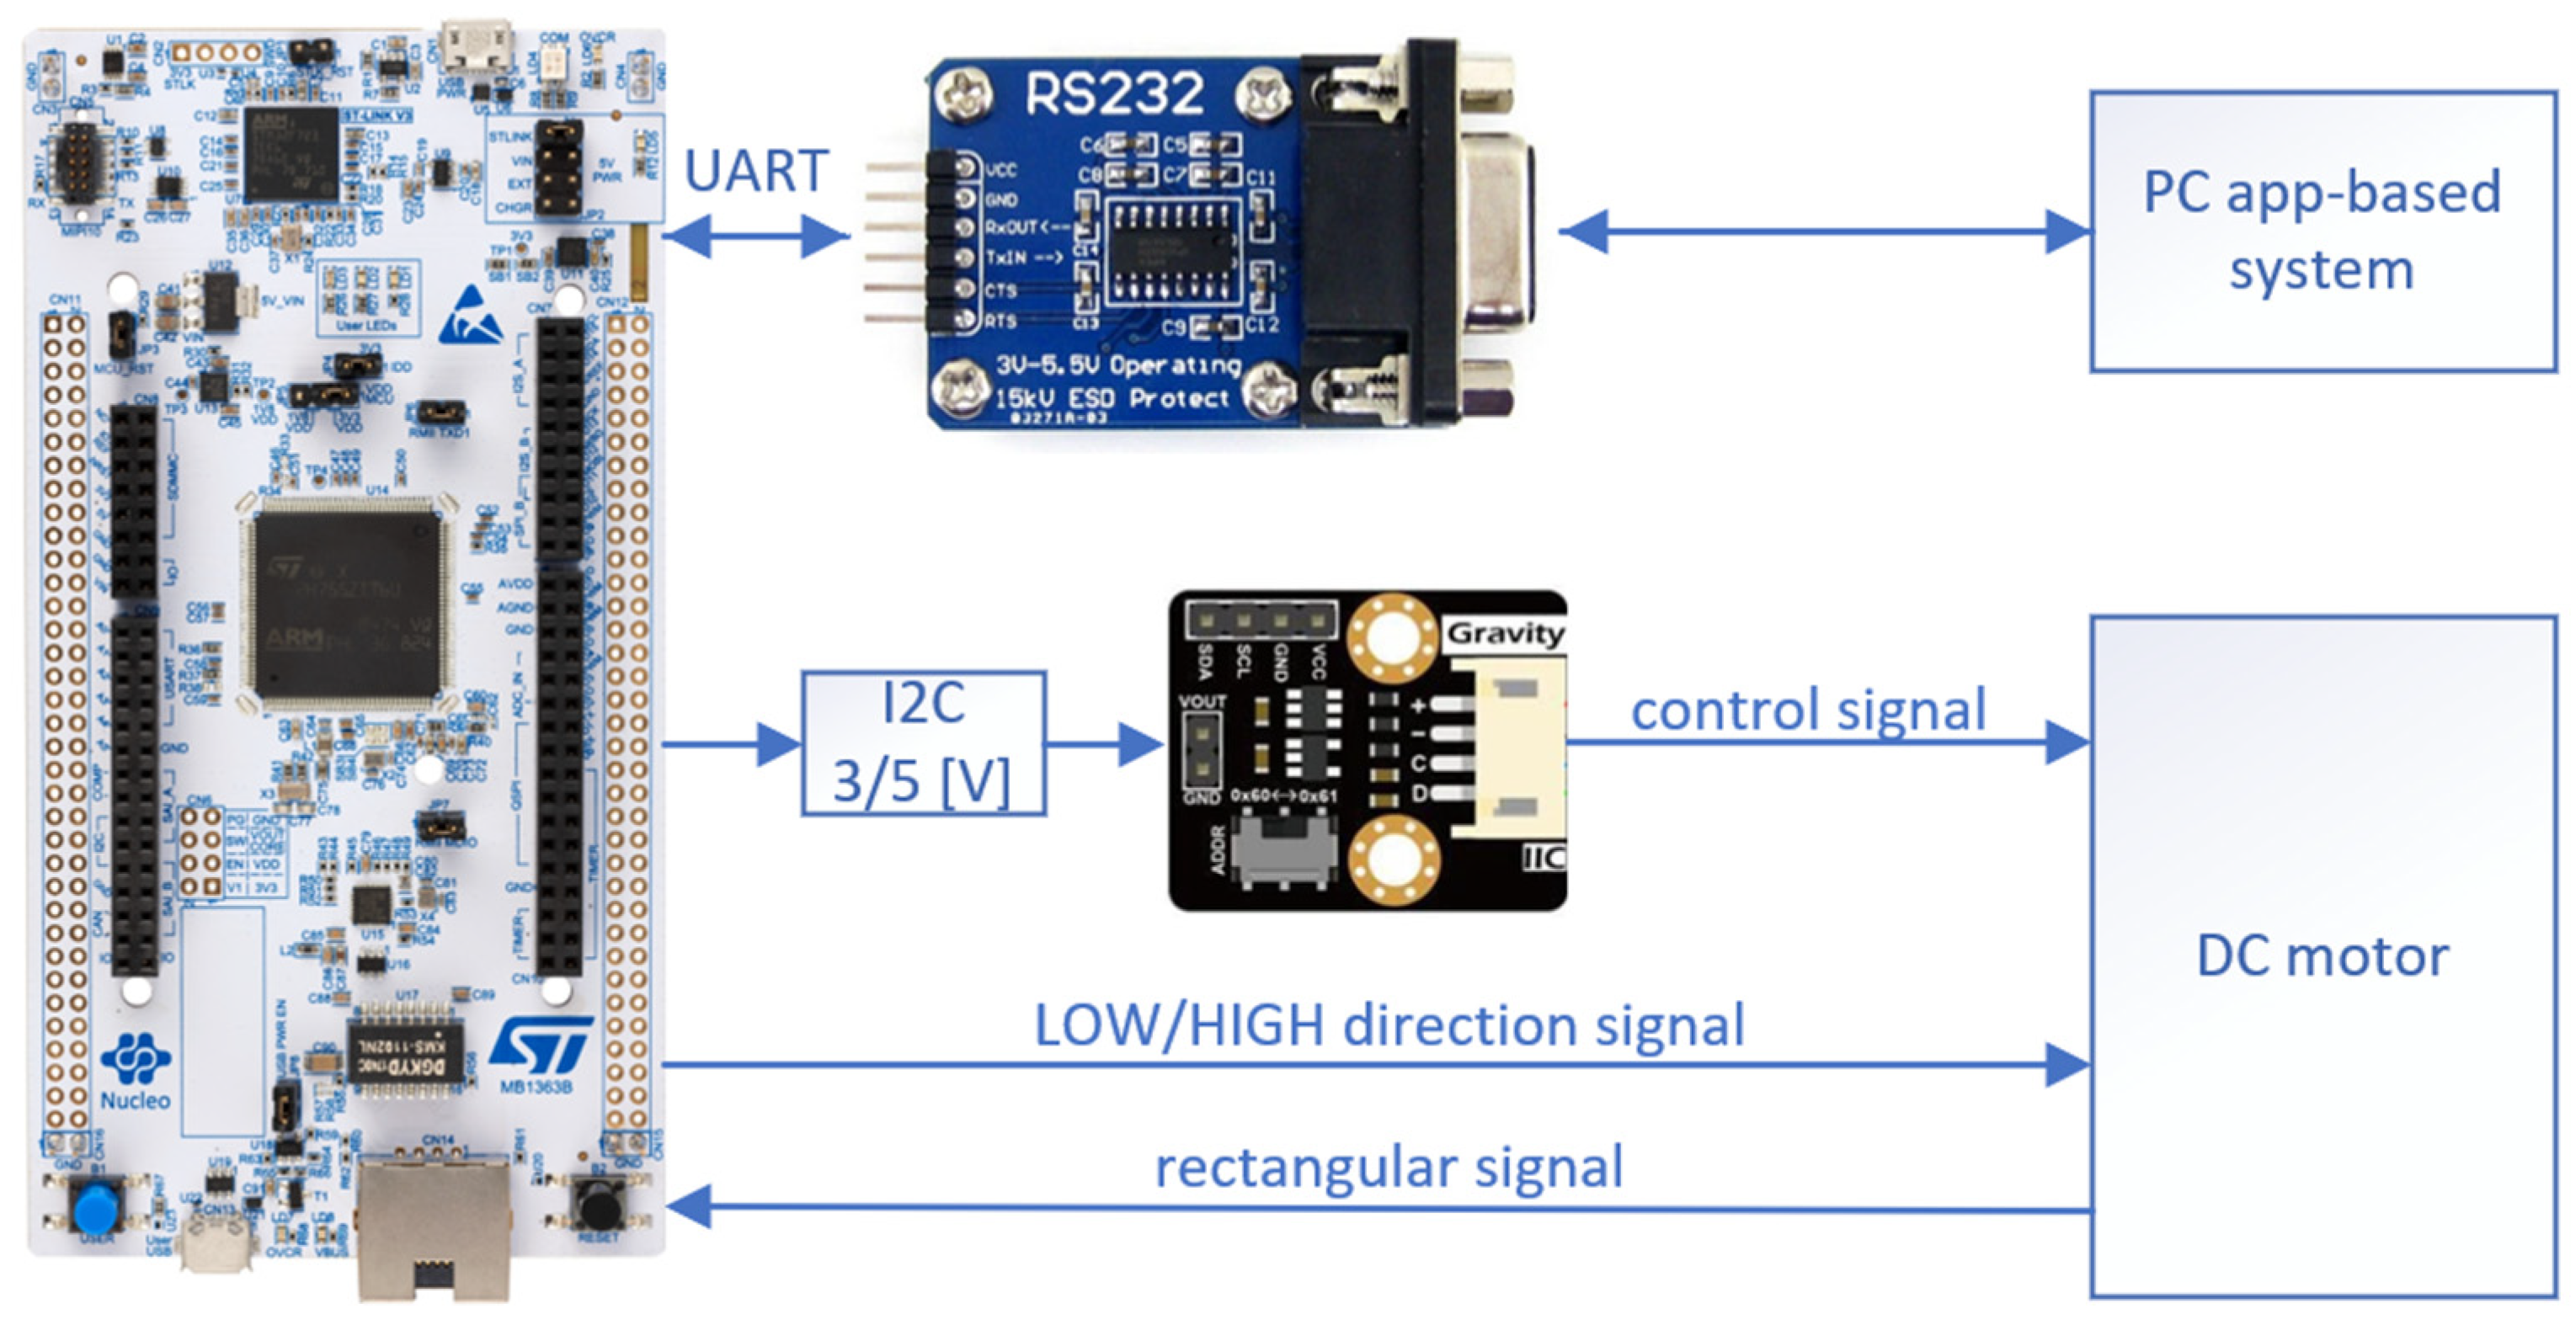
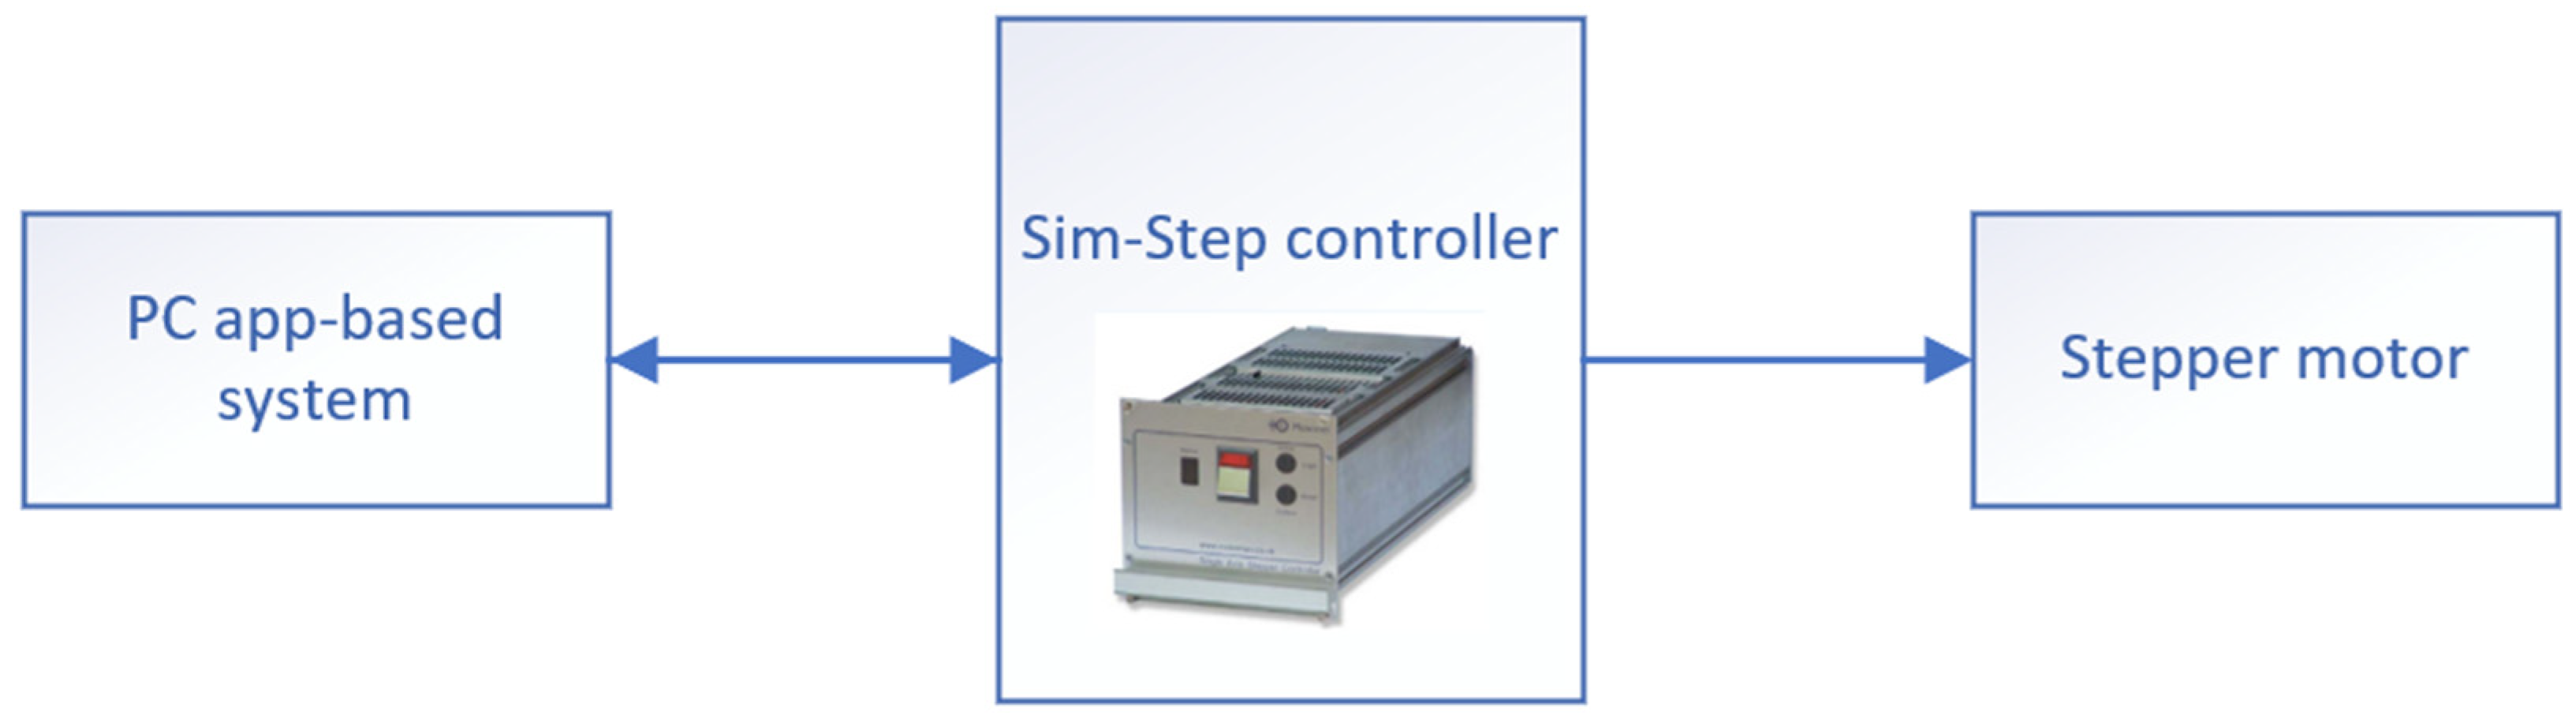
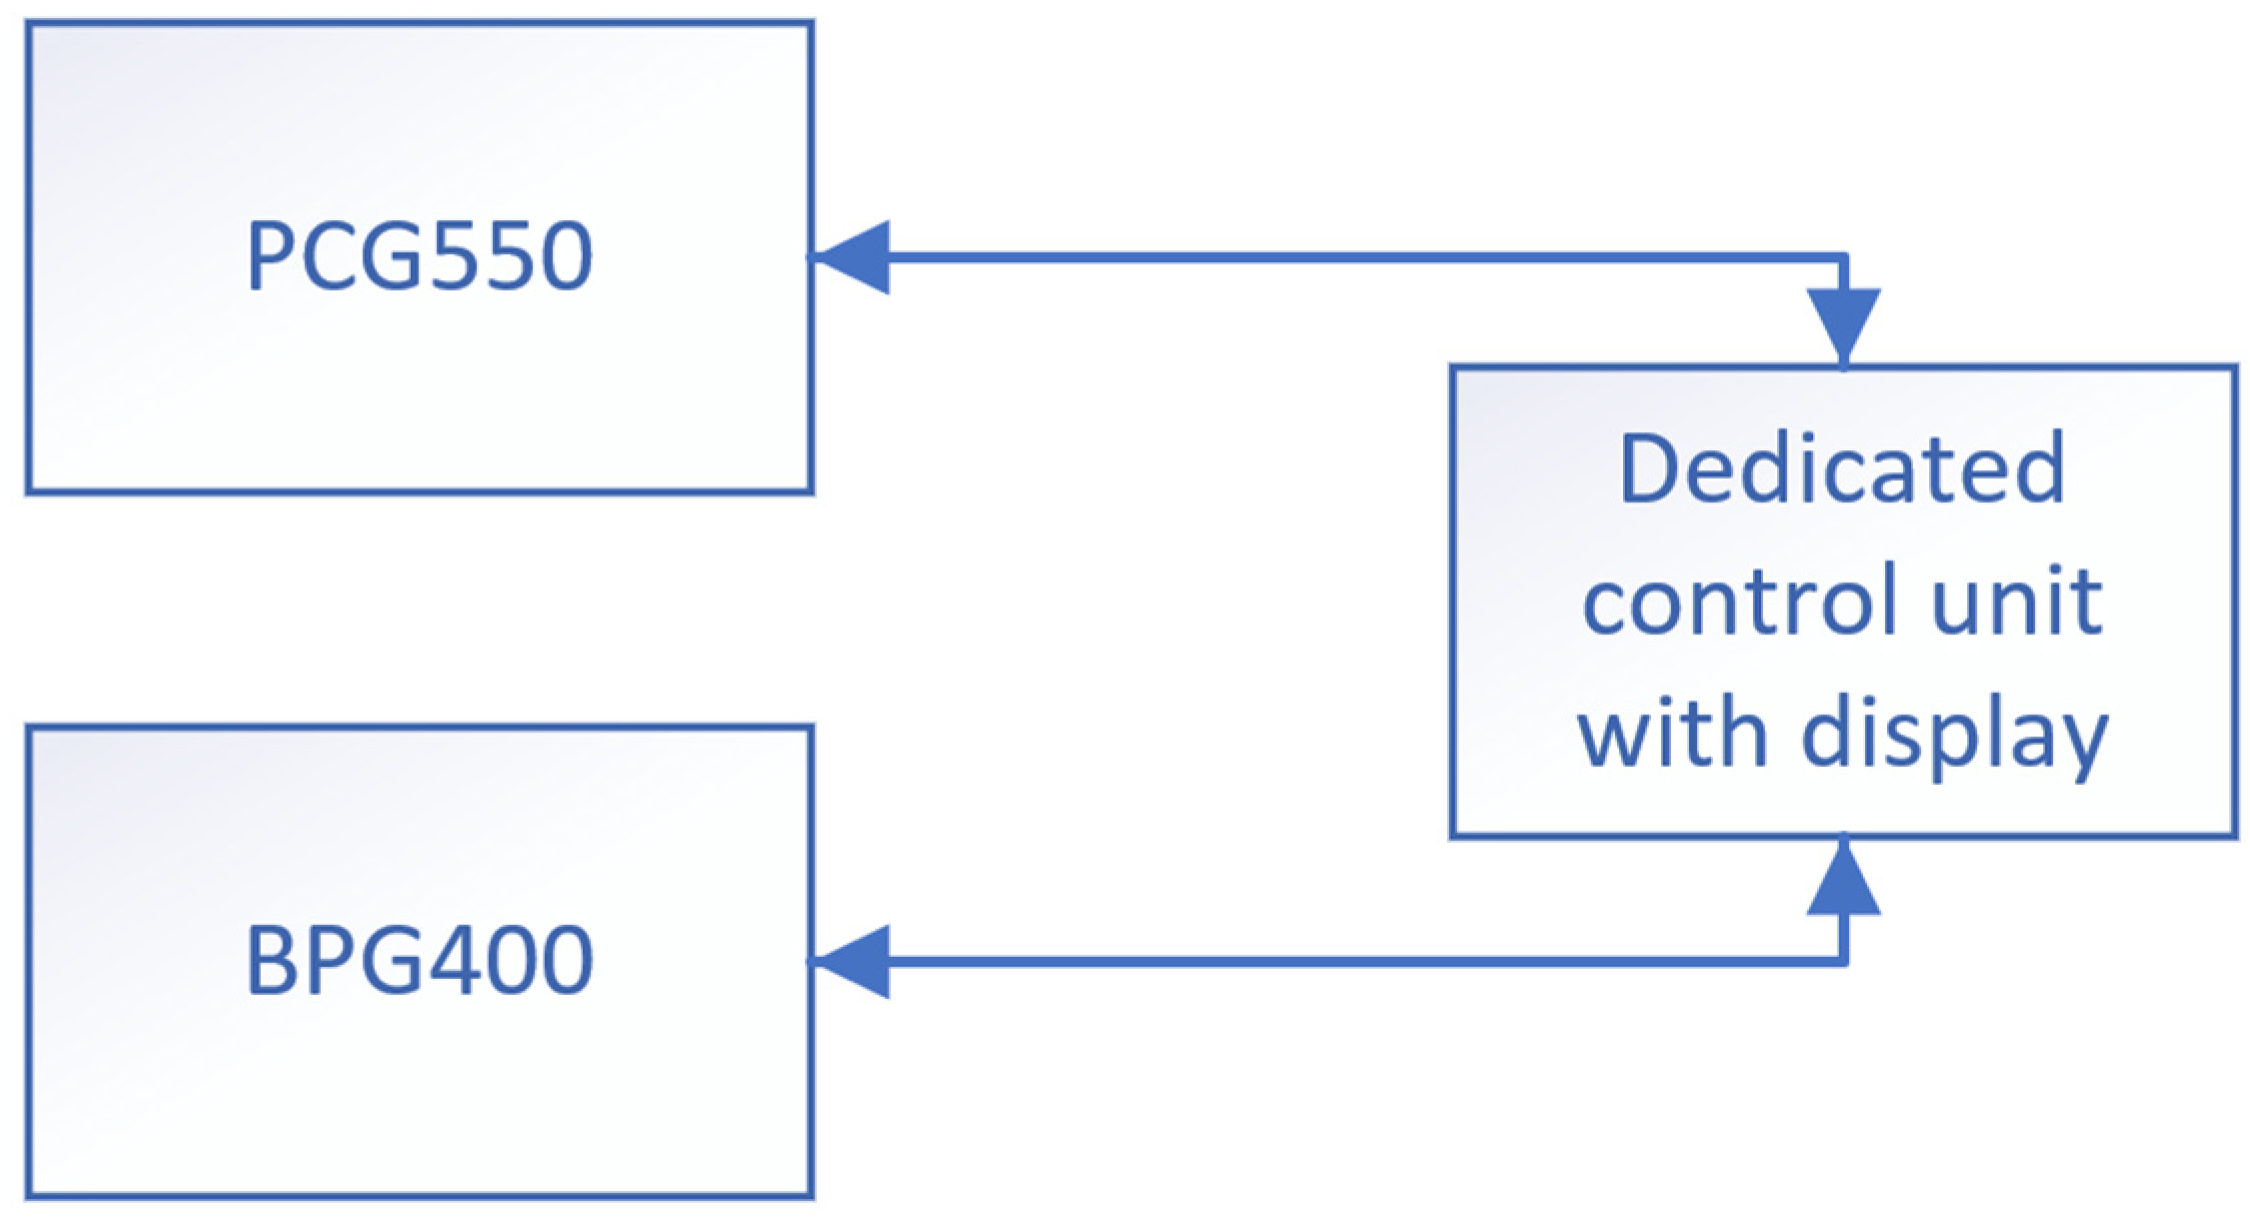
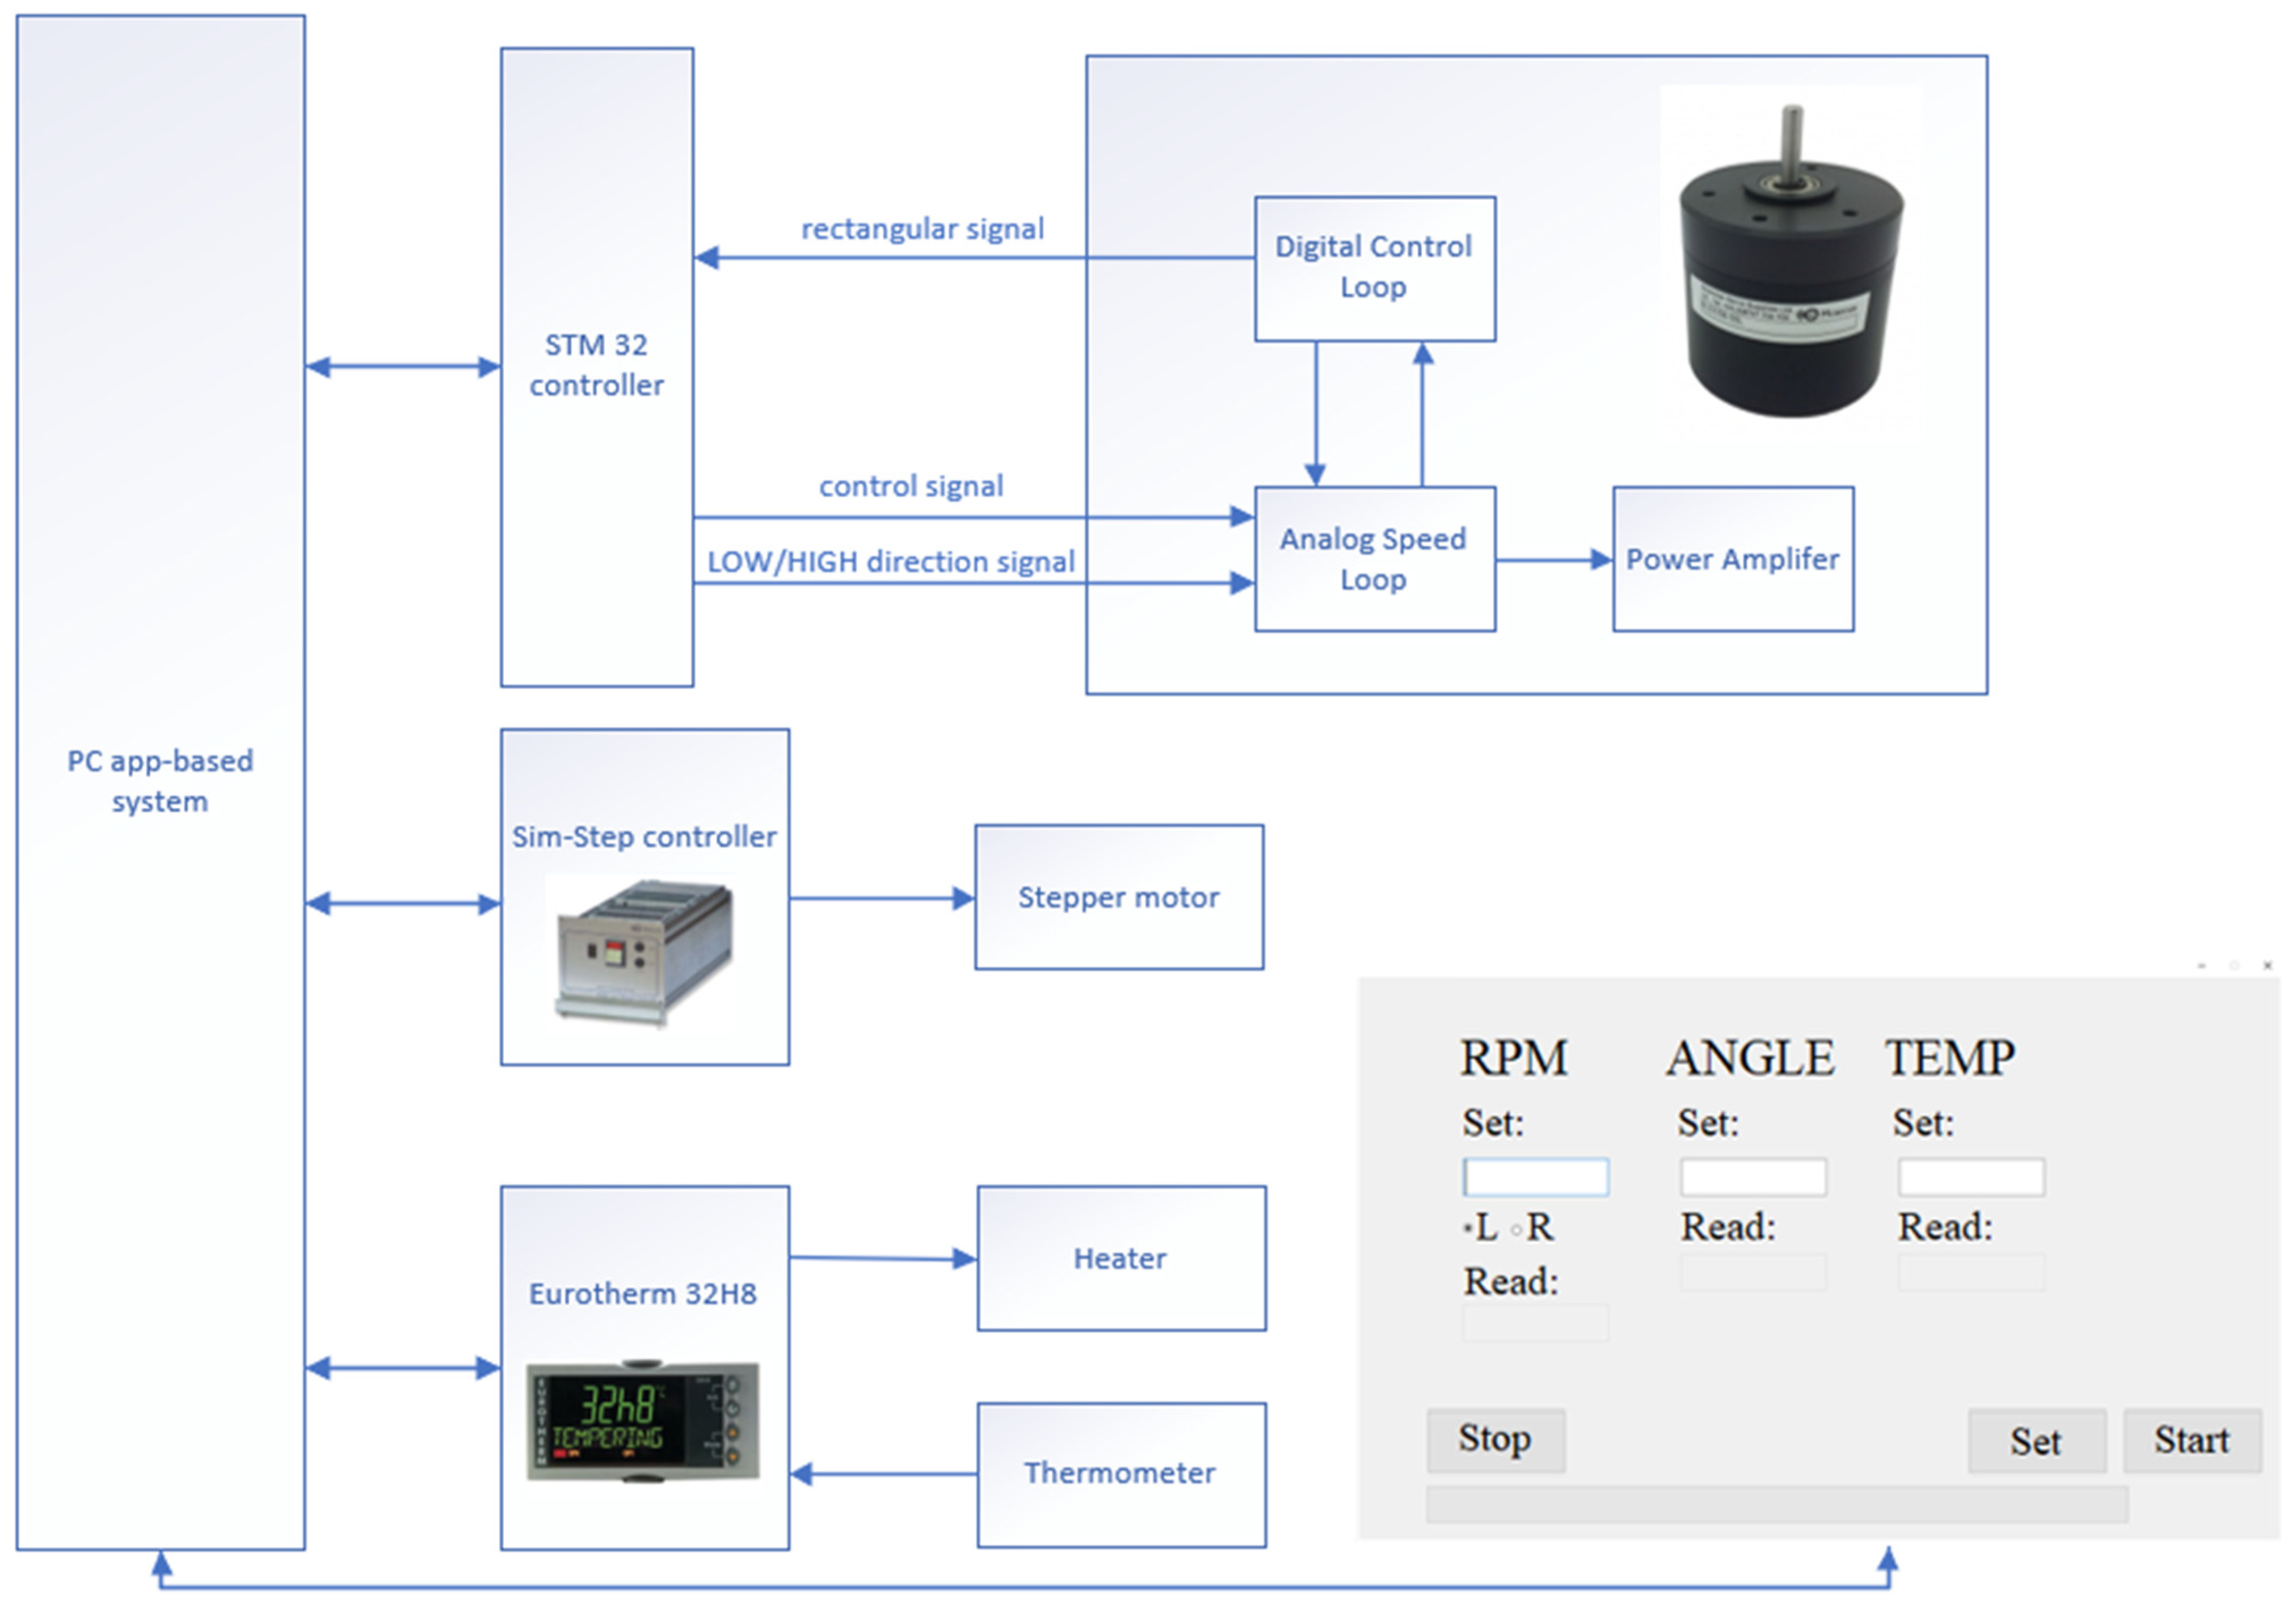
2.5. Developed by Our Team: App-Based System
3. Experimental Details
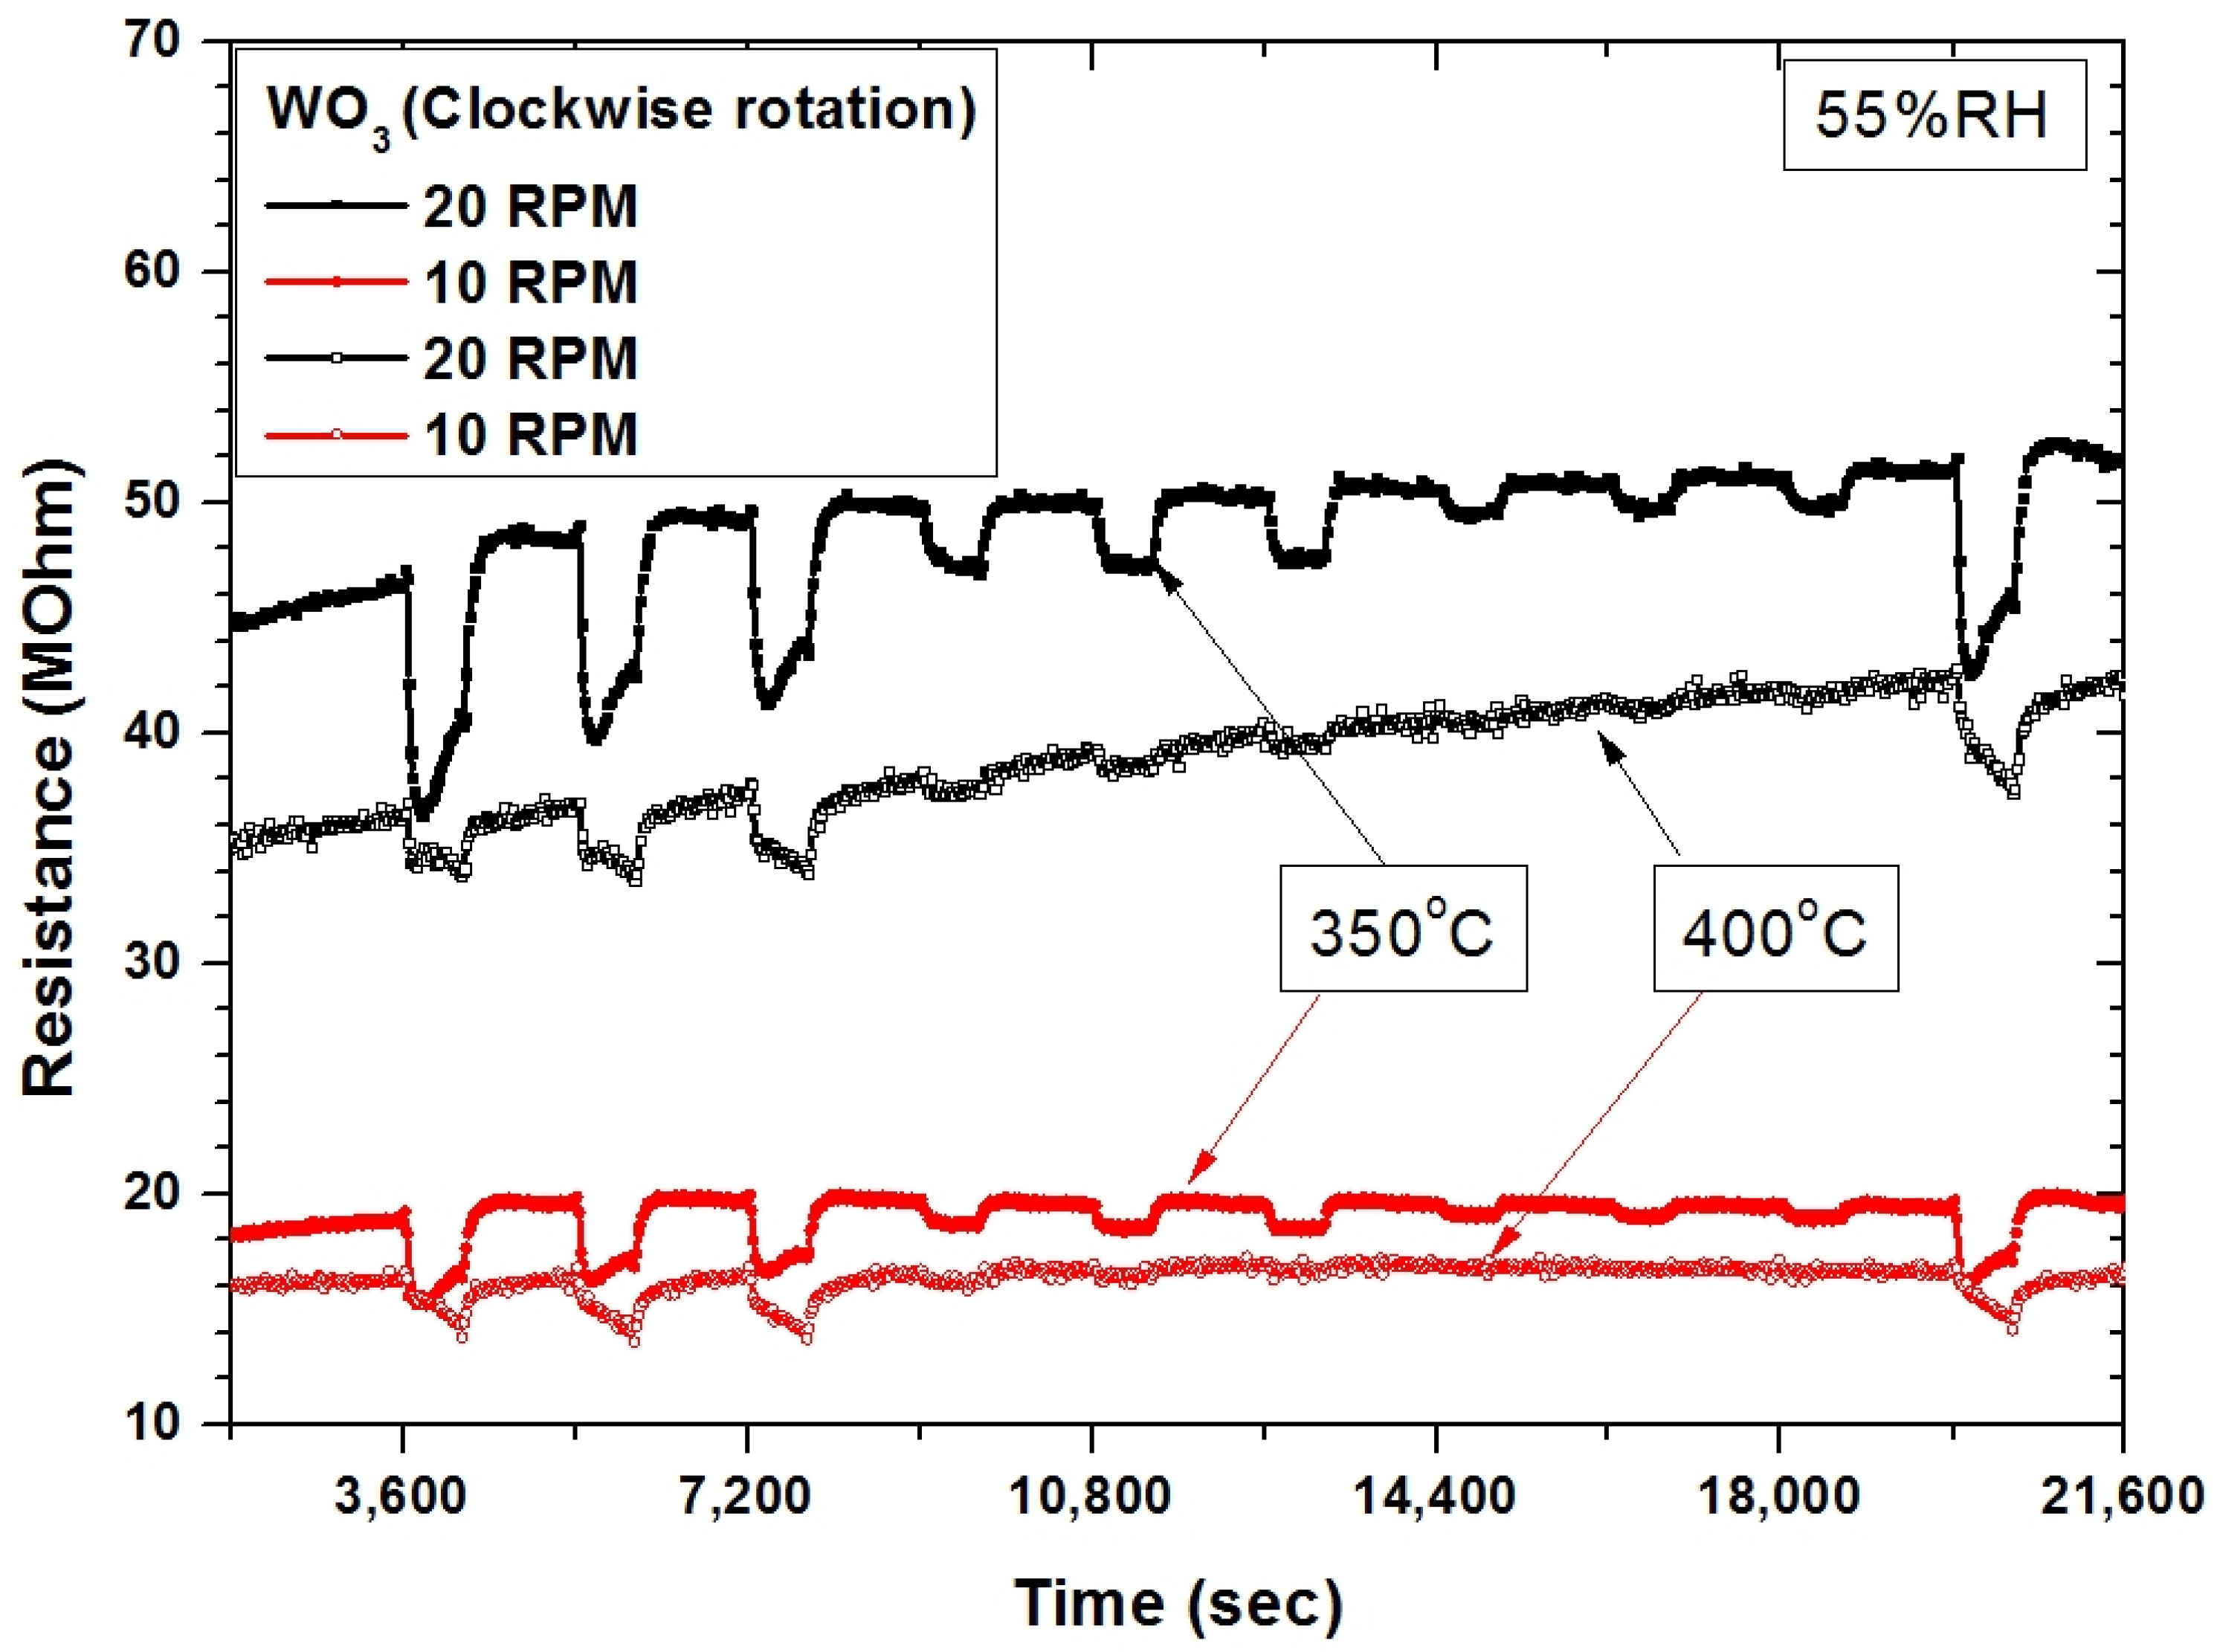
4. Results and Discussions
5. Conclusions
Author Contributions
Funding
Institutional Review Board Statement
Informed Consent Statement
Data Availability Statement
Conflicts of Interest
References
- Nowak, P.; Maziarz, W.; Rydosz, A.; Kowalski, K.; Ziabka, M.; Zakrzewska, K. SnO2/TiO2 thin film n-n heterostructures of improved sensitivity to NO2. Sensors 2020, 20, 6830. [Google Scholar] [CrossRef] [PubMed]
- Rydosz, A.; Dyndal, K.; Kollbek, K.; Andrysiewicz, W.; Sitarz, M.; Marszalek, K. Structure and optical properties of the WO3 thin films deposited by the GLAD magnetron sputtering technique. Vacuum 2020, 177, 109378. [Google Scholar] [CrossRef]
- Rydosz, A.; Dyndał, K.; Andrysiewicz, W.; Grochala, D.; Marszałek, K. GLAD magnetron sputtered ultra-thin copper oxide films for gas-sensing application. Coatings 2020, 10, 378. [Google Scholar] [CrossRef] [Green Version]
- Dyndal, K.; Zarzycki, A.; Andrysiewicz, W.; Grochala, D.; Marszalek, K.; Rydosz, A. CuO-Ga2O3 thin films as a gas-sensitive material for acetone detection. Sensors 2020, 20, 3142. [Google Scholar] [CrossRef]
- Steele, J.J.; Gospodyn, J.P.; Sit, J.C.; Brett, M.J. Impact of morphology on high-speed humidity sensor performance. IEEE Sens. J. 2006, 6, 24–27. [Google Scholar] [CrossRef]
- Steele, J.J.; Fitzpatrick, G.A.; Brett, M.J. Capacitive humidity sensors with high sensitivity and subsecond response times. IEEE Sens. J. 2007, 7, 955–956. [Google Scholar] [CrossRef]
- Taschuk, M.T.; Sorge, J.B.; Steele, J.J.; Brett, M.J. Ion-beam assisted glancing angle deposition for relative humidity sensors. IEEE Sens. J. 2008, 8, 1521–1522. [Google Scholar] [CrossRef]
- Steele, J.J.; Harris, K.D.; Brett, M.J. Nanostructured oxide films for high-speed humidity sensors. MRS Online Proc. Libr. 2003, 788, 1141–1146. [Google Scholar] [CrossRef]
- Taschuk, M.T.; Steele, J.J.; van Popta, A.C.; Brett, M.J. Photocatalytic regeneration of interdigitated capacitor relative humidity sensors fabricated by glancing angle deposition. Sens. Actuators B Chem. 2008, 134, 666–671. [Google Scholar] [CrossRef]
- Lee, K.; Shim, Y.-S.; Song, Y.G.; Han, S.D.; Lee, Y.-S.; Kang, C.-Y. Highly sensitive sensors based on metal-oxide nanocolumns for fire detection. Sensors 2017, 17, 303. [Google Scholar] [CrossRef] [Green Version]
- Daza, L.G.; Castro-Rodríguez, R.; Cirerol-Carrillo, M.; Martín-Tovar, E.A.; Méndez-Gamboa, J.; Medina-Esquivel, R.; Pérez-Quintana, I.; Iribarren, A. Nanocolumnar CdS thin films grown by glancing angle deposition from a sublimate vapor effusion source. J. Appl. Res. Technol. 2017, 15, 271–277. [Google Scholar] [CrossRef]
- Zarzycki, A.; Dyndał, K.; Sitarz, M.; Xu, J.; Gao, F.; Marszałek, K.; Rydosz, A. Influence of GLAD sputtering configuration on the crystal structure, morphology, and gas-sensing properties of the WO3 films. Coatings 2020, 10, 1030. [Google Scholar] [CrossRef]
- Kawamura, K.; Miyazawa, K.; Kent, L. The past, present and future in tube-and paper-based colorimetric gas detectors. AppliedChem 2021, 1, 14–40. [Google Scholar] [CrossRef]
- Liu, J.; Chen, Y.; Zhang, H. Study of highly sensitive formaldehyde sensors based on ZnO/CuO heterostructure via the sol-gel method. Sensors 2021, 21, 4685. [Google Scholar] [CrossRef]
- Pineda-Reyes, A.M.; Herrera-Rivera, M.R.; Rojas-Chávez, H.; Cruz-Martínez, H.; Medina, D.I. Recent advances in ZnO-based carbon monoxide sensors: Role of doping. Sensors 2021, 21, 4425. [Google Scholar] [CrossRef] [PubMed]
- Pargoletti, E.; Tricoli, A.; Longhi, M.; Chiarello, G.L.; Cappelletti, G. Disclosing the sensitivity and selectivity of metal oxide/graphene oxide-based chemoresistors towards VOCs. Eng. Proc. 2021, 6, 18. [Google Scholar] [CrossRef]
- Paul, M.; Tannenberg, R.; Tscheuschner, G.; Ponader, M.; Weller, M.G. Cocaine detection by a laser-induced immunofluorometric biosensor. Biosensors 2021, 11, 313. [Google Scholar] [CrossRef]
- Wimmer-Teubenbacher, R.; Sosada-Ludwikowska, F.; Köck, A.; Steinhauer, S.; Sowwan, M.; Singh, V. Optimization of SnO2-Based CMOS-integrated gas sensors by mono-, bi-and trimetallic nanoparticles. Proceedings 2020, 56, 43. [Google Scholar] [CrossRef]
- Depla, D. Magnetrons, Reactive Gases and Sputtering; Lulu.com: Morrisville, NC, USA, 2013. [Google Scholar]
- Schultz, H. Electron Beam Welding; Woodhead Publishing: Sawston, UK, 1993; Volume 93. [Google Scholar]
- Lee, S.; Jin, J.; Baek, J.; Lee, J.; Chae, H. Readout integrated circuit for small-sized and low-power gas sensor based on HEMT device. Sensors 2021, 21, 5637. [Google Scholar] [CrossRef]
- Rodrigues, M.S.; Borges, J.; Lopes, C.; Pereira, R.; Vasilevskiy, M.I.; Vaz, F. Gas sensors based on localized surface plasmon resonances: Synthesis of oxide films with embedded metal nanoparticles, theory and simulation, and sensitivity enhancement strategies. Appl. Sci. 2021, 11, 5388. [Google Scholar] [CrossRef]
- Sakkas, C.; Rauch, J.-Y.; Cote, J.-M.; Tissot, V.; Gavoille, J.; Martin, N. Tuning the optical properties of WO3 films exhibiting a zigzag columnar microstructure. Coatings 2021, 11, 438. [Google Scholar] [CrossRef]
- Santos, J.G.S.; Correa, M.A.; Ferreira, A.; R Carvalho, B.; da Silva, R.B.; Bohn, F.; Lanceiros-Méndez, S.; Vaz, F. Magnetic response dependence of ZnO based thin films on Ag doping and processing architecture. Materials 2020, 13, 2907. [Google Scholar] [CrossRef]
- Butt, M.; Verma, P.; Rasshchepkina, N.; Soloviev, V.; Kazanskiy, N.; Skidanov, R.; Khonina, S.; Poletaev, S.; Podlipnov, V.; Fomchenkov, S. Fabrication of silicon slanted grating by using modified thermal deposition technique to enhance fiber-to-chip coupling. In Proceedings of the 2016 International Conference on Microelectronics, Computing and Communications (MicroCom), Durgapur, India, 23–25 January 2016; pp. 1–4. [Google Scholar]
- Correa, M.A.; Ferreira, A.; Tromer, R.M.; Machado, L.D.; Gamino, M.; França Junior, S.A.; Bohn, F.; Vaz, F. Improving the Room-Temperature Ferromagnetism in ZnO and low-doped ZnO: Ag films using GLAD sputtering. Materials 2021, 14, 5337. [Google Scholar] [CrossRef]
- Limwichean, S.; Kasayapanand, N.; Ponchio, C.; Nakajima, H.; Patthanasettakul, V.; Eiamchai, P.; Meng, G.; Horprathum, M. Morphology-controlled fabrication of nanostructured WO3 thin films by magnetron sputtering with glancing angle deposition for enhanced efficiency photo-electrochemical water splitting. Ceram. Int. 2021, 47, 34455–34462. [Google Scholar] [CrossRef]
- Mendoza-Rincón, S.; Ospina-Arroyave, M.; Mateus, D.A.; Escobar-Rincón, D.; Restrepo-Parra, E. Substrate rotation effect over scaling roughness exponents in Zr thin films grown by GLAD technique. Appl. Surf. Sci. 2021, 559, 149660. [Google Scholar] [CrossRef]
- Lin, C.-B.; Lin, Y.-H.; Chen, W.-Y.; Liu, C.-Y. Photonic Nanojet Modulation Achieved by a Spider-Silk-Based Metal–Dielectric Dome Microlens. Photonics 2021, 8, 334. [Google Scholar] [CrossRef]
- Yussuf, N.A.; Huang, H. Branching of titanium nanorods. Nanomaterials 2021, 11, 1070. [Google Scholar] [CrossRef] [PubMed]
- Furusawa, G.; Kan, T. Au nanospirals transferred onto PDMS film exhibiting circular dichroism at visible wavelengths. Micromachines 2020, 11, 641. [Google Scholar] [CrossRef] [PubMed]
- Liang, H.; Geng, X.; Li, W.; Panepinto, A.; Thiry, D.; Chen, M.; Snyders, R. Experimental and modeling study of the fabrication of Mg nano-sculpted films by magnetron sputtering combined with glancing angle deposition. Coatings 2019, 9, 361. [Google Scholar] [CrossRef] [Green Version]
- Abbas, N.; Lu, X.; Badshah, M.A.; In, J.B.; Heo, W.I.; Park, K.Y.; Lee, M.-K.; Kim, C.H.; Kang, P.; Chang, W.-J. Development of a protein microarray chip with enhanced fluorescence for identification of semen and vaginal fluid. Sensors 2018, 18, 3874. [Google Scholar] [CrossRef] [PubMed] [Green Version]
- Jen, Y.-J.; Wang, W.-C.; Wu, K.-L.; Lin, M.-J. Extinction properties of obliquely deposited TiN nanorod arrays. Coatings 2018, 8, 465. [Google Scholar] [CrossRef] [Green Version]
- Yoo, K.S.; Han, S.D.; Moon, H.G.; Yoon, S.-J.; Kang, C.-Y. Highly sensitive H2S sensor based on the metal-catalyzed SnO2 nanocolumns fabricated by glancing angle deposition. Sensors 2015, 15, 15468–15477. [Google Scholar] [CrossRef] [Green Version]
- Nacer, S.B.; Jlidi, D.; Labidi, A.; Akkari, F.C.; Touihri, S.; Maaref, M. Promising ethanol detection enhancement of Cu2O thin film deposited by GLAD technique. Measurement 2020, 151, 107208. [Google Scholar] [CrossRef]
- Ferhati, H.; Djeffal, F.; Martin, N. Highly improved responsivity of self-powered UV–Visible photodetector based on TiO2/Ag/TiO2 multilayer deposited by GLAD technique: Effects of oriented columns and nano-sculptured surface. Appl. Surf. Sci. 2020, 529, 147069. [Google Scholar] [CrossRef]
- Kurt, J. Lesker Company. Available online: https://www.lesker.com/newweb/chambers/std_boxchamber.cfm (accessed on 8 September 2021).
- Kurt, J. Lesker Company. Available online: https://www.lesker.com/newweb/sample_manipulation/epicentrestages_ec-rseries.cfm (accessed on 8 September 2021).
- Movchan, B.A.; Demchishin, A.V. Study of the structure and properties of thick vacuum condensates of nickel, titanium, tungsten, aluminum oxide, and zirconium oxide. Fiz. Met. Metalloved. 1969, 28, 83. [Google Scholar]
- Hawkeye, M.M.; Brett, M.J. Glancing angle deposition: Fabrication, properties, and applications of micro-and nanostructured thin films. J. Vac. Sci. Technol. A Vac. Surf. Films 2007, 25, 1317–1335. [Google Scholar] [CrossRef]
- Rydosz, A.; Kollbek, K.; Kim-Ngan, N.-T.H.; Czapla, A.; Brudnik, A. Optical diagnostics of the magnetron sputtering process of copper in an argon–oxygen atmosphere. J. Mater. Sci. Mater. Electron. 2020, 31, 11624–11636. [Google Scholar] [CrossRef]
- Paleczek, A.; Szafraniak, B.; Fuśnik, Ł.; Brudnik, A.; Grochala, D.; Kluska, S.; Jurzecka-Szymacha, M.; Maciak, E.; Kałużyński, P.; Rydosz, A. The heterostructures of CuO and SnOx for NO2 detection. Sensors 2021, 21, 4387. [Google Scholar] [CrossRef]
- Jiang, L.; Lv, S.; Tang, W.; Zhao, L.; Wang, C.; Wang, J.; Wang, T.; Guo, X.; Liu, F.; Wang, C. YSZ-based acetone sensor using a Cd2SnO4 sensing electrode for exhaled breath detection in medical diagnosis. Sens. Actuators B Chem. 2021, 345, 130321. [Google Scholar] [CrossRef]
- Dent, A.G.; Sutedja, T.G.; Zimmerman, P.V. Exhaled breath analysis for lung cancer. J. Thorac. Dis. 2013, 5, S540. [Google Scholar]
- Mansouri, S.; Boulares, S.; Alhadidi, T. Non-invasive measurement of blood glucose by breath analysis. IEEJ Trans. Electr. Electron. Eng. 2020, 15, 1457–1464. [Google Scholar] [CrossRef]
- Reyes-Reyes, A.; Horsten, R.C.; Urbach, H.P.; Bhattacharya, N. Study of the exhaled acetone in type 1 diabetes using quantum cascade laser spectroscopy. Anal. Chem. 2015, 87, 507–512. [Google Scholar] [CrossRef]
- Wang, D.; Zhang, F.; Prabhakar, A.; Qin, X.; Forzani, E.S.; Tao, N. Colorimetric sensor for online accurate detection of breath acetone. ACS Sens. 2020, 6, 450–453. [Google Scholar] [CrossRef]
- Blanchet, L.; Smolinska, A.; Baranska, A.; Tigchelaar, E.; Swertz, M.; Zhernakova, A.; Dallinga, J.; Wijmenga, C.; van Schooten, F.J. Factors that influence the volatile organic compound content in human breath. J. Breath Res. 2017, 11, 016013. [Google Scholar] [CrossRef]
- Suntrup Iii, D.J.; Ratto, T.V.; Ratto, M.; McCarter, J.P. Characterization of a high-resolution breath acetone meter for ketosis monitoring. PeerJ 2020, 8, e9969. [Google Scholar] [CrossRef] [PubMed]
- Sun, M.; Chen, Z.; Gong, Z.; Zhao, X.; Jiang, C.; Yuan, Y.; Wang, Z.; Li, Y.; Wang, C. Determination of breath acetone in 149 Type 2 diabetic patients using a ringdown breath-acetone analyzer. Anal. Bioanal. Chem. 2015, 407, 1641–1650. [Google Scholar] [CrossRef] [PubMed]
- Marcondes-Braga, F.G.; Batista, G.L.; Bacal, F.; Gutz, I. Exhaled breath analysis in heart failure. Curr. Heart Fail. Rep. 2016, 13, 166–171. [Google Scholar] [CrossRef]
- Yokokawa, T.; Sato, T.; Suzuki, S.; Oikawa, M.; Yoshihisa, A.; Kobayashi, A.; Yamaki, T.; Kunii, H.; Nakazato, K.; Suzuki, H. Elevated exhaled acetone concentration in stage C heart failure patients with diabetes mellitus. BMC Cardiovasc. Disord. 2017, 17, 280. [Google Scholar] [CrossRef] [PubMed]
- Rydosz, A. Sensors for enhanced detection of acetone as a potential tool for noninvasive diabetes monitoring. Sensors 2018, 18, 2298. [Google Scholar] [CrossRef] [Green Version]
- Rydosz, A.; Szkudlarek, A.; Ziabka, M.; Domanski, K.; Maziarz, W.; Pisarkiewicz, T. Performance of Si-doped WO3 thin films for acetone sensing prepared by glancing angle DC magnetron sputtering. IEEE Sens. J. 2015, 16, 1004–1012. [Google Scholar] [CrossRef]


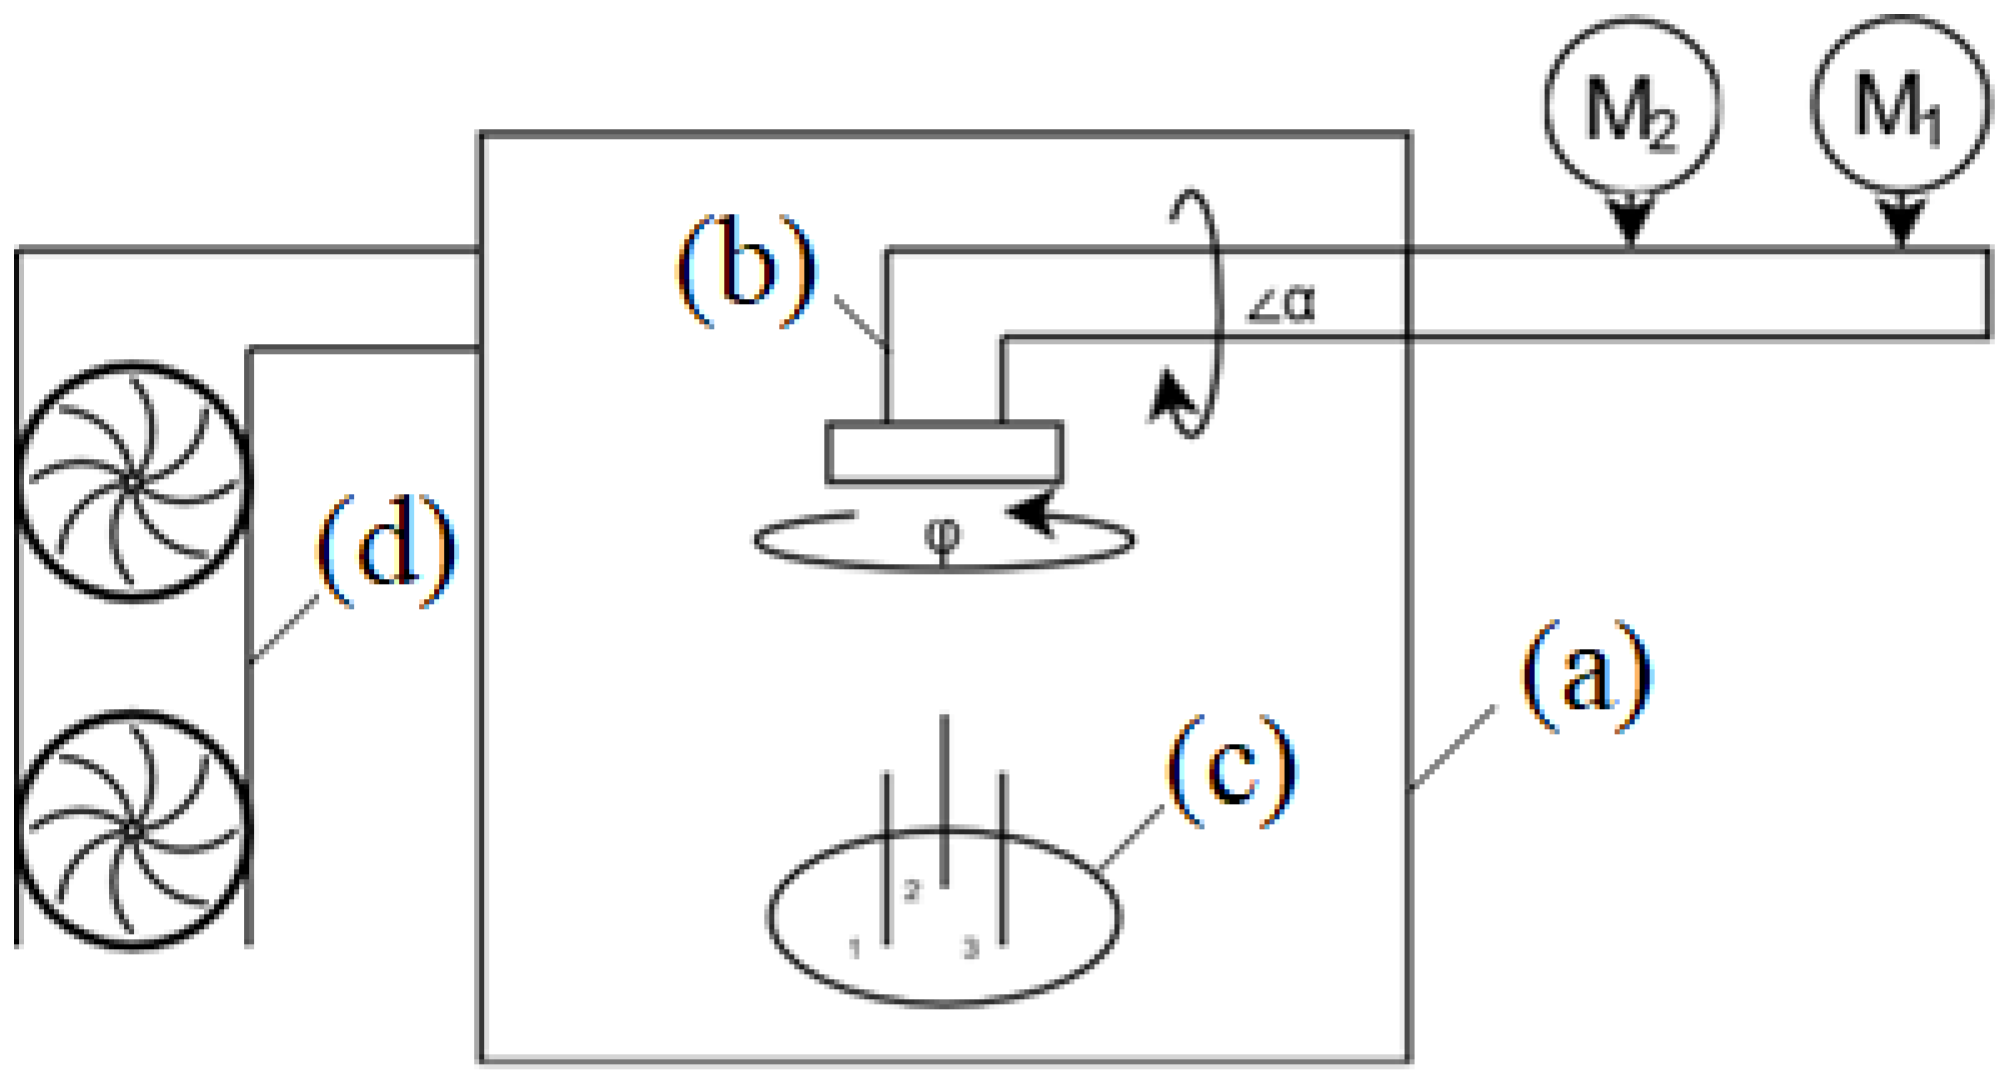
| Letter | Description |
|---|---|
| (a) | Chamber |
| (b) | Manipulator |
| (c) | Magnetrons |
| (d) | Vacuum pump |
| M1 | DC motor |
| M2 | Stepper motor |
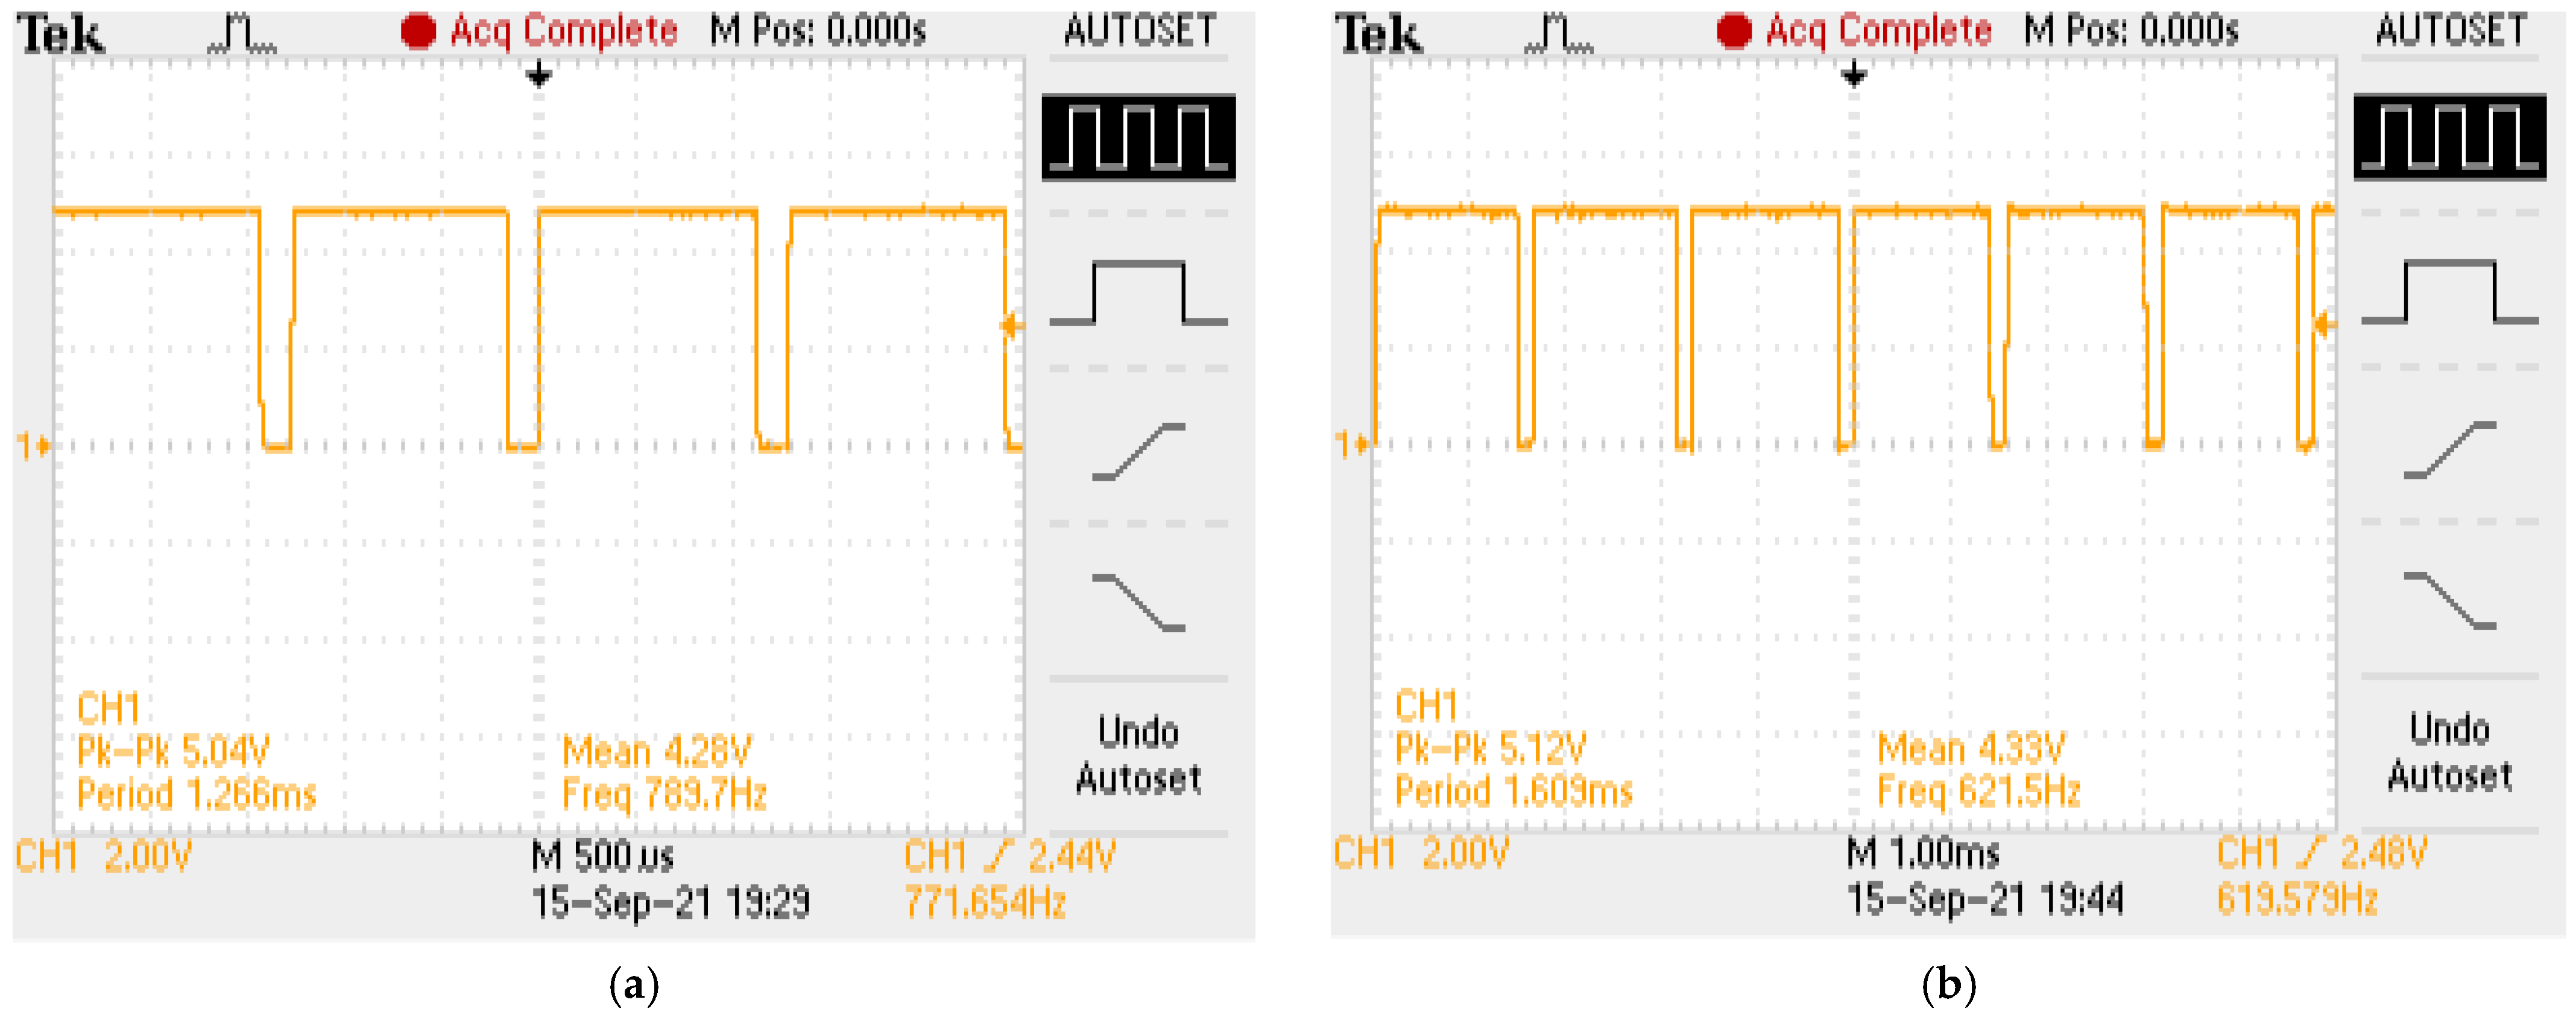
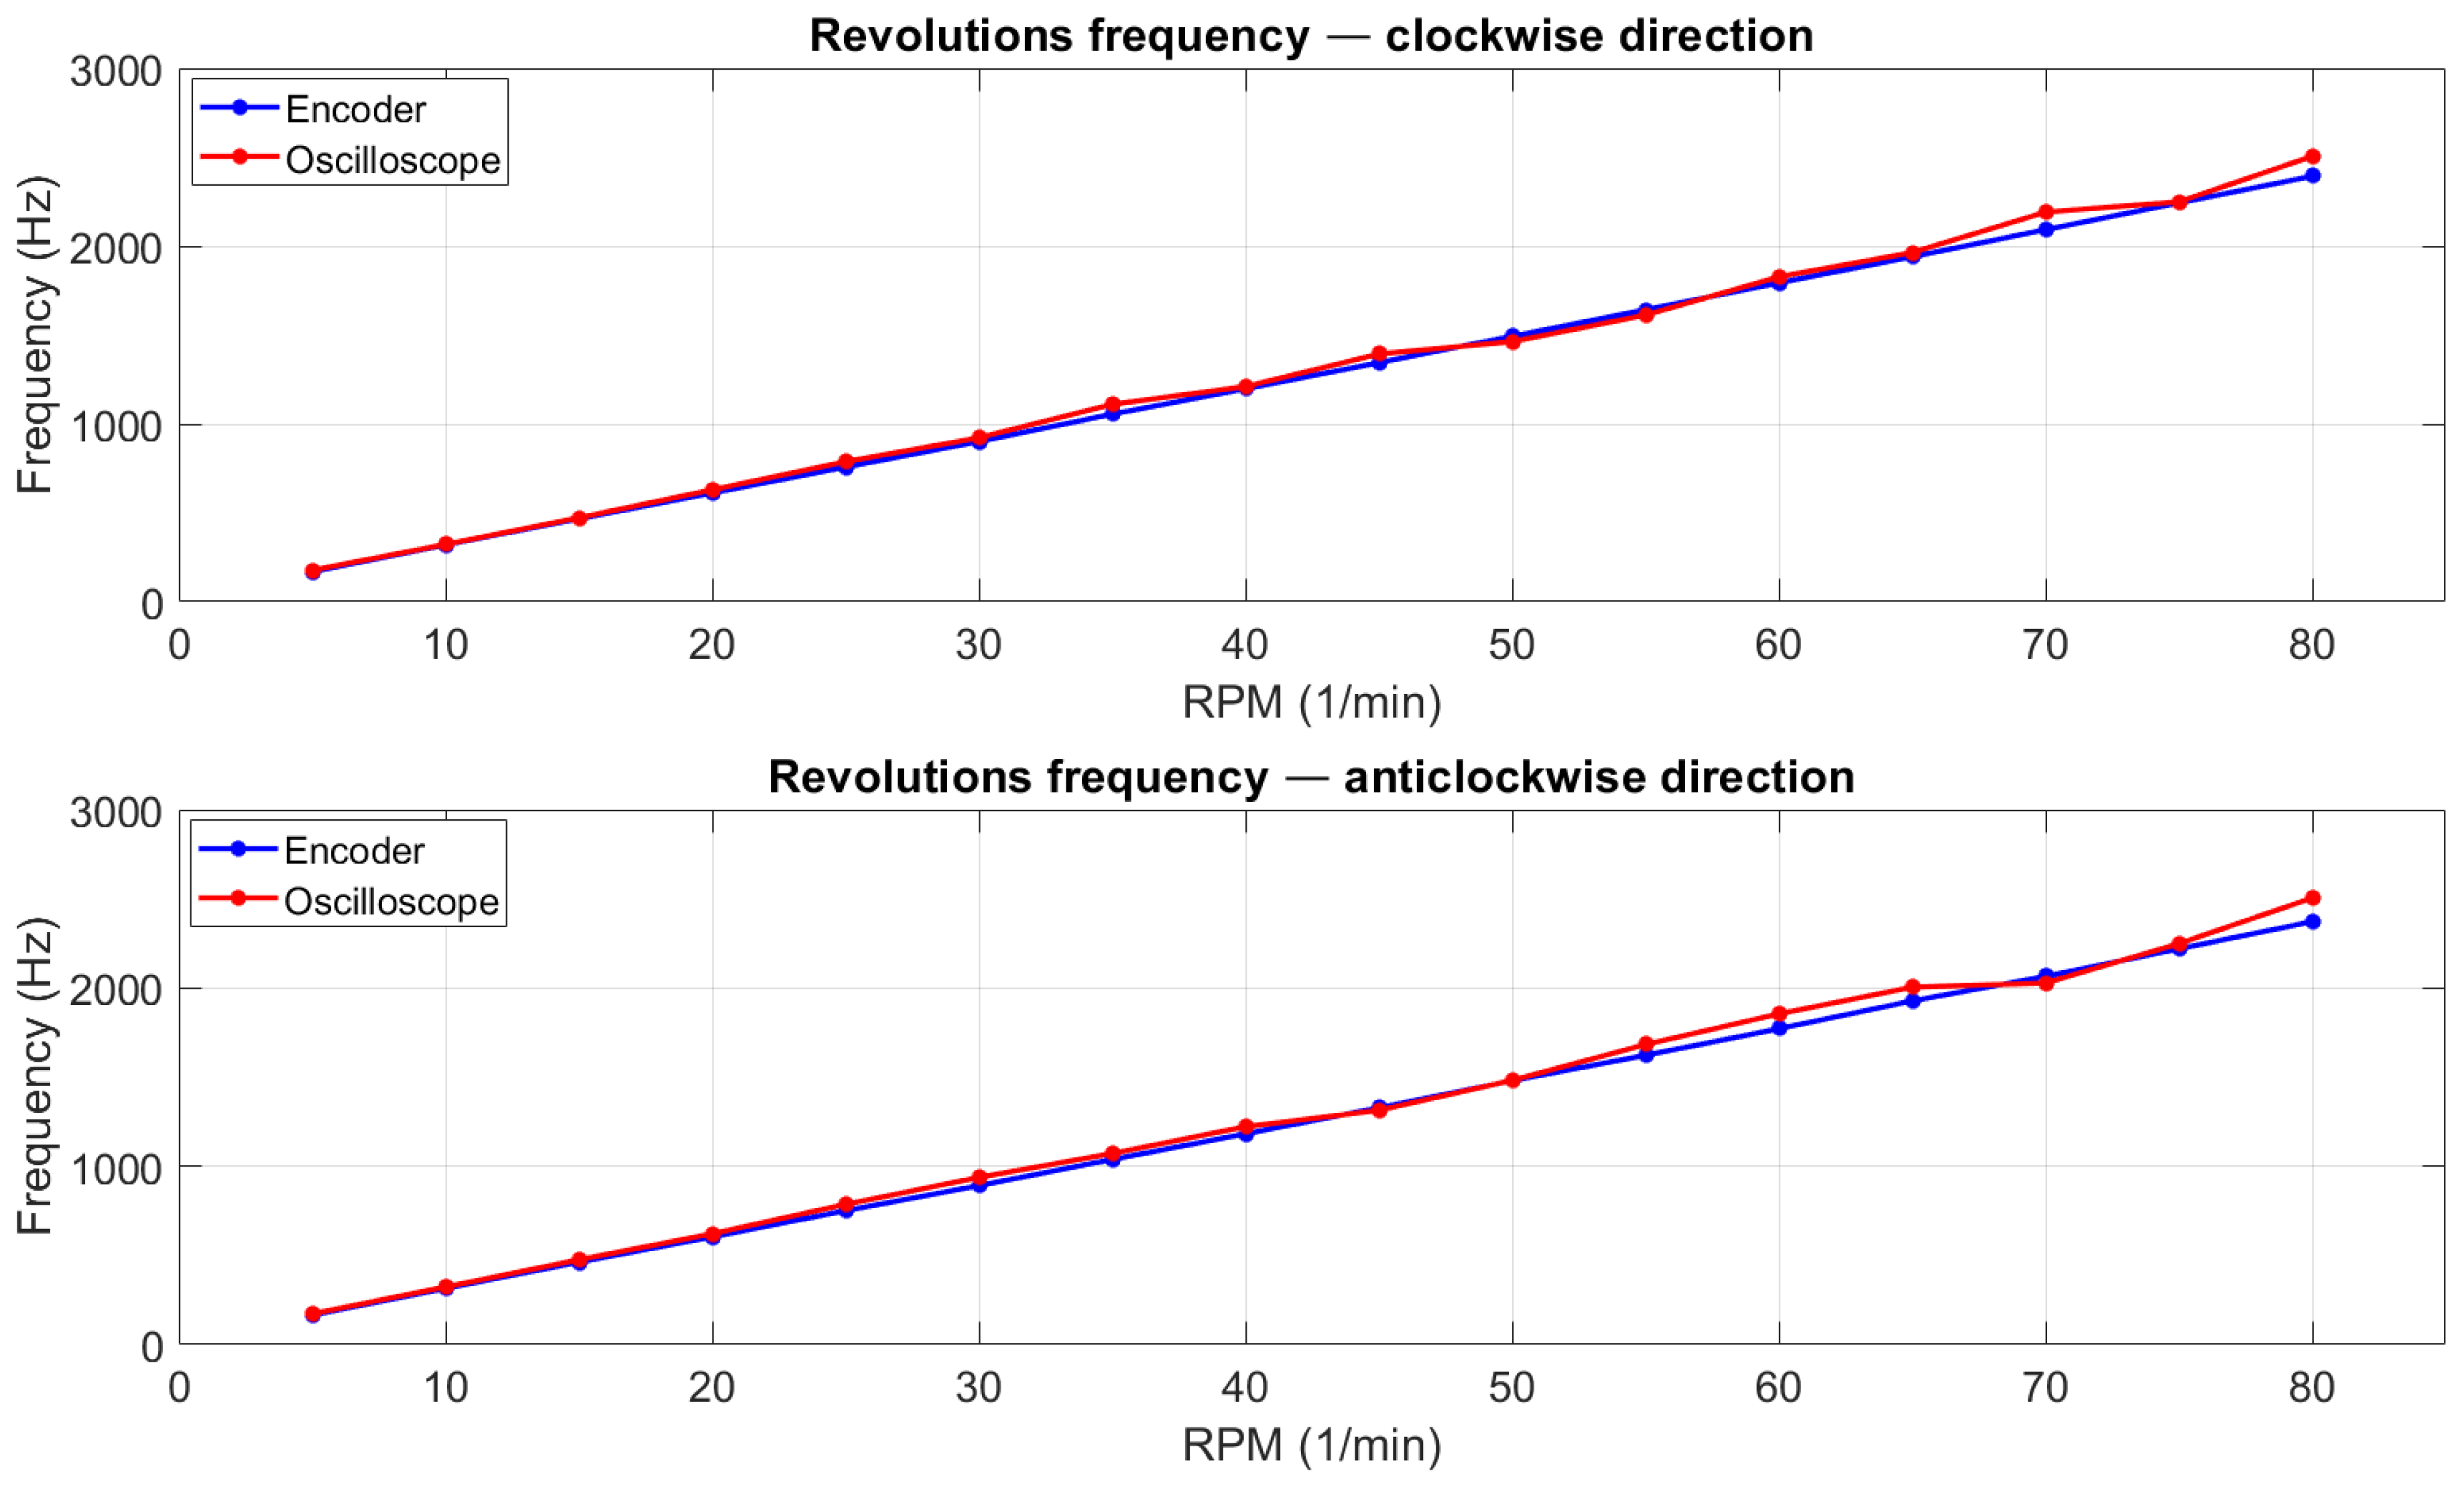
| Rotation Speed (rpm) | Encoder Frequency (HZ), Clockwise Revolutions | Oscilloscope Frequency (HZ), Clockwise Revolutions | Encoder Frequency (HZ), Anticlockwise Revolutions | Oscilloscope Frequency (HZ), Anticlockwise Revolutions |
|---|---|---|---|---|
| 20 | 611.61 | 629.60 | 604.11 | 621.50 |
| 60 | 1793.19 | 1827.00 | 1771.59 | 1855.00 |
| Absolute Error | Relative Error | |
|---|---|---|
| Clockwise directions | 33.66 Hz | 2.62% |
| Anticlockwise directions | 39.89 Hz | 3.11% |
| Absolute Error | Relative Error | |||
|---|---|---|---|---|
| Before | After | Before | After | |
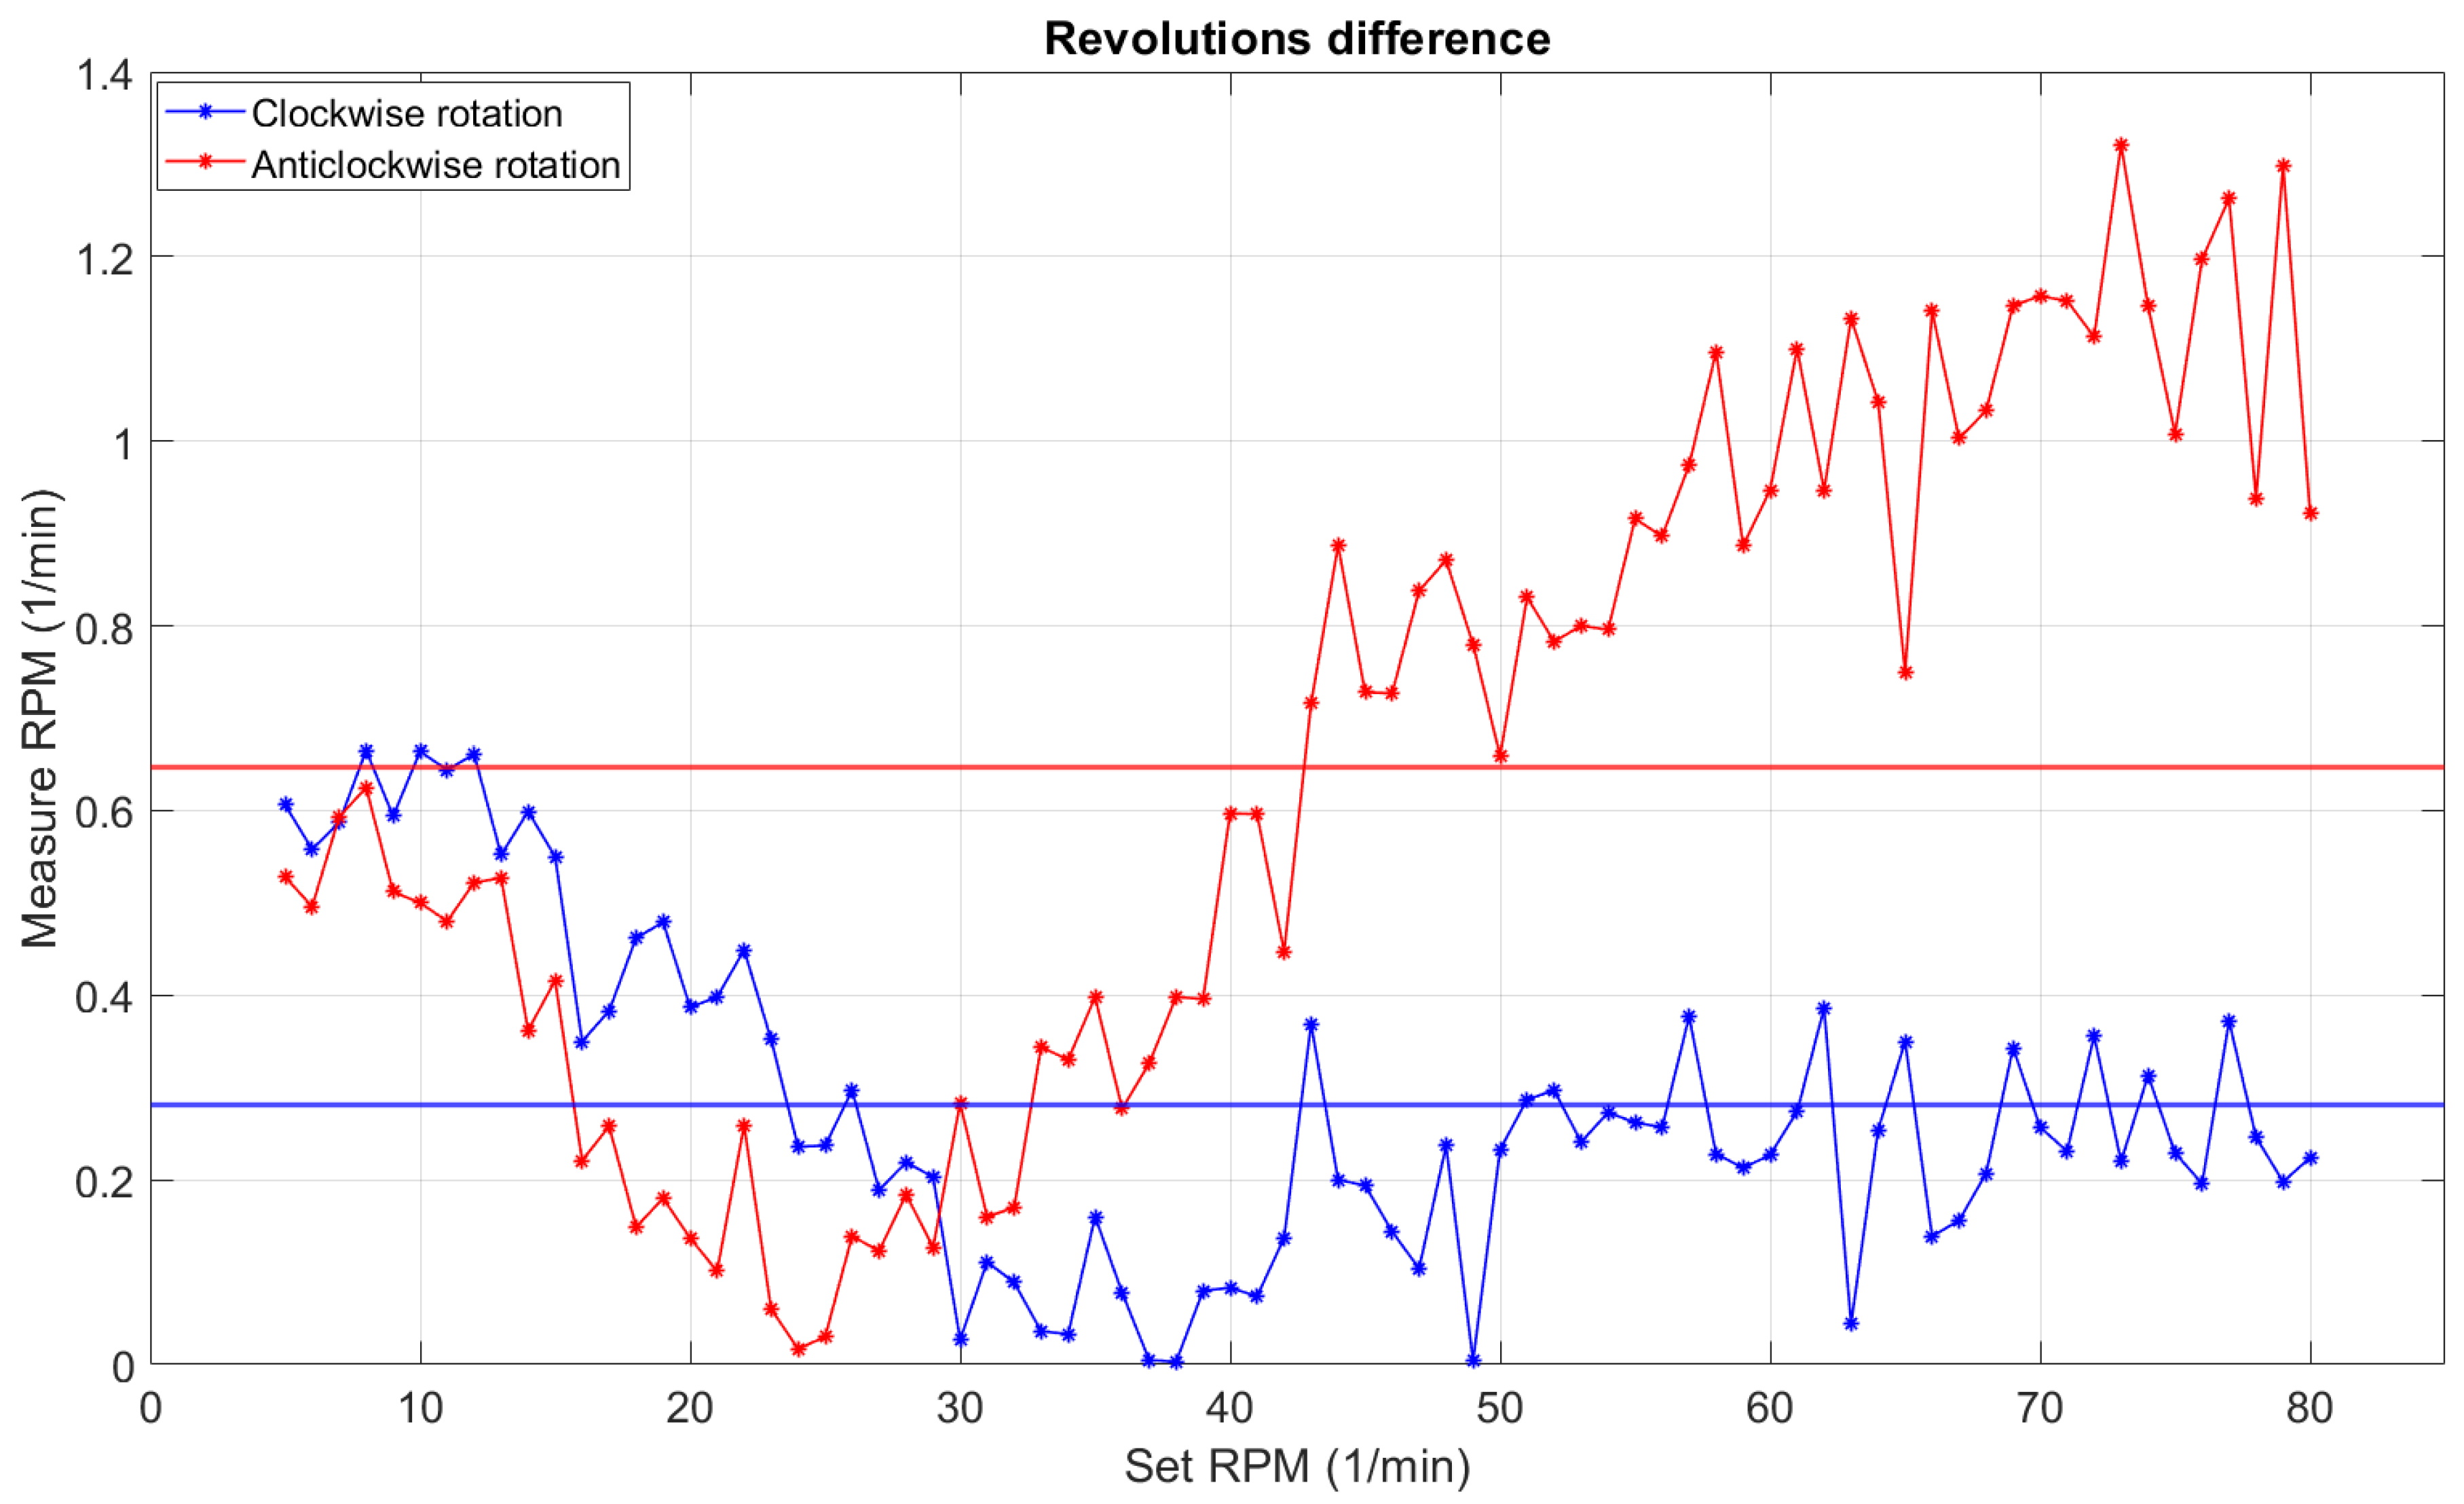
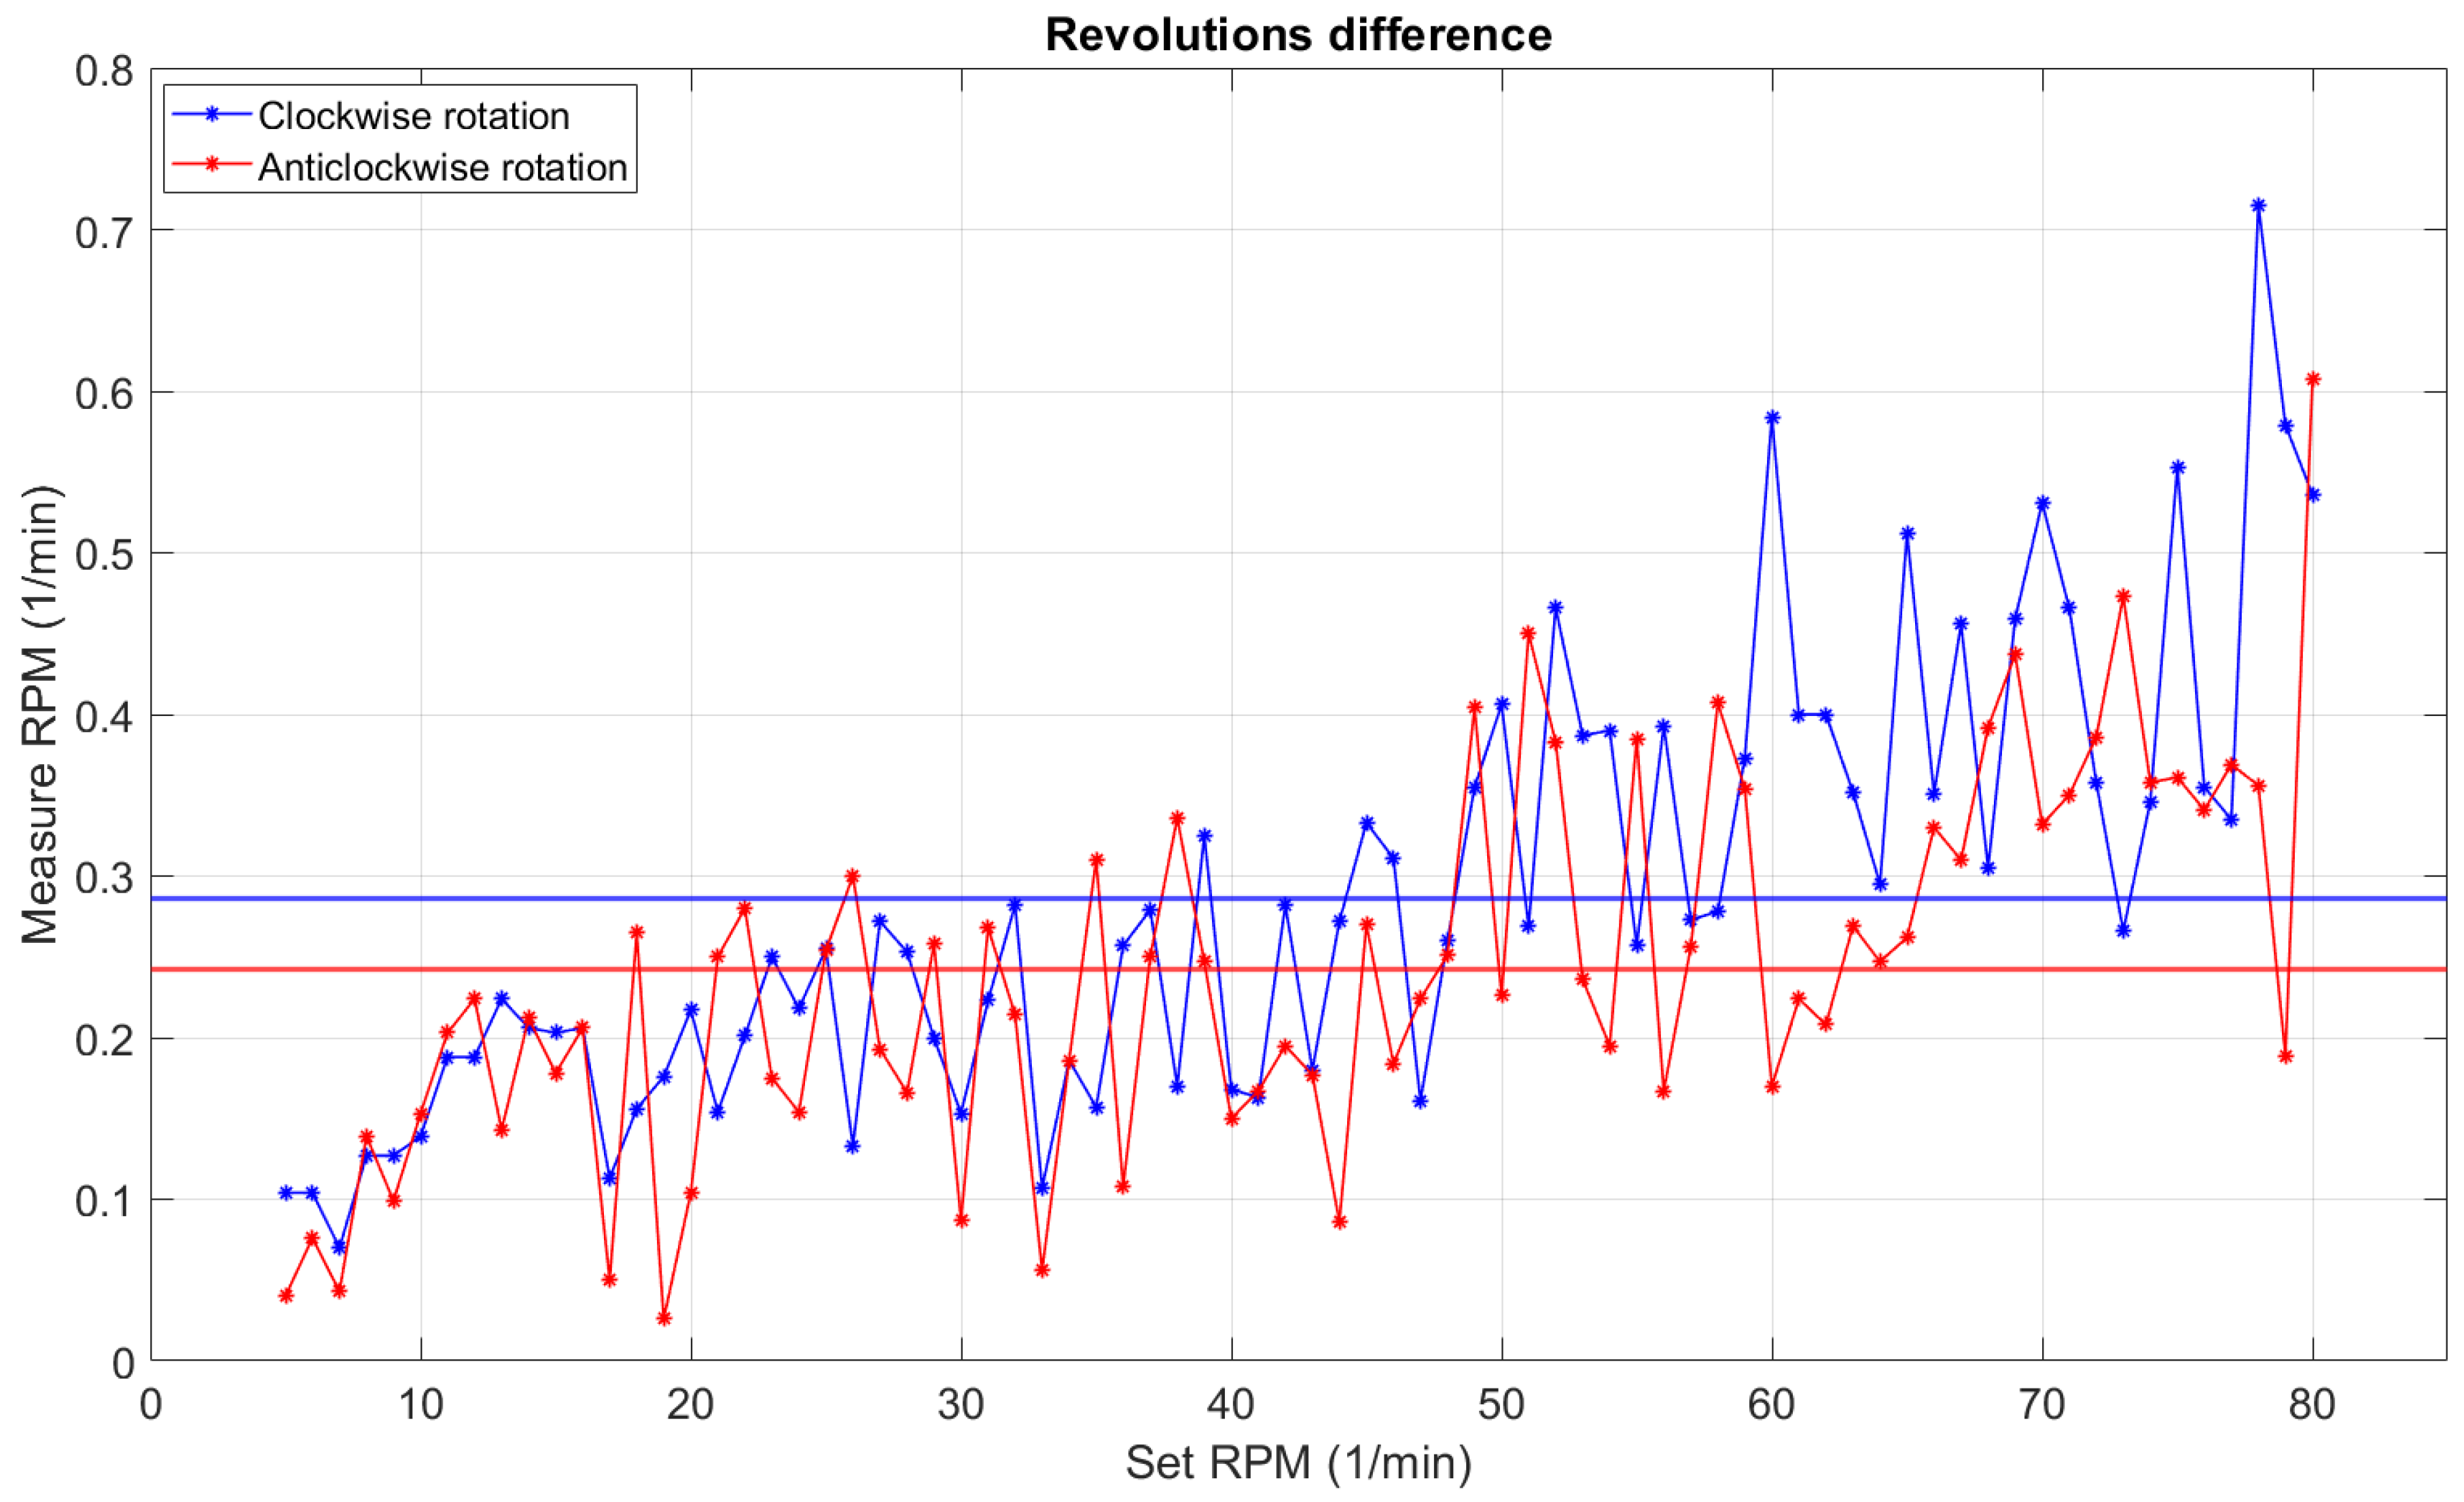
| Clockwise directions | 0.2813 RPM | 0.2862 rpm | 1.5% | 0.80% |
| Anticlockwise directions | 0.6475 RPM | 0.2419 rpm | 1.93% | 0.69% |
Publisher’s Note: MDPI stays neutral with regard to jurisdictional claims in published maps and institutional affiliations. |
© 2022 by the authors. Licensee MDPI, Basel, Switzerland. This article is an open access article distributed under the terms and conditions of the Creative Commons Attribution (CC BY) license (https://creativecommons.org/licenses/by/4.0/).
Share and Cite
Bronicki, J.; Grochala, D.; Rydosz, A. Developing GLAD Parameters to Control the Deposition of Nanostructured Thin Film. Sensors 2022, 22, 651. https://doi.org/10.3390/s22020651
Bronicki J, Grochala D, Rydosz A. Developing GLAD Parameters to Control the Deposition of Nanostructured Thin Film. Sensors. 2022; 22(2):651. https://doi.org/10.3390/s22020651
Chicago/Turabian StyleBronicki, Jakub, Dominik Grochala, and Artur Rydosz. 2022. "Developing GLAD Parameters to Control the Deposition of Nanostructured Thin Film" Sensors 22, no. 2: 651. https://doi.org/10.3390/s22020651
APA StyleBronicki, J., Grochala, D., & Rydosz, A. (2022). Developing GLAD Parameters to Control the Deposition of Nanostructured Thin Film. Sensors, 22(2), 651. https://doi.org/10.3390/s22020651