
Deep Learning Approach for Automatic Microaneurysms Detection

 , , ,
, , ,
Abstract
:1. Introduction
2. Materials and Methods
2.1. Datasets
2.2. Data Pre-Processing
2.3. Patch Generation
2.4. Pre-Trained DNNs for Feature Extraction
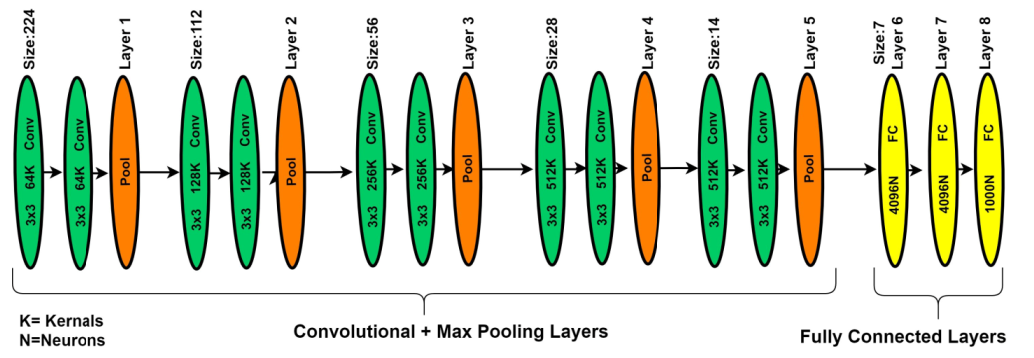
2.4.1. VGG-19 DNN
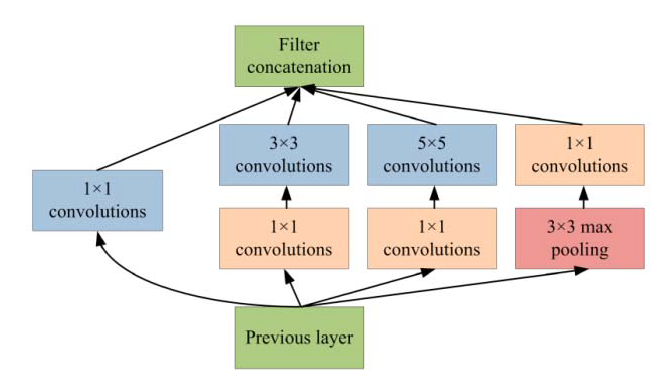
2.4.2. Inception-v3 DNN
2.5. Feature Embedding
3. Experimental Setup
4. Results and Discussion
5. Conclusions
Author Contributions
Funding
Institutional Review Board Statement
Informed Consent Statement
Data Availability Statement
Acknowledgments
Conflicts of Interest
References
- Vashist, P.; Singh, S.; Gupta, N.; Saxena, R. Role of early screening for diabetic retinopathy in patients with diabetes mellitus: An overview. Indian J. Community Med. 2011, 36, 247. [Google Scholar] [CrossRef]
- Mateen, M.; Wen, J.; Song, S.; Huang, Z. Fundus image classification using VGG-19 architecture with PCA and SVD. Symmetry 2019, 11, 1. [Google Scholar] [CrossRef] [Green Version]
- Habib, M.; Welikala, R.; Hoppe, A.; Owen, C.; Rudnicka, A.; Barman, S. Detection of microaneurysms in retinal images using an ensemble classifier. Inform. Med. Unlocked 2017, 9, 44–57. [Google Scholar] [CrossRef]
- Kumar, M.; Nath, M.K. Detection of microaneurysms and exudates from color fundus images by using SBGFRLS algorithm. In Proceedings of the International Conference on Informatics and Analytics, Pondicherry, India, 25–26 August 2016. [Google Scholar]
- Sreng, S.; Maneerat, N.; Hamamoto, K. Automated microaneurysms detection in fundus images using image segmentation. In Proceedings of the 2017 International Conference on Digital Arts, Media and Technology (ICDAMT), Chiang Mai, Thailand, 1–4 March 2017. [Google Scholar]
- Pereira, C.; Veiga, D.; Mahdjoub, J.; Guessoum, Z.; Gonçalves, L.; Ferreira, M.; Monteiro, J. Using a multi-agent system approach for microaneurysm detection in fundus images. Artif. Intell. Med. 2014, 60, 179–188. [Google Scholar] [CrossRef]
- Agrawal, A.; Bhatnagar, C.; Jalal, A.S. A survey on automated microaneurysm detection in diabetic retinopathy retinal images. In Proceedings of the 2013 International Conference on Information Systems and Computer Networks, Mathura, India, 9–10 March 2013. [Google Scholar]
- Wu, B.; Zhu, W.; Shi, F.; Zhu, S.; Chen, X. Automatic detection of microaneurysms in retinal fundus images. Comput. Med. Imaging Graph. 2017, 55, 106–112. [Google Scholar] [CrossRef]
- Rosas-Romero, R.; Martínez-Carballido, J.; Hernández-Capistrán, J.; Uribe-Valencia, L.J. A method to assist in the diagnosis of early diabetic retinopathy: Image processing applied to detection of microaneurysms in fundus images. Comput. Med. Imaging Graph. 2015, 44, 41–53. [Google Scholar] [CrossRef]
- Tavakoli, M.; Shahri, R.P.; Pourreza, H.; Mehdizadeh, A.; Banaee, T.; Toosi, M.H.B. A complementary method for automated detection of microaneurysms in fluorescein angiography fundus images to assess diabetic retinopathy. Pattern Recognit. 2013, 46, 2740–2753. [Google Scholar] [CrossRef] [Green Version]
- Sopharak, A.; Uyyanonvara, B.; Barman, S. Simple hybrid method for fine microaneurysm detection from non-dilated diabetic retinopathy retinal images. Comput. Med. Imaging Graph. 2013, 37, 394–402. [Google Scholar] [CrossRef]
- Datta, N.S.; Dutta, H.S.; De, M.; Mondal, S. An effective approach: Image quality enhancement for microaneurysms detection of non-dilated retinal fundus image. Procedia Technol. 2013, 10, 731–737. [Google Scholar] [CrossRef] [Green Version]
- Zhang, B.; Karray, F.; Li, Q.; Zhang, L. Sparse representation classifier for microaneurysm detection and retinal blood vessel extraction. Inf. Sci. 2012, 200, 78–90. [Google Scholar] [CrossRef]
- Akram, M.U.; Khalid, S.; Khan, S.A. Identification and classification of microaneurysms for early detection of diabetic retinopathy. Pattern Recognit. 2013, 46, 107–116. [Google Scholar] [CrossRef]
- Zhou, W.; Wu, C.; Chen, D.; Yi, Y.; Du, W. Automatic microaneurysm detection using the sparse principal component analysis-based unsupervised classification method. IEEE Access 2017, 5, 2563–2572. [Google Scholar] [CrossRef]
- Ren, F.; Cao, P.; Li, W.; Zhao, D.; Zaiane, O. Ensemble based adaptive over-sampling method for imbalanced data learning in computer aided detection of microaneurysm. Comput. Med. Imaging Graph. 2017, 55, 54–67. [Google Scholar] [CrossRef]
- Javidi, M.; Pourreza, H.-R.; Harati, A. Vessel segmentation and microaneurysm detection using discriminative dictionary learning and sparse representation. Comput. Methods Programs Biomed. 2017, 139, 93–108. [Google Scholar] [CrossRef]
- Yadav, D.; Karn, A.K.; Giddalur, A.; Dhiman, A.; Sharma, S.; Yadav, A.K. Microaneurysm detection using color locus detection method. Measurement 2021, 176, 109084. [Google Scholar] [CrossRef]
- Shan, J.; Li, L. A deep learning method for microaneurysm detection in fundus images. In Proceedings of the 2016 IEEE First International Conference on Connected Health: Applications, Systems and Engineering Technologies (CHASE), Washington, DC, USA, 27–29 June 2016. [Google Scholar]
- Derwin, D.J.; Selvi, S.T.; Singh, O.J. Secondary observer system for detection of microaneurysms in fundus images using texture descriptors. J. Digit. Imaging 2020, 33, 159–167. [Google Scholar] [CrossRef]
- Derwin, D.J.; Selvi, S.T.; Singh, O.J.; Shan, B.P. A novel automated system of discriminating Microaneurysms in fundus images. Biomed. Signal Process. Control 2020, 58, 101839. [Google Scholar] [CrossRef]
- Srivastava, R.; Duan, L.; Wong, D.W.; Liu, J.; Wong, T.Y. Detecting retinal microaneurysms and hemorrhages with robustness to the presence of blood vessels. Comput. Methods Programs Biomed. 2017, 138, 83–91. [Google Scholar] [CrossRef]
- Du, J.; Zou, B.; Chen, C.; Xu, Z.; Liu, Q. Automatic microaneurysm detection in fundus image based on local cross-section transformation and multi-feature fusion. Comput. Methods Programs Biomed. 2020, 196, 105687. [Google Scholar] [CrossRef]
- Adal, K.M.; Sidibé, D.; Ali, S.; Chaum, E.; Karnowski, T.P.; Mériaudeau, F. Automated detection of microaneurysms using scale-adapted blob analysis and semi-supervised learning. Comput. Methods Programs Biomed. 2014, 114, 1–10. [Google Scholar] [CrossRef] [Green Version]
- Li, Y.-H.; Yeh, N.-N.; Chen, S.-J.; Chung, Y.-C. Computer-assisted diagnosis for diabetic retinopathy based on fundus images using deep convolutional neural network. Mob. Inf. Syst. 2019, 2019, 6142839. [Google Scholar] [CrossRef]
- Suriyal, S.; Druzgalski, C.; Gautam, K. Mobile assisted diabetic retinopathy detection using deep neural network. In Proceedings of the 2018 Global Medical Engineering Physics Exchanges/Pan American Health Care Exchanges (GMEPE/PAHCE), Porto, Portugal, 19–24 March 2018. [Google Scholar]
- Jadhav, M.; Shaikh, M.; Sardar, V. Automated Microaneurysms Detection in Fundus Images for Early Diagnosis of Diabetic Retinopathy. In Data Engineering and Intelligent Computing; Springer: Singapore, 2021; pp. 87–95. [Google Scholar]
- Wang, Z.; Chen, K.-J.; Zhang, L. A R-CNN Based Approach for Microaneurysm Detection in Retinal Fundus Images. In Proceedings of the International Conference on Health Information Science, Xian, China, 18–20 October 2019. [Google Scholar]
- Deepa, V.; Kumar, C.S.; Andrews, S.S. Automated detection of microaneurysms using Stockwell transform and statistical features. IET Image Process. 2019, 13, 1341–1348. [Google Scholar] [CrossRef]
- Joshi, S.; Karule, P. Mathematical morphology for microaneurysm detection in fundus images. Eur. J. Ophthalmol. 2020, 30, 1135–1142. [Google Scholar] [CrossRef]
- Melo, T.; Mendonça, A.M.; Campilho, A. Microaneurysm detection in color eye fundus images for diabetic retinopathy screening. Comput. Biol. Med. 2020, 126, 103995. [Google Scholar] [CrossRef]
- Liao, Y.; Xia, H.; Song, S.; Li, H. Microaneurysm detection in fundus images based on a novel end-to-end convolutional neural network. Biocybern. Biomed. Eng. 2021, 41, 589–604. [Google Scholar] [CrossRef]
- Rawat, W.; Wang, Z. Deep convolutional neural networks for image classification: A comprehensive review. Neural Comput. 2017, 29, 2352–2449. [Google Scholar] [CrossRef]
- Decencière, E.; Cazuguel, G.; Zhang, X.; Thibault, G.; Klein, J.-C.; Meyer, F.; Marcotegui, B.; Quellec, G.; Lamard, M.; Danno, R. TeleOphta: Machine learning and image processing methods for teleophthalmology. IRBM 2013, 34, 196–203. [Google Scholar] [CrossRef]
- Kauppi, T.; Kalesnykiene, V.; Kamarainen, J.-K.; Lensu, L.; Sorri, I.; Raninen, A.; Voutilainen, R.; Uusitalo, H.; Kälviäinen, H.; Pietilä, J. The diaretdb1 diabetic retinopathy database and evaluation protocol. In Proceedings of the British Machine Vision Conference, Warwick, UK, 10–13 September 2007. [Google Scholar]
- Antal, B.; Hajdu, A. An ensemble-based system for microaneurysm detection and diabetic retinopathy grading. IEEE Trans. Biomed. Eng. 2012, 59, 1720–1726. [Google Scholar] [CrossRef] [Green Version]
- Simonyan, K.; Zisserman, A. Very deep convolutional networks for large-scale image recognition. arXiv 2014, arXiv:1409.1556. [Google Scholar]
- Szegedy, C.; Liu, W.; Jia, Y.; Sermanet, P.; Reed, S.; Anguelov, D.; Erhan, D.; Vanhoucke, V.; Rabinovich, A. Going deeper with convolutions. In Proceedings of the IEEE Conference on Computer Vision and Pattern Recognition, Boston, MA, USA, 7–12 June 2015. [Google Scholar]
- Nielsen, M.A. Neural Networks and Deep Learning; Determination Press: San Francisco, CA, USA, 2015; Volume 25. [Google Scholar]
- Harangi, B.; Toth, J.; Hajdu, A. Fusion of Deep Convolutional Neural Networks for Microaneurysm Detection in Color Fundus Images. In Proceedings of the 2018 40th Annual International Conference of the IEEE Engineering in Medicine and Biology Society (EMBC), Honolulu, HI, USA, 18–21 July 2018. [Google Scholar]
- Eftekhari, N.; Pourreza, H.-R.; Masoudi, M.; Ghiasi-Shirazi, K.; Saeedi, E. Microaneurysm detection in fundus images using a two-step convolutional neural network. Biomed. Eng. Online 2019, 18, 67. [Google Scholar] [CrossRef] [Green Version]
- Xia, H.; Lan, Y.; Song, S.; Li, H. A multi-scale segmentation-to-classification network for tiny microaneurysm detection in fundus images. Knowl.-Based Syst. 2021, 226, 107140. [Google Scholar] [CrossRef]


| Microaneurysms Sign Patches | Non-Microaneurysms Sign Patches | |
|---|---|---|
| Training Phase | 10,433 | 28,367 |
| Validation Phase | 2496 | 9973 |
| Testing Phase | 2354 | 7020 |
| Total number of patches | 15,283 | 45,360 |
| Evaluation Metrics | Definition | Formula |
|---|---|---|
| Accuracy | The accuracy of a test is described as the ability to differentiate the patient and healthy cases correctly. To estimate the accuracy of a test, we should calculate the proportion of true positives and true negatives in all evaluated cases. | |
| Positive predictive values (PPV) | Probability of having the target condition given a positive test result | |
| Sensitivity | The sensitivity of a test shows the ability to determine the patient cases correctly. To estimate it, we should calculate the proportion of true positive in patient cases. | |
| Specificity | The specificity of a test represents the ability to determine the healthy cases correctly. To estimate it, we should calculate the proportion of true negative in healthy cases. |
| Methods | Datasets | Sensitivity | Specificity | Accuracy |
|---|---|---|---|---|
| Harangi et al. [40] | E-Ophtha-MA | 0.64 | 0.88 | 0.69 |
| Eftekhari et al. [41] | E-Ophtha-MA | 0.77 | - | - |
| T. Melo et al. [31] | E-Ophtha-MA | 0.64 | - | 0.83 |
| S. Joshi and P. Karule. [30] | E-Ophtha-MA | 0.83 | 0.82 | - |
| DIARETDB1 | 0.89 | 0.91 | 0.92 | |
| Haiying Xia et al. [42] | E-Ophtha-MA | 0.71 | - | - |
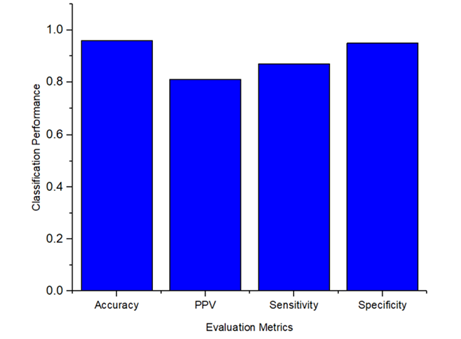
| Proposed Methodology | E-Ophtha-MA | 0.87 | 0.95 | 0.96 |
| DIARETDB1 | 0.92 | 0.94 | 0.94 |
Publisher’s Note: MDPI stays neutral with regard to jurisdictional claims in published maps and institutional affiliations. |
© 2022 by the authors. Licensee MDPI, Basel, Switzerland. This article is an open access article distributed under the terms and conditions of the Creative Commons Attribution (CC BY) license (https://creativecommons.org/licenses/by/4.0/).
Share and Cite
Mateen, M.; Malik, T.S.; Hayat, S.; Hameed, M.; Sun, S.; Wen, J. Deep Learning Approach for Automatic Microaneurysms Detection. Sensors 2022, 22, 542. https://doi.org/10.3390/s22020542
Mateen M, Malik TS, Hayat S, Hameed M, Sun S, Wen J. Deep Learning Approach for Automatic Microaneurysms Detection. Sensors. 2022; 22(2):542. https://doi.org/10.3390/s22020542
Chicago/Turabian StyleMateen, Muhammad, Tauqeer Safdar Malik, Shaukat Hayat, Musab Hameed, Song Sun, and Junhao Wen. 2022. "Deep Learning Approach for Automatic Microaneurysms Detection" Sensors 22, no. 2: 542. https://doi.org/10.3390/s22020542
APA StyleMateen, M., Malik, T. S., Hayat, S., Hameed, M., Sun, S., & Wen, J. (2022). Deep Learning Approach for Automatic Microaneurysms Detection. Sensors, 22(2), 542. https://doi.org/10.3390/s22020542