
Super-Resolution Procedure for Target Responses in KOMPSAT-5 Images


Abstract
:1. Introduction
2. Generation of Super-Resolved Target Image from Large-Scale KOMPSAT-5 Image
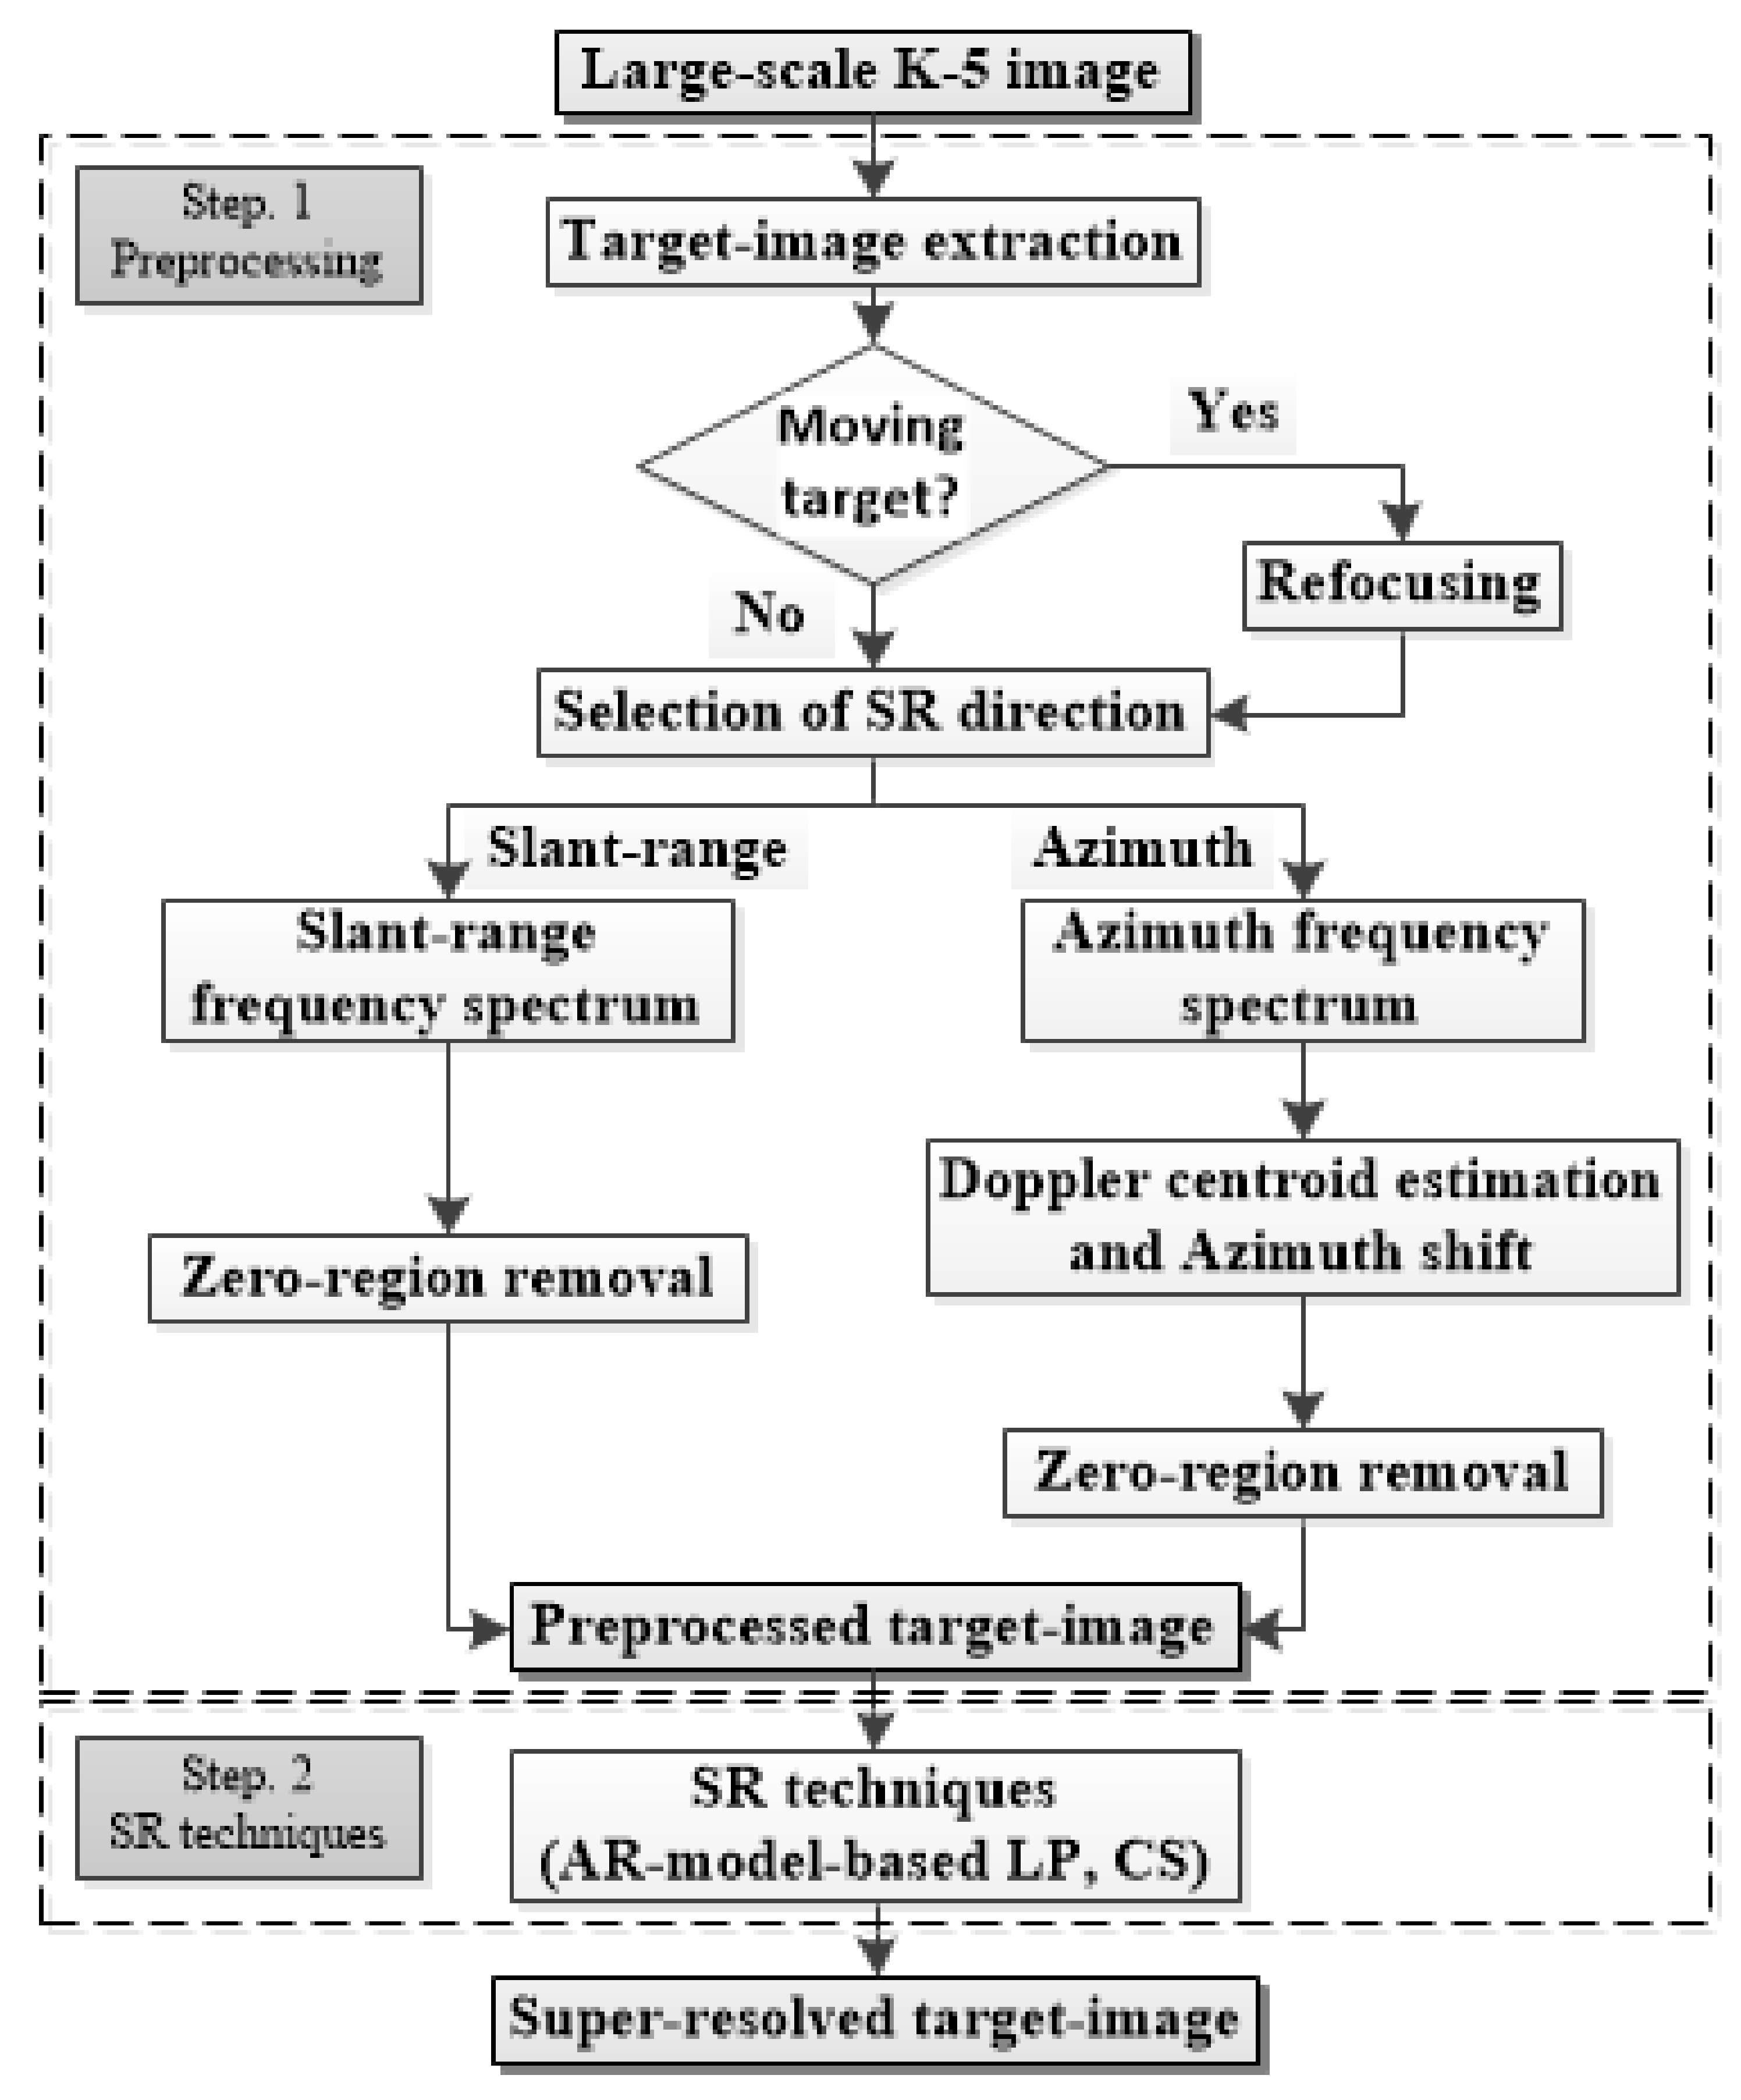
2.1. Overall Flow of the Proposed Scheme
2.2. SAR Signal Model of Target Image for the Proposed Scheme
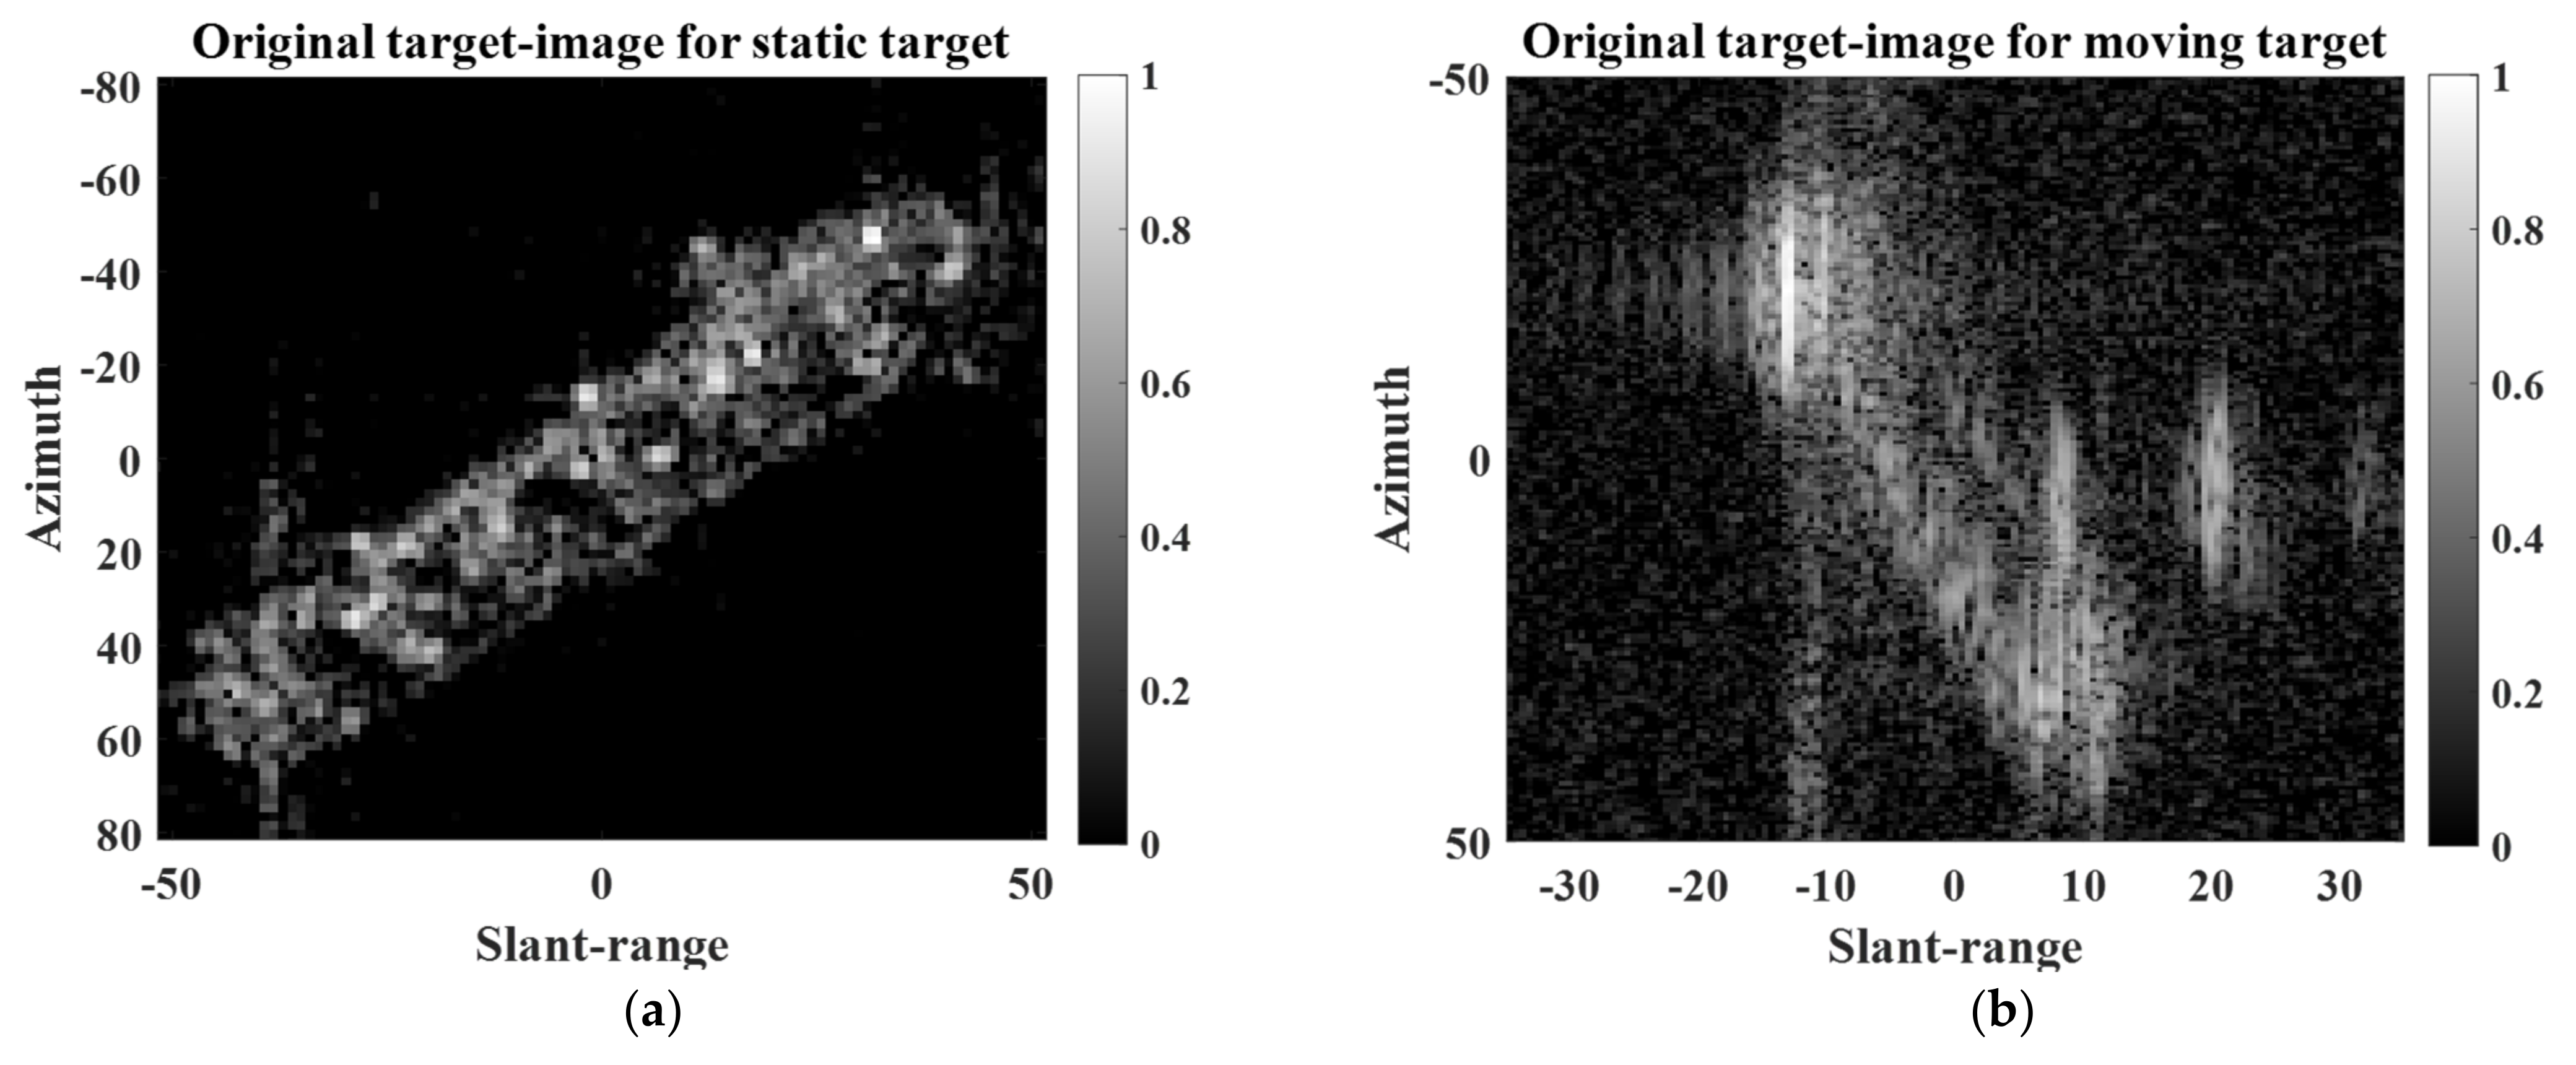
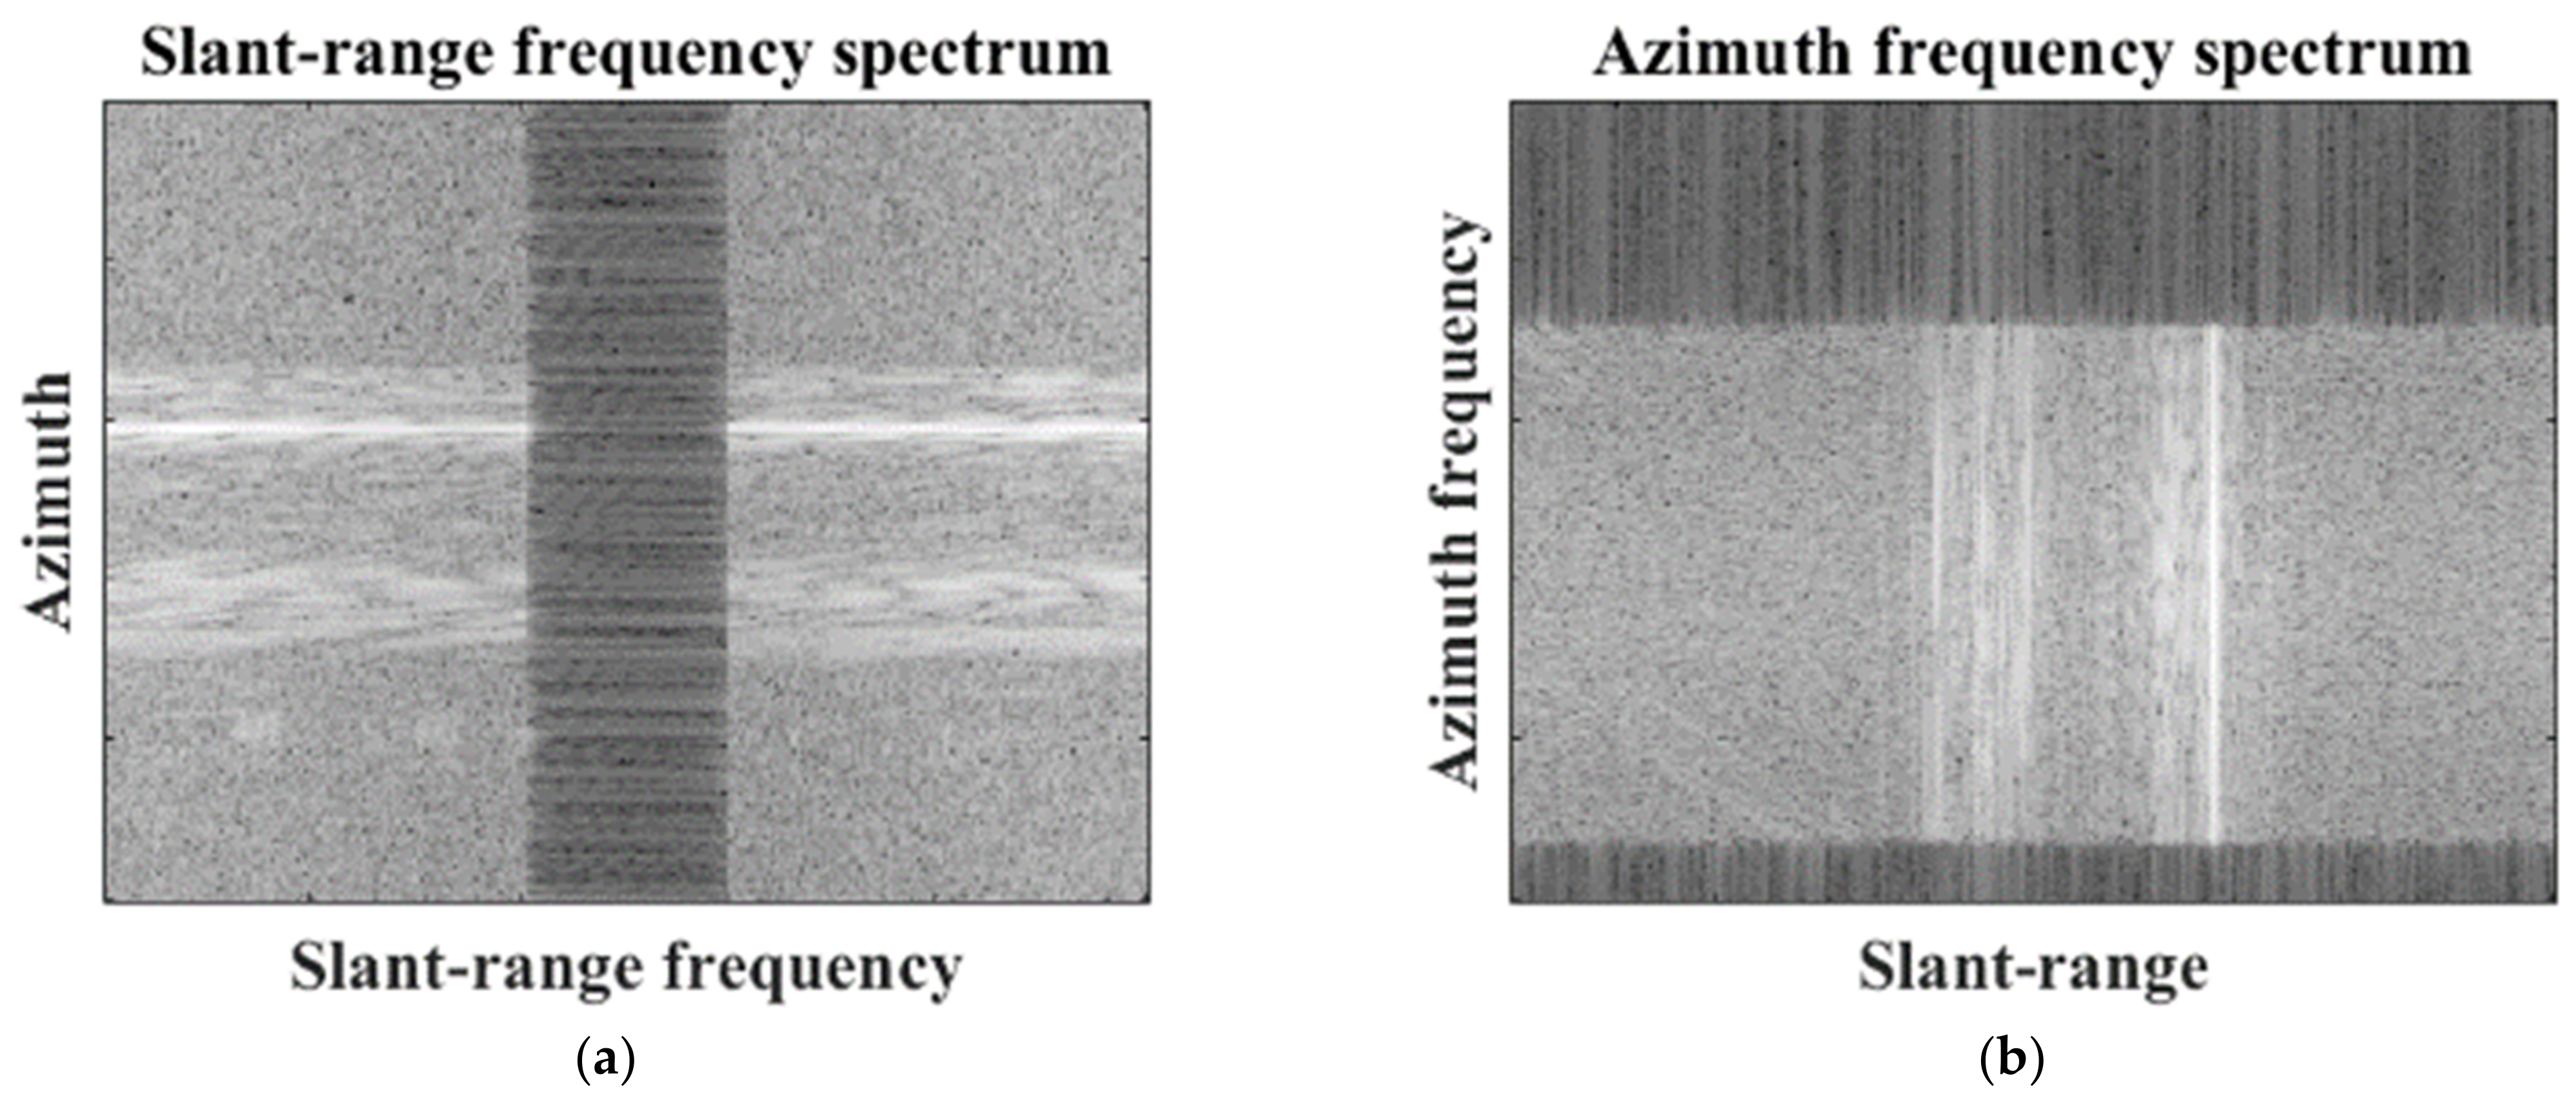
2.3. Preprocessing
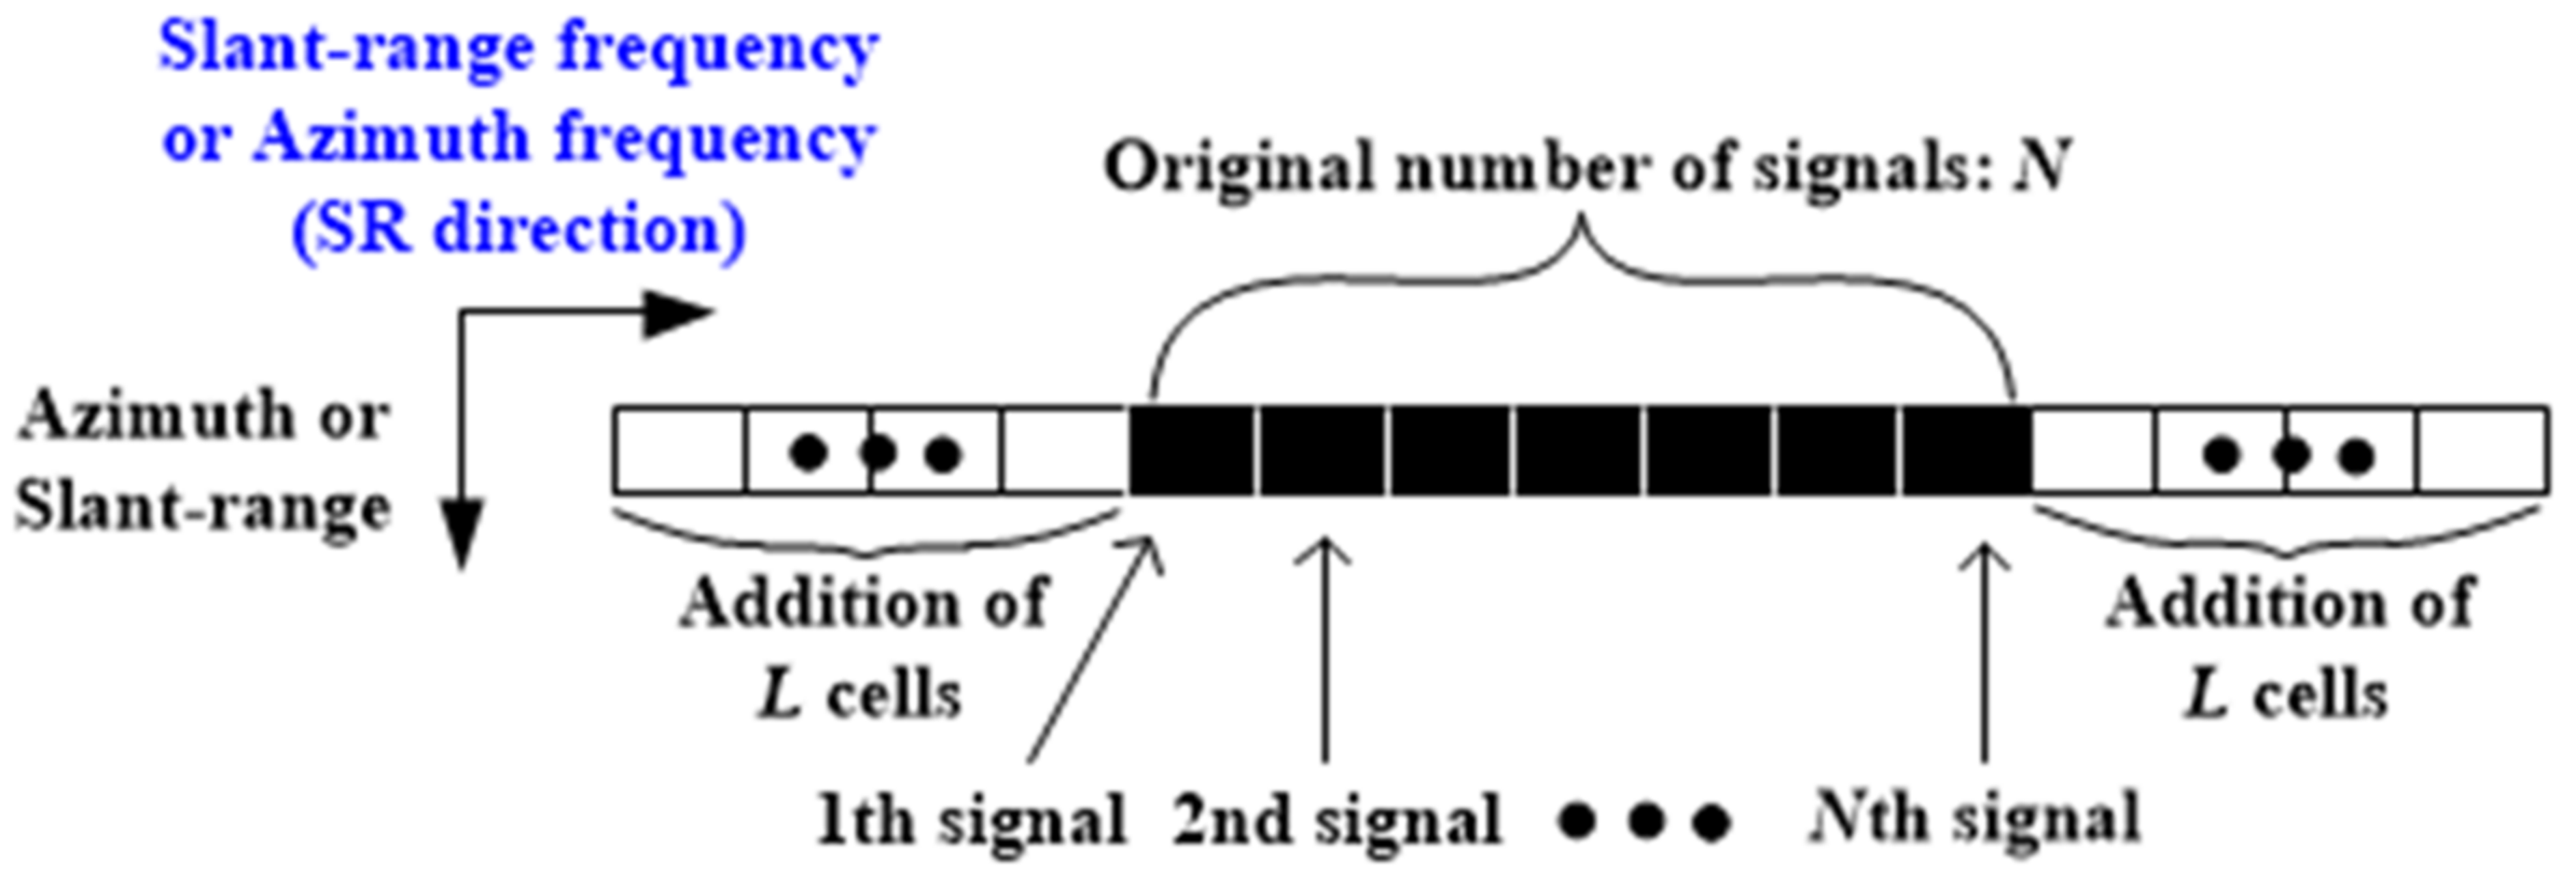
2.4. SR Technique Using AR-Model-Based LP Algorithm
2.5. SR Technique Using CS Algorithm
3. Experimental Results
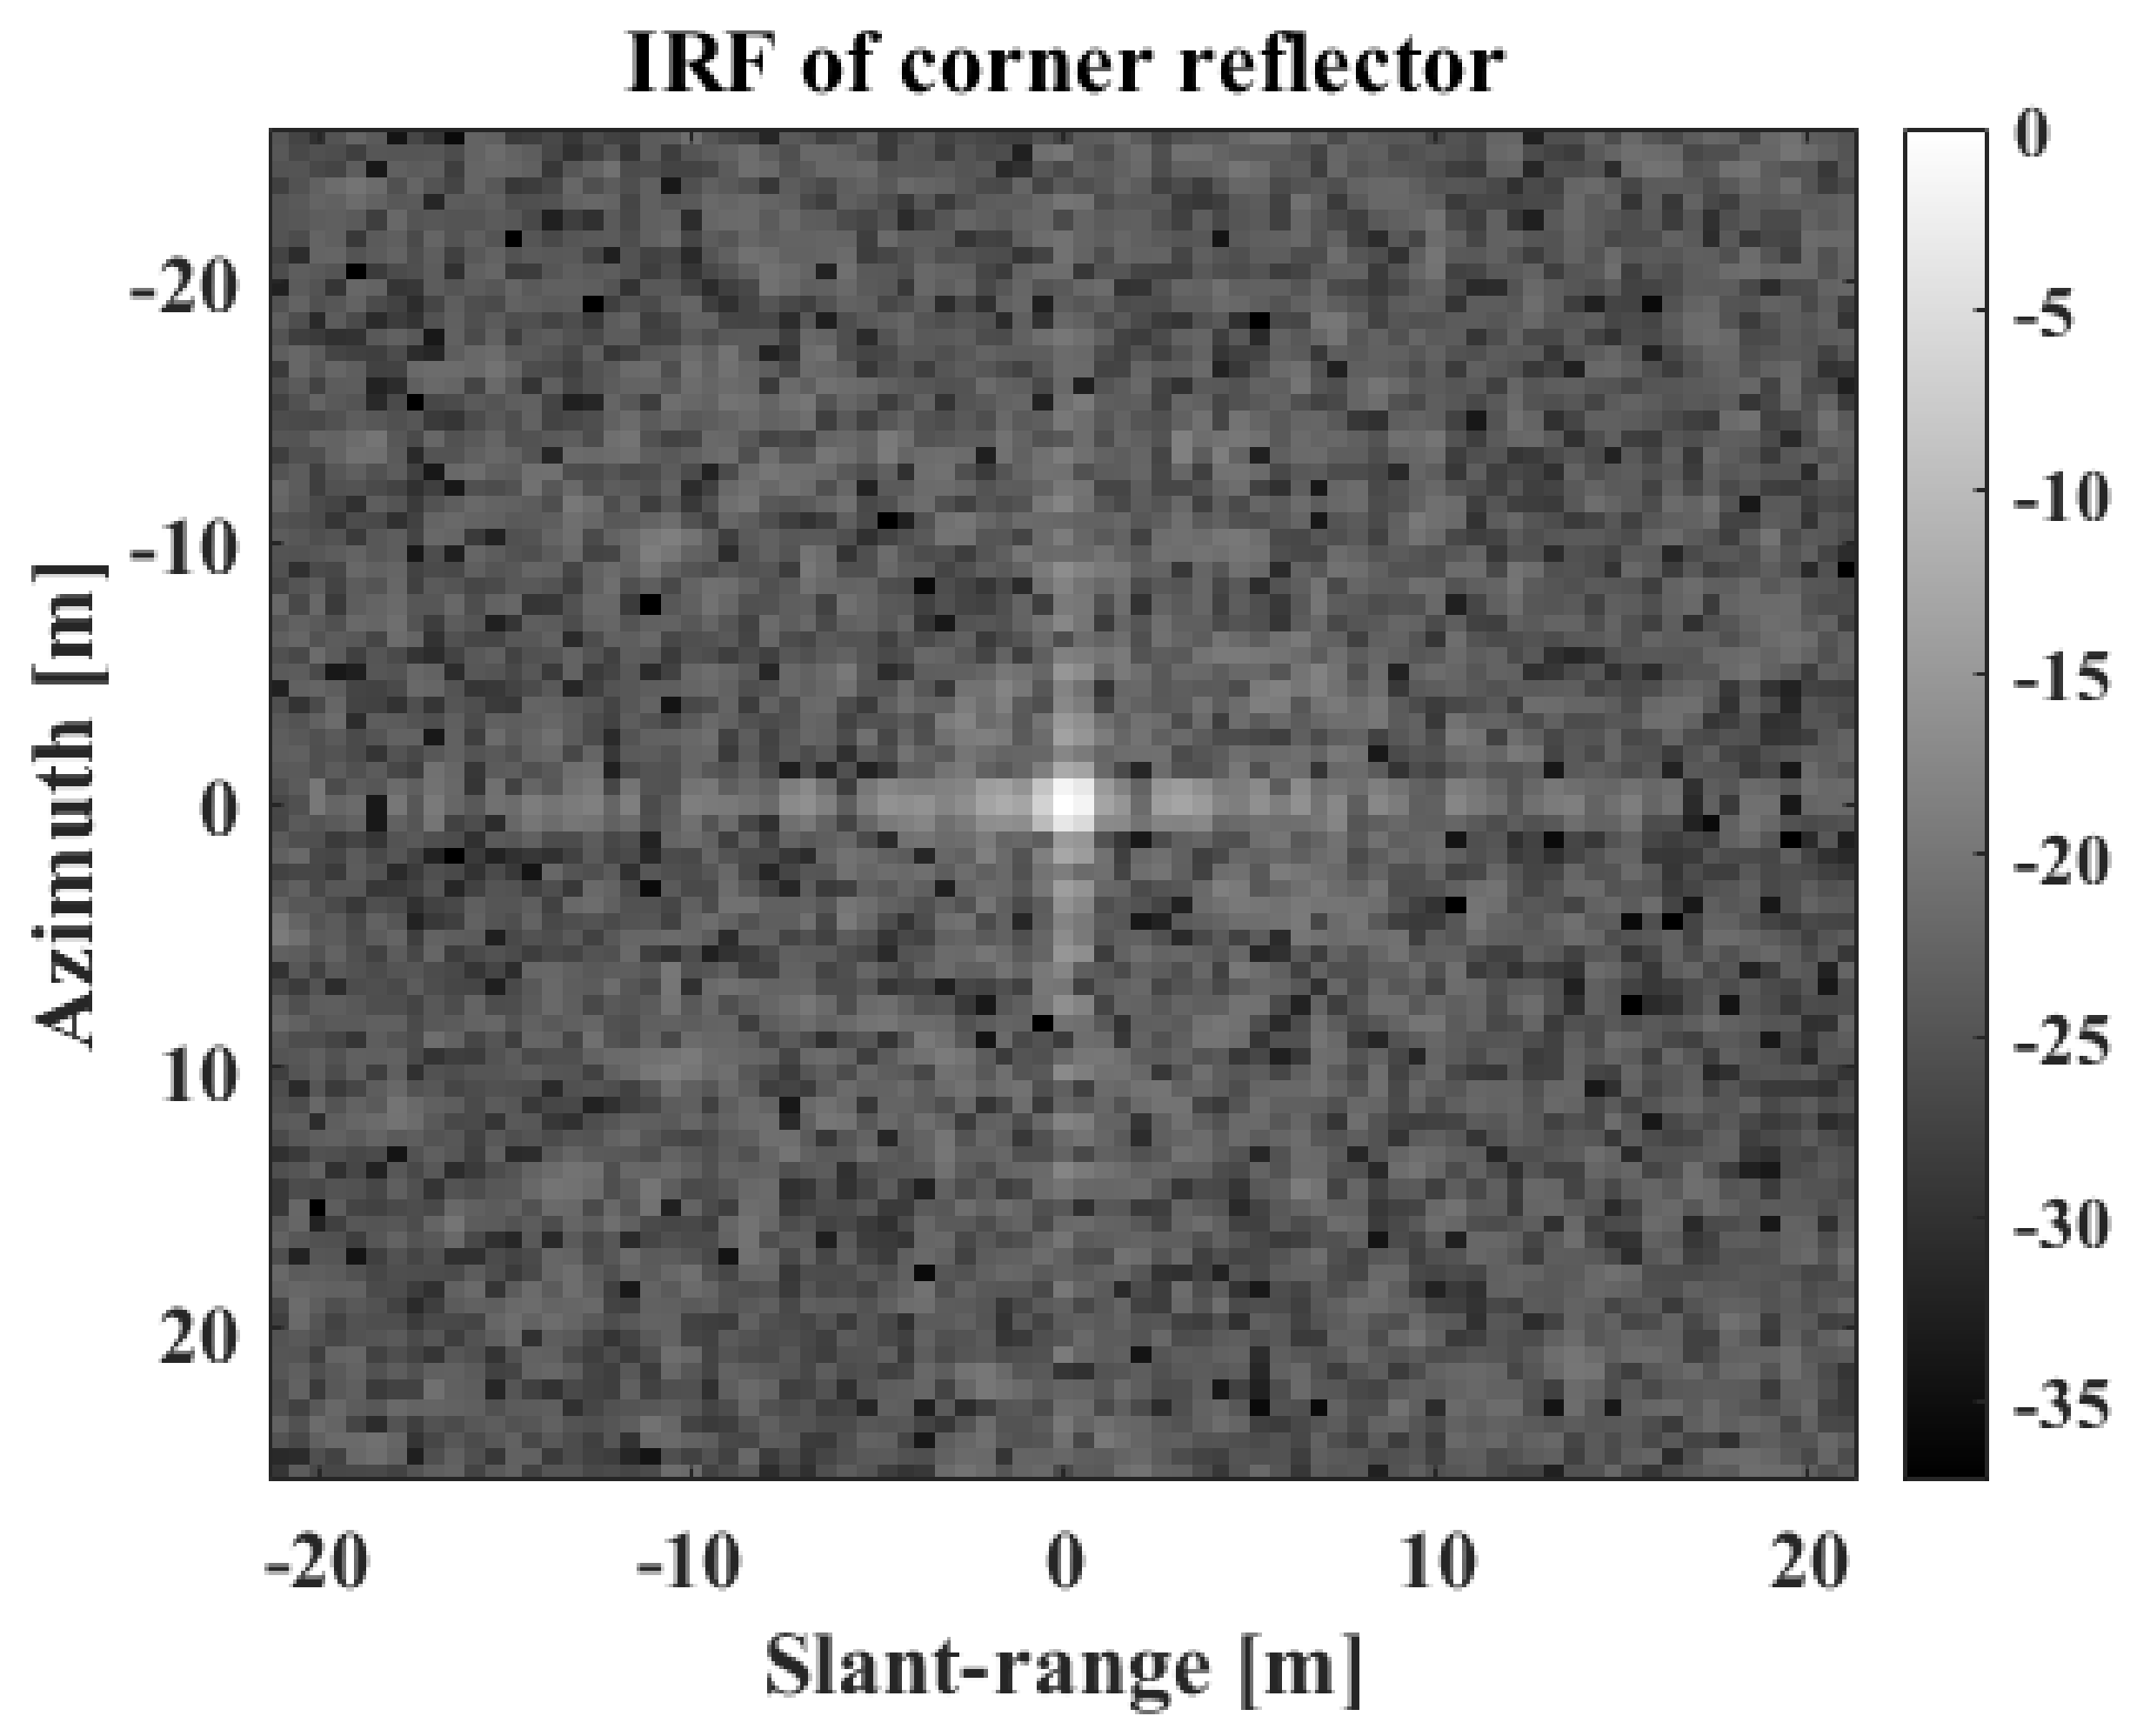
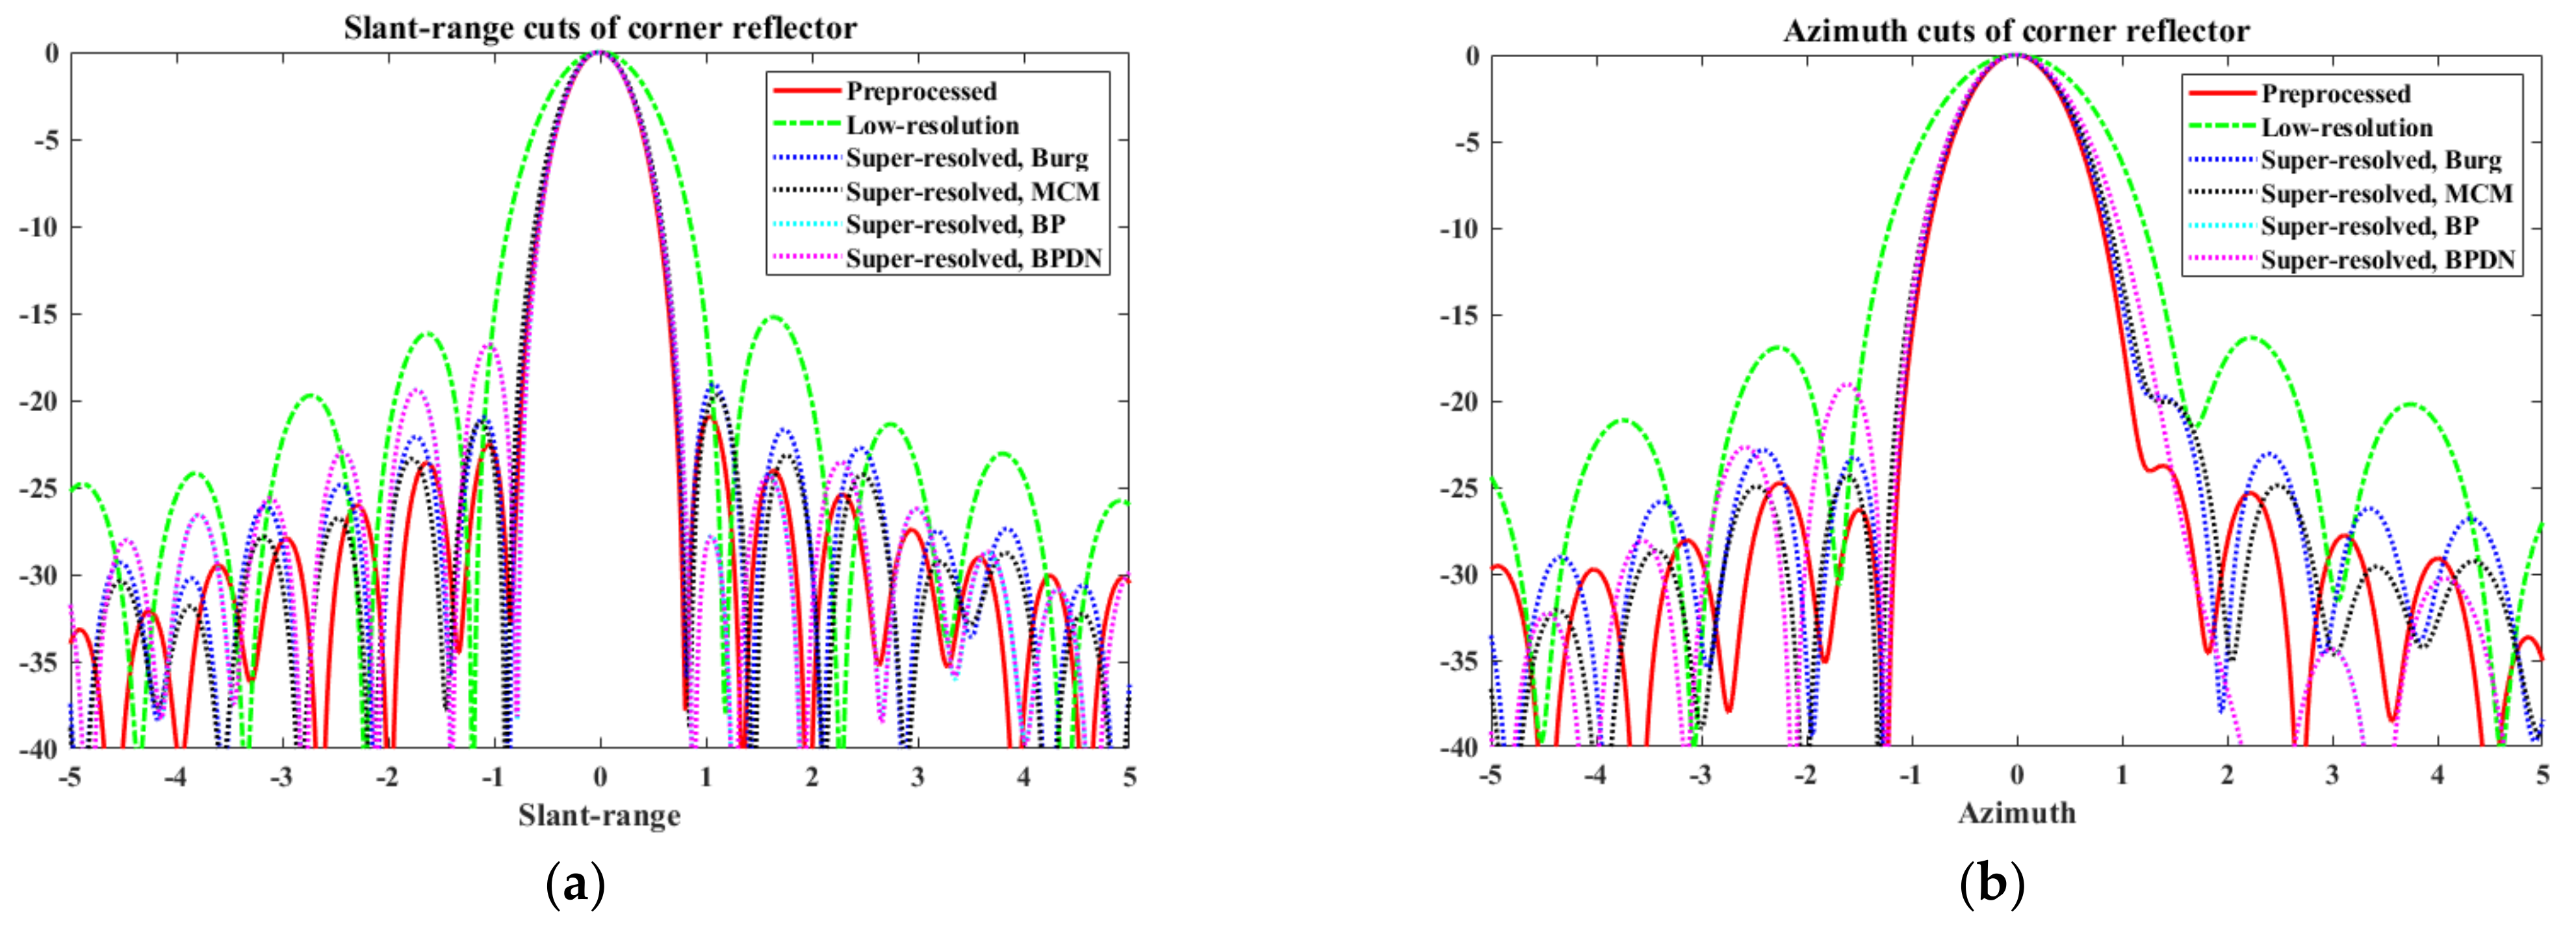
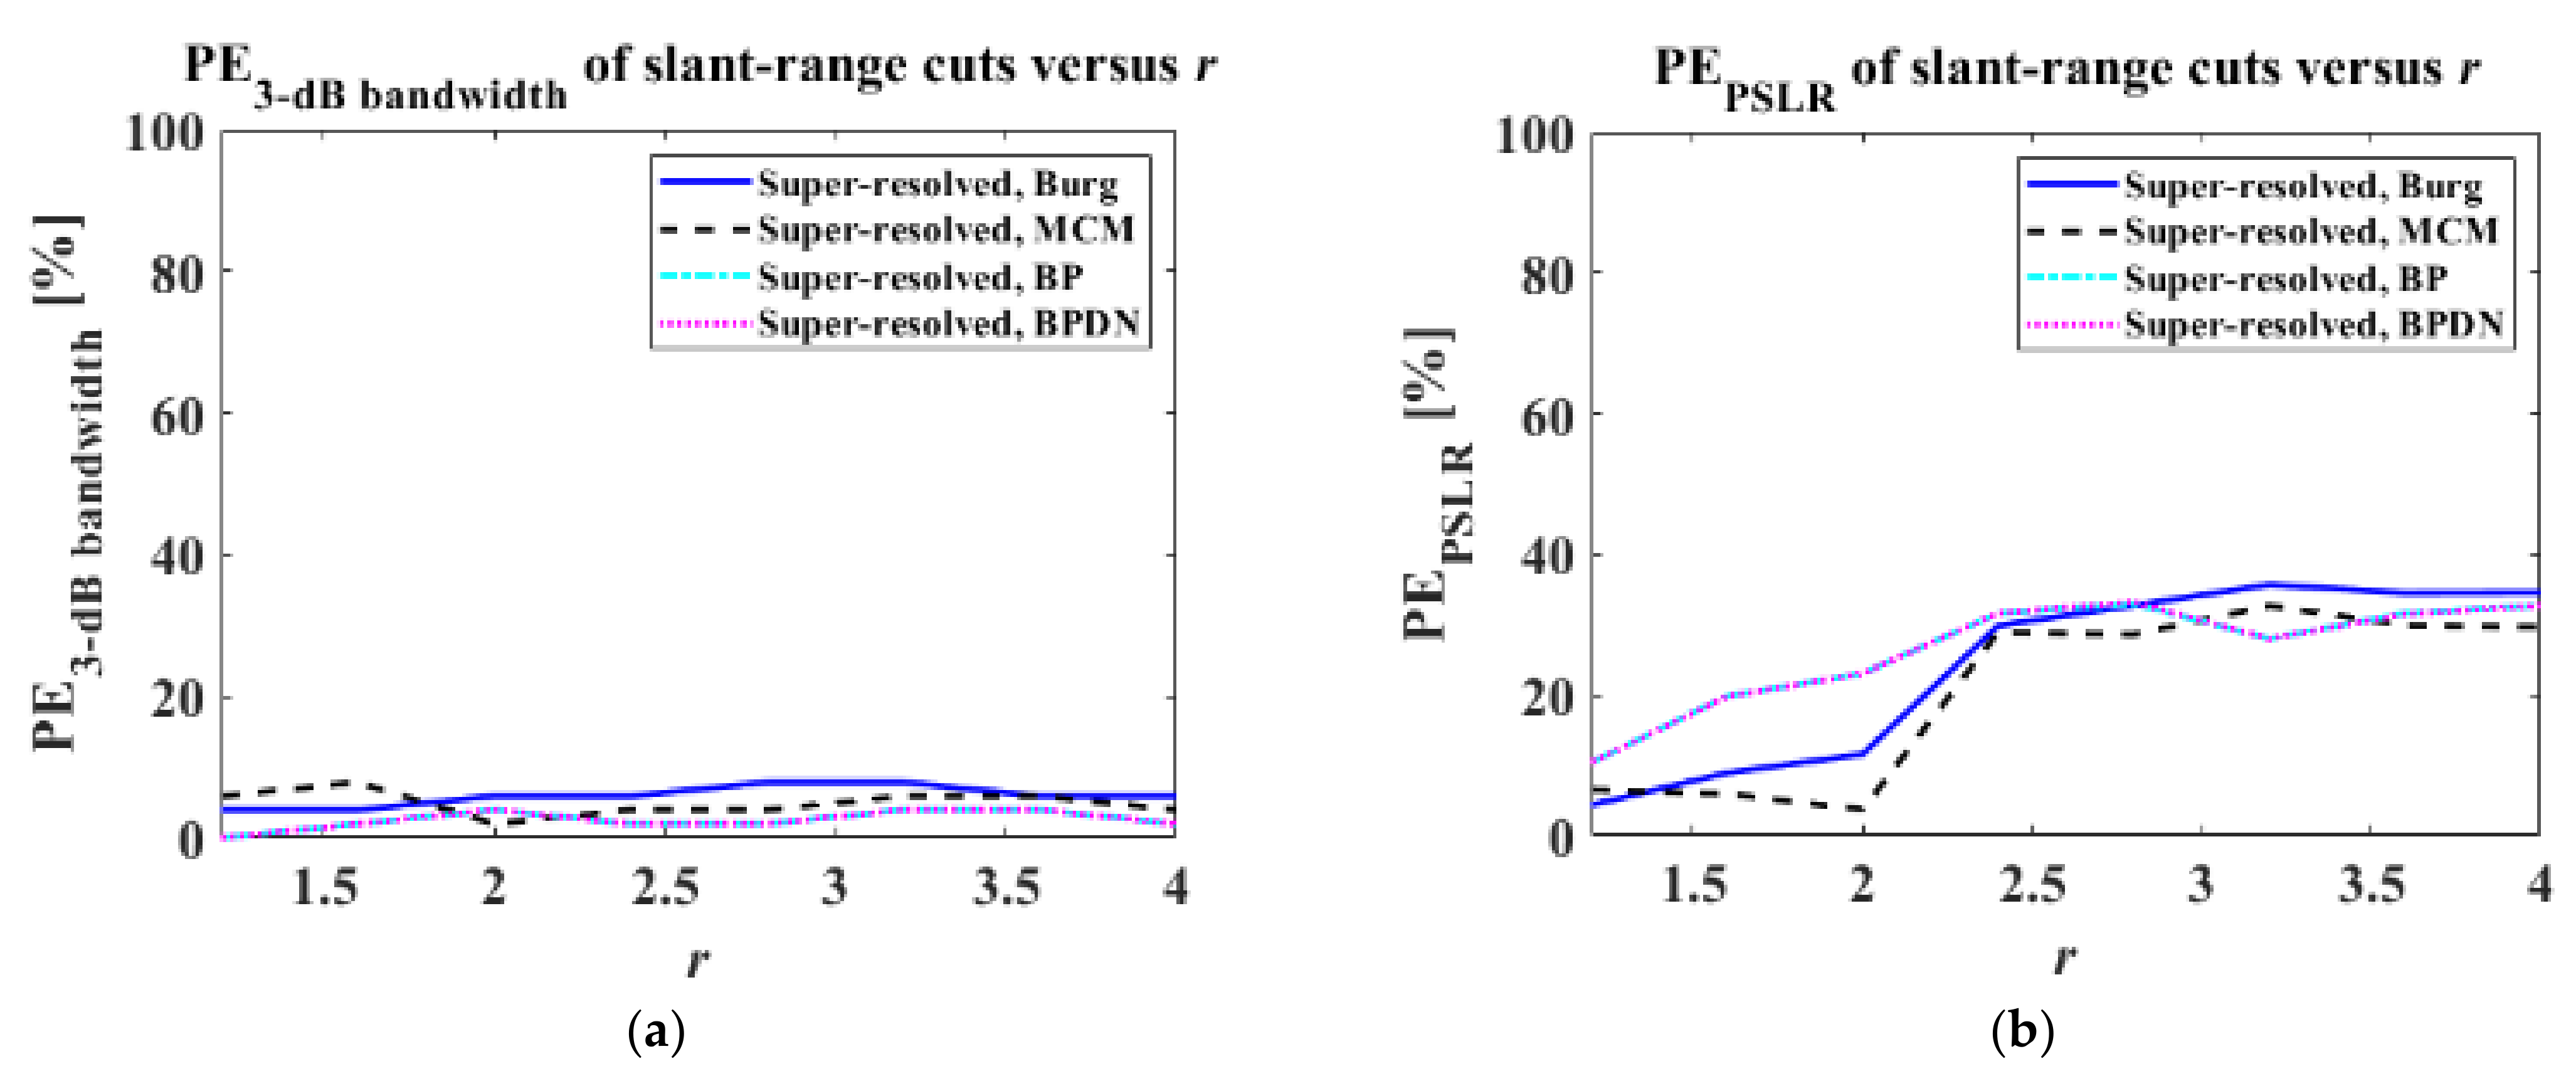
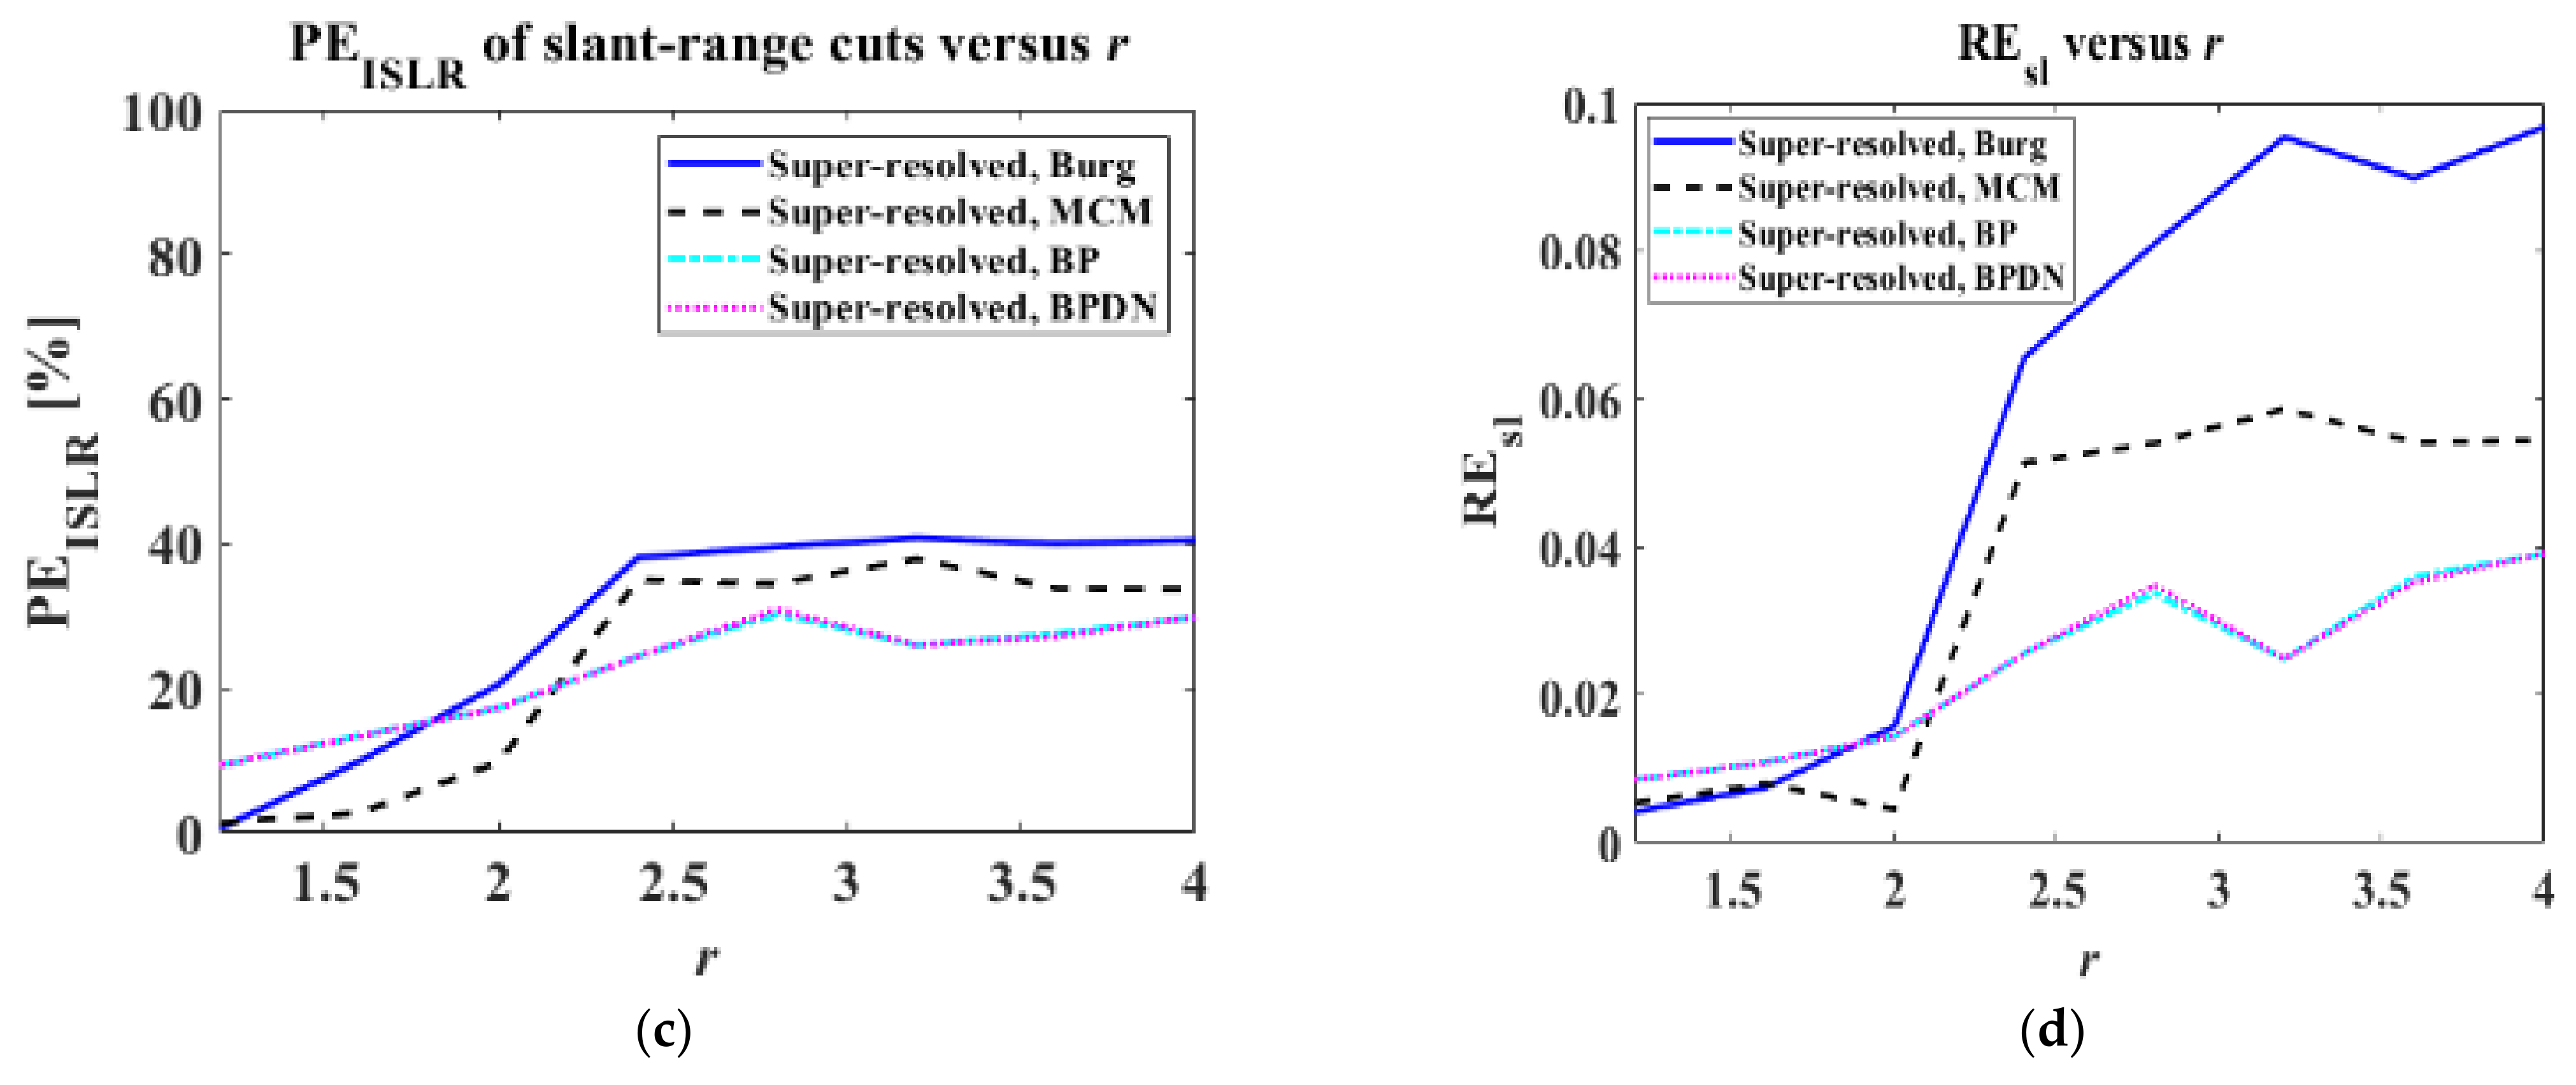
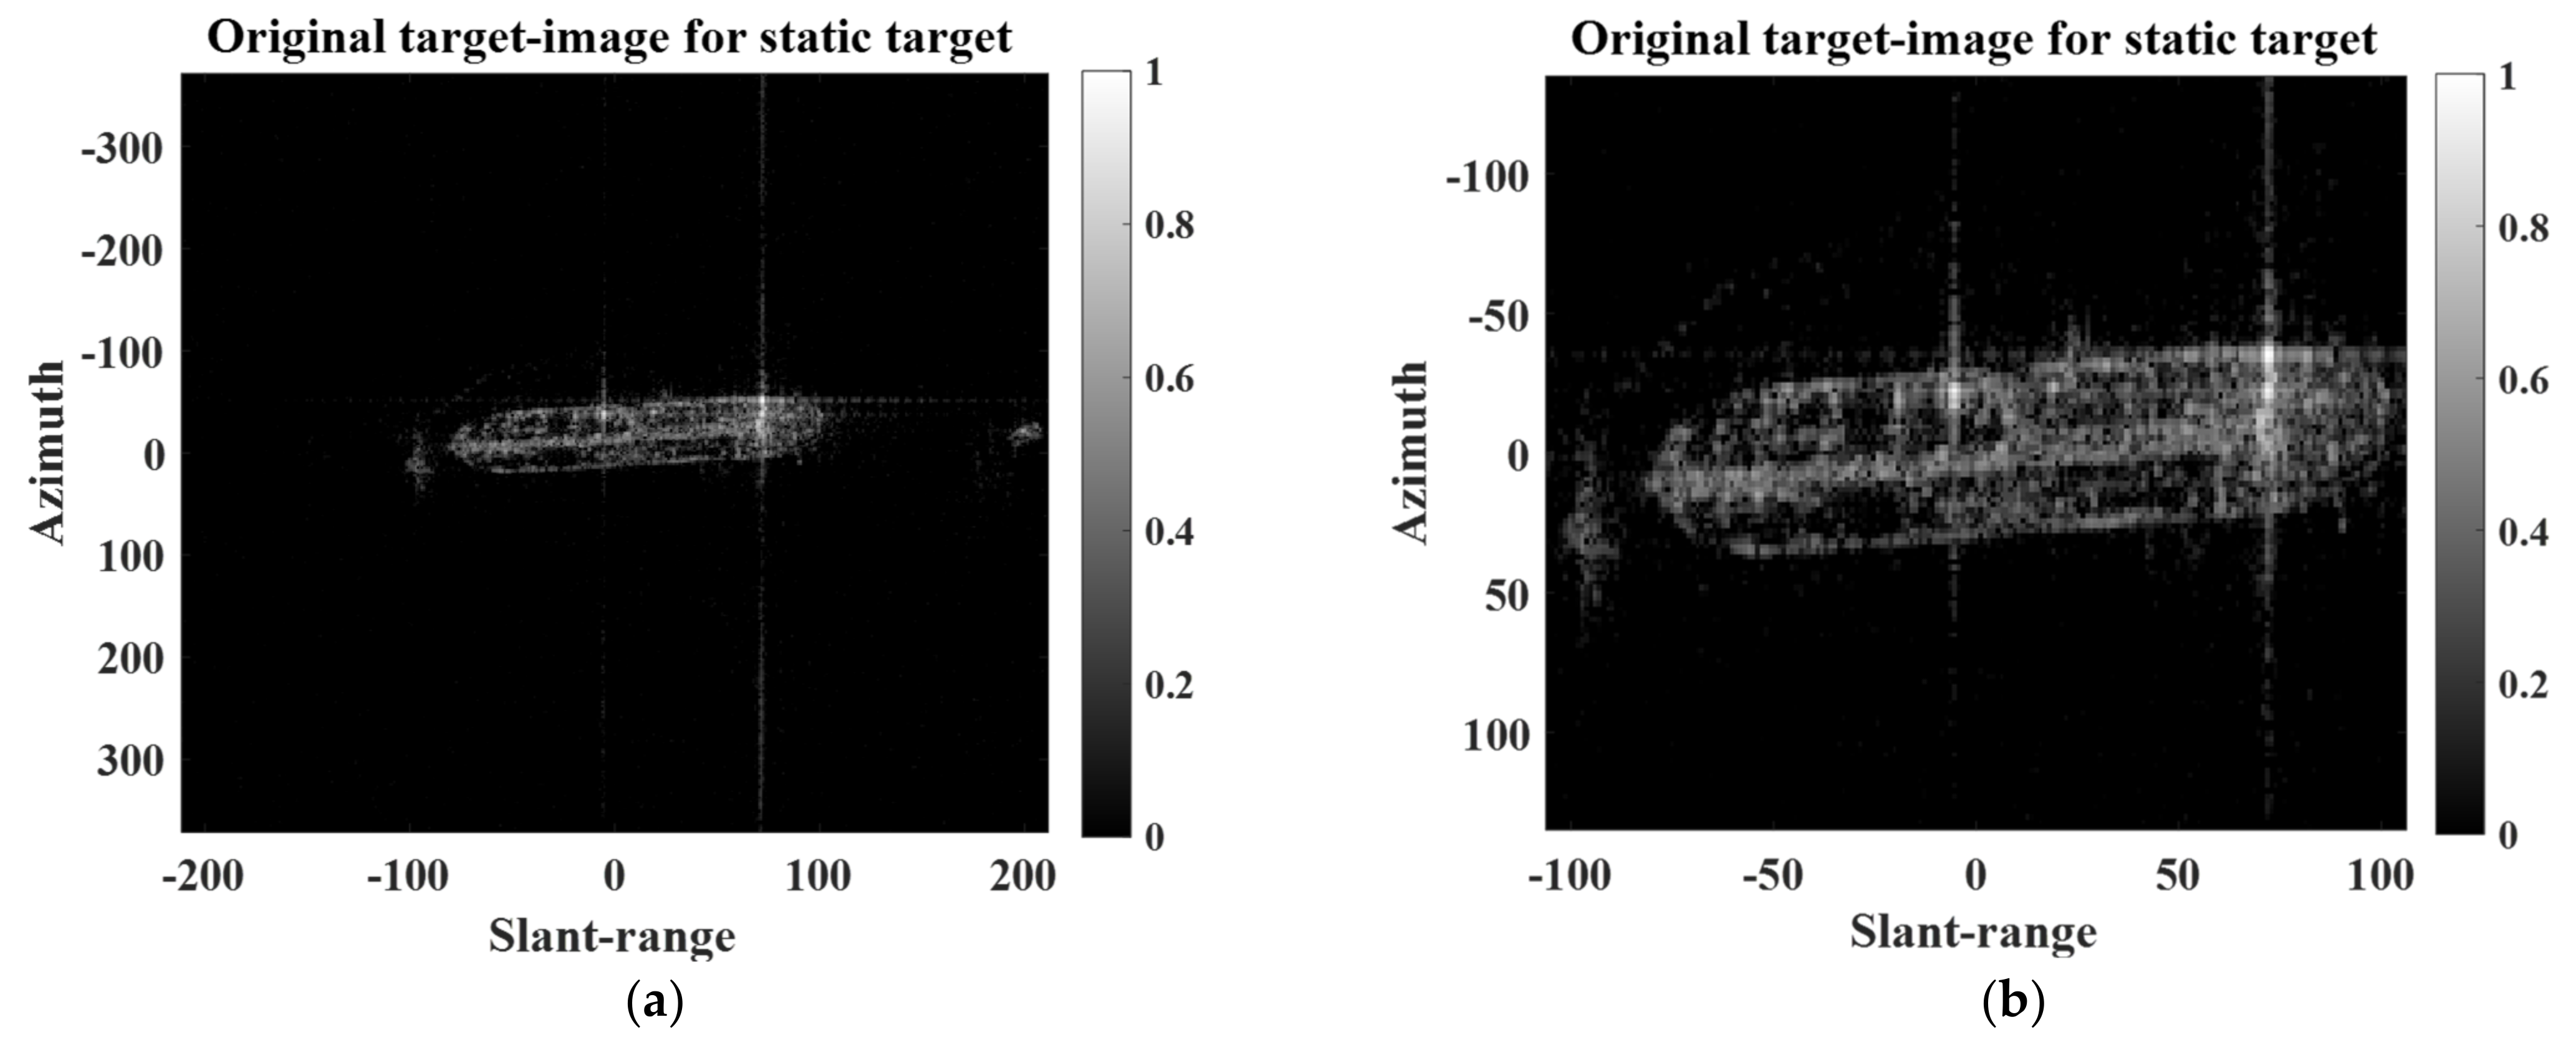
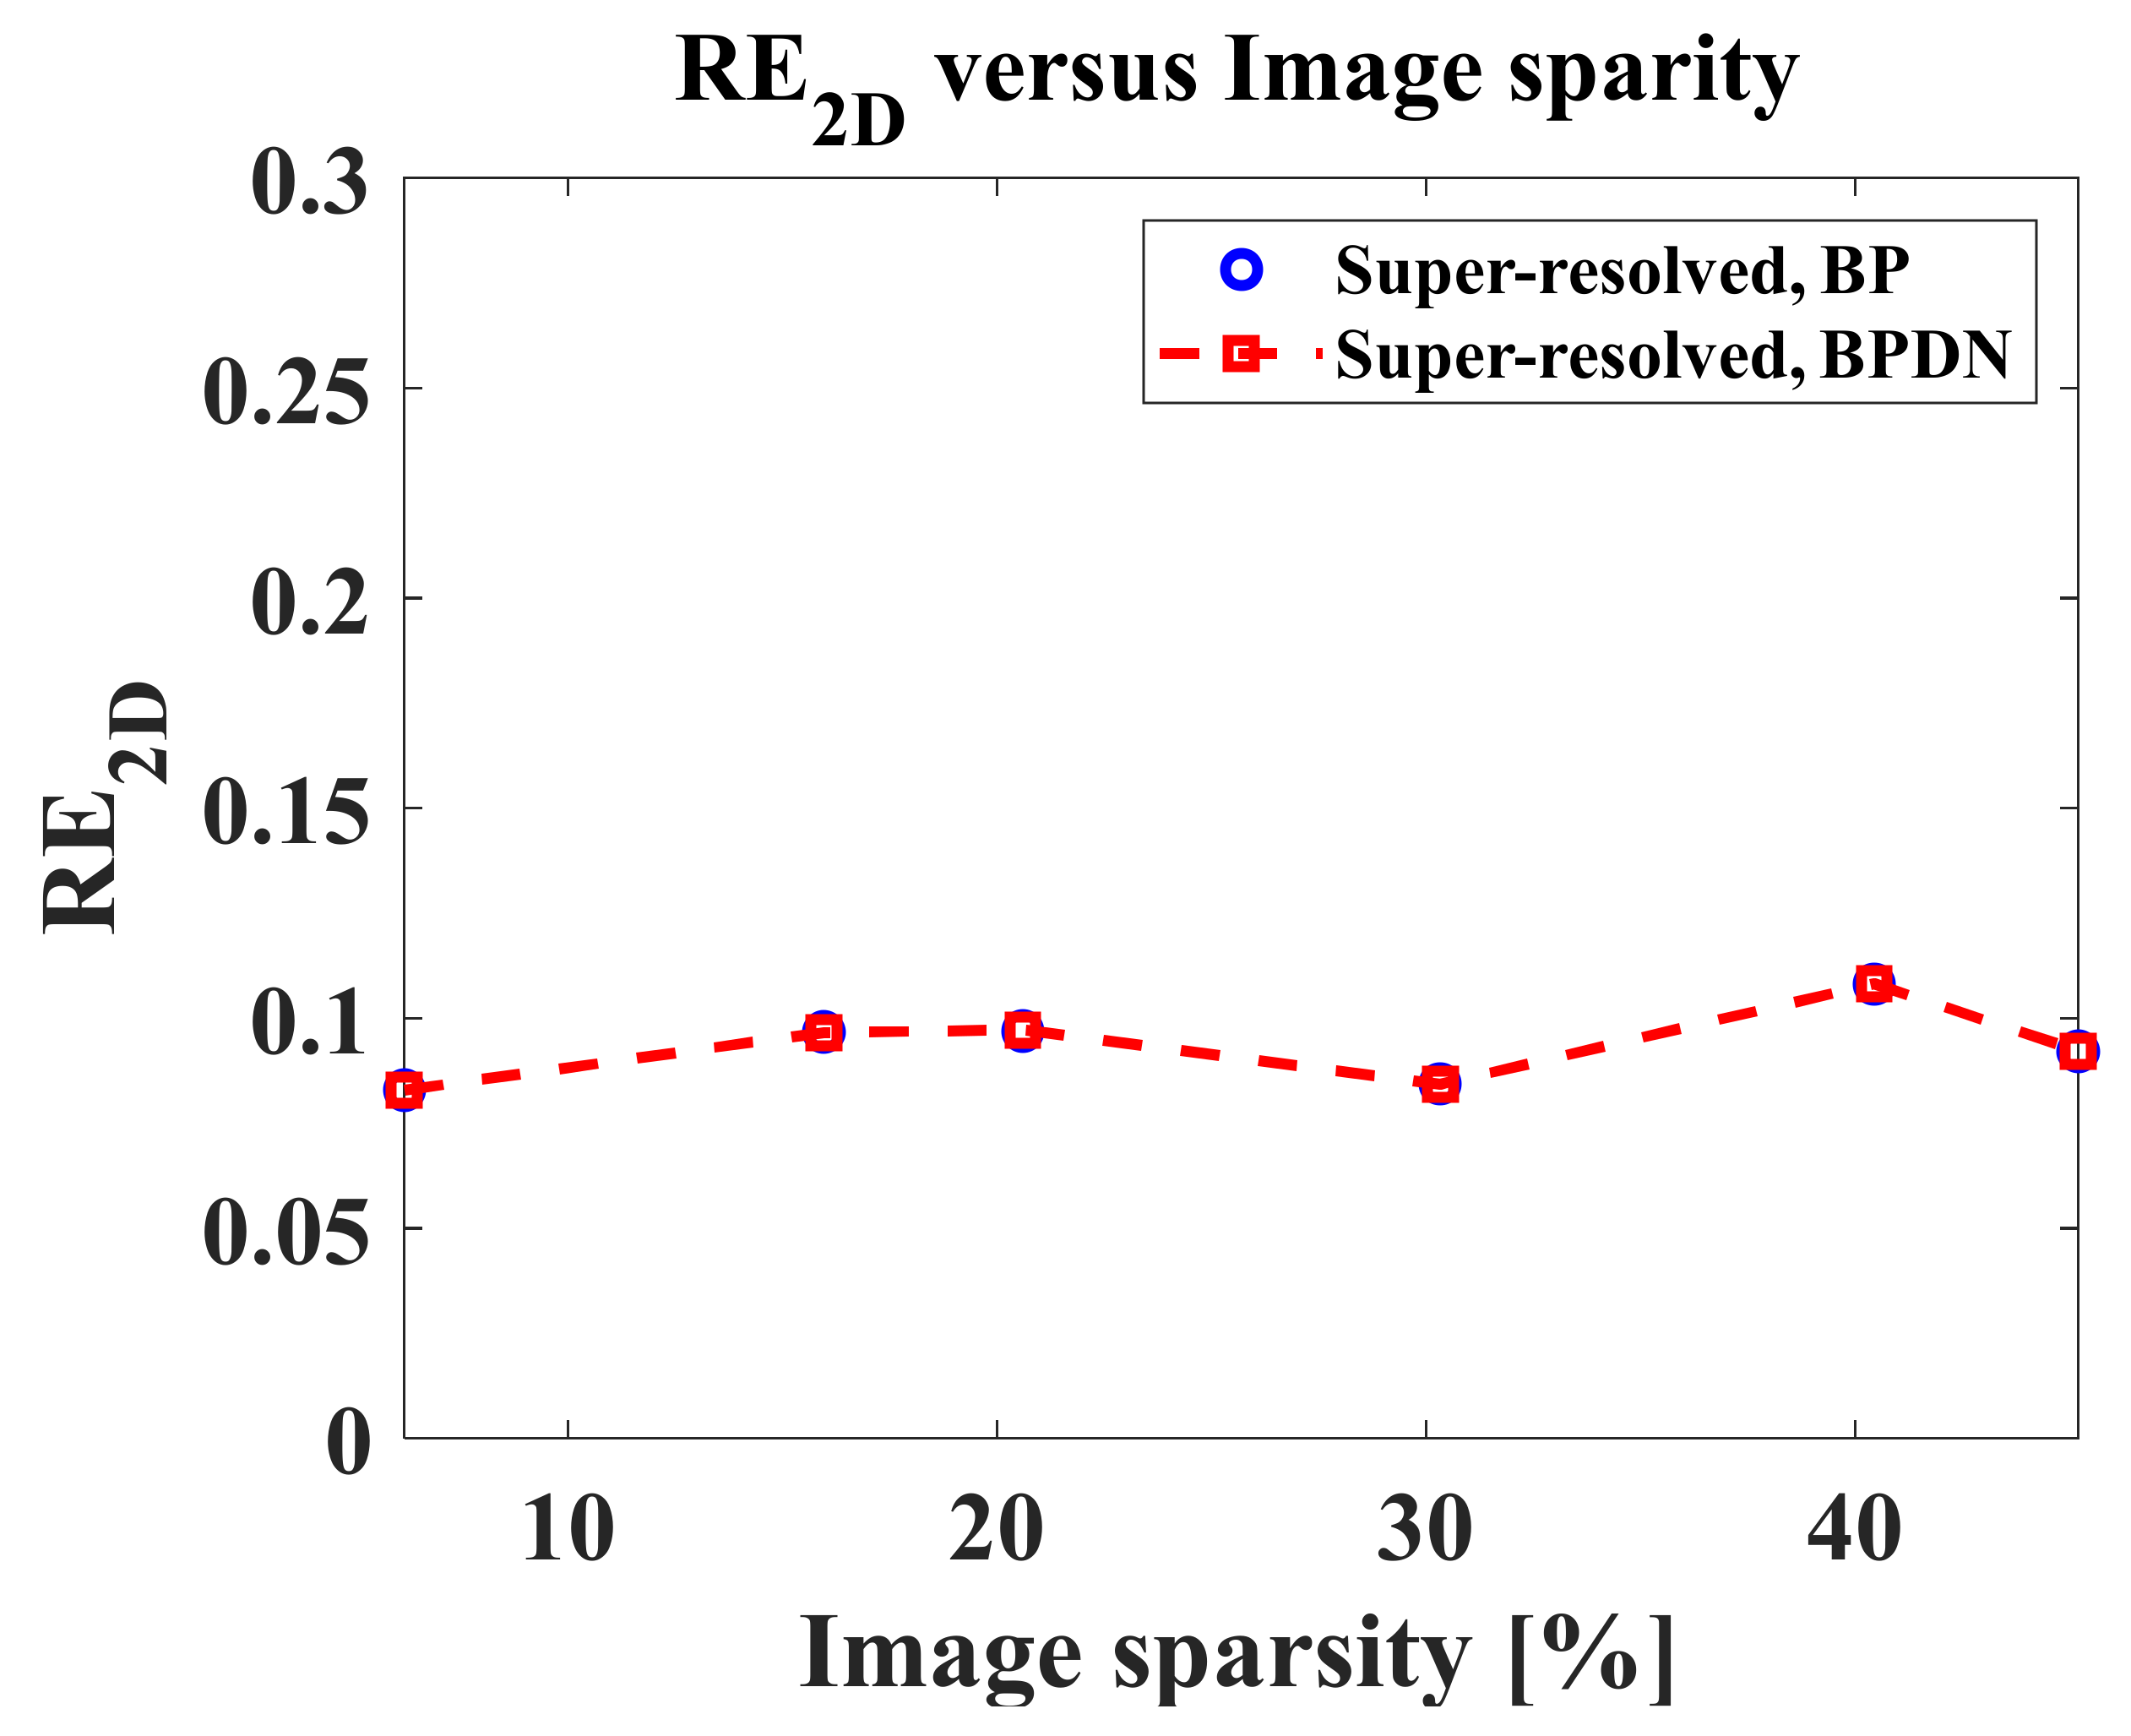
3.1. SR Results for Point Static Target
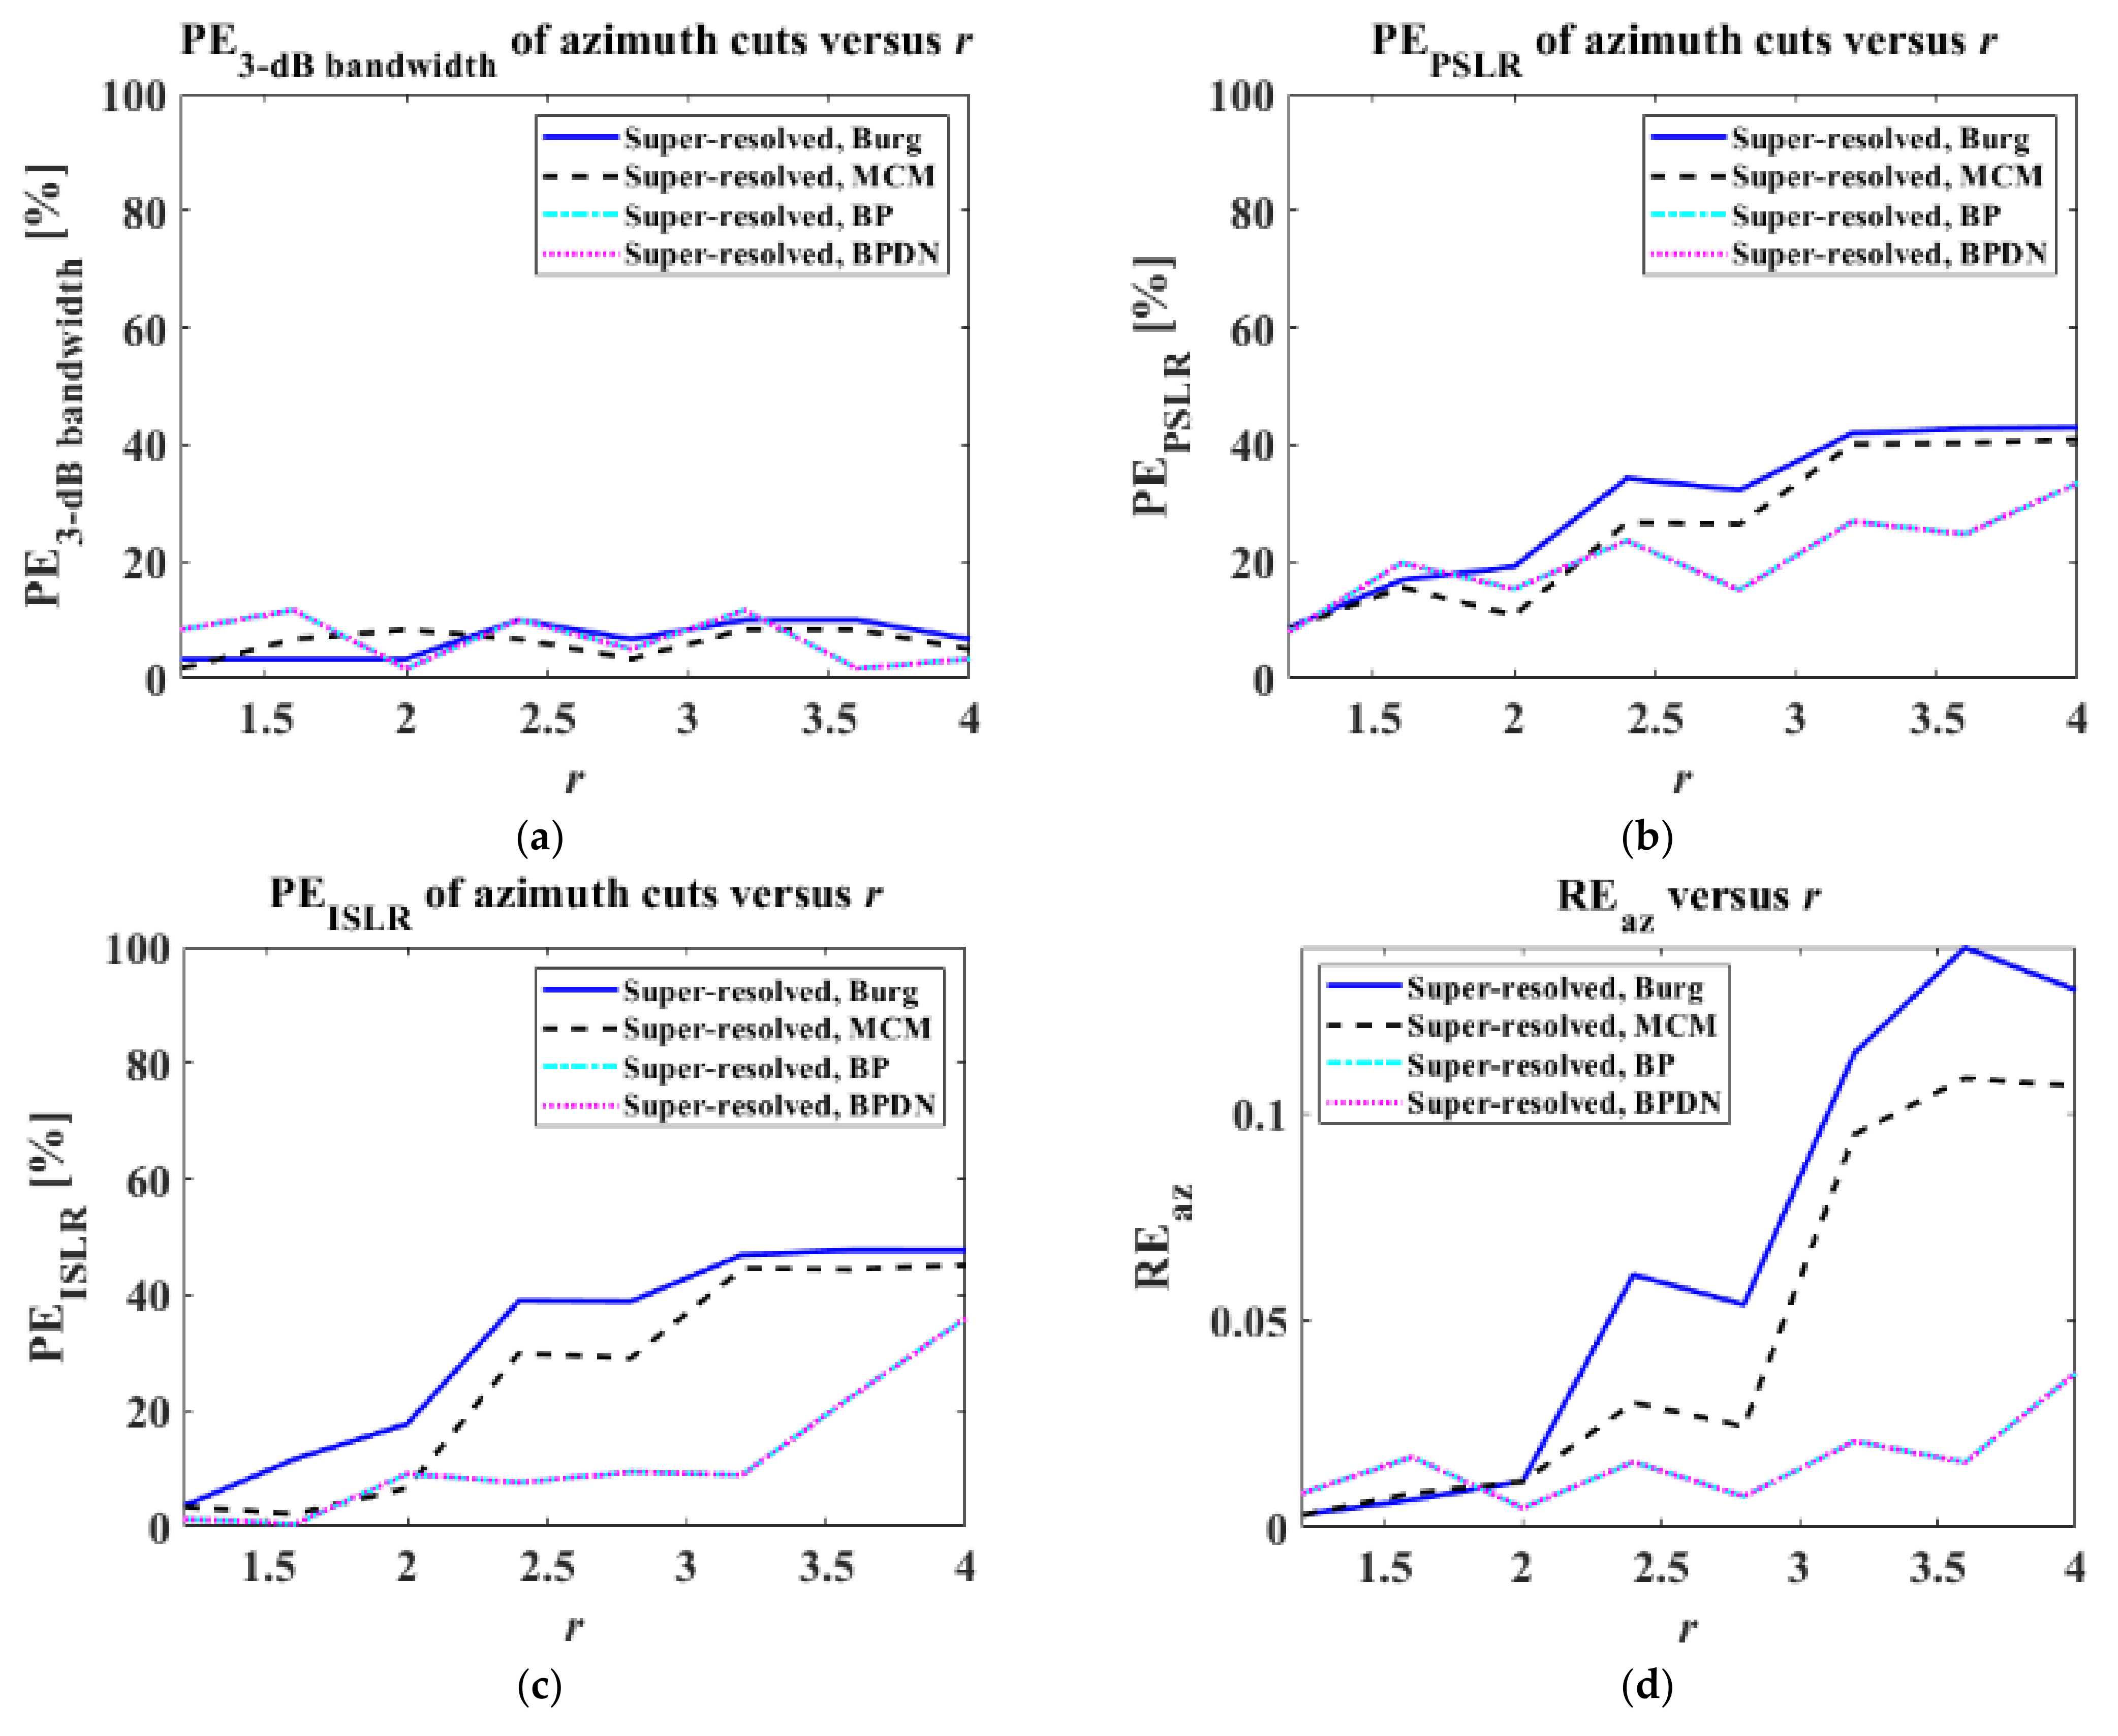
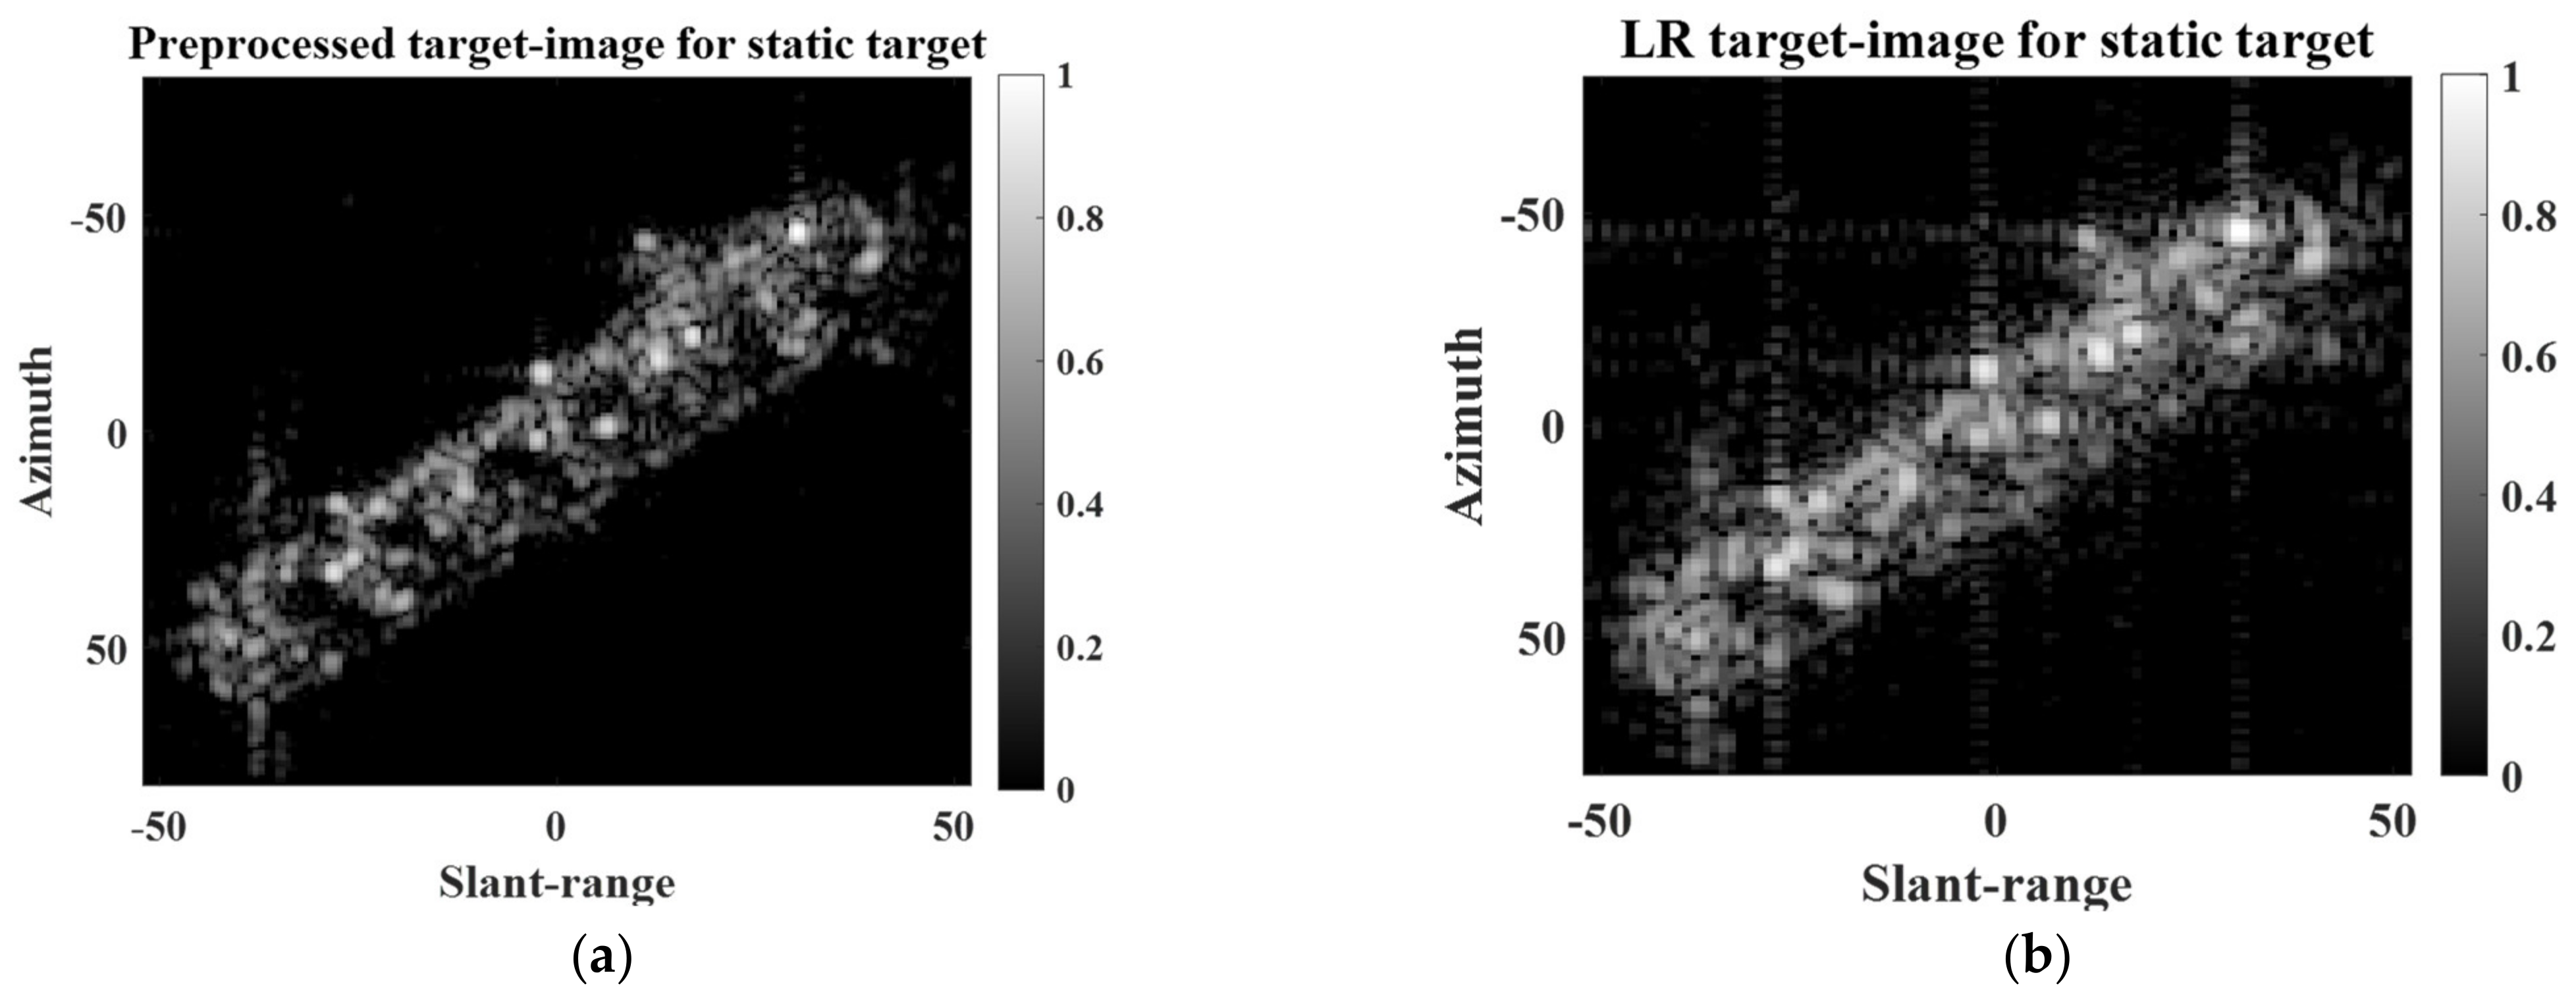
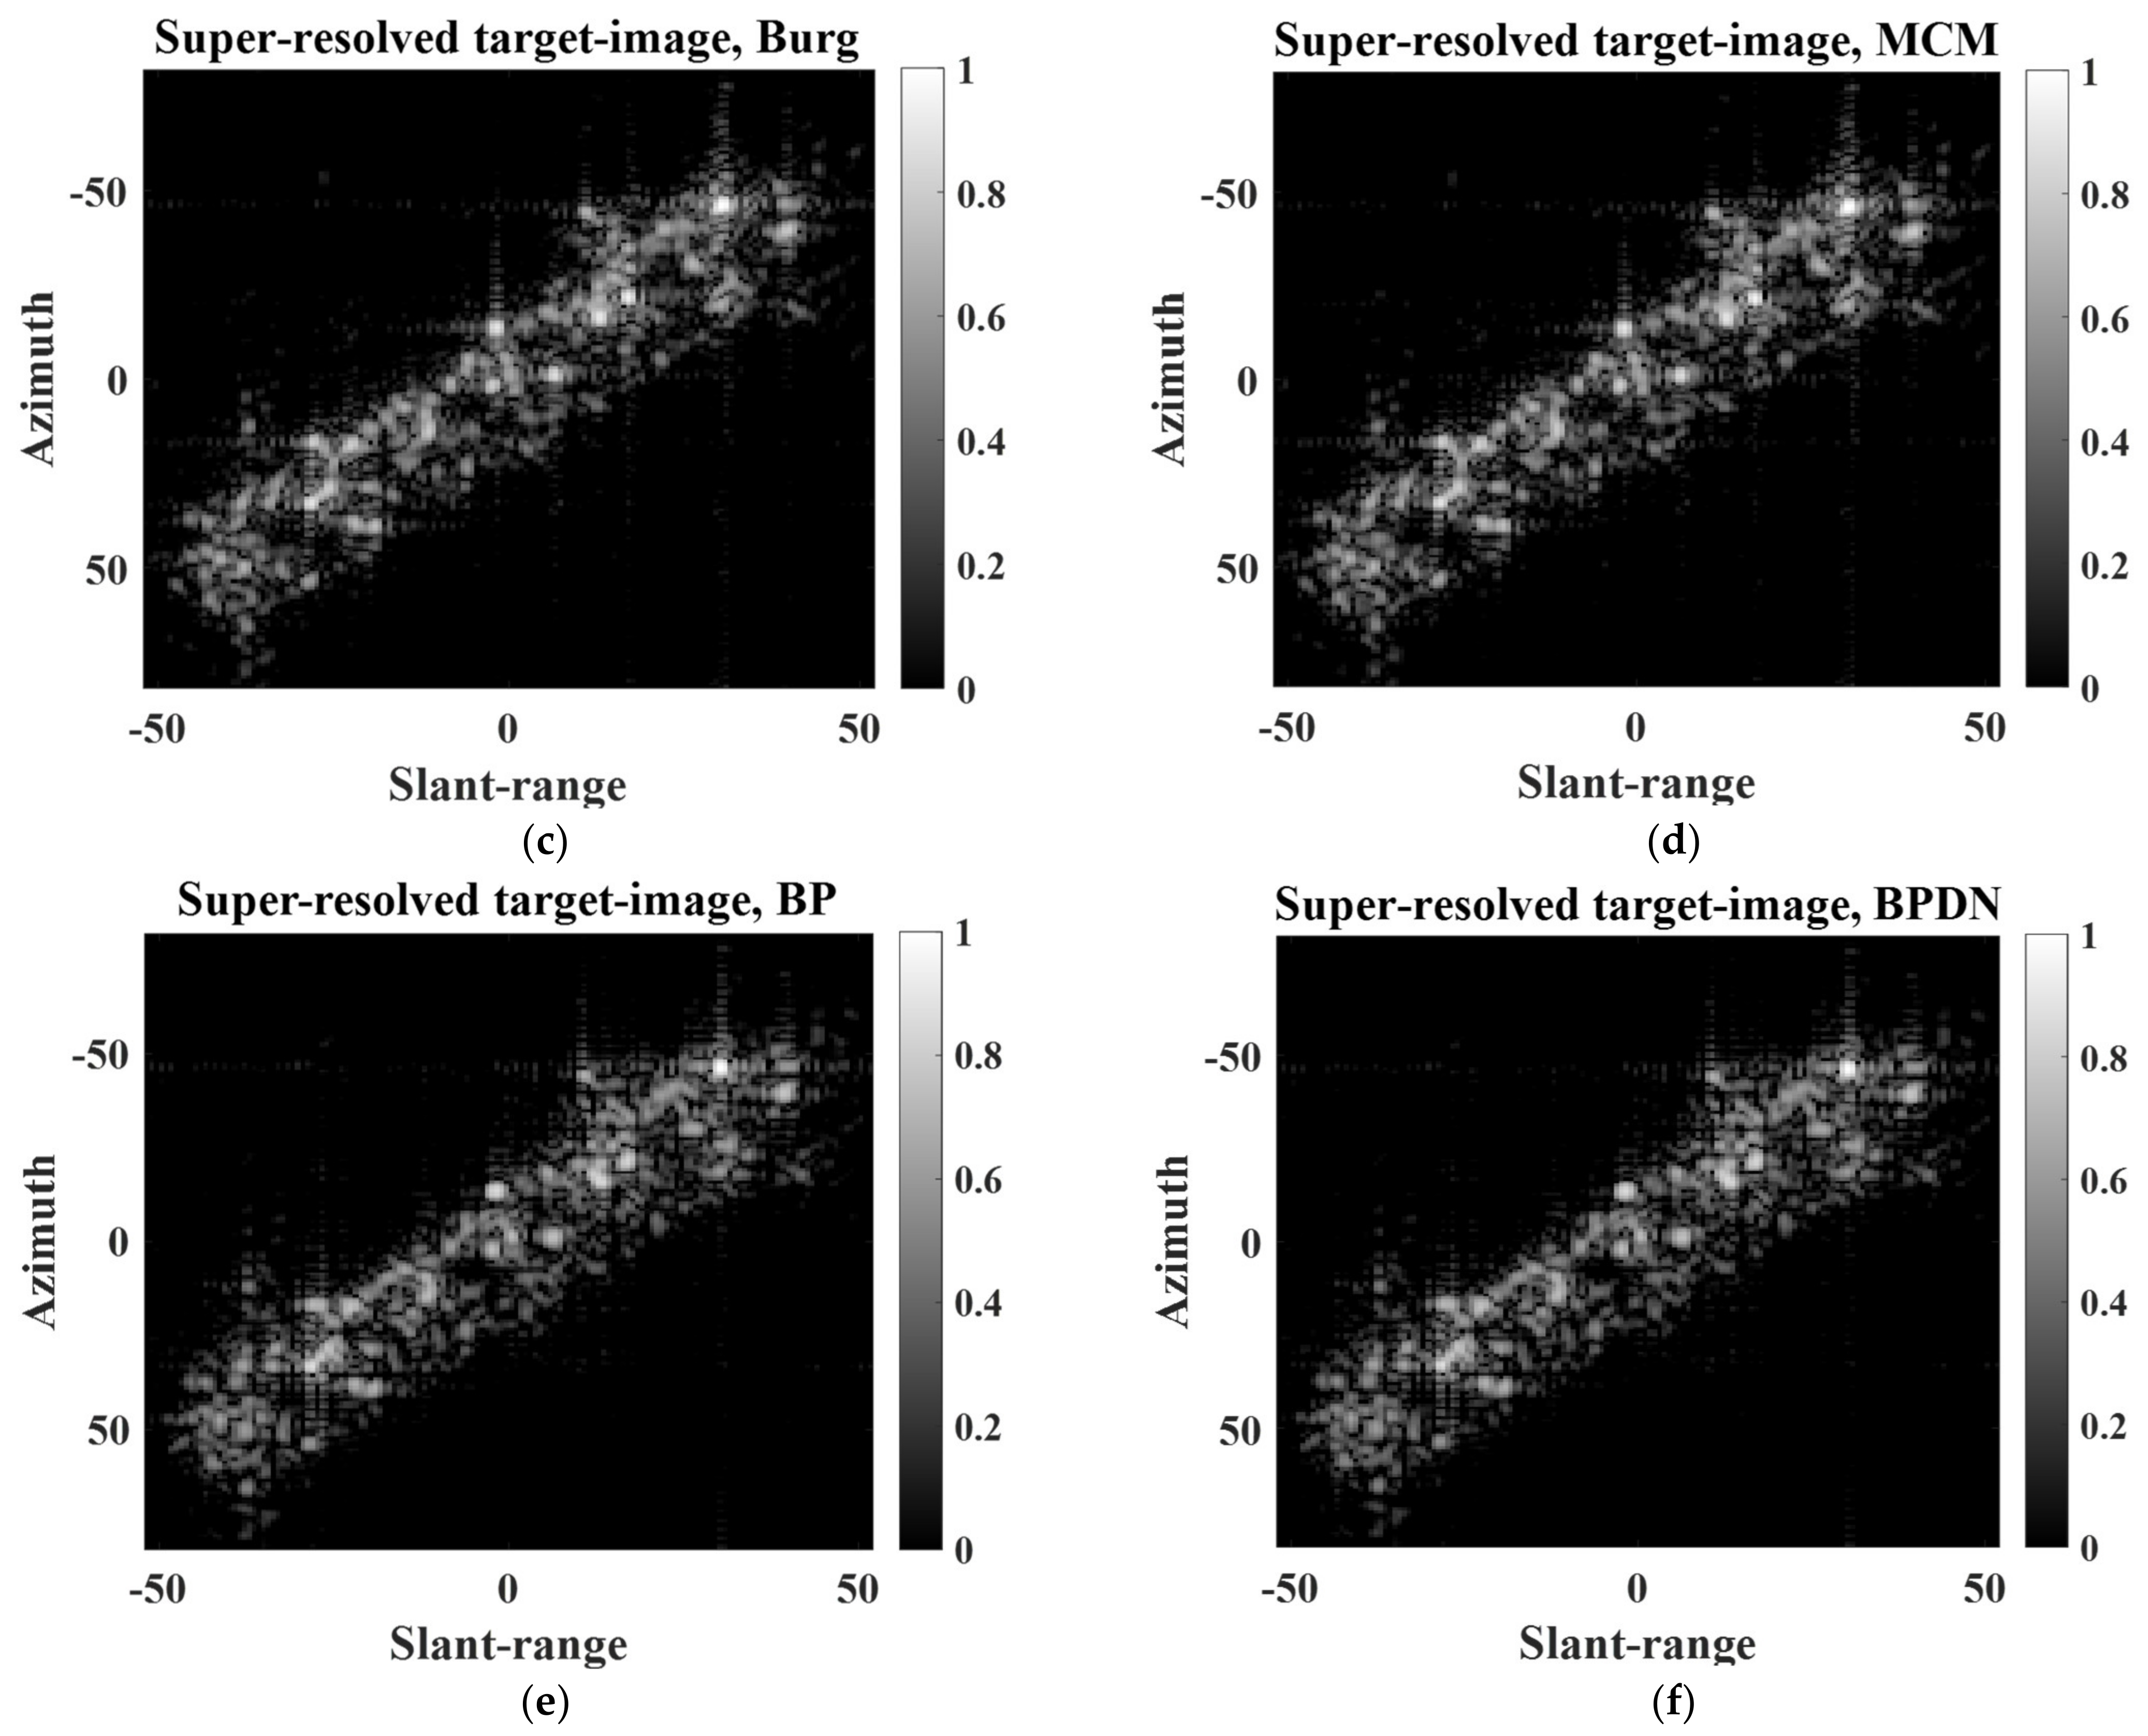
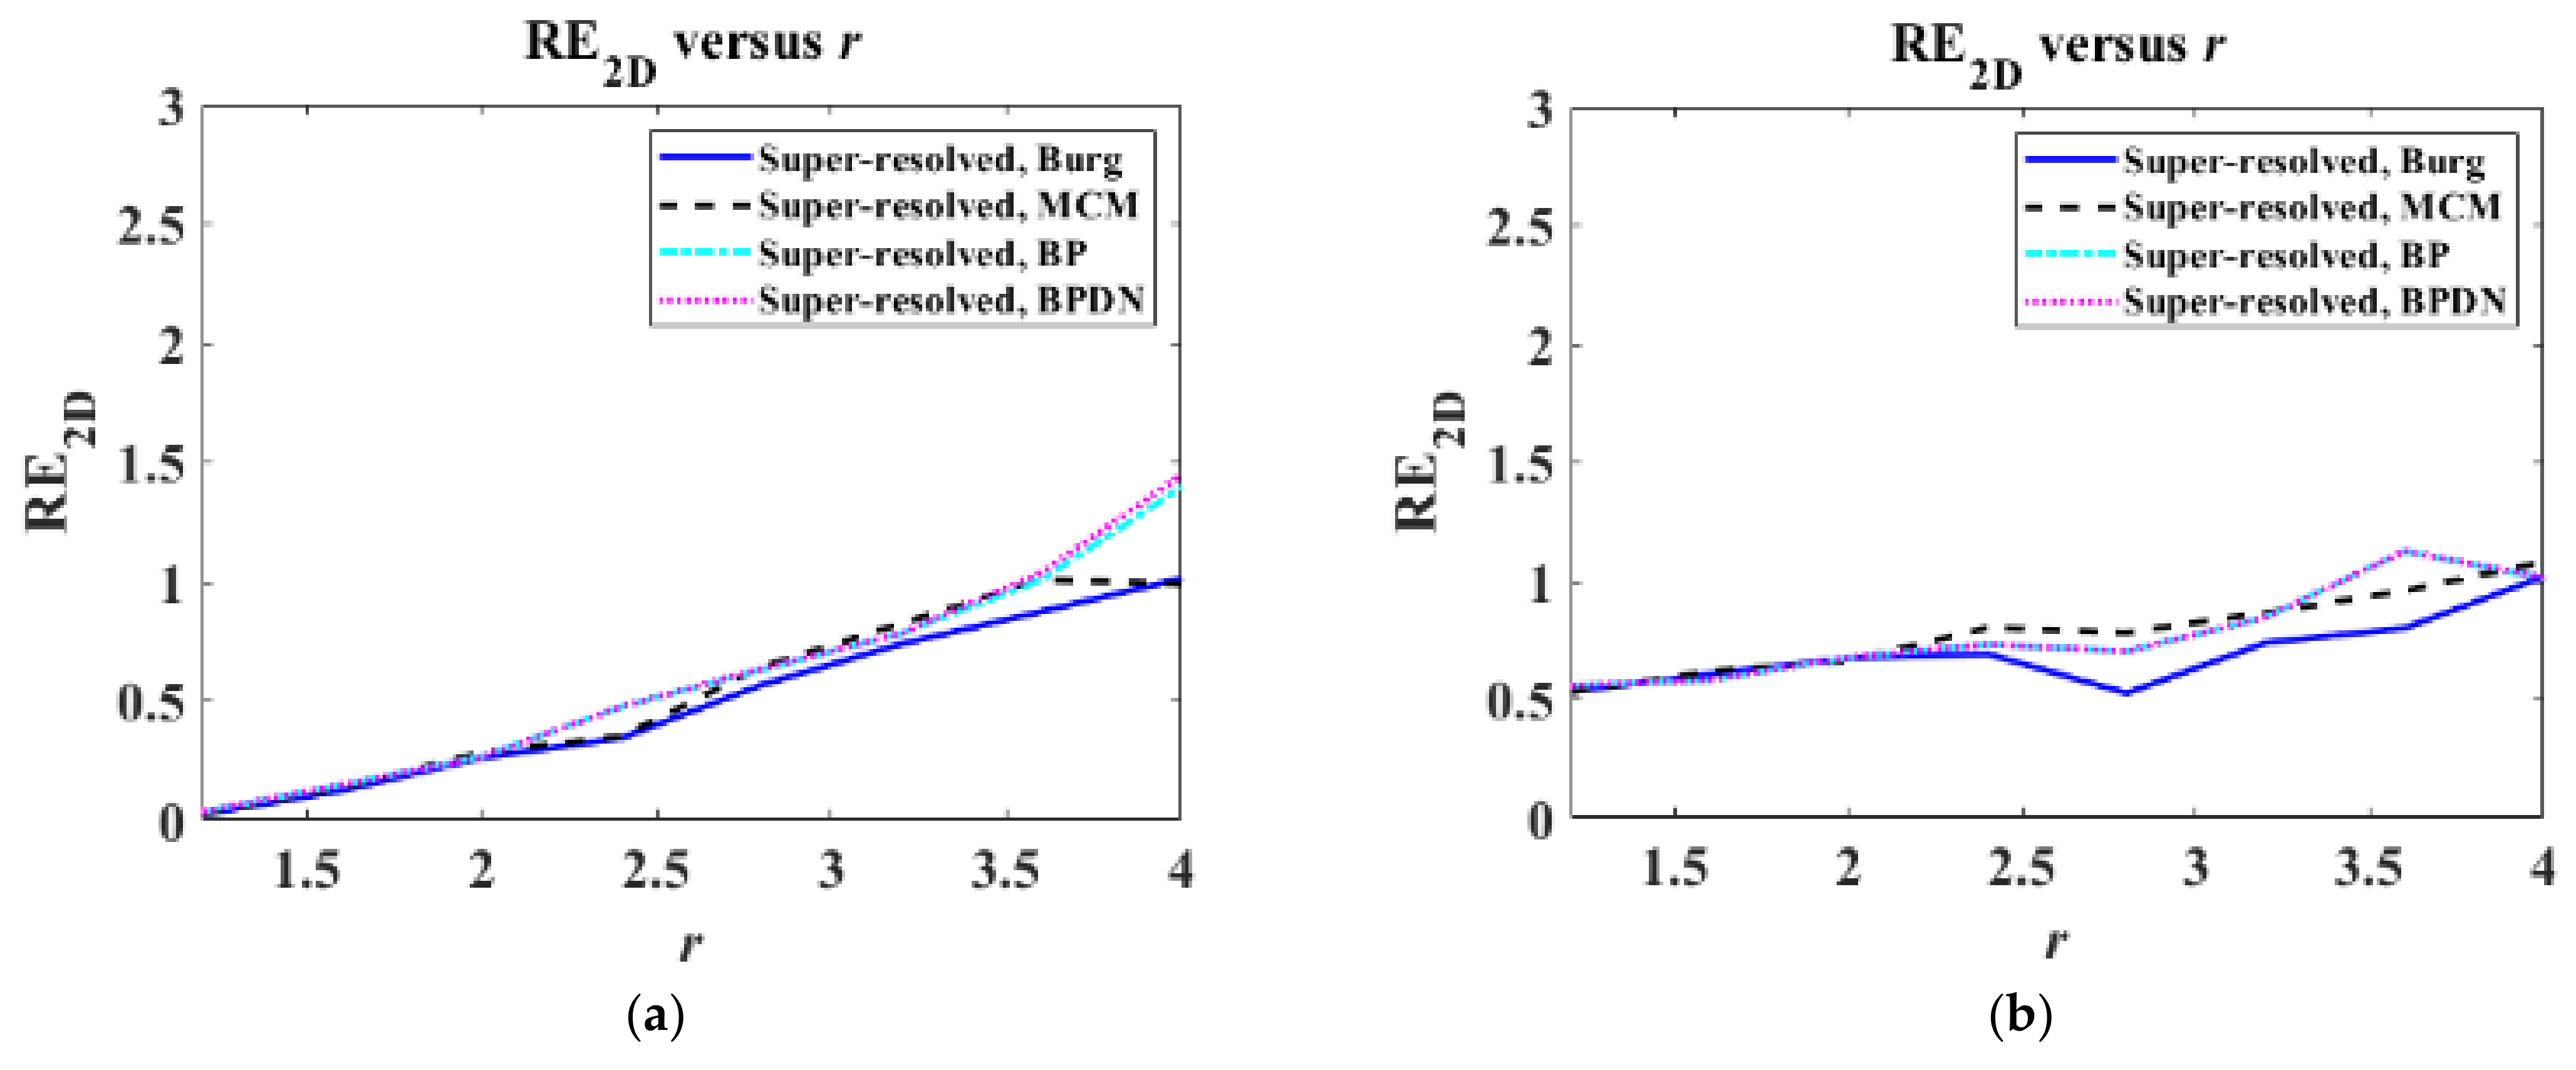
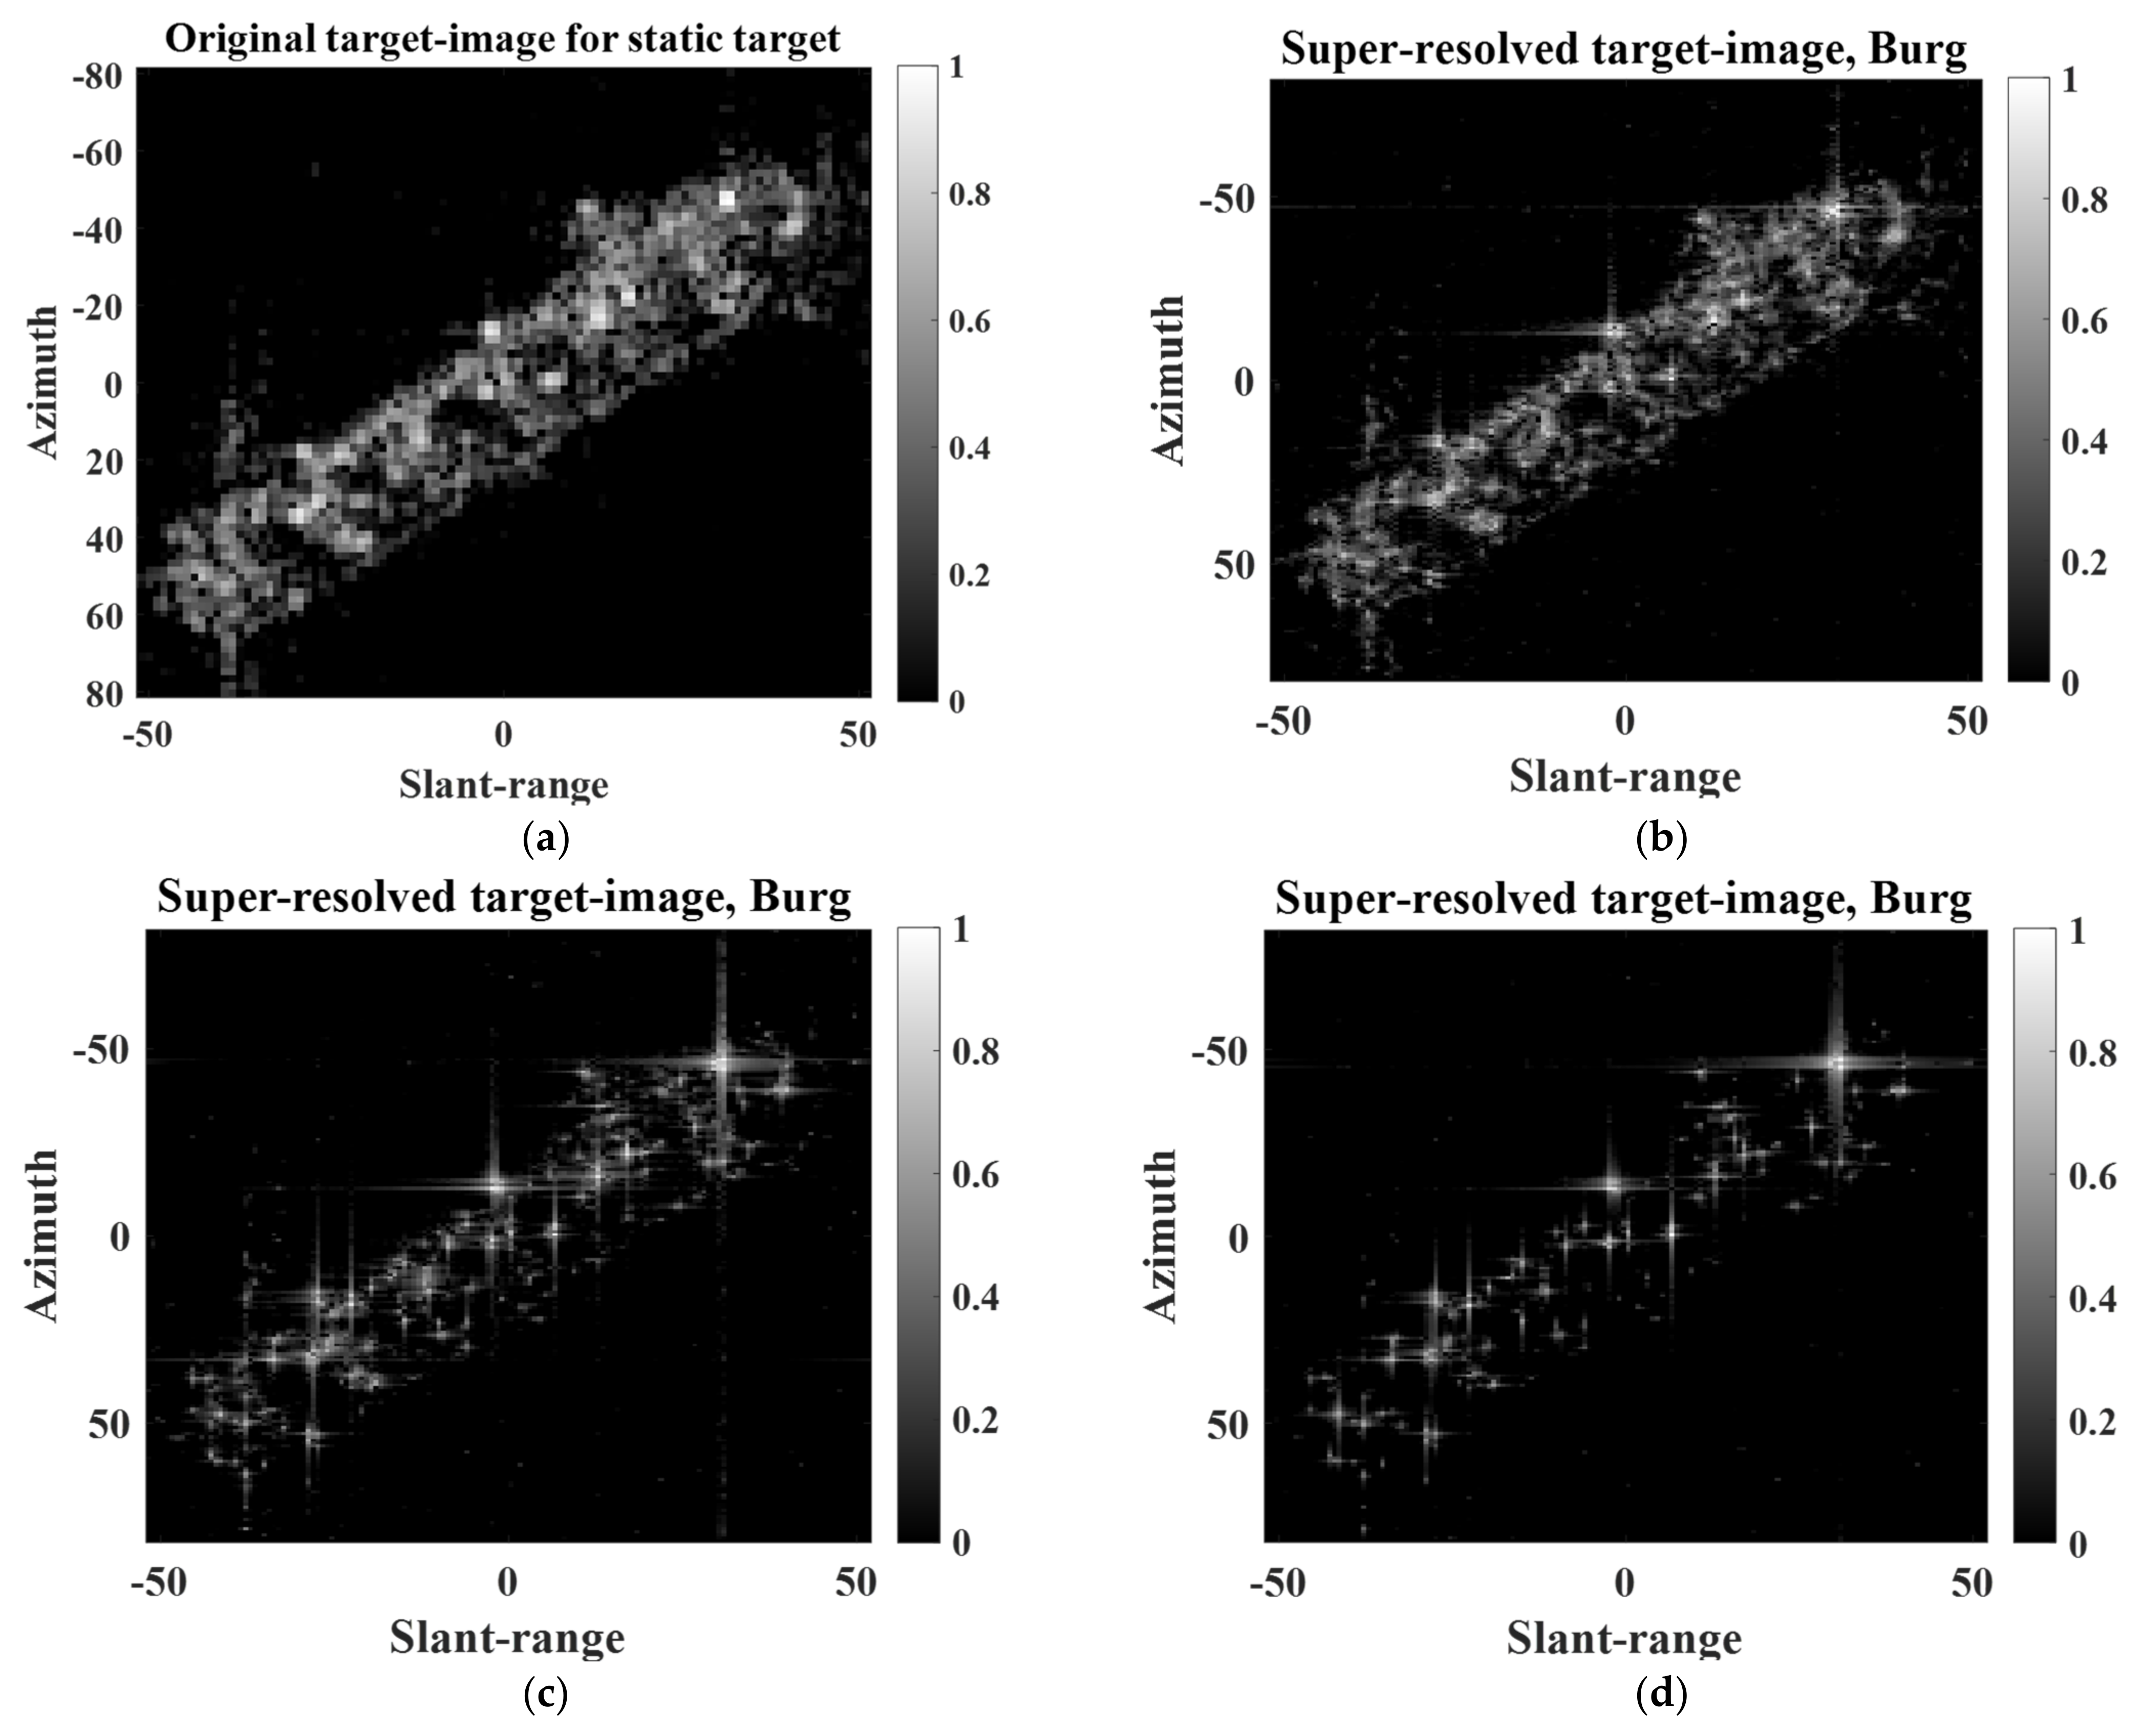
3.2. SR Results for Extended Targets
4. Discussion
5. Conclusions
Author Contributions
Funding
Conflicts of Interest
References
- Lee, S.-J.; Lee, K.-J. Efficient generation of artificial training DB for ship detection using satellite SAR images. IEEE J. Sel. Top. Appl. Earth Obs. Remote Sens. 2021, 14, 11764–11774. [Google Scholar] [CrossRef]
- Chang, Y.-L.; Anagaw, A.; Chang, L.; Wang, Y.C.; Hsiao, C.-Y.; Lee, W.-H. Ship Detection Based on YOLOv2 for SAR Imagery. Remote Sens. 2019, 11, 786. [Google Scholar] [CrossRef]
- Wang, Y.; Wang, C.; Zhang, H.; Dong, Y.; Wei, S. A SAR Dataset of Ship Detection for Deep Learning under Complex Backgrounds. Remote Sens. 2019, 11, 765. [Google Scholar] [CrossRef]
- Ma, M.; Chen, J.; Liu, W.; Yang, W. Ship Classification and Detection Based on CNN Using GF-3 SAR Images. Remote Sens. 2018, 10, 2043. [Google Scholar] [CrossRef]
- Wang, C.; Zhang, H.; Wu, F.; Jiang, S.; Zhang, B.; Tang, Y. A novel hierarchical ship classifier for COSMO-SkyMed SAR data. IEEE Geosci. Remote Sens. Lett. 2014, 11, 484–488. [Google Scholar] [CrossRef]
- Zhang, H.; Tian, X.; Wang, C.; Wu, F.; Zhang, B. Merchant vessel classification based on scattering component analysis for COSMO-SkyMed SAR images. IEEE Geosci. Remote Sens. Lett. 2013, 10, 1275–1279. [Google Scholar] [CrossRef]
- Jiang, M.; Yang, X.; Dong, Z.; Fang, S.; Meng, J. Ship Classification Based on Superstructure Scattering Features in SAR Images. IEEE Geosci. Remote Sens. Lett. 2016, 13, 616–620. [Google Scholar] [CrossRef]
- Xing, X.; Ji, K.; Zou, H.; Chen, W.; Sun, J. Ship classification in TerraSAR-X images with feature space-based sparse representation. IEEE Geosci. Remote Sens. Lett. 2013, 10, 1562–1566. [Google Scholar] [CrossRef]
- Novak, L.M.; Halversen, S.D.; Owirka, G.J.; Hiett, M. Effects of polarization and resolution on the performance of a SAR automatic target recognition system. Linc. Lab. J. 1995, 8, 49–68. [Google Scholar]
- Moore, T.G.; Zuerndorfer, B.W.; Burt, E.C. Enhanced imagery using spectral-estimation-based techniques. Linc. Lab. J. 1997, 10, 171–186. [Google Scholar]
- Gupta, I.; Beals, M.; Moghaddar, A. Data extrapolation for high resolution radar imaging. IEEE Trans. Antennas Propag. 1994, 42, 1540–1545. [Google Scholar] [CrossRef]
- Li, J.; Stoica, P. Efficient mixed-spectrum estimation with applications to target feature extraction. IEEE Trans. Signal Process. 1996, 44, 281–295. [Google Scholar] [CrossRef]
- Odendaal, J.; Barnard, E.; Pistorius, C. Two-dimensional superresolution radar imaging using the MUSIC algorithm. IEEE Trans. Antennas Propag. 1994, 42, 1386–1391. [Google Scholar] [CrossRef]
- Roy, R.; Kailath, T. ESPRIT-estimation of signal parameters via rotational invariance techniques. IEEE Trans. Acoust. Speech Signal Process. 1989, 37, 984–995. [Google Scholar] [CrossRef]
- Kay, S.M. Modern Spectral Estimation: Theory and Application; Prentice-Hall: Englewood Cliffs, NJ, USA, 1988. [Google Scholar]
- Lee, S.-J.; Lee, M.-J.; Kim, K.-T.; Bae, J.-H. Classification of ISAR images using variable cross-range scaling. IEEE Trans. Aerosp. Electron. Syst. 2018, 54, 2291–2303. [Google Scholar] [CrossRef]
- Kim, K.-T.; Bae, J.-H.; Kim, H.-T. Effect of AR model-based data extrapolation on target recognition performance. IEEE Trans. Antennas Propag. 2003, 51, 912–914. [Google Scholar]
- Ye, F.; Zhang, F.; Zhu, J. ISAR super-resolution imaging based on sparse representation. In Proceedings of the 2010 International Conference on Wireless Communications & Signal Processing (WCSP), Suzhou, China, 21–23 October 2010; pp. 1–6. [Google Scholar]
- Elad, M. Sparse and Redundant Representations; Springer: Berlin, Germany, 2010. [Google Scholar]
- Chen, S.S.; Donoho, D.L.; Saunders, M.A. Atomic decomposition by basis pursuit. Soc. Ind. Appl. Math. 2001, 43, 129–159. [Google Scholar] [CrossRef]
- Lee, S.-J.; Bae, J.-H.; Kang, B.-S.; Kim, K.-T. Classification of ISAR images using sparse recovery algorithms. In Proceedings of the 2014 IEEE Conference on Antenna Measurements & Applications (CAMA), Antibes Juan-les-Pins, France, 16–19 November 2014. [Google Scholar]
- Bae, J.-H.; Kang, B.-S.; Kim, K.-T.; Yang, E. Performance of sparse recovery algorithms for the reconstruction of radar images from incomplete RCS data. IEEE Geosci. Remote Sens. Lett. 2015, 12, 860–864. [Google Scholar]
- Kang, M.-S.; Lee, S.-J.; Lee, S.-H.; Kim, K.-T. ISAR imaging of high-speed maneuvering target using gapped stepped-frequency waveform and compressive sensing. IEEE Trans. Signal Process. 2017, 26, 5043–5056. [Google Scholar] [CrossRef]
- Kang, M.-S.; Kim, K.-T. Compressive sensing based SAR imaging and autofocus using improved Tikhonov regularization. IEEE Sens. J. 2019, 19, 5529–5540. [Google Scholar] [CrossRef]
- Lee, S.-J.; Lee, S.-G.; Yang, D.-C.; Kim, D.-H. Efficiency evaluation of AR model-based linear prediction for improvement of spatial-resolution of spotlight mode KOMPSAT-5 image. In Proceedings of the 40th Asian Conference on Remote Sensing (ACRS), Daejeon, Korea, 14–18 October 2019. [Google Scholar]
- Martorella, M.; Giusti, E.; Berizzi, F.; Bacci, A.; Mese, E.D. ISAR based technique for refocusing non-cooperative targets in SAR images. IET Radar Sonar Navig. 2012, 6, 332–340. [Google Scholar] [CrossRef]
- Chen, V.C.; Martorella, M. Inverse Synthetic Aperture Radar Imaging Principles, Algorithms and Applications; SciTech Publishing: Raleigh, NC, USA, 2014. [Google Scholar]
- Potter, L.C.; Chiang, D.-M.; Carriere, R.; Gerry, M.J. A GTD-based parametric model for radar scattering. IEEE Trans. Antennas Propag. 1995, 43, 1058–1067. [Google Scholar] [CrossRef]
- Wang, J.; Liu, X.; Zhou, Z. Minimum-entropy phase adjustment for ISAR. IEE Proc. Radar Sonar Navig. 2004, 151, 203–209. [Google Scholar] [CrossRef]
- Cumming, I.G.; Wong, F.H. Digital Processing of Synthetic Aperture Radar Data; Artech House: Norwood, MA, USA, 2005. [Google Scholar]
- Cuomo, K.; Pion, J.; Mayhan, J. Ultrawide-band coherent processing. IEEE Trans. Antennas Propag. 1999, 47, 1094–1107. [Google Scholar] [CrossRef]
- Oppenheim, V.; Willsky, A.S.; Nawab, S.H. Signals & Systems, 2nd ed.; Prentice-Hall: Englewood Cliffs, NJ, USA, 2007. [Google Scholar]
- Marple, L. A new autoregressive spectrum analysis algorithm. IEEE Trans. Acoust. Speech Signal Process. 1980, 28, 441–454. [Google Scholar] [CrossRef]
- l1-MAGIC. Available online: https://candes.su.domains/software/l1magic/ (accessed on 1 January 2022).
- Zhang, H.; Li, Y.; Su, Y. SAR image quality assessment using coherent correlation function. In Proceedings of the 5th International Congress on Image and Signal Processing 2012, Chongqing, China, 16–18 October 2012. [Google Scholar]
- Martinez, A.; Marchand, J.L. SAR image quality assessment. Rev. Teledetec. 1993, 2, 12–18. [Google Scholar]
- Stockle, C.; Munir, J.; Mezghani, A.; Nossek, J.A. DoA estimation performance and computational complexity of subspace- and compressed sensing-based methods. In Proceedings of the 19th International ITG Workshop on Smart Antennas (WSA), Ilmenau, Germany, 3–5 March 2015. [Google Scholar]


| Measure | |||
|---|---|---|---|
| 3 dB Bandwidth [m] | PSLR [dB] | ISLR [dB] | |
| PR | 0.67 | −20.93 | −16.73 |
| LR | 1.02 | −15.21 | −12.38 |
| Burg | 0.69 | −19.06 | −15.08 |
| MCM | 0.72 | −19.69 | −16.27 |
| BP | 0.68 | −16.78 | −14.48 |
| BPDN | 0.68 | −16.79 | −14.5 |
| Measure | |||
|---|---|---|---|
| 3 dB Bandwidth [m] | PSLR [dB] | ISLR [dB] | |
| PR | 0.96 | −23.76 | −18.89 |
| LR | 1.44 | −16.35 | −13.15 |
| Burg | 0.99 | −19.77 | −16.68 |
| MCM | 1.02 | −20.06 | −18.48 |
| BP | 1.07 | −19.07 | −18.98 |
| BPDN | 1.07 | −19.07 | −18.98 |
| Target Image | ||||||
|---|---|---|---|---|---|---|
| PR | LR | Burg | MCM | BP | BPDN | |
| SE | 6.98 | 7.48 | 6.98 | 7.02 | 7.09 | 7.1 |
| IC | 9.92 | 7.03 | 9.3 | 9.1 | 9.3 | 9.22 |
| Target Image | ||||||
|---|---|---|---|---|---|---|
| PR | LR | Burg | MCM | BP | BPDN | |
| SE | 5.06 | 5.69 | 4.96 | 5.07 | 5.41 | 5.41 |
| IC | 41.87 | 28.83 | 41.21 | 39.59 | 35.48 | 35.48 |
| Target Image | ||||
|---|---|---|---|---|
| Burg | MCM | BP | BPDN | |
| CT (s) | 0.05 | 0.06 | 0.18 | 0.29 |
| Target Image | ||||
|---|---|---|---|---|
| Burg | MCM | BP | BPDN | |
| CT (s) | 0.12 | 0.17 | 1.01 | 1.39 |
Publisher’s Note: MDPI stays neutral with regard to jurisdictional claims in published maps and institutional affiliations. |
© 2022 by the authors. Licensee MDPI, Basel, Switzerland. This article is an open access article distributed under the terms and conditions of the Creative Commons Attribution (CC BY) license (https://creativecommons.org/licenses/by/4.0/).
Share and Cite
Lee, S.-J.; Lee, S.-G. Super-Resolution Procedure for Target Responses in KOMPSAT-5 Images. Sensors 2022, 22, 7189. https://doi.org/10.3390/s22197189
Lee S-J, Lee S-G. Super-Resolution Procedure for Target Responses in KOMPSAT-5 Images. Sensors. 2022; 22(19):7189. https://doi.org/10.3390/s22197189
Chicago/Turabian StyleLee, Seung-Jae, and Sun-Gu Lee. 2022. "Super-Resolution Procedure for Target Responses in KOMPSAT-5 Images" Sensors 22, no. 19: 7189. https://doi.org/10.3390/s22197189
APA StyleLee, S.-J., & Lee, S.-G. (2022). Super-Resolution Procedure for Target Responses in KOMPSAT-5 Images. Sensors, 22(19), 7189. https://doi.org/10.3390/s22197189