
Thermal Water Prospection with UAV, Low-Cost Sensors and GIS. Application to the Case of La Hermida

 ,
,  ,
,  ,
, 
Abstract
:1. Introduction
2. Methodology
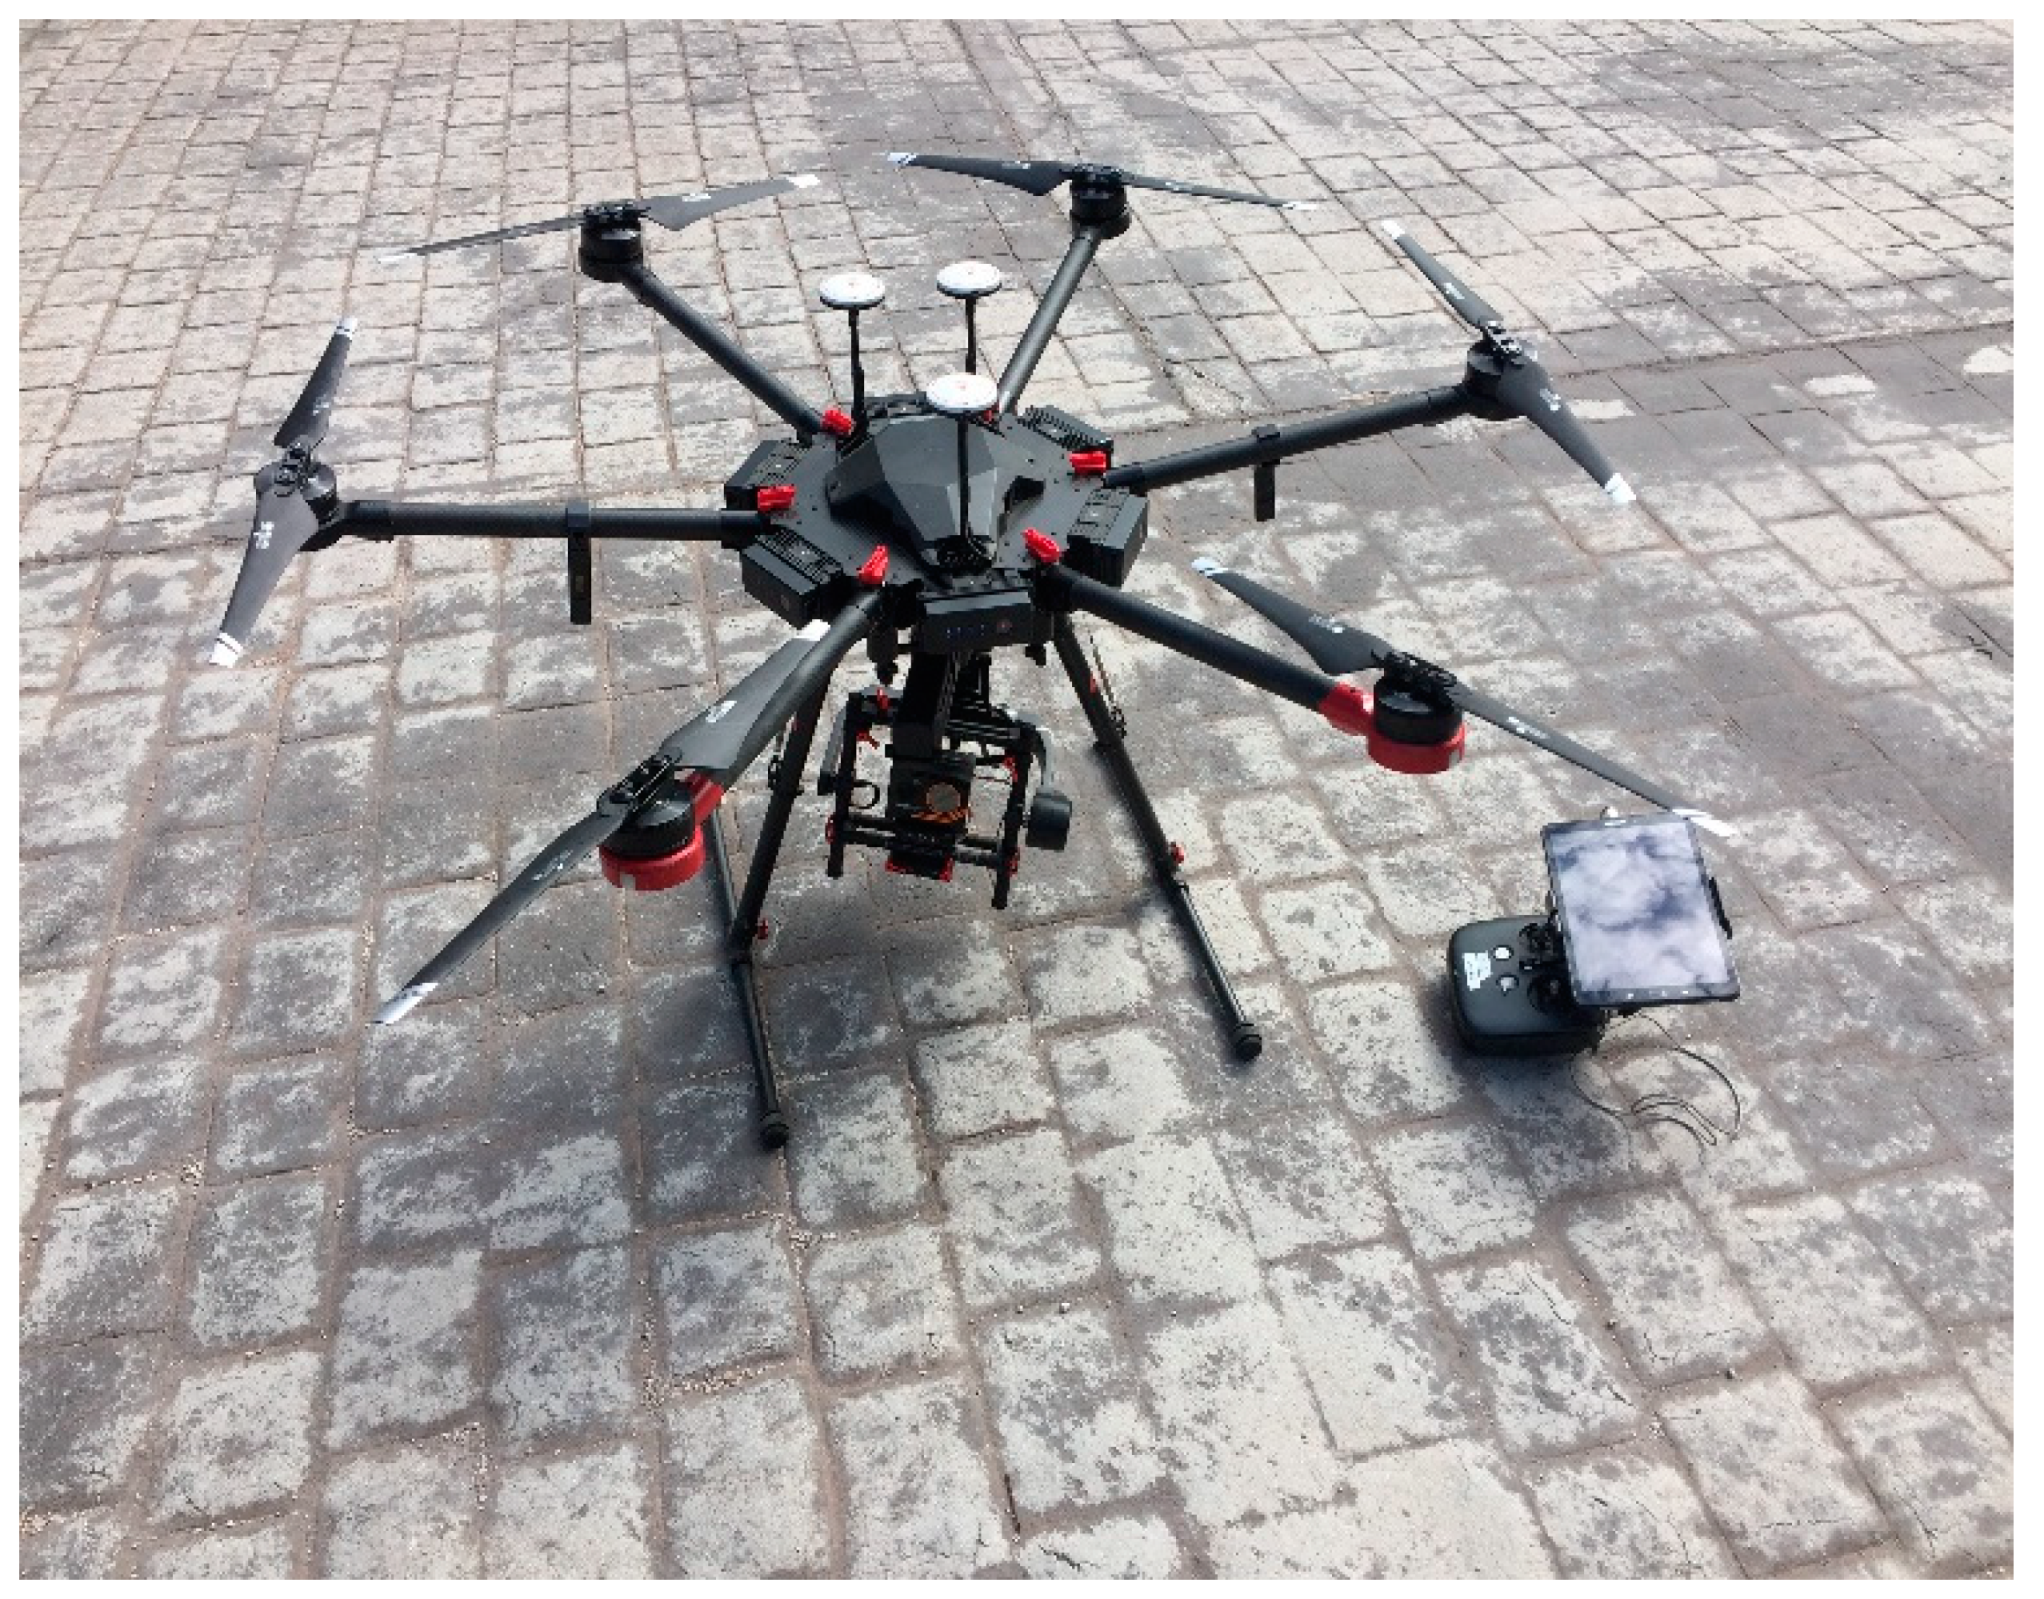
2.1. Thermal Imaging with UAVs and Data Capture
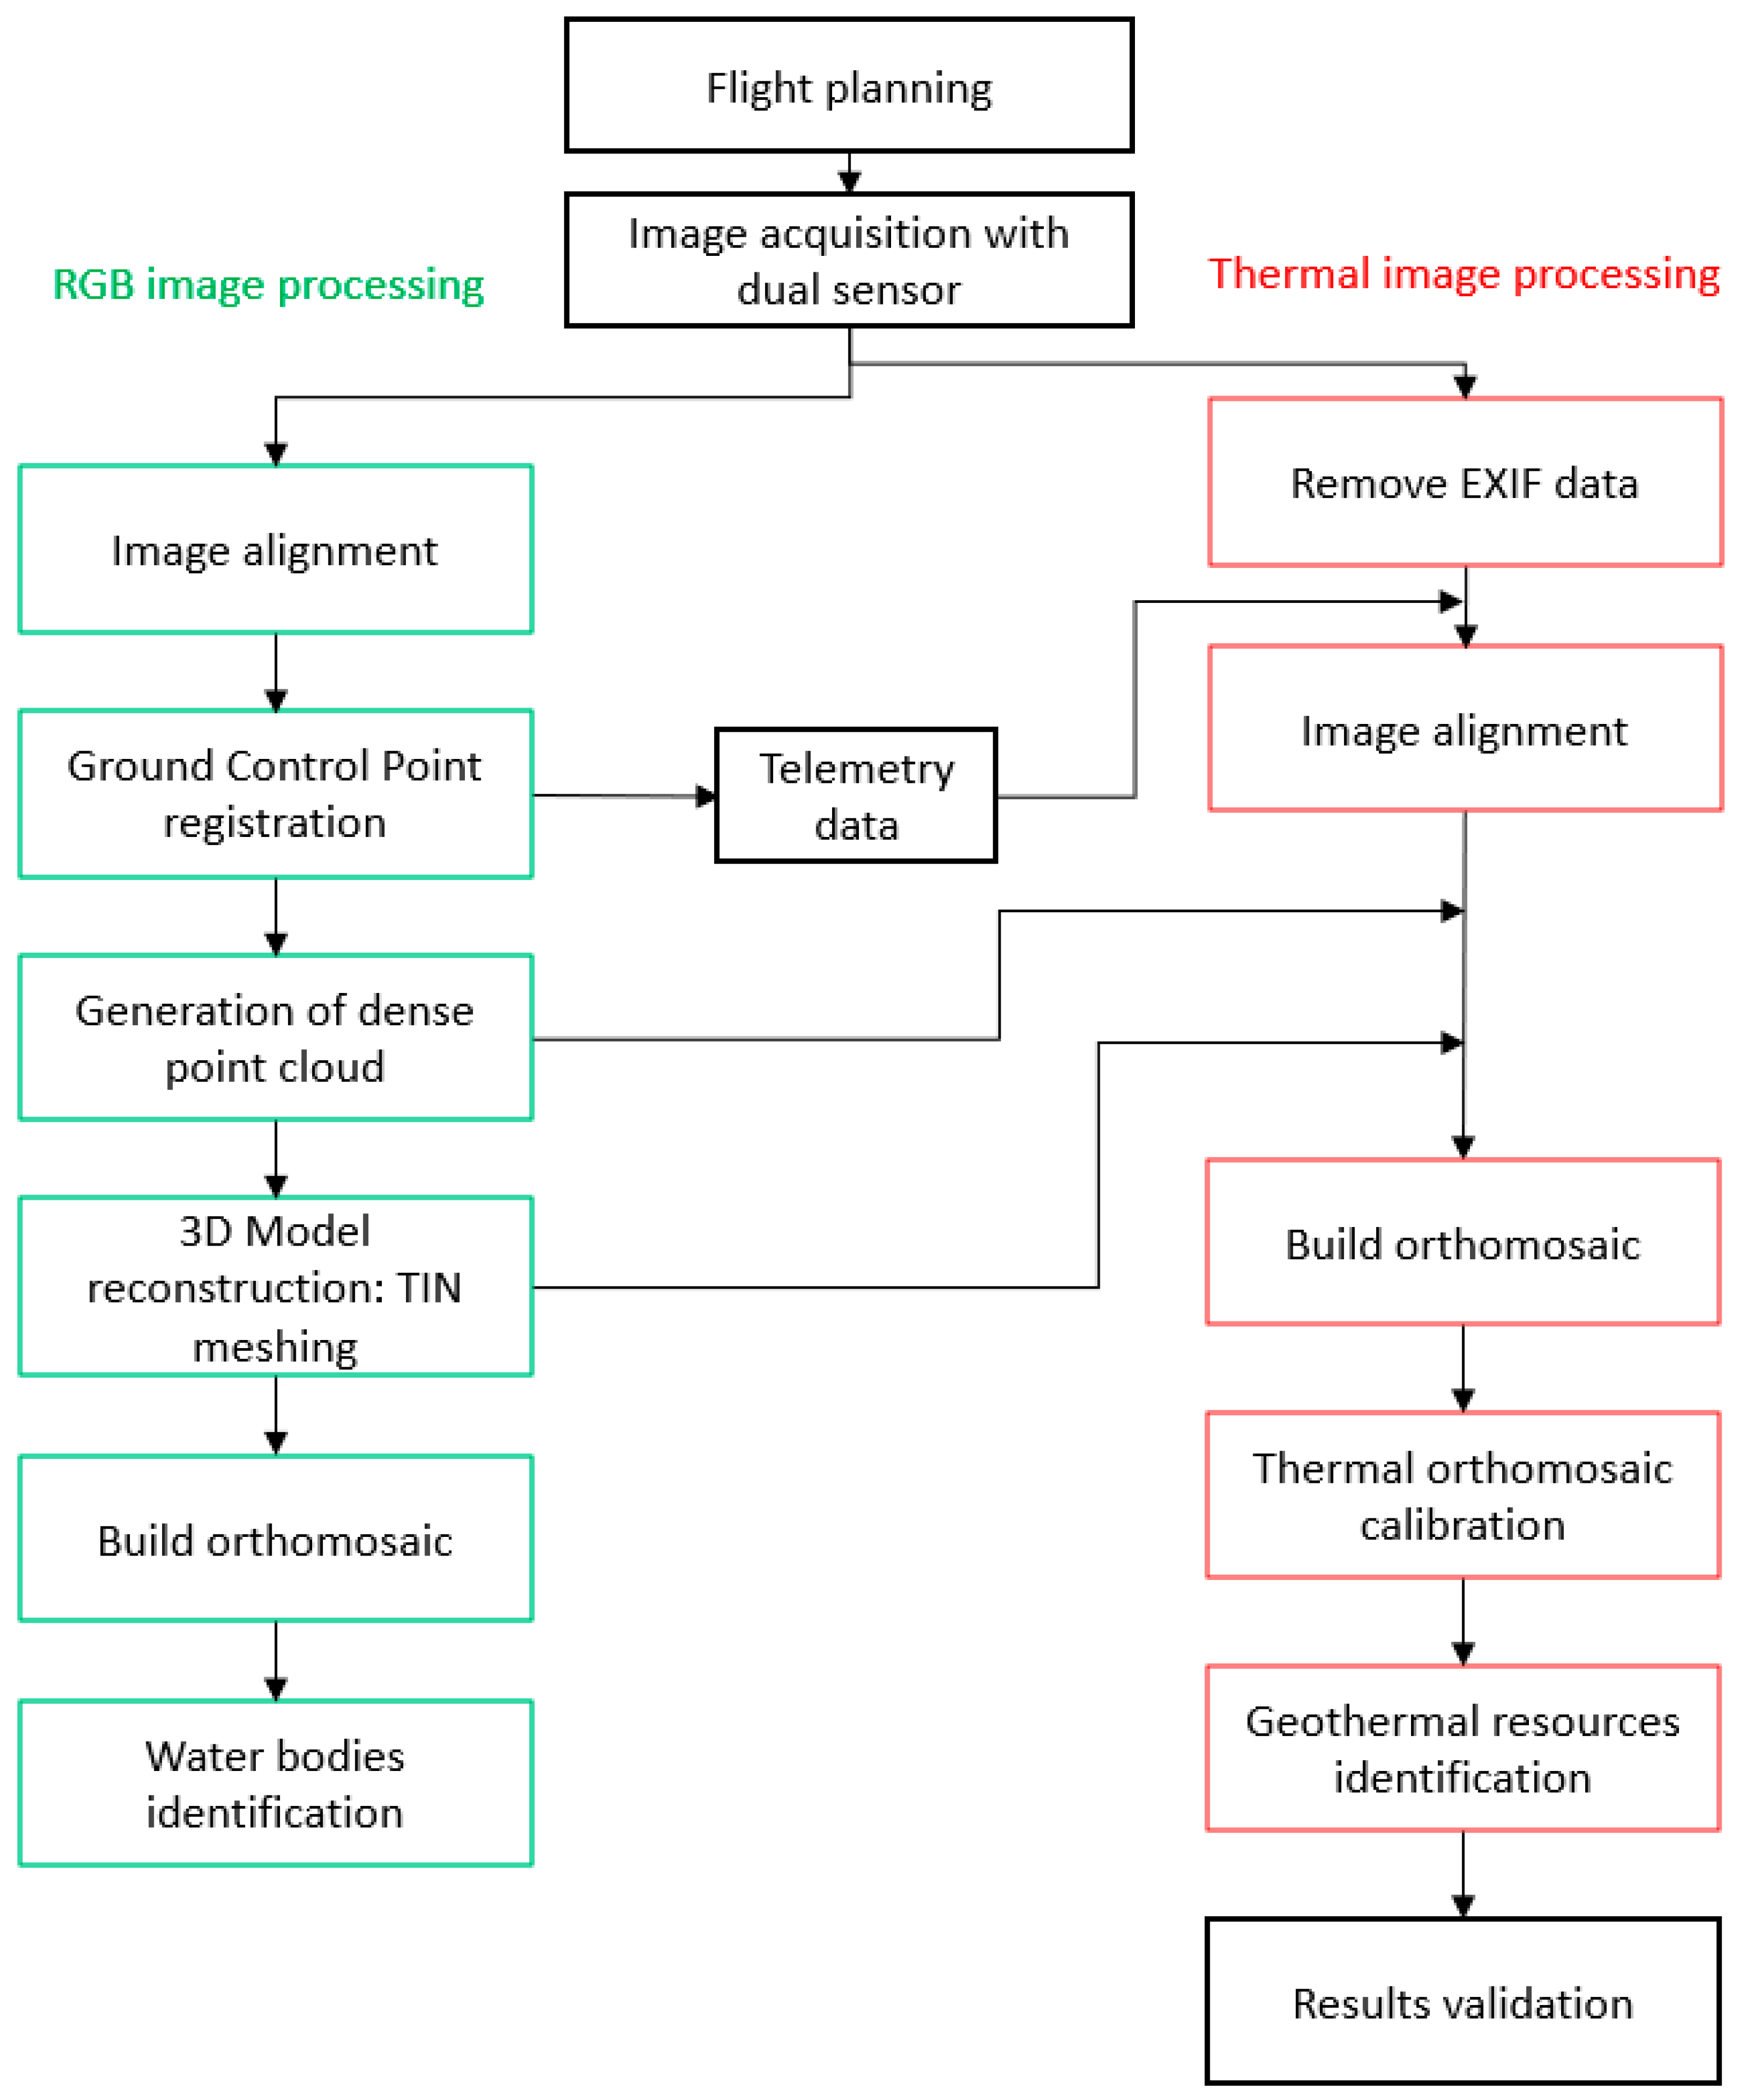
2.2. Photogrammetric Processing of Thermal and RGB Images
2.3. Thermal Orthomosaic Calibration
2.4. Thermal Orthomosaics Analysis and Interpretation with GIS
2.5. Method Validation
3. Results
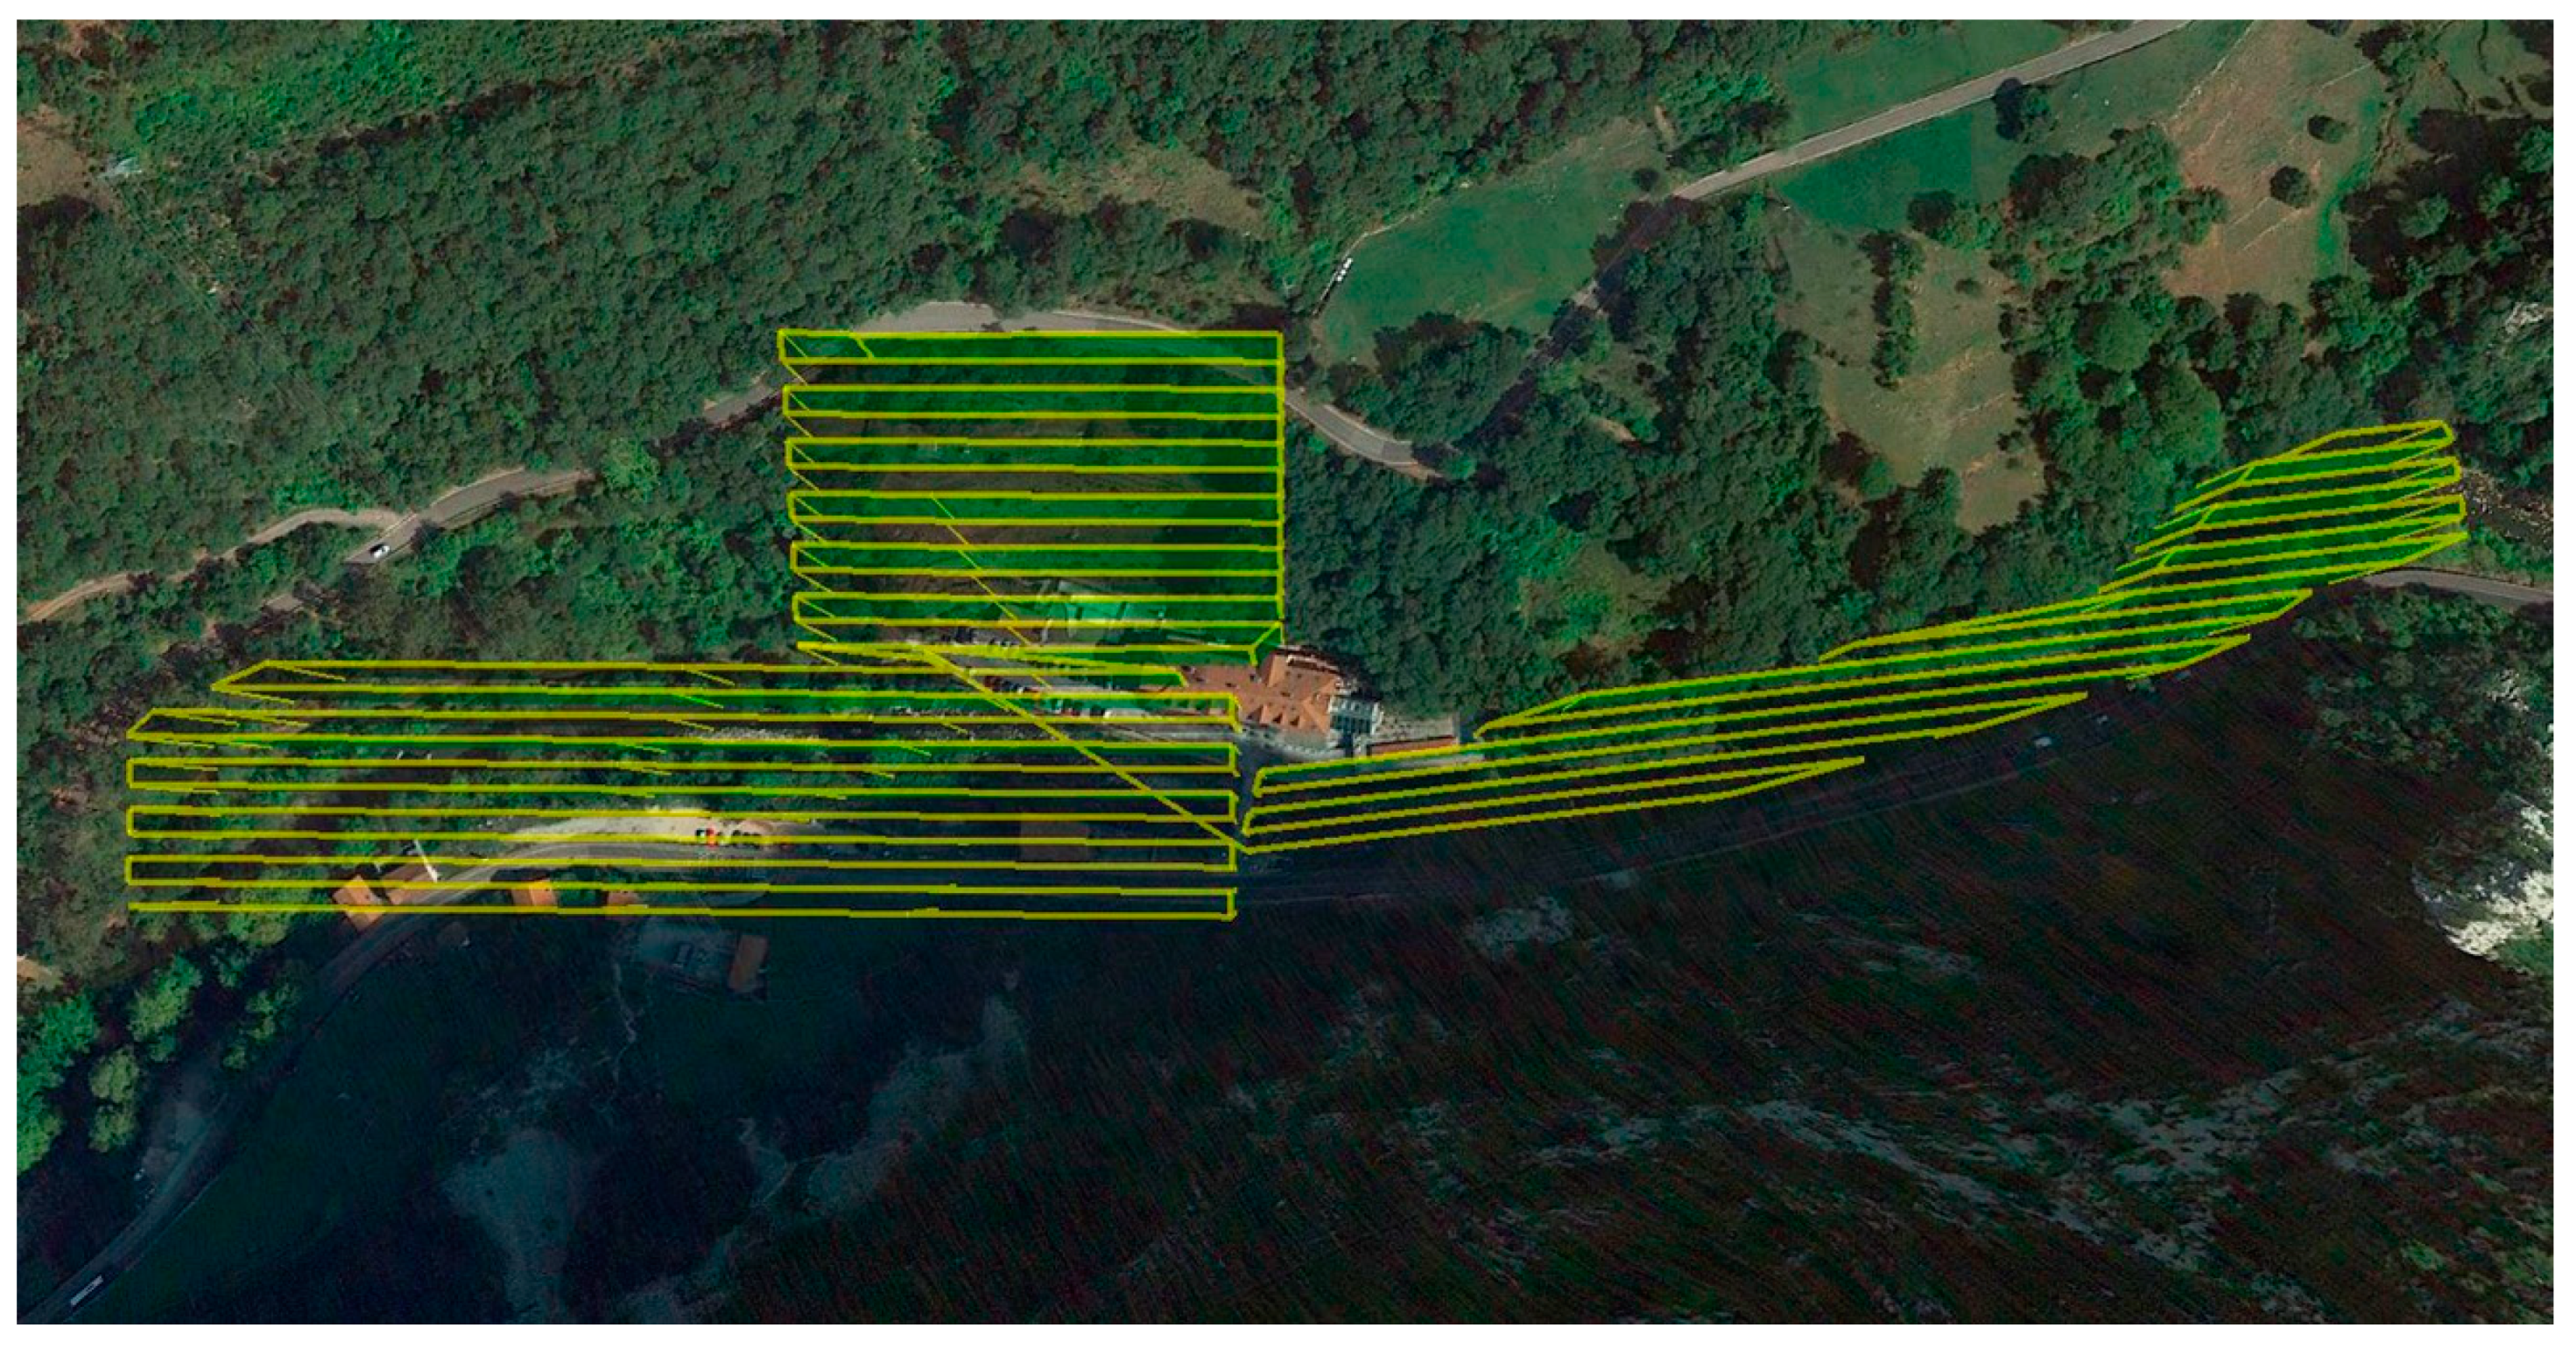
3.1. Flight Plan
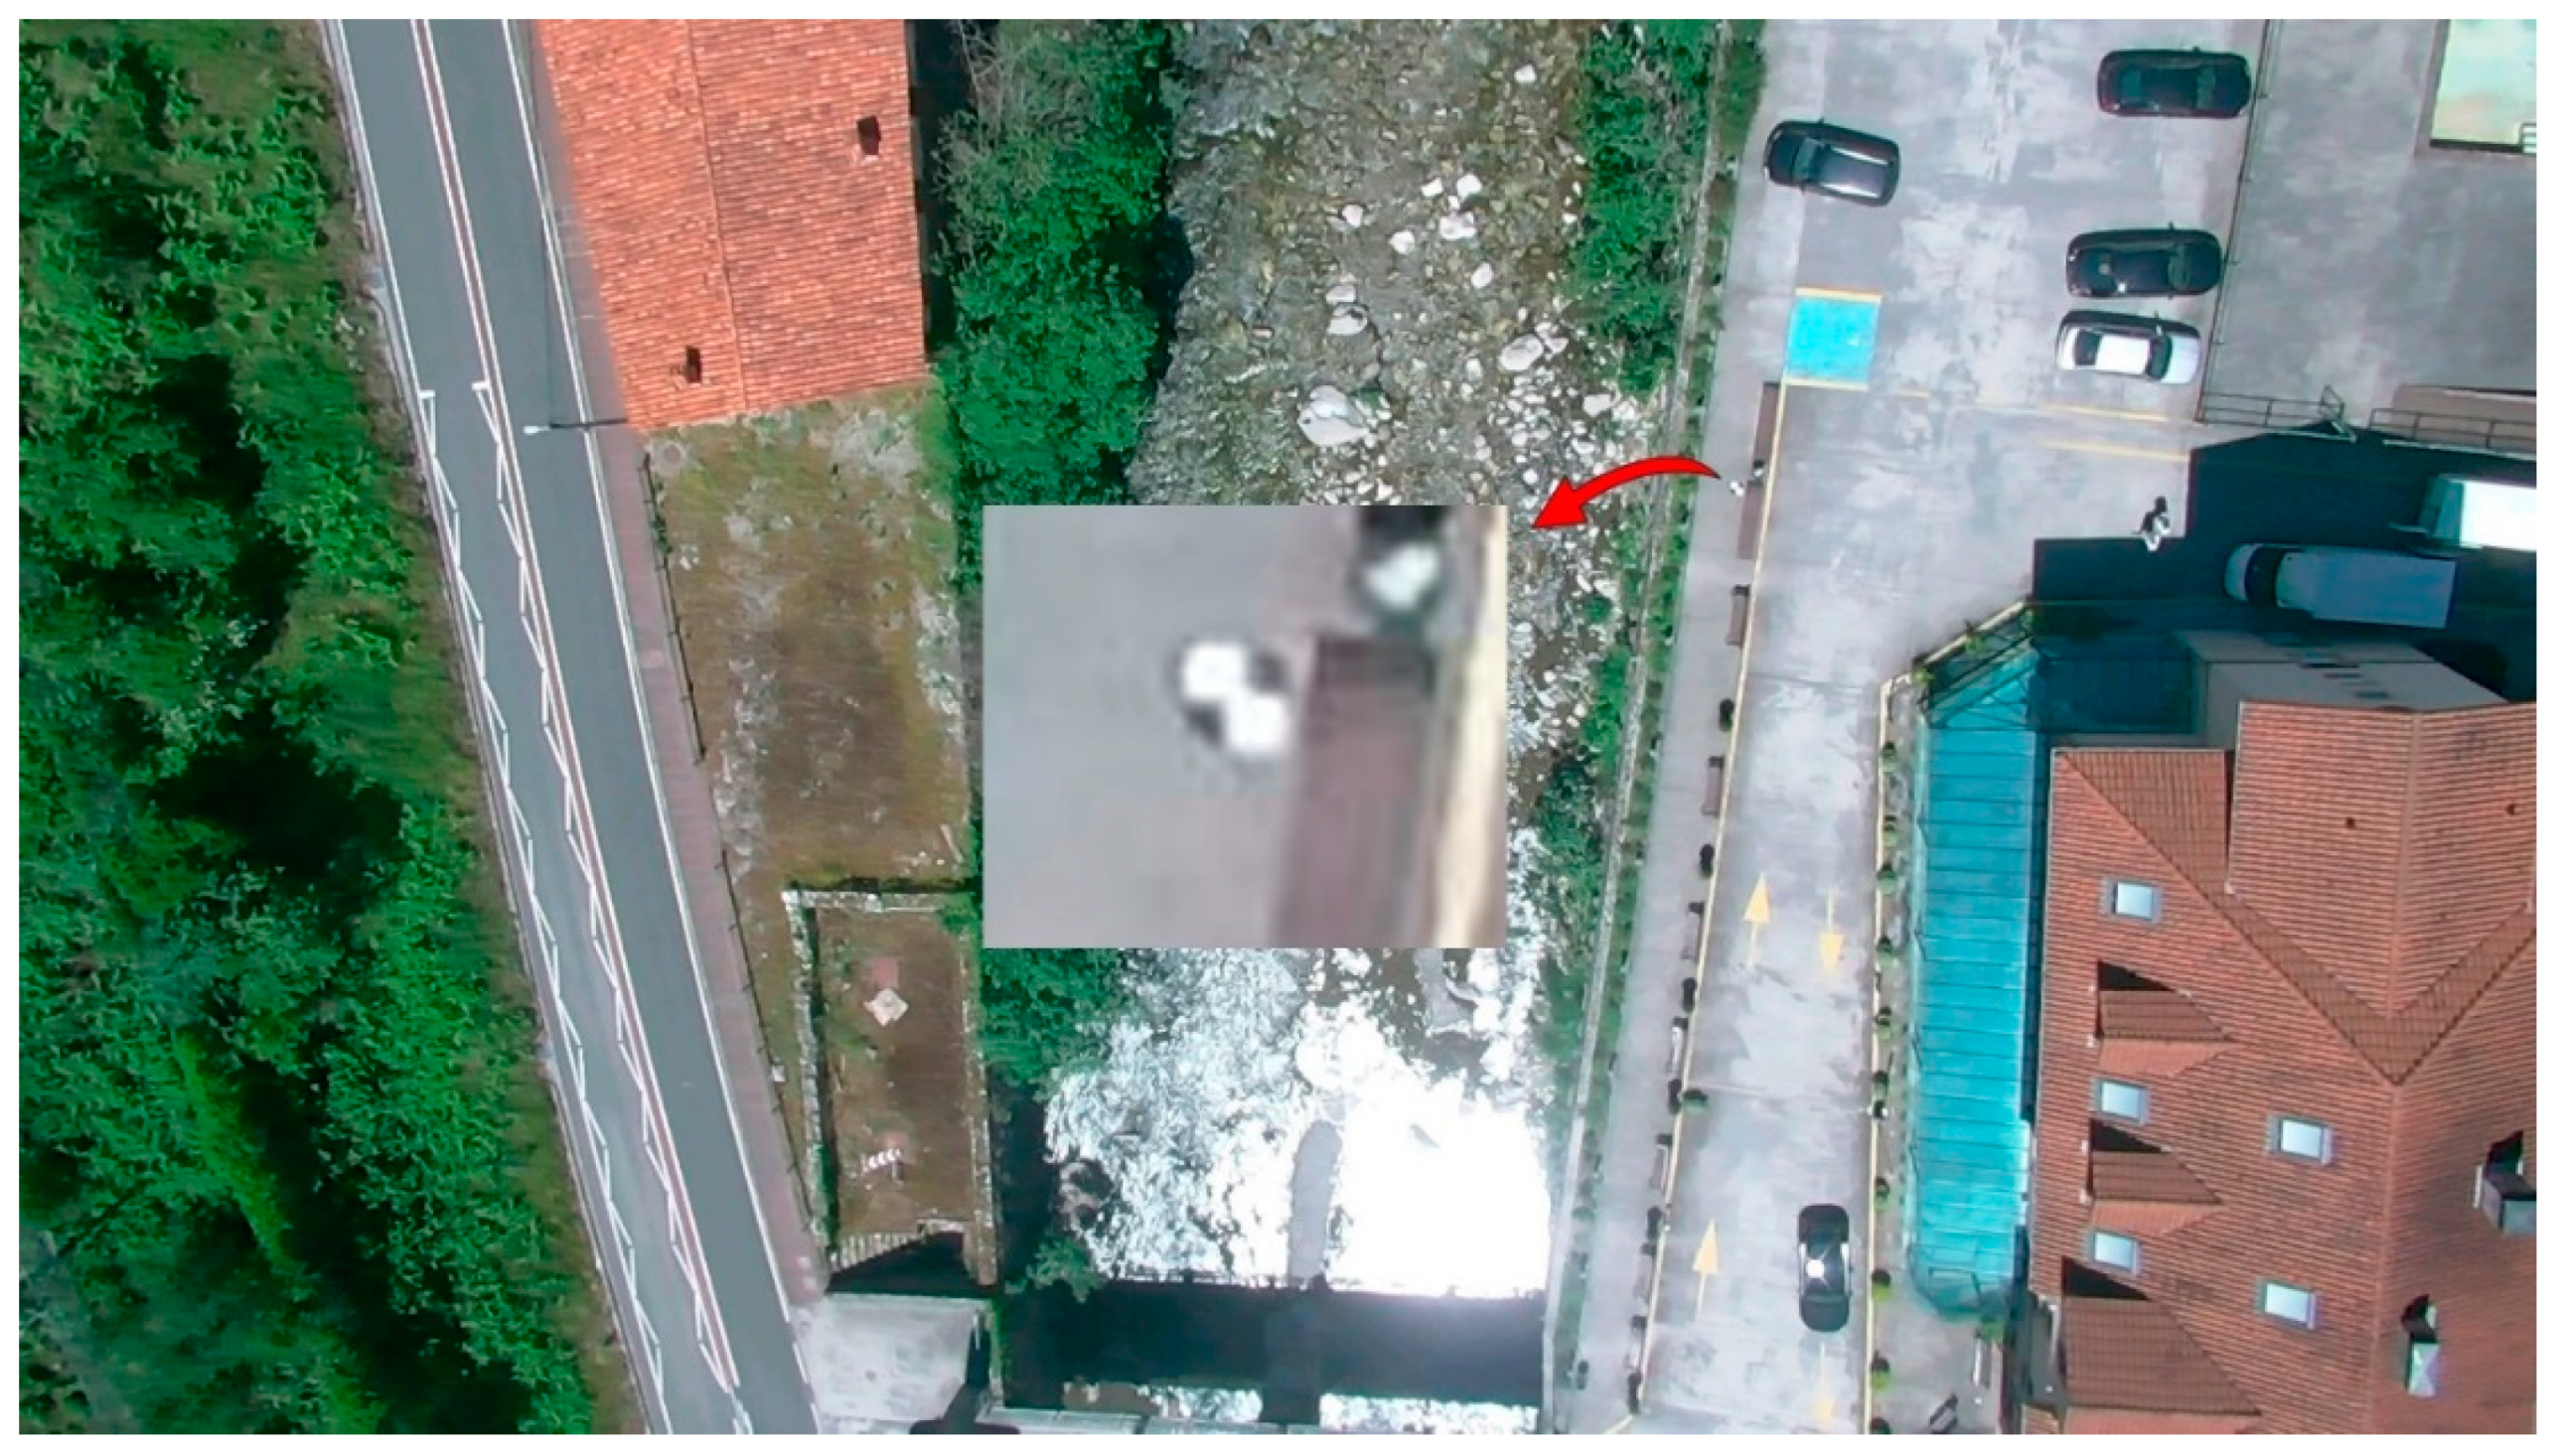
3.2. RGB and TIR Photogrammetry
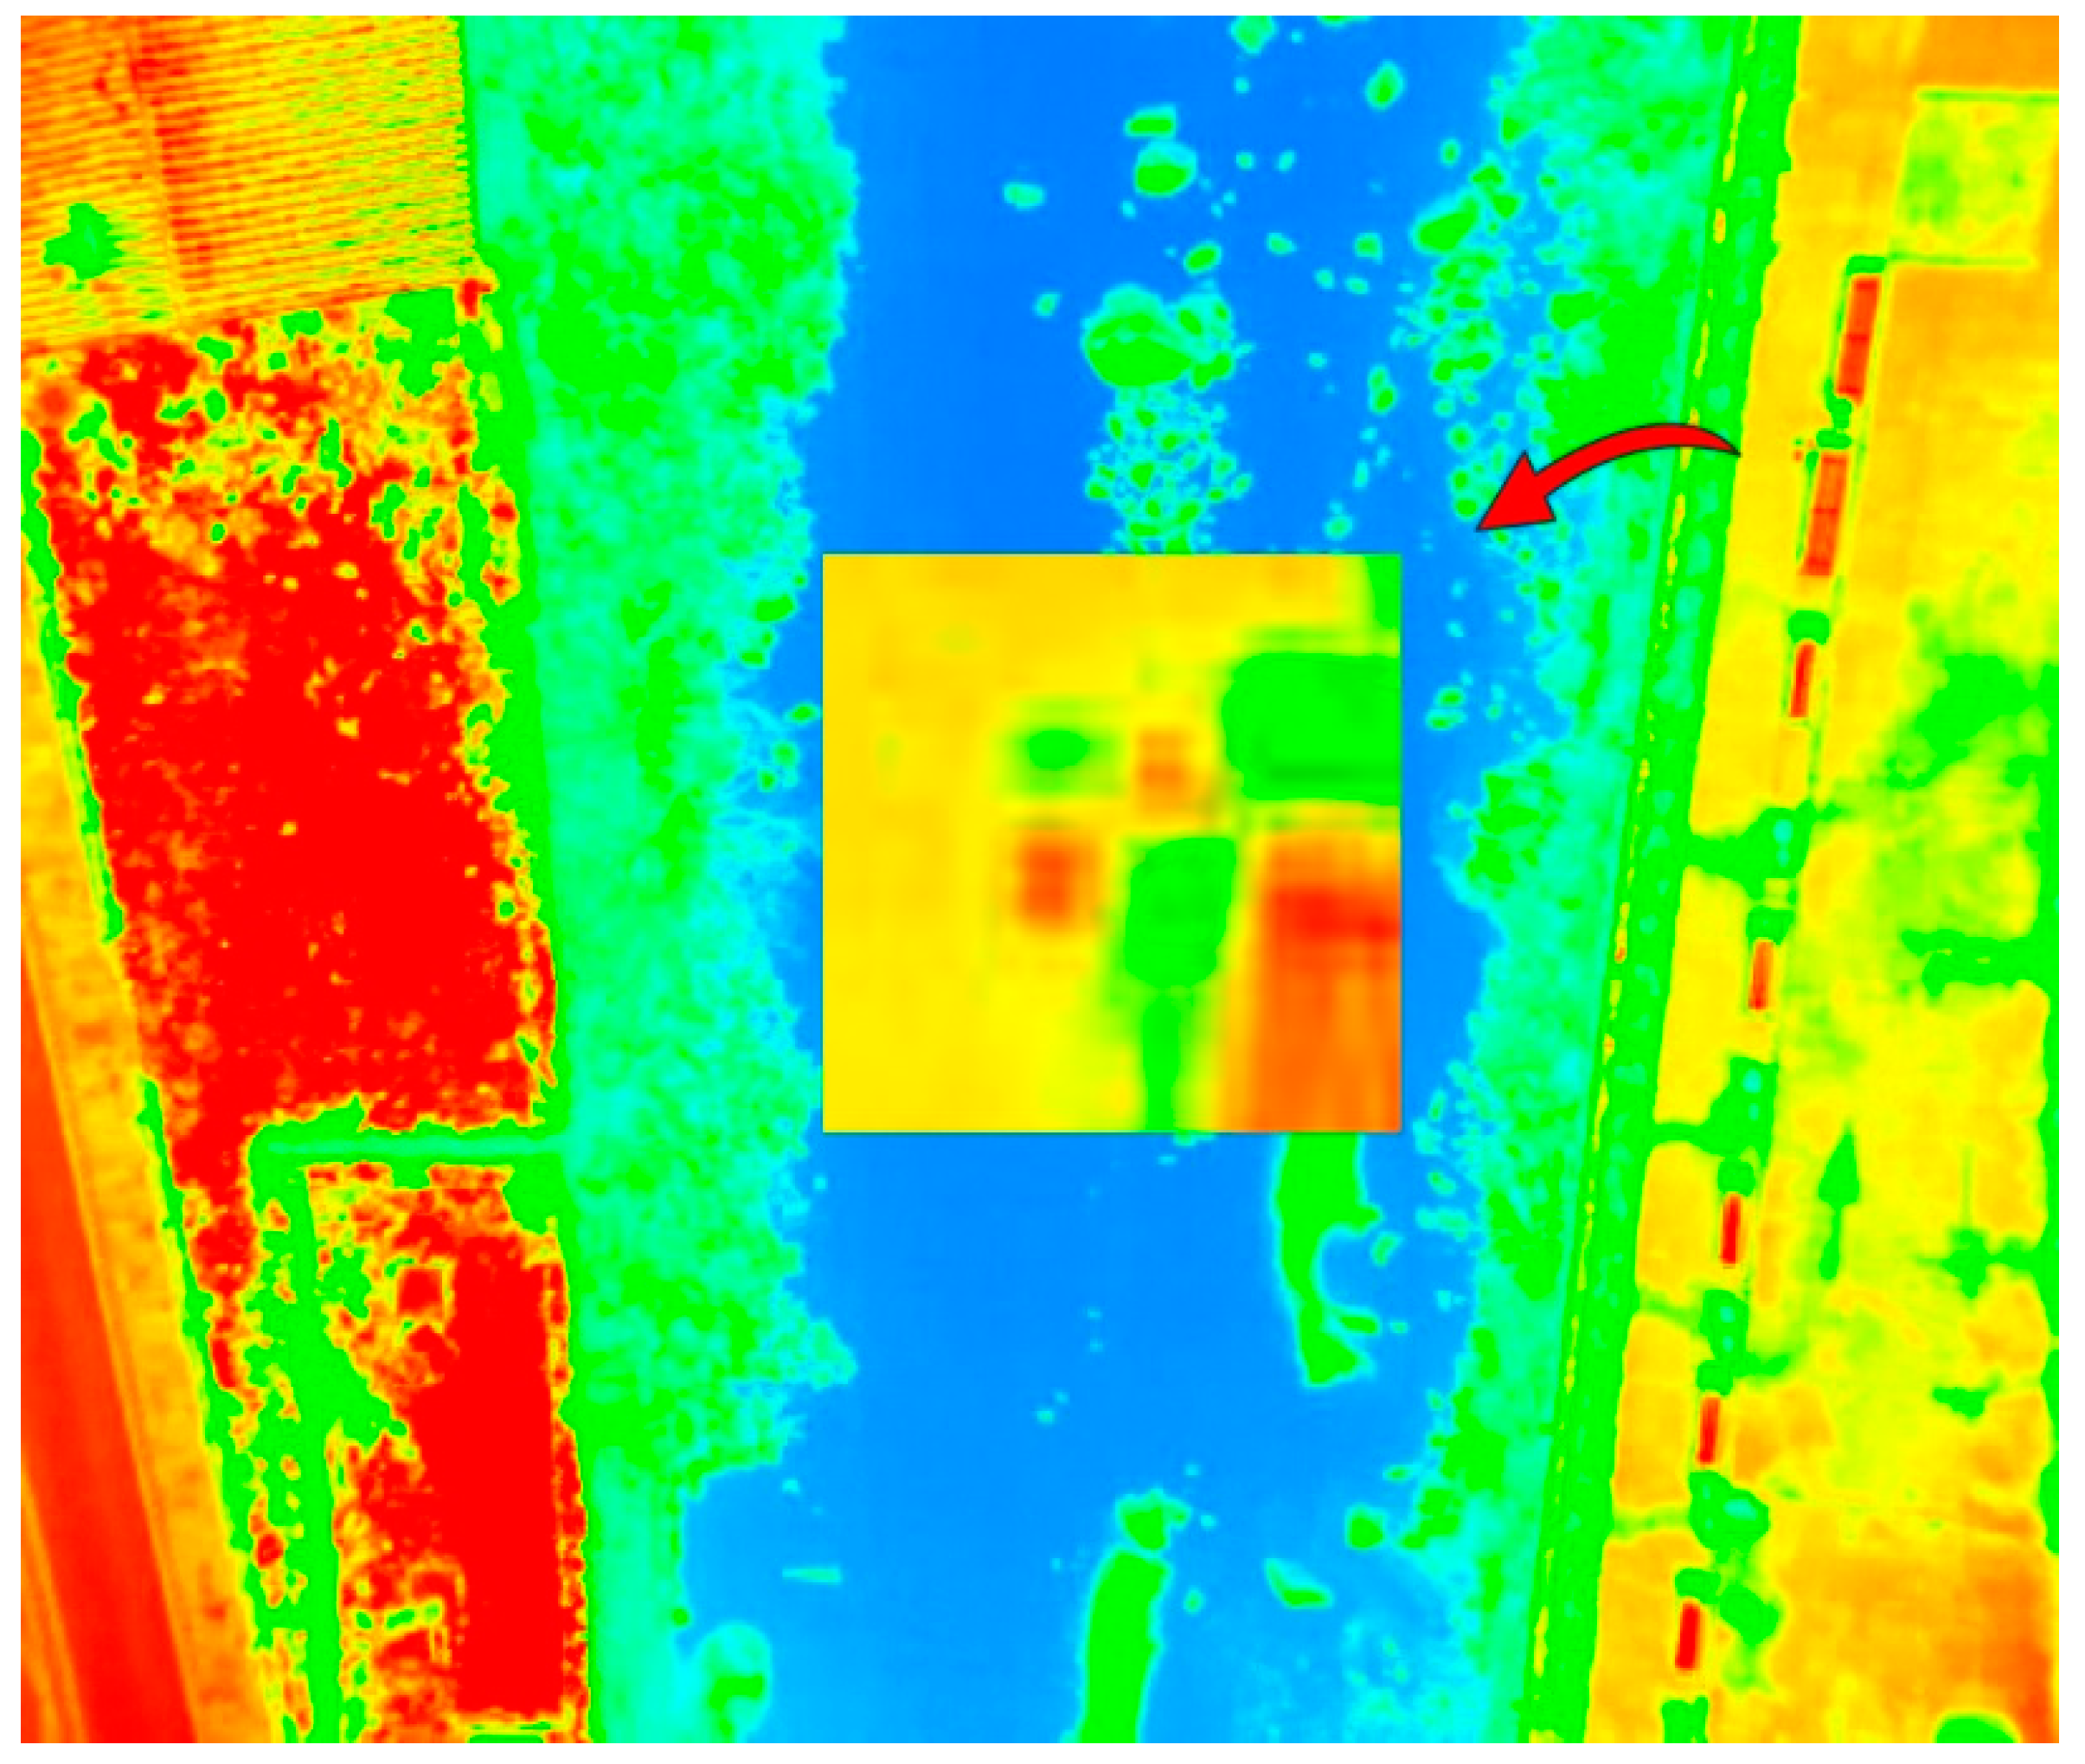
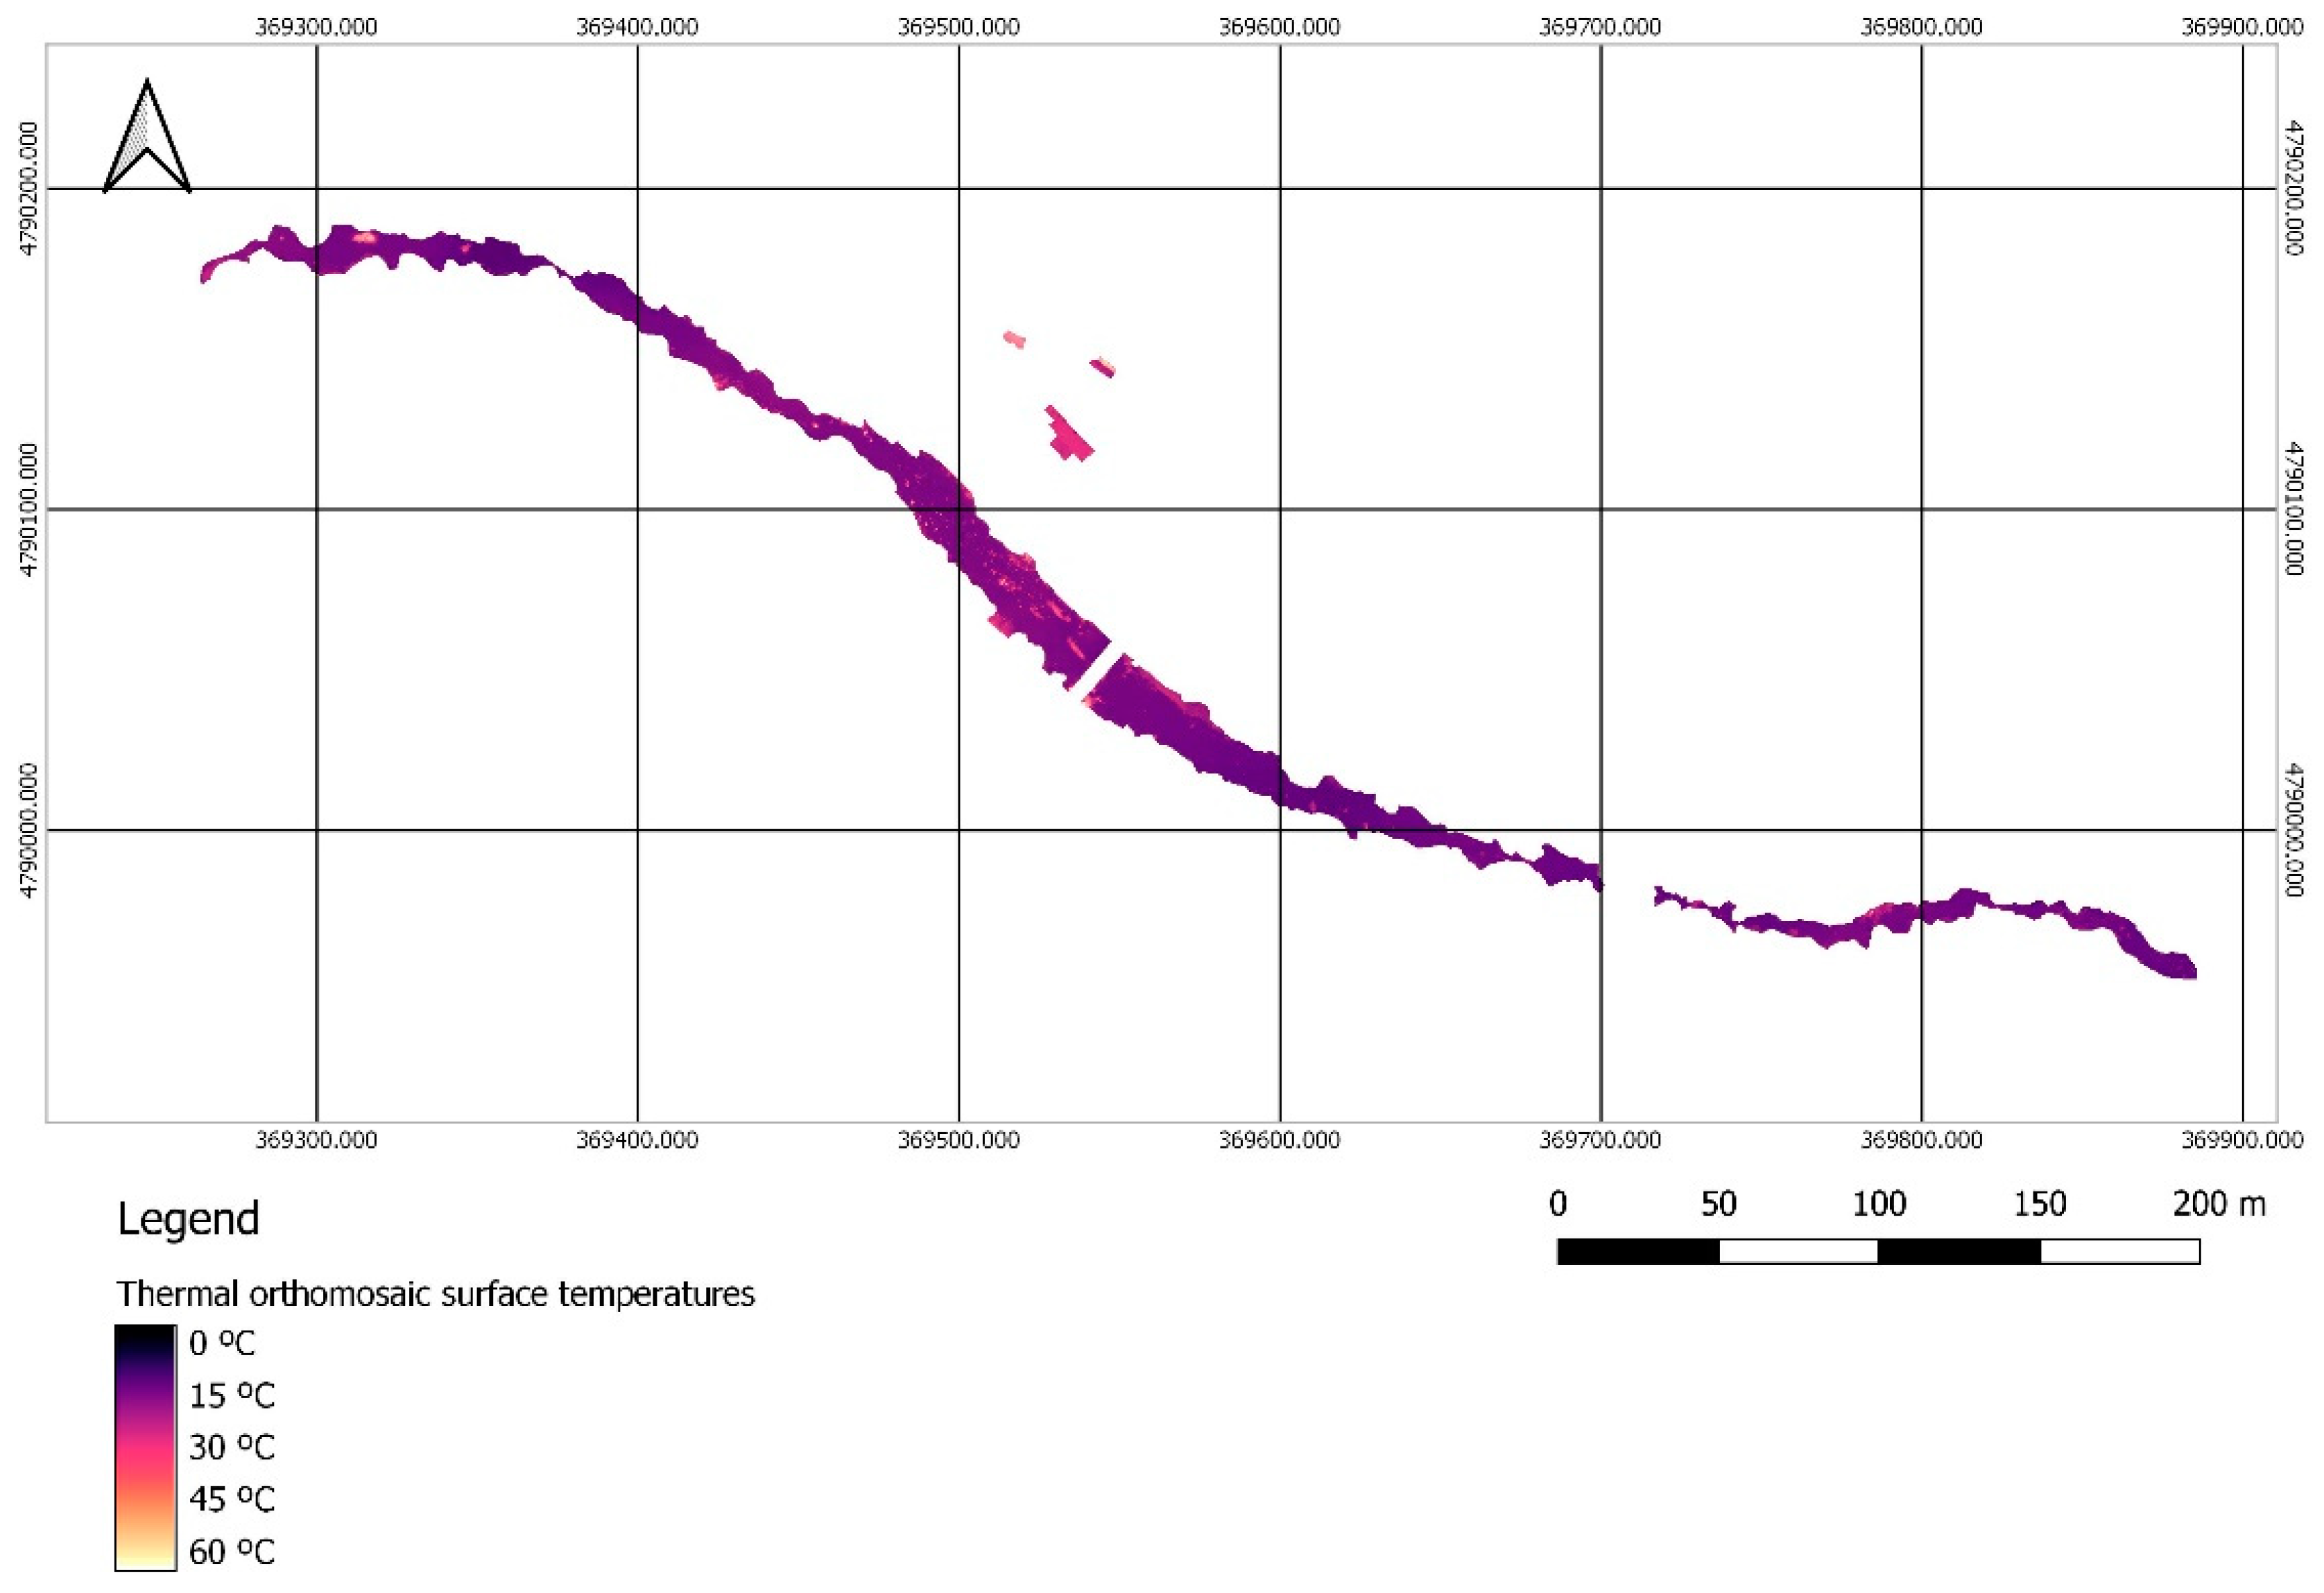
3.3. Thermal Orthomosaic Calibration
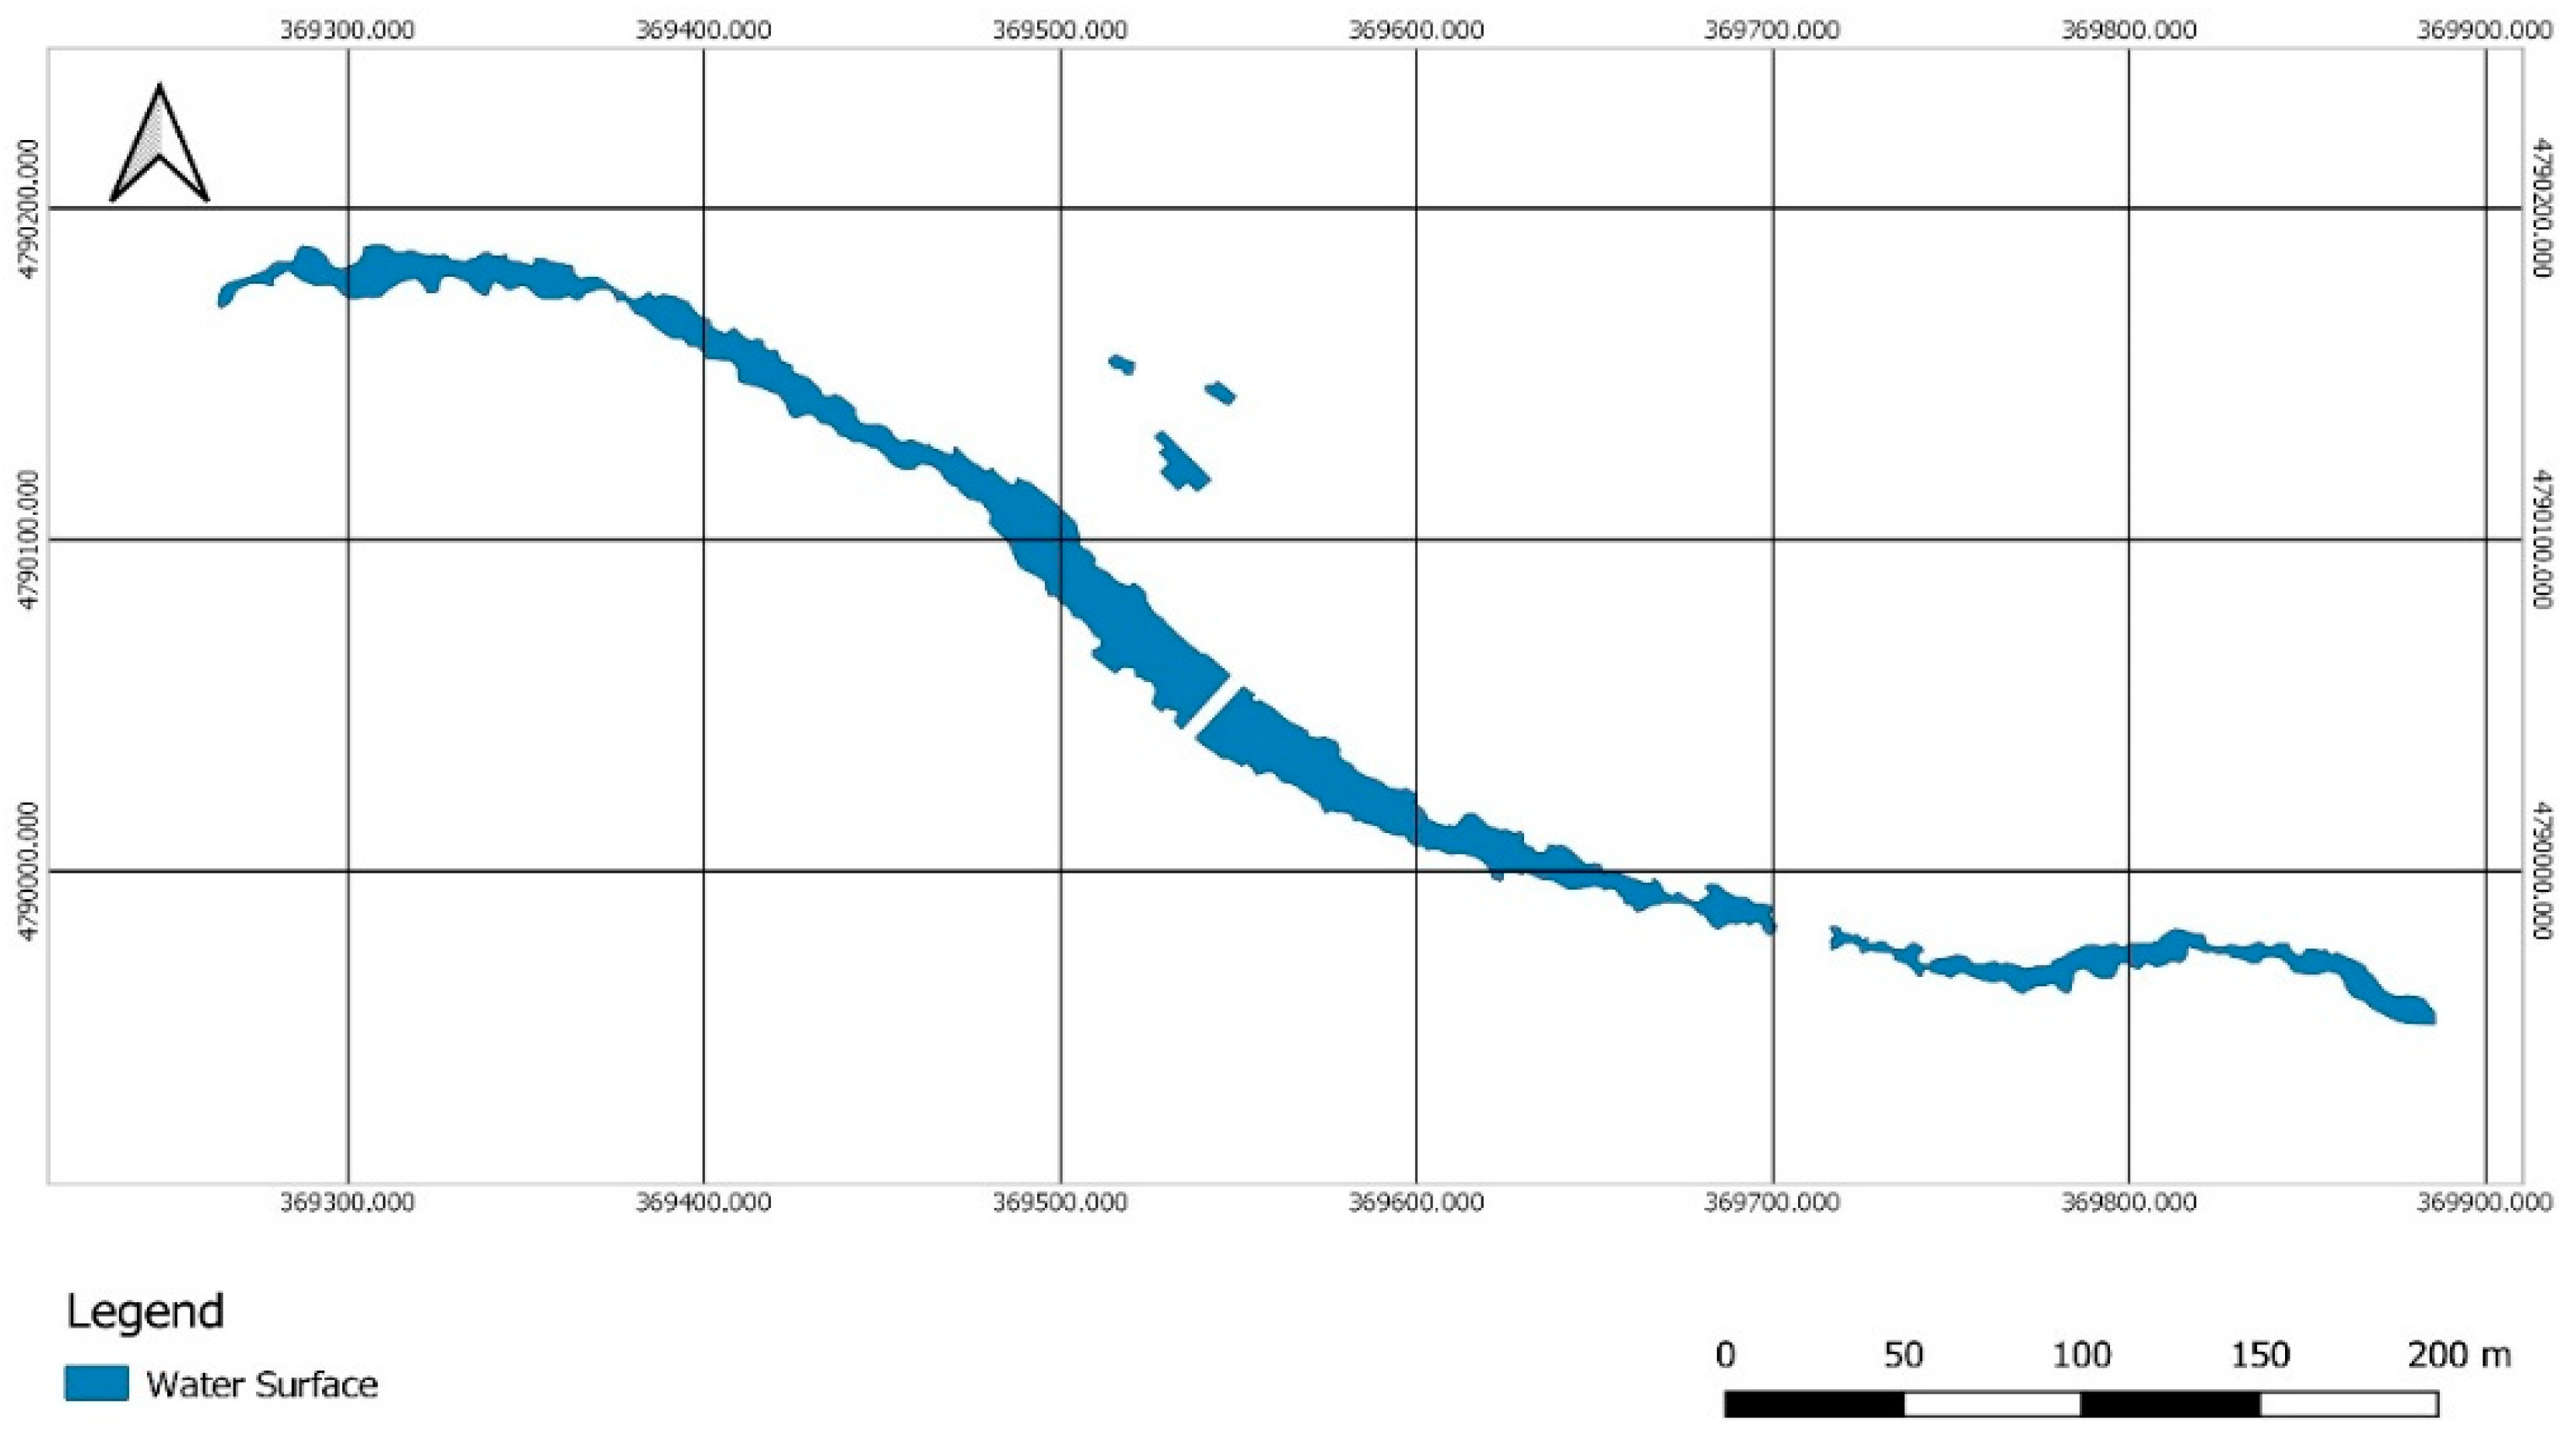
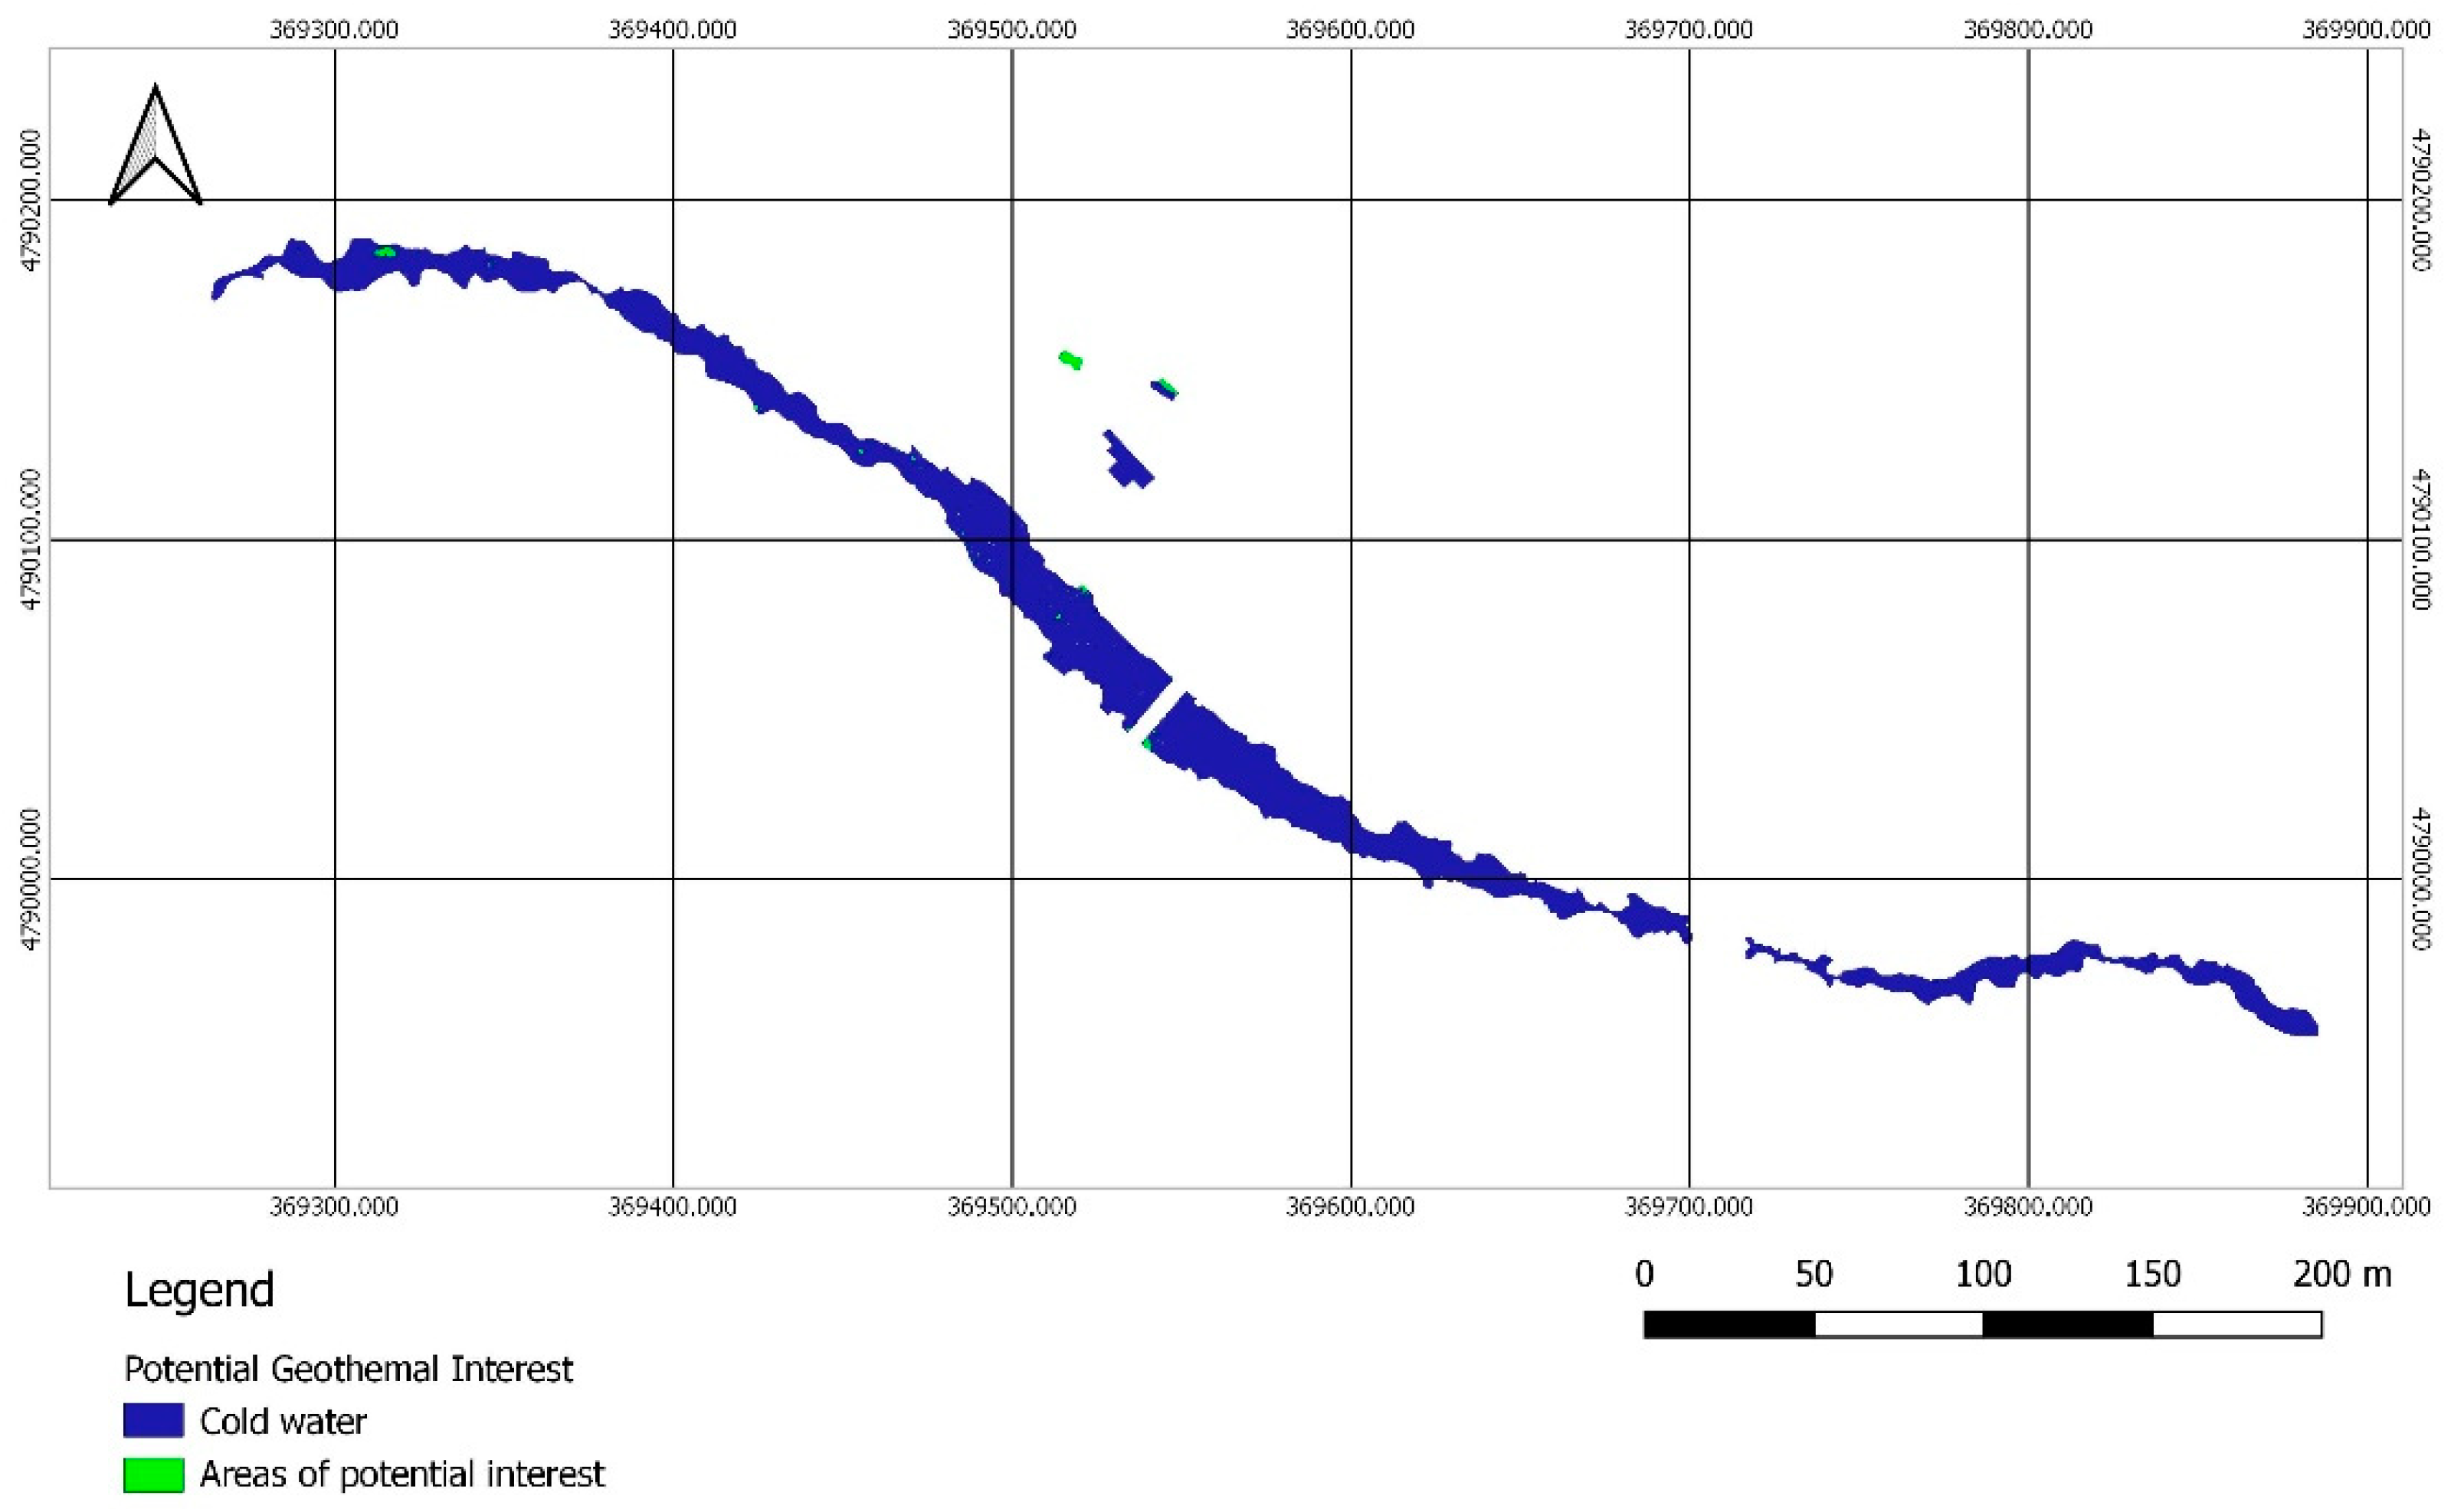
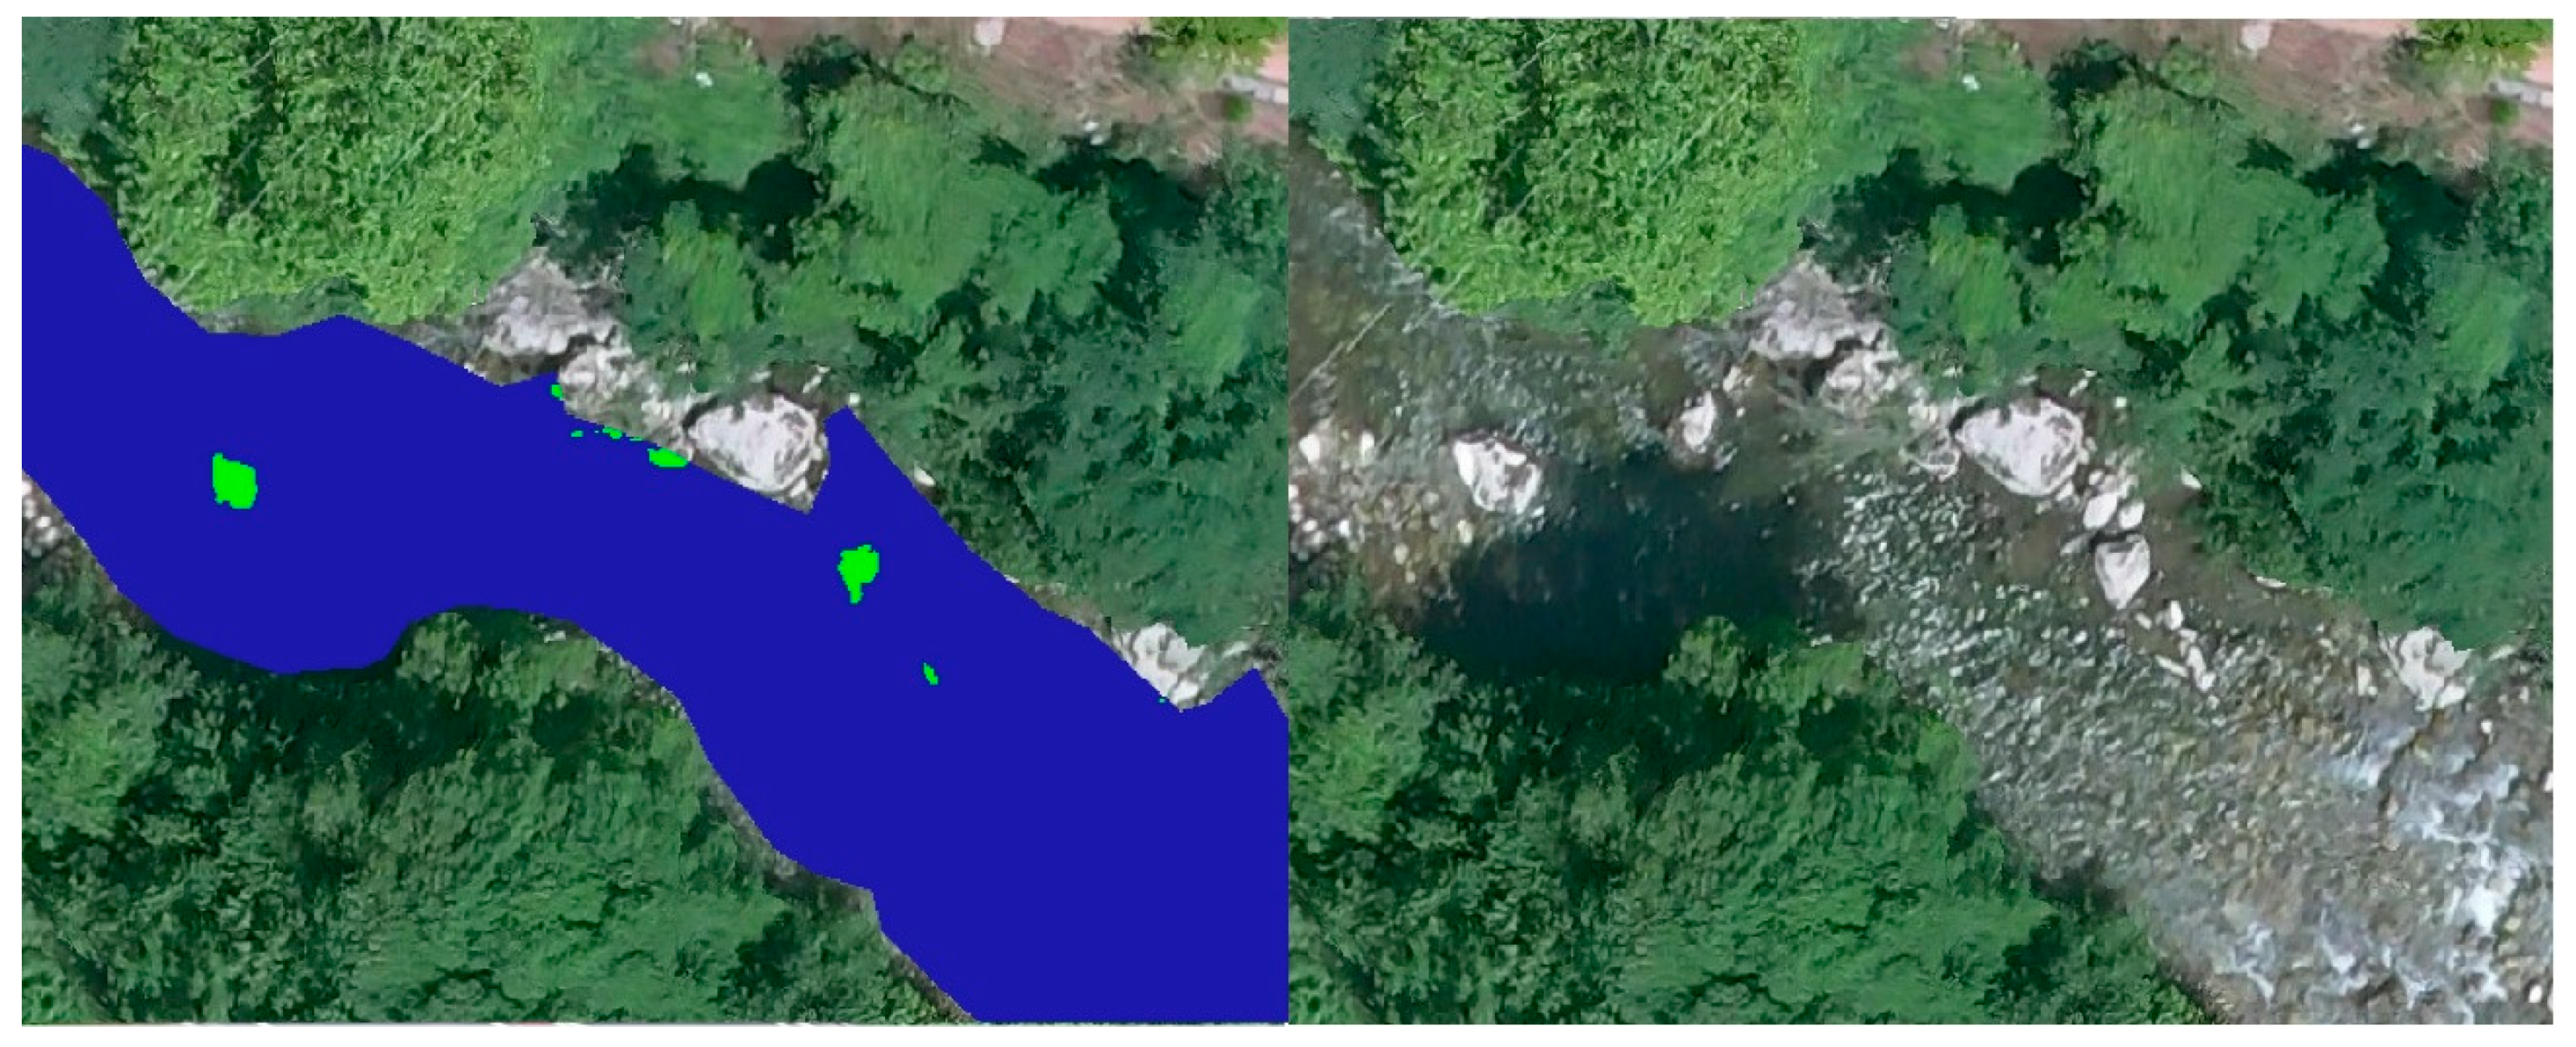
3.4. GIS Analysis
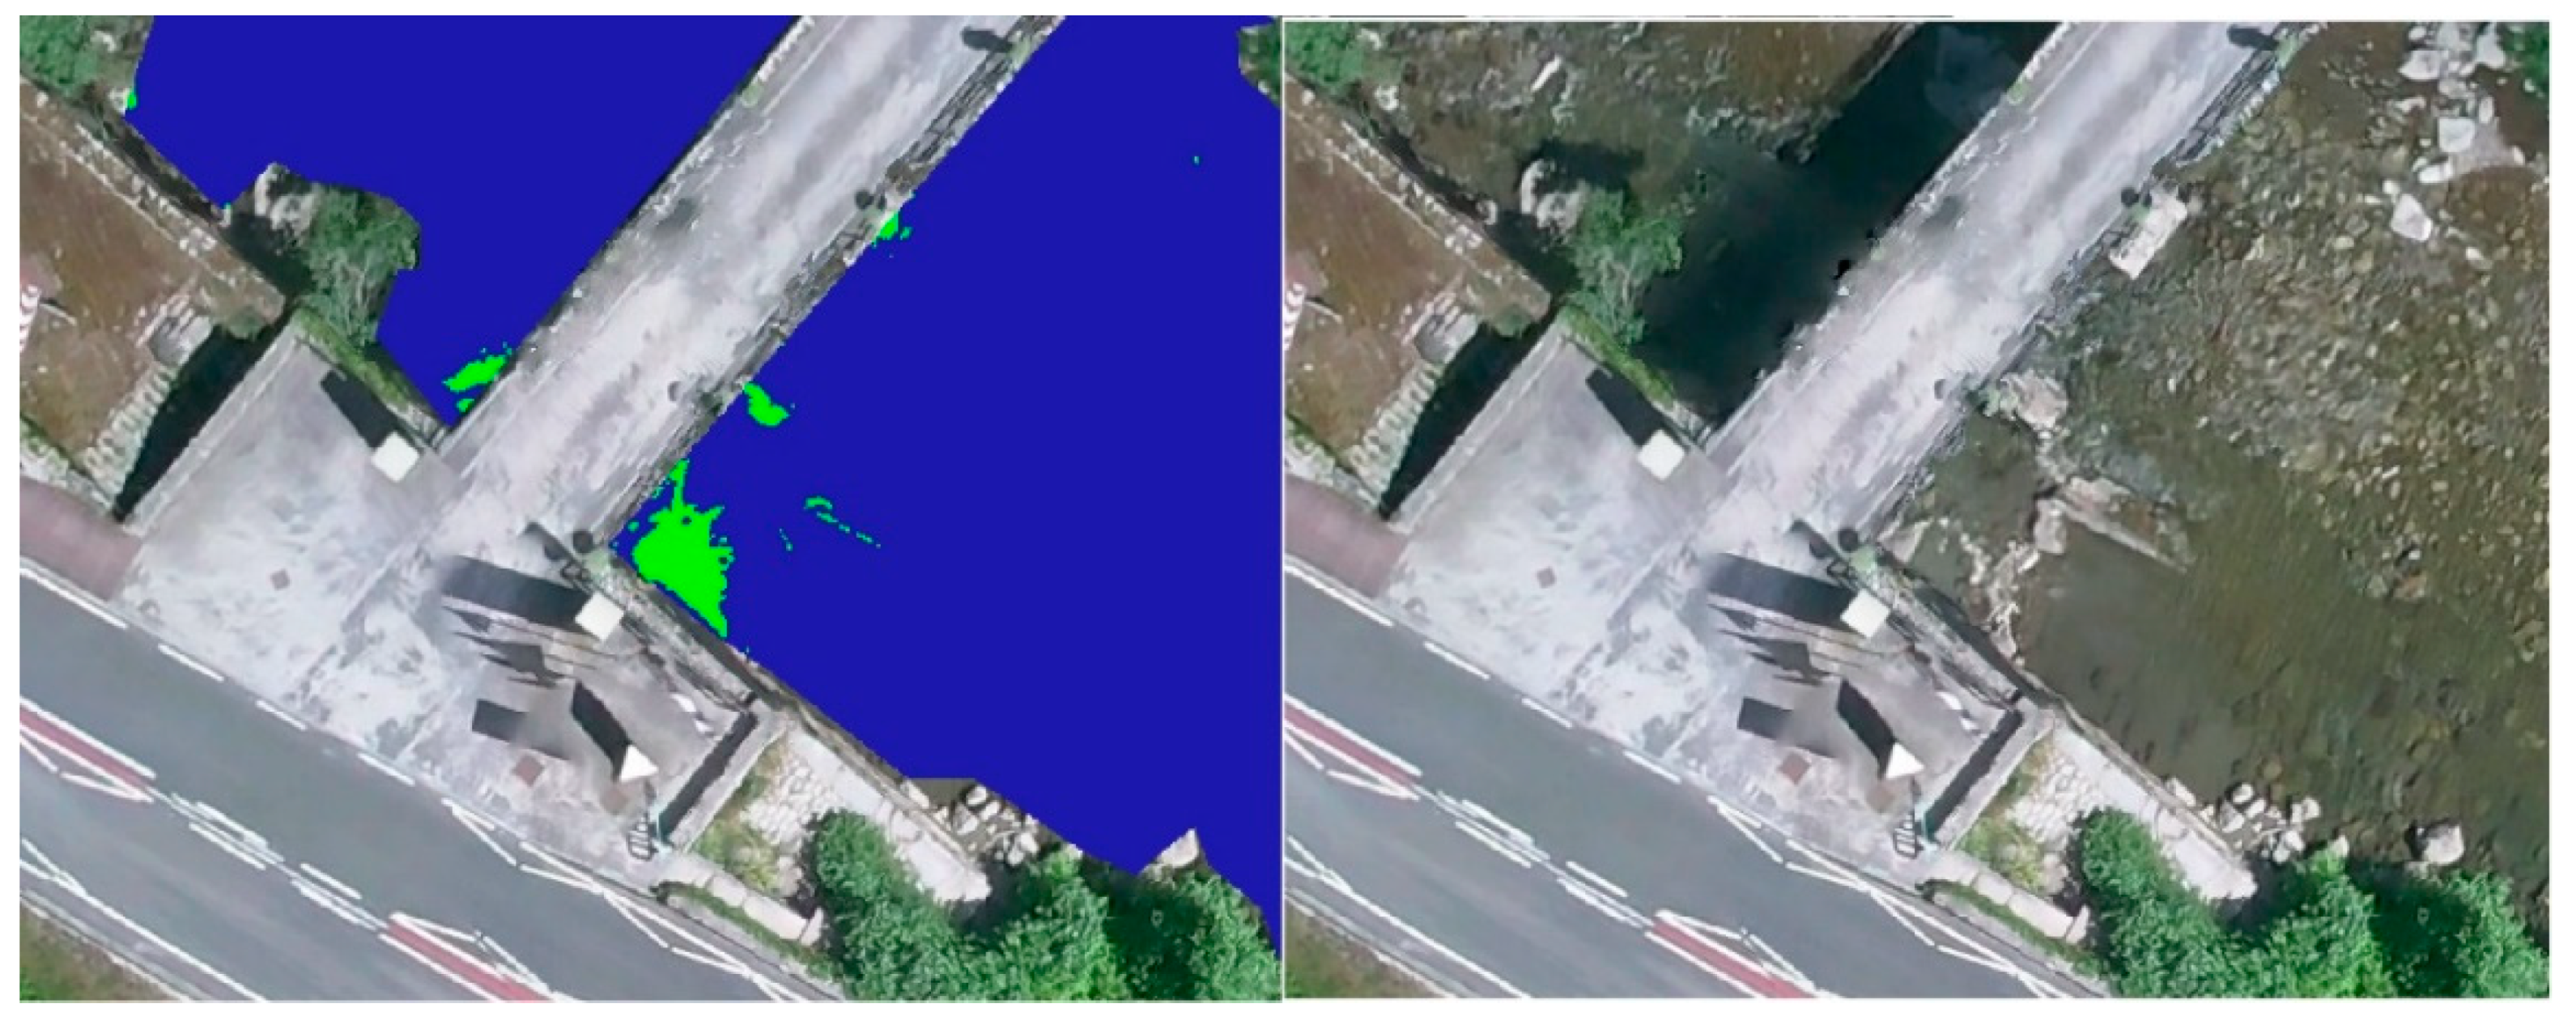
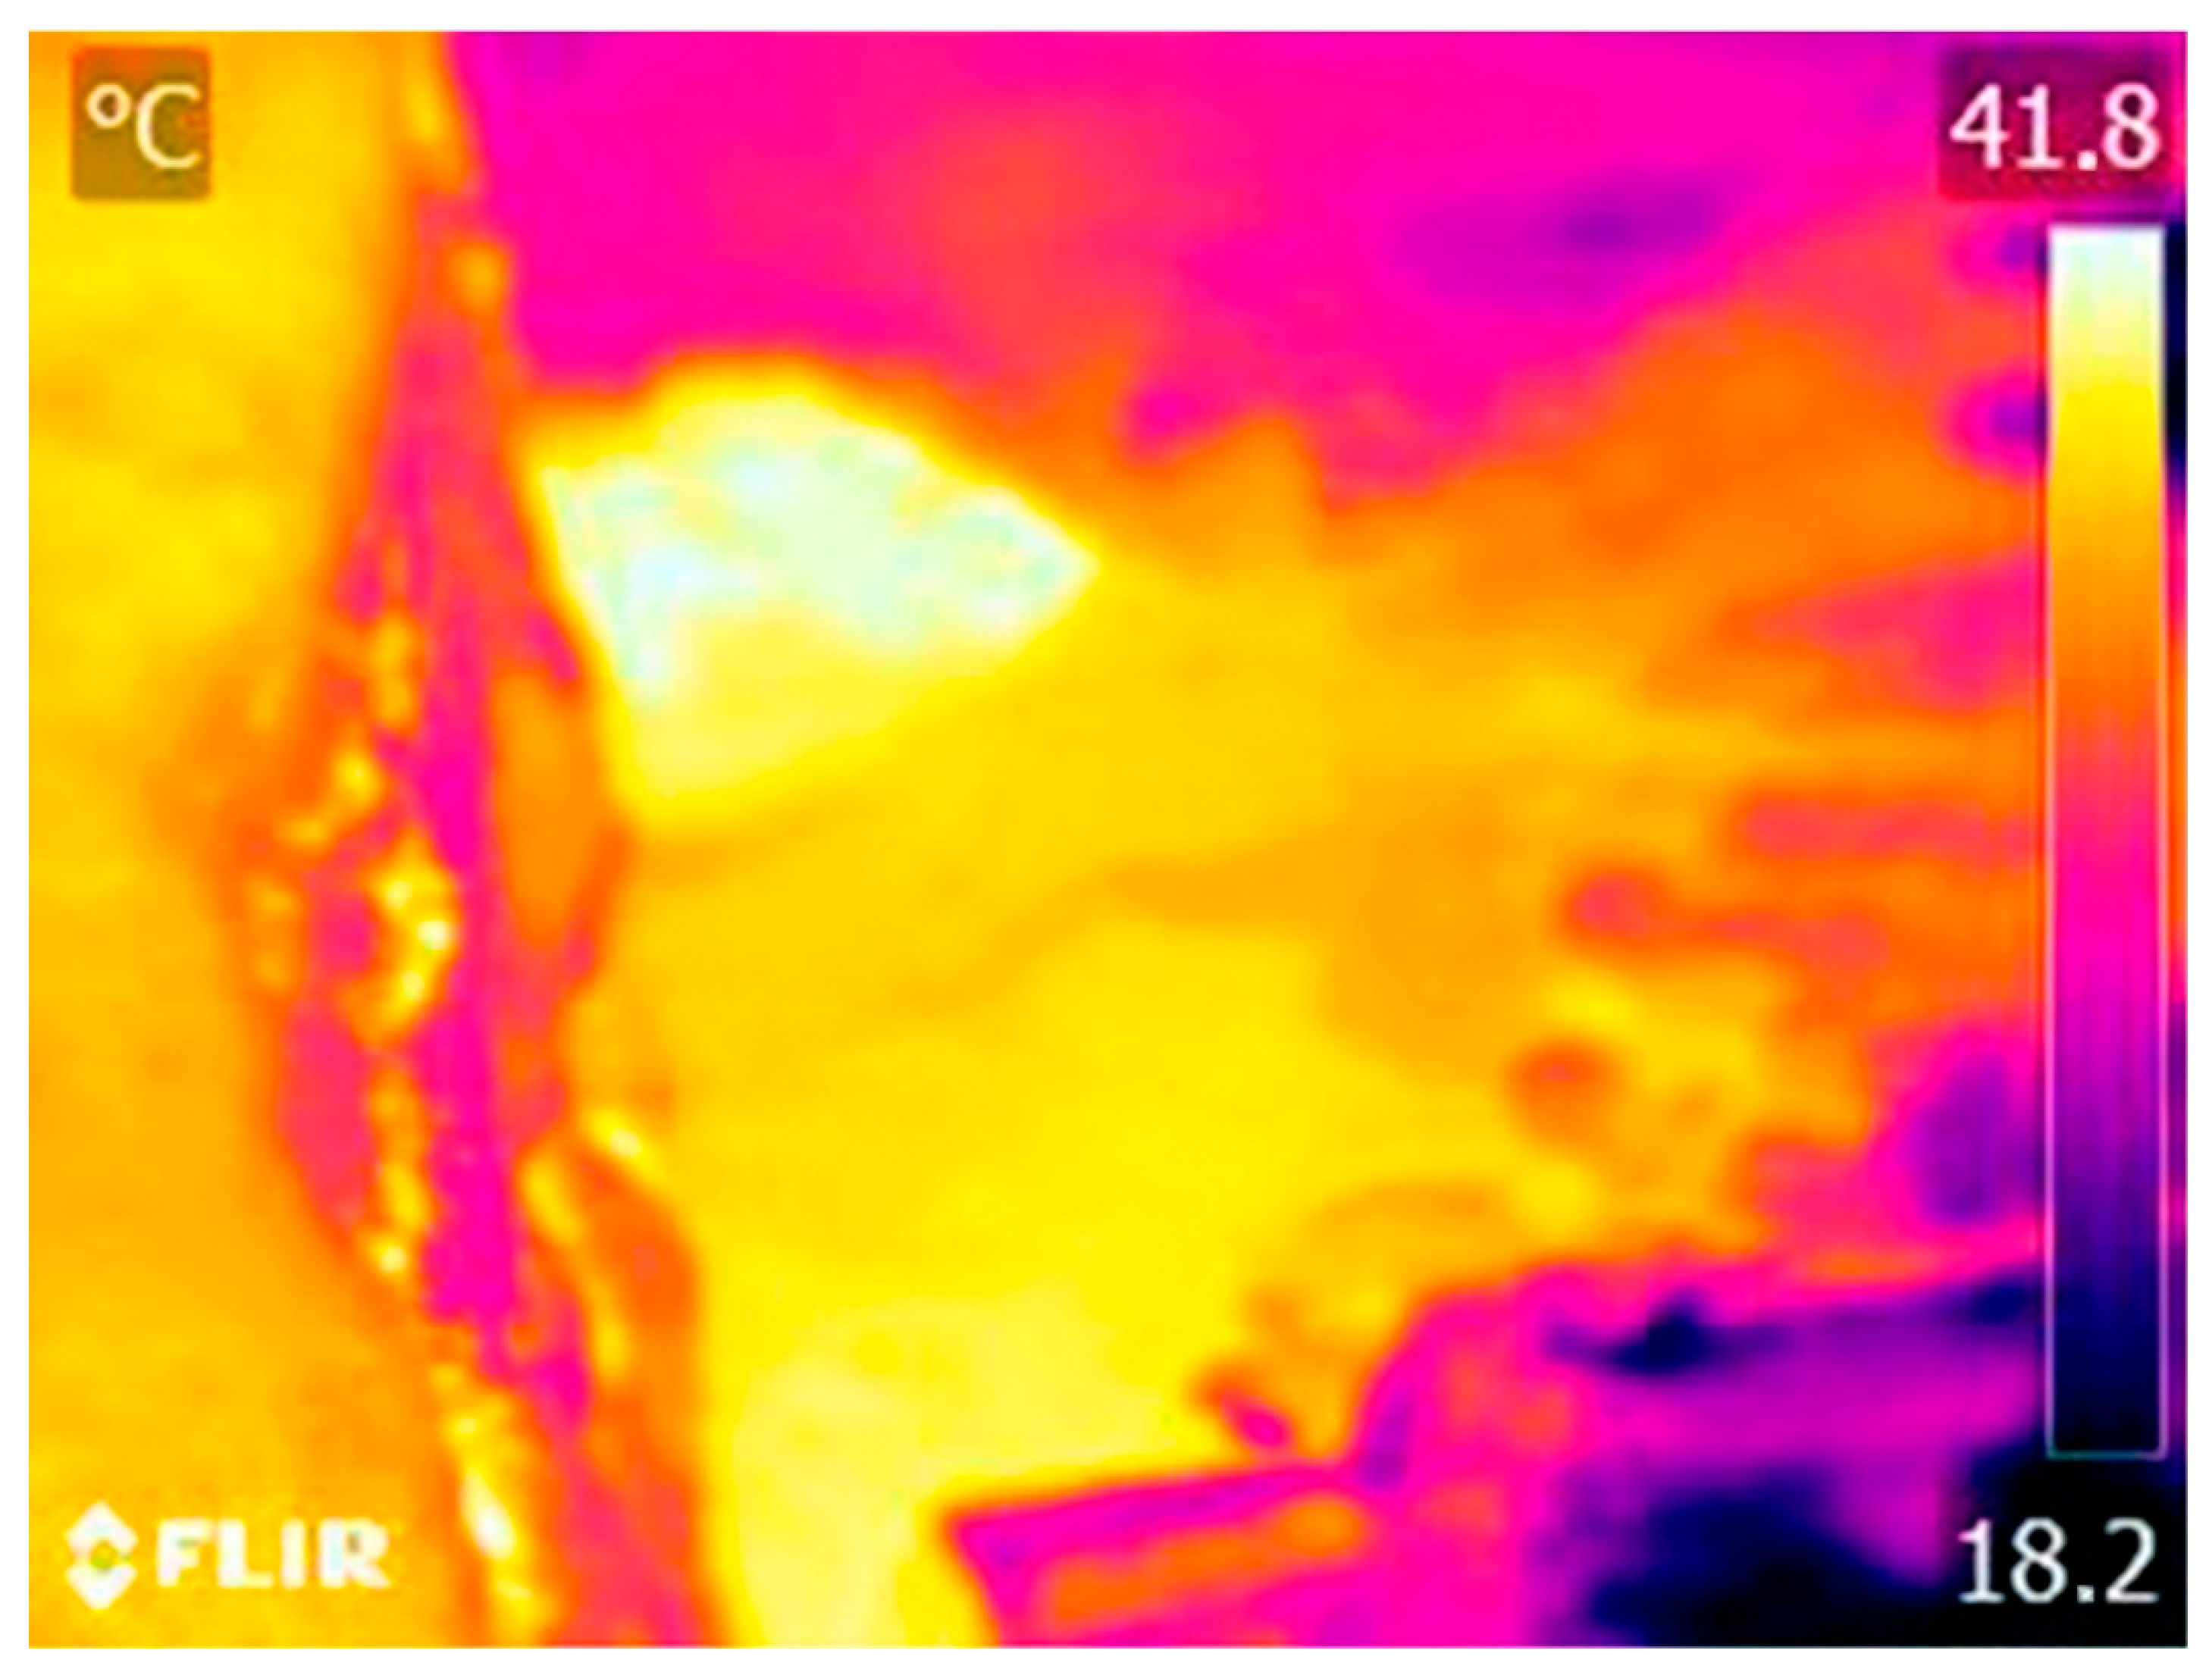
3.5. Validation of Results
4. Discussion
- Flight planning is fundamental, not only in terms of flight parameters, but also with respect to the date of the activities. On the one hand, the possible vegetation present in the area must be considered. Therefore, flights in autumn, when the trees are leafless, can favor the capture of images by eliminating the foliage, as well as a better photointerpretation of the result. In addition, the flow of the river must be considered, as an excessive amount of water can camouflage the thermal effluent, and its absence could lead to its interpretation as a free-of-water-surface area. Both circumstances would not allow its identification, which implies that a medium flow may be the best alternative.
- The design of the flight plan must be done in a more thorough way than in the case of RGB-only flights. This observation must be taken into account in order to avoid later processing problems due to the lower resolution and contrast of the TIR images. In addition, the correct configuration of the sensor must be considered, establishing the appropriate emissivity or ambient temperature parameters, as well as a correct storage format of the TIR images data, in order to obtain the surface temperature information that allows getting an adequate result.
- The workflow based on the complementary processing of both blocks of analog images allows to obtain a high-quality representation of the study area, despite the lower resolution of the thermal sensor, which is only used for the projection of the temperature distribution information.
- The measurements of the thermal sensor of the dual device show a large average difference of 3.506 °C with respect to the measurements of the rest of the equipment applied. In spite of establishing the same configuration as in the handheld camera and having a stabilization period prior to the start of the flight, the UAV always measured lower temperatures. This condition implies the need to use temperature calibration points during the flight in order to reduce the error in the final result.
- The photointerpretation of images for the first identification of water sheet surfaces is a process that can be time consuming. Therefore, the implementation of automatic or quasi-automatic recognition techniques can speed up and simplify the overall process.
- GIS tools allow various operations, such as the analysis and management of photogrammetric products obtained for the identification of hydrothermal resources. The use of this type of photograms facilitates the photointerpretation and visualization of the data obtained, allowing the evaluation of the result. It is a tool with great potential that can provide a greater simplicity to the proposed methodology if the ways to automate some of the tasks performed are investigated.
- The proposed methodology does not involve actions of great complexity. Although it simplifies the process with respect to traditional techniques, providing a solution with lower economic and time costs, it requires a second field visit to evaluate and verify the results obtained.
- Considering the application of the methodology to the case study, it allows the identification of a thermal anomaly in the water bodies present in the area. This methodology measures the water temperature at an isolated moment when the photogrammetric flight is performed. Therefore, it would be necessary to carry out field trips throughout the year to assess the conformity of the temperatures to the specifications set by current legislation.
5. Conclusions
Author Contributions
Funding
Institutional Review Board Statement
Informed Consent Statement
Data Availability Statement
Acknowledgments
Conflicts of Interest
References
- Vélez-Nicolás, M.; García-López, S.; Barbero, L.; Ruiz-Ortiz, V.; Sánchez-Bellón, Á. Applications of Unmanned Aerial Systems (UASs) in Hydrology: A Review. Remote Sens. 2021, 13, 1359. [Google Scholar] [CrossRef]
- Koparan, C.; Koc, A.B.; Privette, C.V.; Sawyer, C.B. In Situ Water Quality Measurements Using an Unmanned Aerial Vehicle (UAV) System. Water 2018, 10, 264. [Google Scholar] [CrossRef]
- Koparan, C.; Koc, A.B.; Privette, C.V.; Sawyer, C.B.; Sharp, J.L. Evaluation of a UAV-Assisted Autonomous Water Sampling. Water 2018, 10, 655. [Google Scholar] [CrossRef]
- Iezzi, F.; Todisco, M.T. Stream Temperature Estimated in Situ from Thermal-Infrared Images: Best Estimate and Uncertainty. J. Phys. Conf. Ser. 2015, 655, 012063. [Google Scholar] [CrossRef]
- Kiavarz, M.; Jelokhani-Niaraki, M. Geothermal Prospectivity Mapping Using GIS-Based Ordered Weighted Averaging Approach: A Case Study in Japan’s Akita and Iwate Provinces. Geothermics 2017, 70, 295–304. [Google Scholar] [CrossRef]
- Idroes, R.; Yanis, M.; Idroes, G.M. Syahriza A Low-Cost Uav Based Application for Identify and Mapping a Geothermal Feature in Ie Jue Manifestation, Seulawah Volcano, Indonesia. Int. J. GEOMATE 2021, 20, 135–142. [Google Scholar] [CrossRef]
- Idrus Alhamid, M.; Daud, Y.; Surachman, A.; Sugiyono, A.; Aditya, H.B.; Mahlia, T.M.I. Potential of Geothermal Energy for Electricity Generation in Indonesia: A Review. Renew. Sustain. Energy Rev. 2016, 53, 733–740. [Google Scholar] [CrossRef]
- Wang, H.; Liu, H.; Chen, D.; Wu, H.; Jin, X. Thermal Response of the Fractured Hot Dry Rocks with Thermal-Hydro-Mechanical Coupling Effects. Geothermics 2022, 104, 102464. [Google Scholar] [CrossRef]
- Zuffi, C.; Manfrida, G.; Asdrubali, F.; Talluri, L. Life Cycle Assessment of Geothermal Power Plants: A Comparison with Other Energy Conversion Technologies. Geothermics 2022, 104, 102434. [Google Scholar] [CrossRef]
- Puy-Alquiza, M.J.; Luna, B.N.; Aguilera, G.C.; Miranda-Aviles, R.; Kshirsagar, P.V.; Zanor, G.A. The Hydrothermal Resources of Medium and Low Enthalpy in the Diversification of Primary Sources of Energy and Biotechnology Applications: A Case Study at the San Bartolome de Los Baños Geothermal Zone, Guanajuato, Mexico. Geothermics 2022, 104, 102458. [Google Scholar] [CrossRef]
- Lee, K.C. Classification of Geothermal Resources by Exergy. Geothermics 2001, 30, 431–442. [Google Scholar] [CrossRef]
- Favier, A.; Lardeaux, J.M.; Corsini, M.; Verati, C.; Navelot, V.; Géraud, Y.; Diraison, M.; Ventalon, S.; Voitus, E. Characterization of an Exhumed High-Temperature Hydrothermal System and Its Application for Deep Geothermal Exploration: An Example from Terre-de-Haut Island (Guadeloupe Archipelago, Lesser Antilles Volcanic Arc). J. Volcanol. Geotherm. Res. 2021, 418, 107256. [Google Scholar] [CrossRef]
- Reath, K.A.; Ramsey, M.S. Exploration of Geothermal Systems Using Hyperspectral Thermal Infrared Remote Sensing. J. Volcanol. Geotherm. Res. 2013, 265, 27–38. [Google Scholar] [CrossRef]
- Glaser, B.; Antonelli, M.; Chini, M.; Pfister, L.; Klaus, J. Technical Note: Mapping Surface-Saturation Dynamics with Thermal Infrared Imagery. Hydrol. Earth Syst. Sci. 2018, 22, 5987–6003. [Google Scholar] [CrossRef]
- Wan, Q.; Brede, B.; Smigaj, M.; Kooistra, L. Factors Influencing Temperature Measurements from Miniaturized Thermal Infrared (Tir) Cameras: A Laboratory-Based Approach. Sensors 2021, 21, 8466. [Google Scholar] [CrossRef] [PubMed]
- Lai, C.; Liu, J.; Hsu, W.; Li, K.; Wu, M.; Chang, K. An experiment of geothermal exploration with an UAS-TIR in Xiaoyoukeng area of Tatun volcanoes, Taiwan. In Proceedings of the GARSS 2018-2018 IEEE International Geoscience and Remote Sensing Symposium, Valencia, Spain, 22–27 July 2018; pp. 7886–7889. [Google Scholar]
- Kim, D.; Yu, J.; Yoon, J.; Jeon, S.; Son, S. Comparison of Accuracy of Surface Temperature Images from Unmanned Aerial Vehicle and Satellite for Precise Thermal Environment Monitoring of Urban Parks Using in Situ Data. Remote Sens. 2021, 13, 1977. [Google Scholar] [CrossRef]
- Vinícius Yodono Garcia, M.; Cândido de Oliveira, H. The Influence of Flight Configuration, Camera Calibration, and Ground Control Points for Digital Terrain Model and Orthomosaic Generation Using Unmanned Aerial Vehicles Imagery. Bol. Cienc. Geod. 2021, 27, 1–18. [Google Scholar] [CrossRef]
- Chen, S.; Laefer, D.F.; Mangina, E.; Zolanvari, S.M.I.; Byrne, J. UAV Bridge Inspection through Evaluated 3D Reconstructions. J. Bridg. Eng. 2019, 24, 05019001. [Google Scholar] [CrossRef]
- Tomaštík, J.; Mokroš, M.; Saloš, S.; Chudỳ, F.; Tunák, D. Accuracy of Photogrammetric UAV-Based Point Clouds under Conditions of Partially-Open Forest Canopy. Forests 2017, 8, 151. [Google Scholar] [CrossRef]
- Harvey, M.C.; Hare, D.K.; Hackman, A.; Davenport, G.; Haynes, A.B.; Helton, A.; Lane, J.W.; Briggs, M.A. Evaluation of Stream and Wetland Restoration Using UAS-Based Thermal Infrared Mapping. Water 2019, 11, 1568. [Google Scholar] [CrossRef] [Green Version]
- Lee, E.; Yoon, H.; Hyun, S.P.; Burnett, W.C.; Koh, D.C.; Ha, K.; Kim, D.J.; Kim, Y.; Kang, K.M. Unmanned Aerial Vehicles (UAVs)-Based Thermal Infrared (TIR) Mapping, a Novel Approach to Assess Groundwater Discharge into the Coastal Zone. Limnol. Oceanogr. Methods 2016, 14, 725–735. [Google Scholar] [CrossRef]
- Tymków, P.; Jóźków, G.; Walicka, A.; Karpina, M.; Borkowski, A. Identification of Water Body Extent Based on Remote Sensing Data Collected with Unmanned Aerial Vehicle. Water 2019, 11, 338. [Google Scholar] [CrossRef]
- Harvey, M.C.; Rowland, J.V.; Luketina, K.M. Drone with Thermal Infrared Camera Provides High Resolution Georeferenced Imagery of the Waikite Geothermal Area, New Zealand. J. Volcanol. Geotherm. Res. 2016, 325, 61–69. [Google Scholar] [CrossRef]
- Jensen, A.M.; Neilson, B.T.; McKee, M.; Chen, Y. Thermal Remote Sensing with an Autonomous Unmanned Aerial Remote Sensing Platform for Surface Stream Temperatures. In Proceedings of the 2012 IEEE International Geoscience and Remote Sensing Symposium, Munich, Germany, 22–27 July 2012; pp. 5049–5052. [Google Scholar] [CrossRef]
- Tomaštík, J.; Mokroš, M.; Surový, P.; Grznárová, A.; Merganič, J. UAV RTK/PPK Method-An Optimal Solution for Mapping Inaccessible Forested Areas? Remote Sens. 2019, 11, 721. [Google Scholar] [CrossRef]
- Mesas-Carrascosa, F.J.; Pérez-Porras, F.; de Larriva, J.E.M.; Frau, C.M.; Agüera-Vega, F.; Carvajal-Ramírez, F.; Martínez-Carricondo, P.; García-Ferrer, A. Drift Correction of Lightweight Microbolometer Thermal Sensors On-Board Unmanned Aerial Vehicles. Remote Sens. 2018, 10, 615. [Google Scholar] [CrossRef]
- Chaudhry, M.H.; Ahmad, A.; Gulzar, Q. Impact of Uav Surveying Parameters on Mixed Urban Landuse Surface Modelling. ISPRS Int. J. Geo-Inf. 2020, 9, 656. [Google Scholar] [CrossRef]
- Moon, D.; Chung, S.; Kwon, S.; Seo, J.; Shin, J. Comparison and Utilization of Point Cloud Generated from Photogrammetry and Laser Scanning: 3D World Model for Smart Heavy Equipment Planning. Autom. Constr. 2019, 98, 322–331. [Google Scholar] [CrossRef]
- Ngoc Qui, B.; Dinh Hien, L.; Quoc Long, N.; Si Son, T.; Anh Quan, D.; Van Hiep, P.; Thanh Hai, P.; Thi Lan, P. Method of Defining the Parameters for UAV Point Cloud Classification Algorithm. Inz. Miner. 2020, 1, 49–56. [Google Scholar] [CrossRef]
- Choi, K.; Cheon, J.W.; Kim, H.Y.; Lee, I. An Automatic UAV Mapping System for Supporting UN (United Nations) Field Operations. Int. Arch. Photogramm. Remote Sens. Spat. Inf. Sci. ISPRS Arch. 2016, 41, 85–90. [Google Scholar] [CrossRef]
- de Luis-Ruiz, J.M.; Salas-Menocal, B.R.; Fernández-Maroto, G.; Pérez-Álvarez, R.; Pereda-García, R. Determination of Environmental Factors for the Implementation of the Exploitability Index in Industrial Aggregate Mining Using Multi-Criteria Analysis. ISPRS Int. J. Geo-Inf. 2021, 10, 196. [Google Scholar] [CrossRef]
- Pérez-Álvarez, R.; Sedano-cibrián, J.; de Luis-Ruiz, J.M.; Fernández-Maroto, G. Mining Exploration with UAV, Low-Cost Thermal Cameras and GIS Tools—Application to the Specific Case of the Complex Sulfides Hosted in Carbonates of Udías (Cantabria, Spain). Minerals 2022, 12, 140. [Google Scholar] [CrossRef]
- Kuhn, J.; Casas-Mulet, R.; Pander, J.; Geist, J. Assessing Stream Thermal Heterogeneity and Cold-Water Patches from UAV-Based Imagery: A Matter of Classification Methods and Metrics. Remote Sens. 2021, 13, 1379. [Google Scholar] [CrossRef]
- Melis, M.T.; Da Pelo, S.; Erbì, I.; Loche, M.; Deiana, G.; Demurtas, V.; Meloni, M.A.; Dessì, F.; Funedda, A.; Scaioni, M.; et al. Thermal Remote Sensing from UAVs: A Review on Methods in Coastal Cliffs Prone to Landslides. Remote Sens. 2020, 12, 1971. [Google Scholar] [CrossRef]
- Young, K.S.R.; Pradhanang, S.M. Small Unmanned Aircraft (SUAS)-Deployed Thermal Infrared (TIR) Imaging for Environmental Surveys with Implications in Submarine Groundwater Discharge (SGD): Methods, Challenges, and Novel Opportunities. Remote Sens. 2021, 13, 1331. [Google Scholar] [CrossRef]
- Kraaijenbrink, P.D.A.; Shea, J.M.; Litt, M.; Steiner, J.F.; Treichler, D.; Koch, I.; Immerzeel, W.W. Mapping Surface Temperatures on a Debris-Covered Glacier with an Unmanned Aerial Vehicle. Front. Earth Sci. 2018, 6, 64. [Google Scholar] [CrossRef]
- Boesch, R. Thermal Remote Sensing with UAV-Based Workflows. Int. Arch. Photogramm. Remote Sens. Spat. Inf. Sci. ISPRS Arch. 2017, 42, 41–46. [Google Scholar] [CrossRef]
- Wakeford, Z.E.; Chmielewska, M.; Hole, M.J.; Howell, J.A.; Jerram, D.A. Combining Thermal Imaging with Photogrammetry of an Active Volcano Using UAV: An Example from Stromboli, Italy. Photogramm. Rec. 2019, 34, 445–466. [Google Scholar] [CrossRef]
- de Luis-Ruiz, J.M.; Sedano-Cibrián, J.; Pérez-Álvarez, R.; Pereda-García, R.; Malagón-Picón, B. Metric Contrast of Thermal 3D Models of Large Industrial Facilities Obtained by Means of Low-Cost Infrared Sensors in UAV Platforms. Int. J. Remote Sens. 2021, 43, 457–483. [Google Scholar] [CrossRef]
- Luis-Ruiz, J.M.d.; Sedano-Cibrián, J.; Pereda-García, R.; Pérez-Álvarez, R.; Malagón-Picón, B. Optimization of Photogrammetric Flights with UAVs for the Metric Virtualization of Archaeological Sites. Application to Juliobriga (Cantabria, Spain). Appl. Sci. 2021, 11, 1204. [Google Scholar] [CrossRef]
- Maes, W.H.; Huete, A.R.; Steppe, K. Optimizing the Processing of UAV-Based Thermal Imagery. Remote Sens. 2017, 9, 476. [Google Scholar] [CrossRef]
- Koch, T.; Körner, M.; Fraundorfer, F. Automatic and Semantically-Aware 3D UAV Flight Planning for Image-Based 3D Reconstruction. Remote Sens. 2019, 11, 1550. [Google Scholar] [CrossRef]
- Nex, F.; Remondino, F. UAV for 3D Mapping Applications: A Review. Appl. Geomat. 2014, 6, 1–15. [Google Scholar] [CrossRef]
- Tziavou, O.; Pytharouli, S.; Souter, J. Unmanned Aerial Vehicle (UAV) Based Mapping in Engineering Geological Surveys: Considerations for Optimum Results. Eng. Geol. 2018, 232, 12–21. [Google Scholar] [CrossRef]
- Casana, J.; Wiewel, A.; Cool, A.; Hill, A.C.; Fisher, K.D.; Laugier, E.J. Archaeological Aerial Thermography in Theory and Practice. Adv. Archaeol. Pract. 2017, 5, 310–327. [Google Scholar] [CrossRef]
- Dugdale, S.J. A Practitioner’s Guide to Thermal Infrared Remote Sensing of Rivers and Streams: Recent Advances, Precautions and Considerations. Wiley Interdiscip. Rev. Water 2016, 3, 251–268. [Google Scholar] [CrossRef]
- Fricke, K.; Baschek, B.; Jenal, A.; Kneer, C.; Weber, I.; Bongartz, J.; Wyrwa, J.; Schöl, A. Observing Water Surface Temperature from Two Different Airborne Platforms over Temporarily Flooded Wadden Areas at the Elbe Estuary—Methods for Corrections and Analysis. Remote Sens. 2021, 13, 1489. [Google Scholar] [CrossRef]
- Kawai, Y.; Wada, A. Diurnal Sea Surface Temperature Variation and Its Impact on the Atmosphere and Ocean: A Review. J. Oceanogr. 2007, 63, 721–744. [Google Scholar] [CrossRef]
- Yang, Y.; Lee, X. Four-Band Thermal Mosaicking: A New Method to Process Infrared Thermal Imagery of Urban Landscapes from UAV Flights. Remote Sens. 2019, 11, 1365. [Google Scholar] [CrossRef]
- Senkal, E.; Kaplan, G.; Avdan, U. Accuracy Assessment of Digital Surface Models From Unmanned Aerial Vehicles’ Imagery on Archaeological Sites. Int. J. Eng. Geosci. 2021, 6, 81–89. [Google Scholar] [CrossRef]
- Malihi, S.; Zoej, M.J.V.; Hahn, M. Large-Scale Accurate Reconstruction of Buildings Employing Point Clouds Generated from UAV Imagery. Remote Sens. 2018, 10, 1148. [Google Scholar] [CrossRef]
- Ferrer-González, E.; Agüera-Vega, F.; Carvajal-Ramírez, F.; Martínez-Carricondo, P. UAV Photogrammetry Accuracy Assessment for Corridor Mapping Based on the Number and Distribution of Ground Control Points. Remote Sens. 2020, 12, 2447. [Google Scholar] [CrossRef]
- Martínez-Carricondo, P.; Agüera-Vega, F.; Carvajal-Ramírez, F.; Mesas-Carrascosa, F.J.; García-Ferrer, A.; Pérez-Porras, F.J. Assessment of UAV-Photogrammetric Mapping Accuracy Based on Variation of Ground Control Points. Int. J. Appl. Earth Obs. Geoinf. 2018, 72, 1–10. [Google Scholar] [CrossRef]
- Campione, I.; Lucchi, F.; Santopuoli, N.; Seccia, L. 3D Thermal Imaging System with Decoupled Acquisition for Industrial and Cultural Heritage Applications. Appl. Sci. 2020, 10, 828. [Google Scholar] [CrossRef]
- Dlesk, A.; Vach, K. Point Cloud Generation of a Building from Close Range Thermal Images. Int. Arch. Photogramm. Remote Sens. Spat. Inf. Sci. ISPRS Arch. 2019, 42, 29–33. [Google Scholar] [CrossRef]
- Knyaz, V.A.; Moshkantsev, P.V. Joint Geometric Calibration of Color and Thermal Cameras for Synchronized Multimodal Dataset Creating. Int. Arch. Photogramm. Remote Sens. Spat. Inf. Sci. ISPRS Arch. 2019, 42, 79–84. [Google Scholar] [CrossRef]
- Hoffmann, H.; Nieto, H.; Jensen, R.; Guzinski, R.; Zarco-Tejada, P.; Friborg, T. Estimating Evaporation with Thermal UAV Data and Two-Source Energy Balance Models. Hydrol. Earth Syst. Sci. 2016, 20, 697–713. [Google Scholar] [CrossRef]
- Kelly, J.; Kljun, N.; Olsson, P.O.; Mihai, L.; Liljeblad, B.; Weslien, P.; Klemedtsson, L.; Eklundh, L. Challenges and Best Practices for Deriving Temperature Data from an Uncalibrated UAV Thermal Infrared Camera. Remote Sens. 2019, 11, 567. [Google Scholar] [CrossRef]
- Anderson, J.M.; Duck, R.W.; McManus, J. Thermal Radiometry: A Rapid Means of Determining Surface Water Temperature Variations in Lakes and Reservoirs. J. Hydrol. 1995, 173, 131–144. [Google Scholar] [CrossRef]
- Silvestri, M.; Marotta, E.; Buongiorno, M.F.; Avvisati, G.; Belviso, P.; Sessa, E.B.; Caputo, T.; Longo, V.; Leo, V.D.; Teggi, S. Monitoring of Surface Temperature on Parco Delle Biancane (Italian Geothermal Area) Using Optical Satellite Data, UAV and Field Campaigns. Remote Sens. 2020, 12, 2018. [Google Scholar] [CrossRef]
- Fryskowska-Skibniewska, A.; Delis, P.; Kedzierski, M.; Matusiak, D. The Conception of Test Fields for Fast Geometric Calibration of the FLIR VUE PRO Thermal Camera for Low-Cost UAV Applications. Sensors 2022, 22, 2468. [Google Scholar] [CrossRef]
- Porowski, A. Mineral and Thermal Waters. Environ. Geol. 2019, 149–181. [Google Scholar] [CrossRef]
- Elster, D.; Szöcs, T.; Gál, N.; Hansen, B.; Voutchkova, D.; Schullehner, J.; Lions, J.; Martarelli, L.; Giménez-Forcada, E.; Díaz-Muñoz, J.A.; et al. Terminologies and Characteristics of Natural Mineral and Thermal Waters in Selected European Countries. Geologija 2022, 65, 21–46. [Google Scholar] [CrossRef]


| Specifications | |
|---|---|
| Sensor size | 1/3” |
| Resolution | 1920 × 1080 px |
| Focal distance | 4 mm |
| Format | JPEG |
| Specifications | |
|---|---|
| Sensor type | Uncooled Vox microbolometer |
| Sensor size | 1/3” |
| Resolution | 640 × 512 px |
| Focal distance | 19 mm |
| Spectral range | 7.5–13.5 μm |
| Temperature sensitivity | 0.05 °C |
| Accuracy | ±2 °C |
| Format | JPEG |
| Flight Parameters | |
|---|---|
| Height (m) | 70 |
| Speed (m/s) | 3 |
| Frontlap (%) | 80 |
| Sidelap (%) | 80 |
| Resolution (cm/px) | 2.23 (RGB) 6.12 (IR) |
| Number of Photographs | 1164 |
| Flight time (min) | 96 |
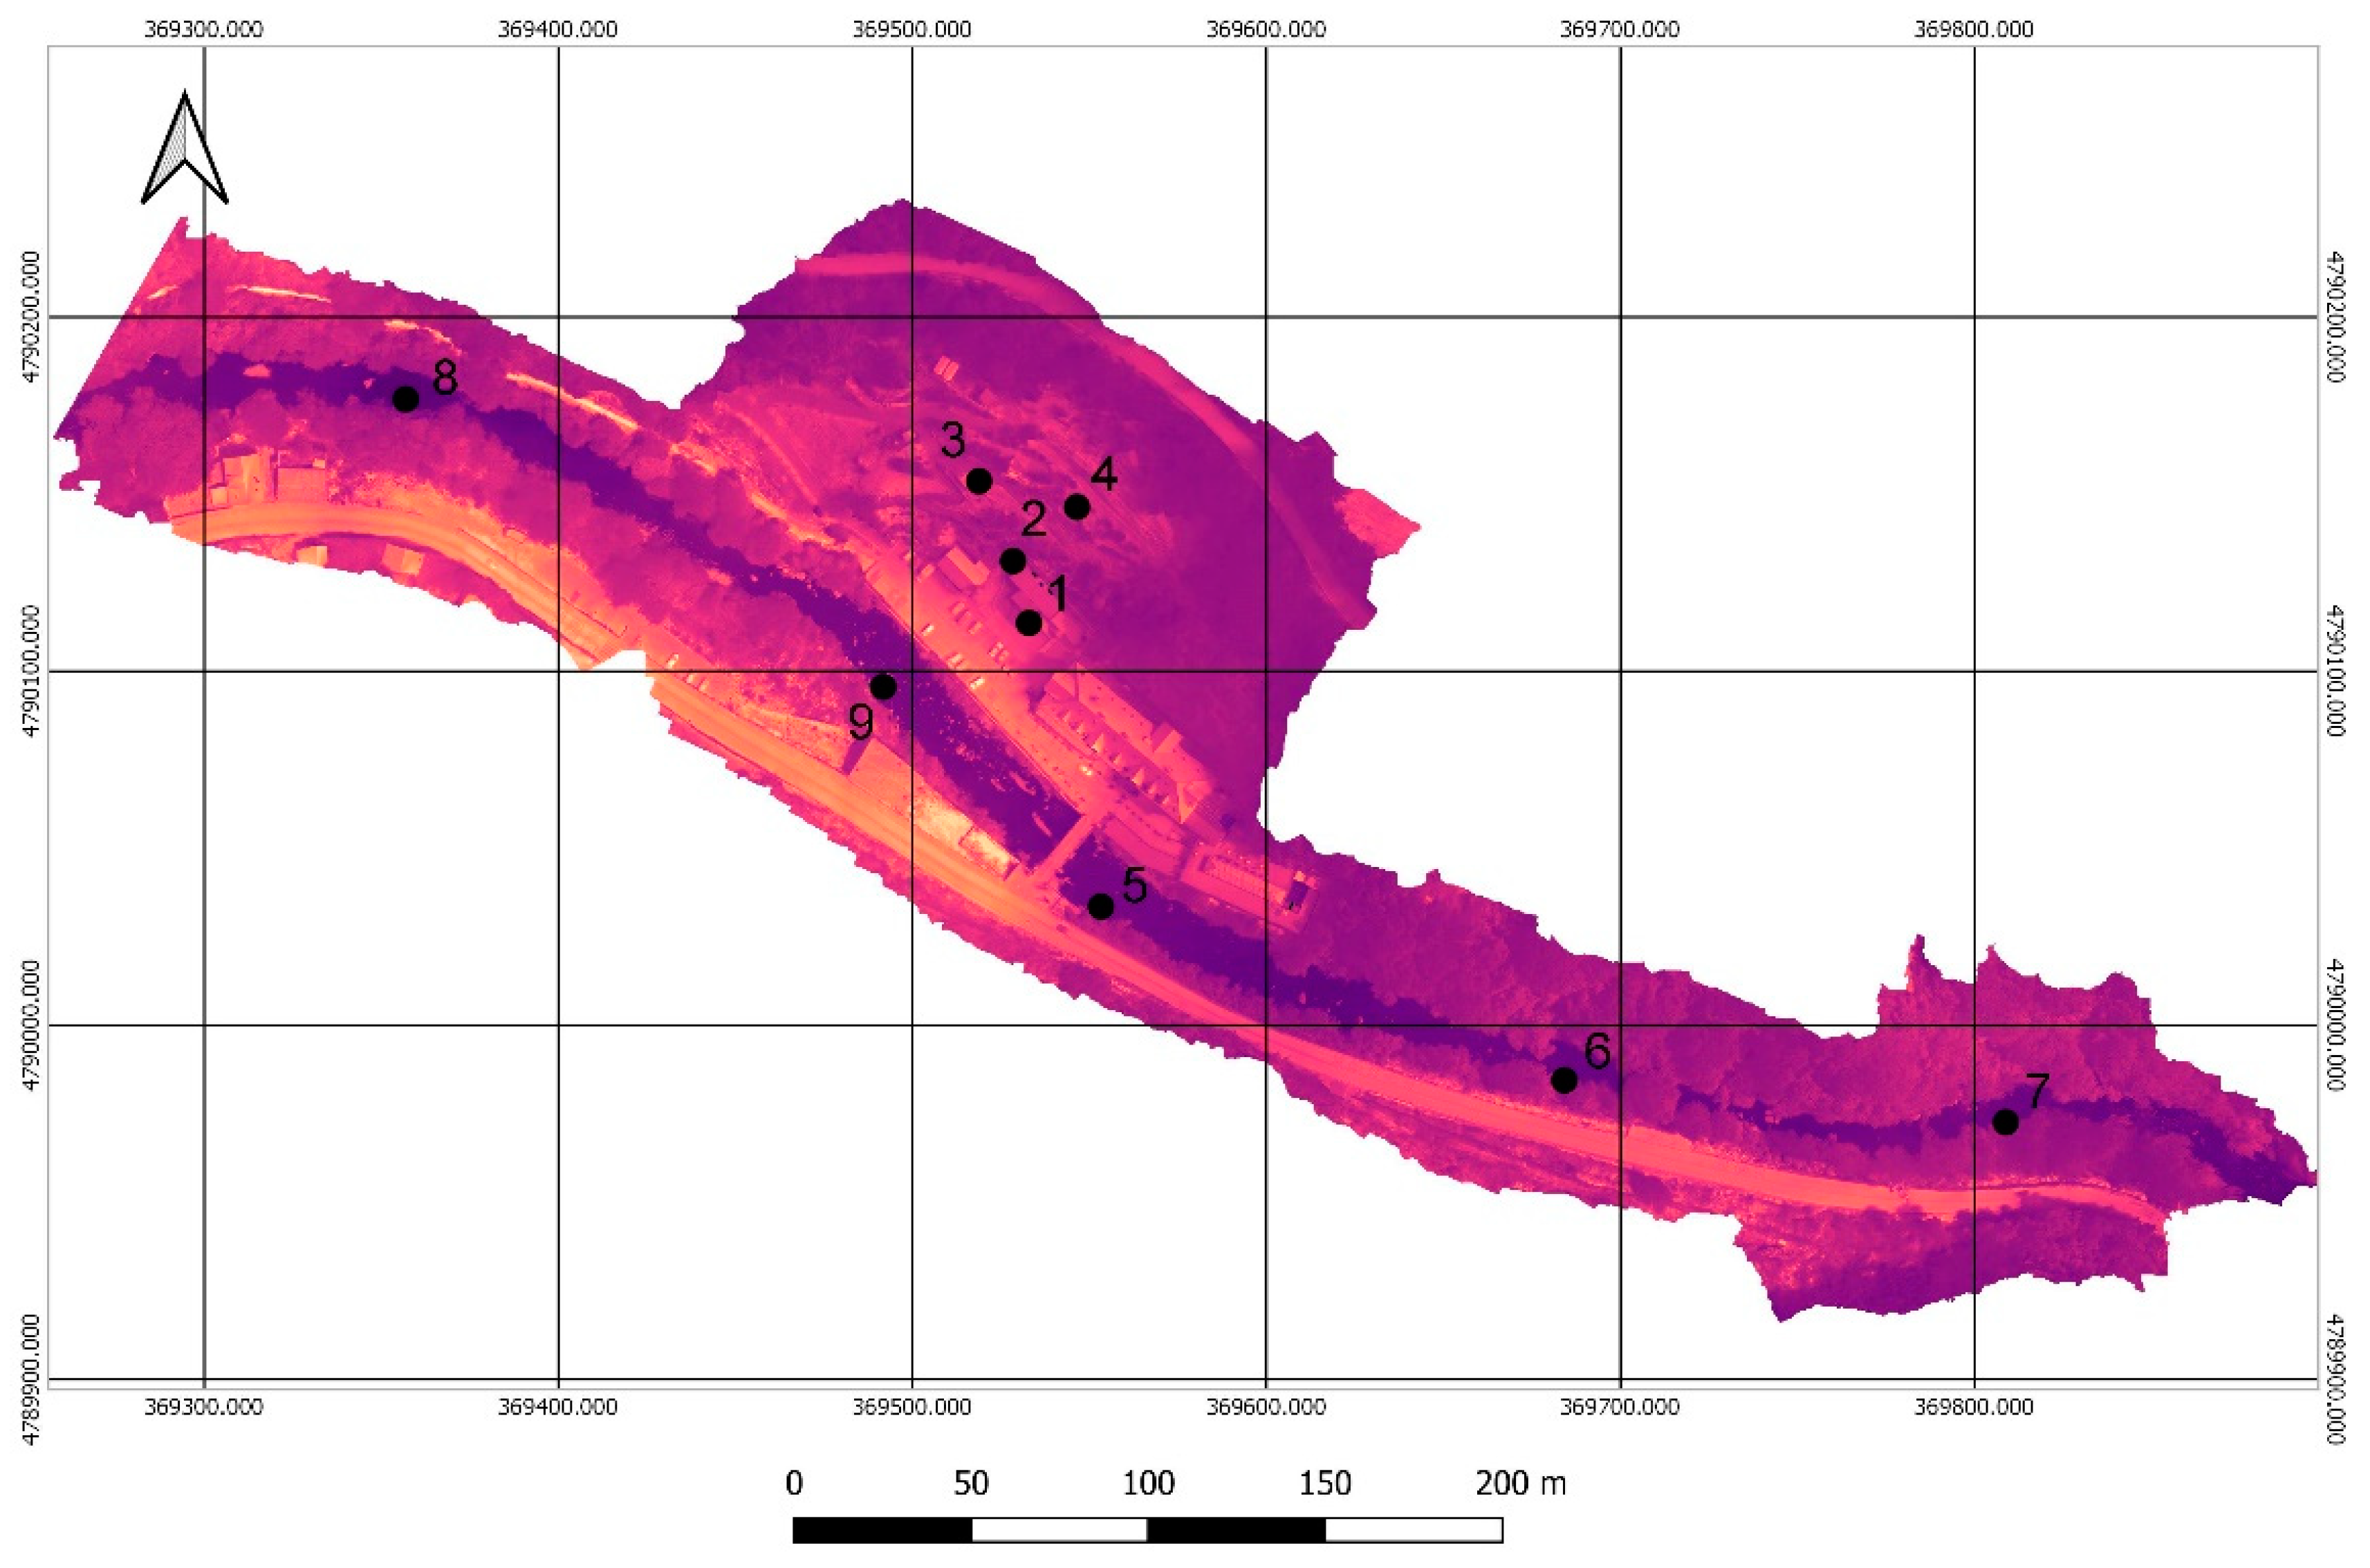
| Point | Thermometer (°C) | Handheld Camera (°C) | UAV (°C) |
|---|---|---|---|
| 1 | 26 | 26.5 | 23.95 |
| 2 | 28 | 28.8 | 25.70 |
| 3 | 35 | 35.3 | 31.25 |
| 4 | 42 | 40.4 | 38.43 |
| 5 | 18 | 17.1 | 14.10 |
| 6 | - | 17.8 | 12.63 |
| 7 | - | 16.4 | 13.32 |
| 8 | - | 17.7 | 13.95 |
| 9 | 19 | 18.2 | 14.33 |
Publisher’s Note: MDPI stays neutral with regard to jurisdictional claims in published maps and institutional affiliations. |
© 2022 by the authors. Licensee MDPI, Basel, Switzerland. This article is an open access article distributed under the terms and conditions of the Creative Commons Attribution (CC BY) license (https://creativecommons.org/licenses/by/4.0/).
Share and Cite
Sedano-Cibrián, J.; Pérez-Álvarez, R.; de Luis-Ruiz, J.M.; Pereda-García, R.; Salas-Menocal, B.R. Thermal Water Prospection with UAV, Low-Cost Sensors and GIS. Application to the Case of La Hermida. Sensors 2022, 22, 6756. https://doi.org/10.3390/s22186756
Sedano-Cibrián J, Pérez-Álvarez R, de Luis-Ruiz JM, Pereda-García R, Salas-Menocal BR. Thermal Water Prospection with UAV, Low-Cost Sensors and GIS. Application to the Case of La Hermida. Sensors. 2022; 22(18):6756. https://doi.org/10.3390/s22186756
Chicago/Turabian StyleSedano-Cibrián, Javier, Rubén Pérez-Álvarez, Julio Manuel de Luis-Ruiz, Raúl Pereda-García, and Benito Ramiro Salas-Menocal. 2022. "Thermal Water Prospection with UAV, Low-Cost Sensors and GIS. Application to the Case of La Hermida" Sensors 22, no. 18: 6756. https://doi.org/10.3390/s22186756
APA StyleSedano-Cibrián, J., Pérez-Álvarez, R., de Luis-Ruiz, J. M., Pereda-García, R., & Salas-Menocal, B. R. (2022). Thermal Water Prospection with UAV, Low-Cost Sensors and GIS. Application to the Case of La Hermida. Sensors, 22(18), 6756. https://doi.org/10.3390/s22186756