
SpecSeg Network for Specular Highlight Detection and Segmentation in Real-World Images
 , ,
, ,  ,
,  and
and 
Abstract
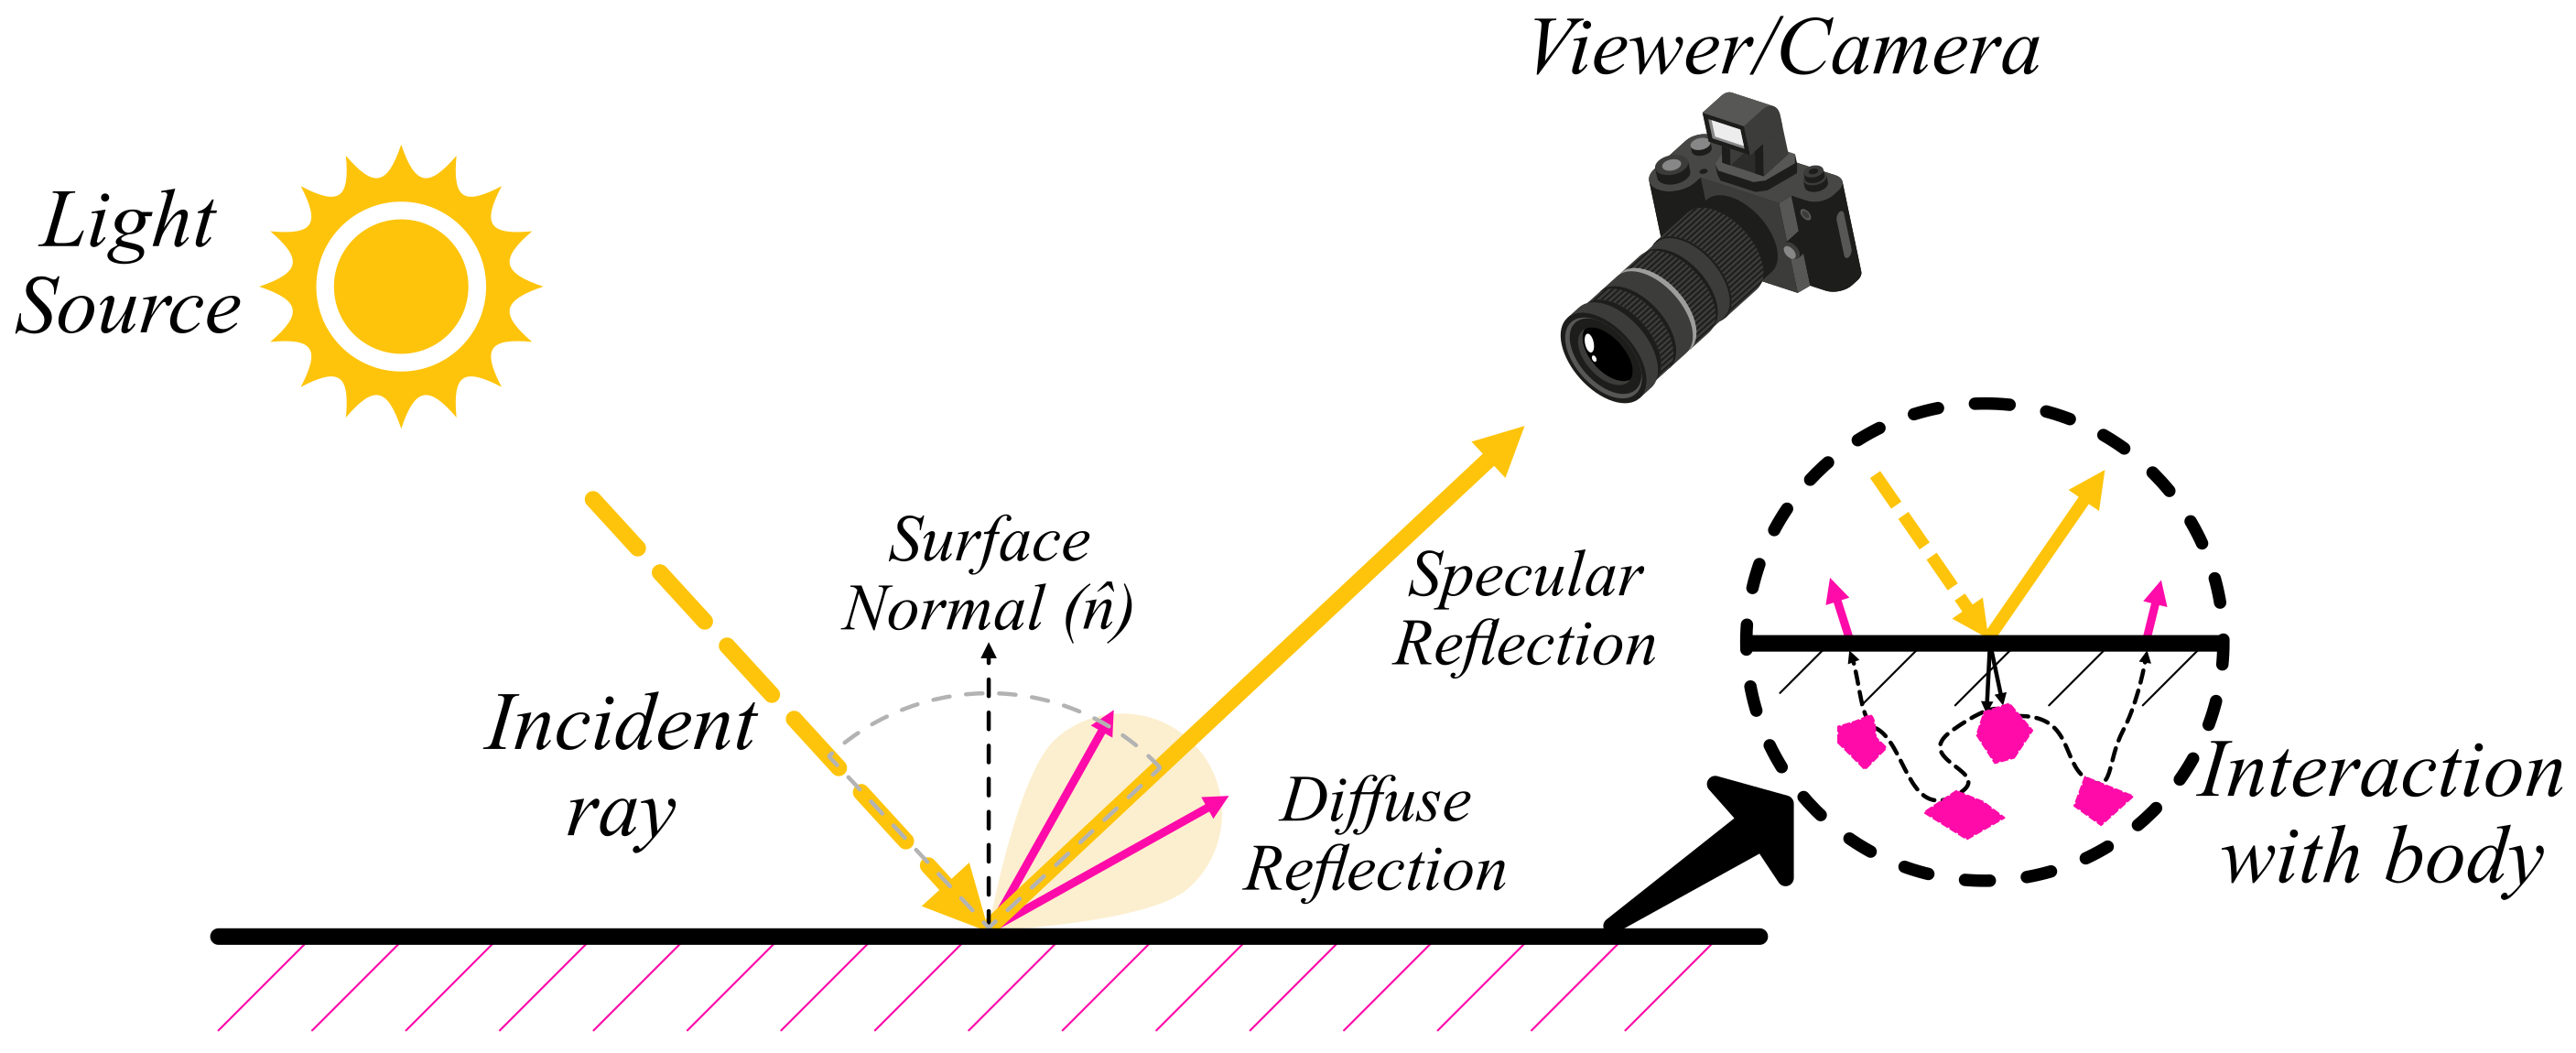
:1. Introduction to Specular Highlights
2. A Survey of Specular Highlight Detection and Segmentation in Literature
2.1. Classical Specular Detection and Segmentation Methods
2.1.1. Segmenting Specular Highlights Using Chromaticity
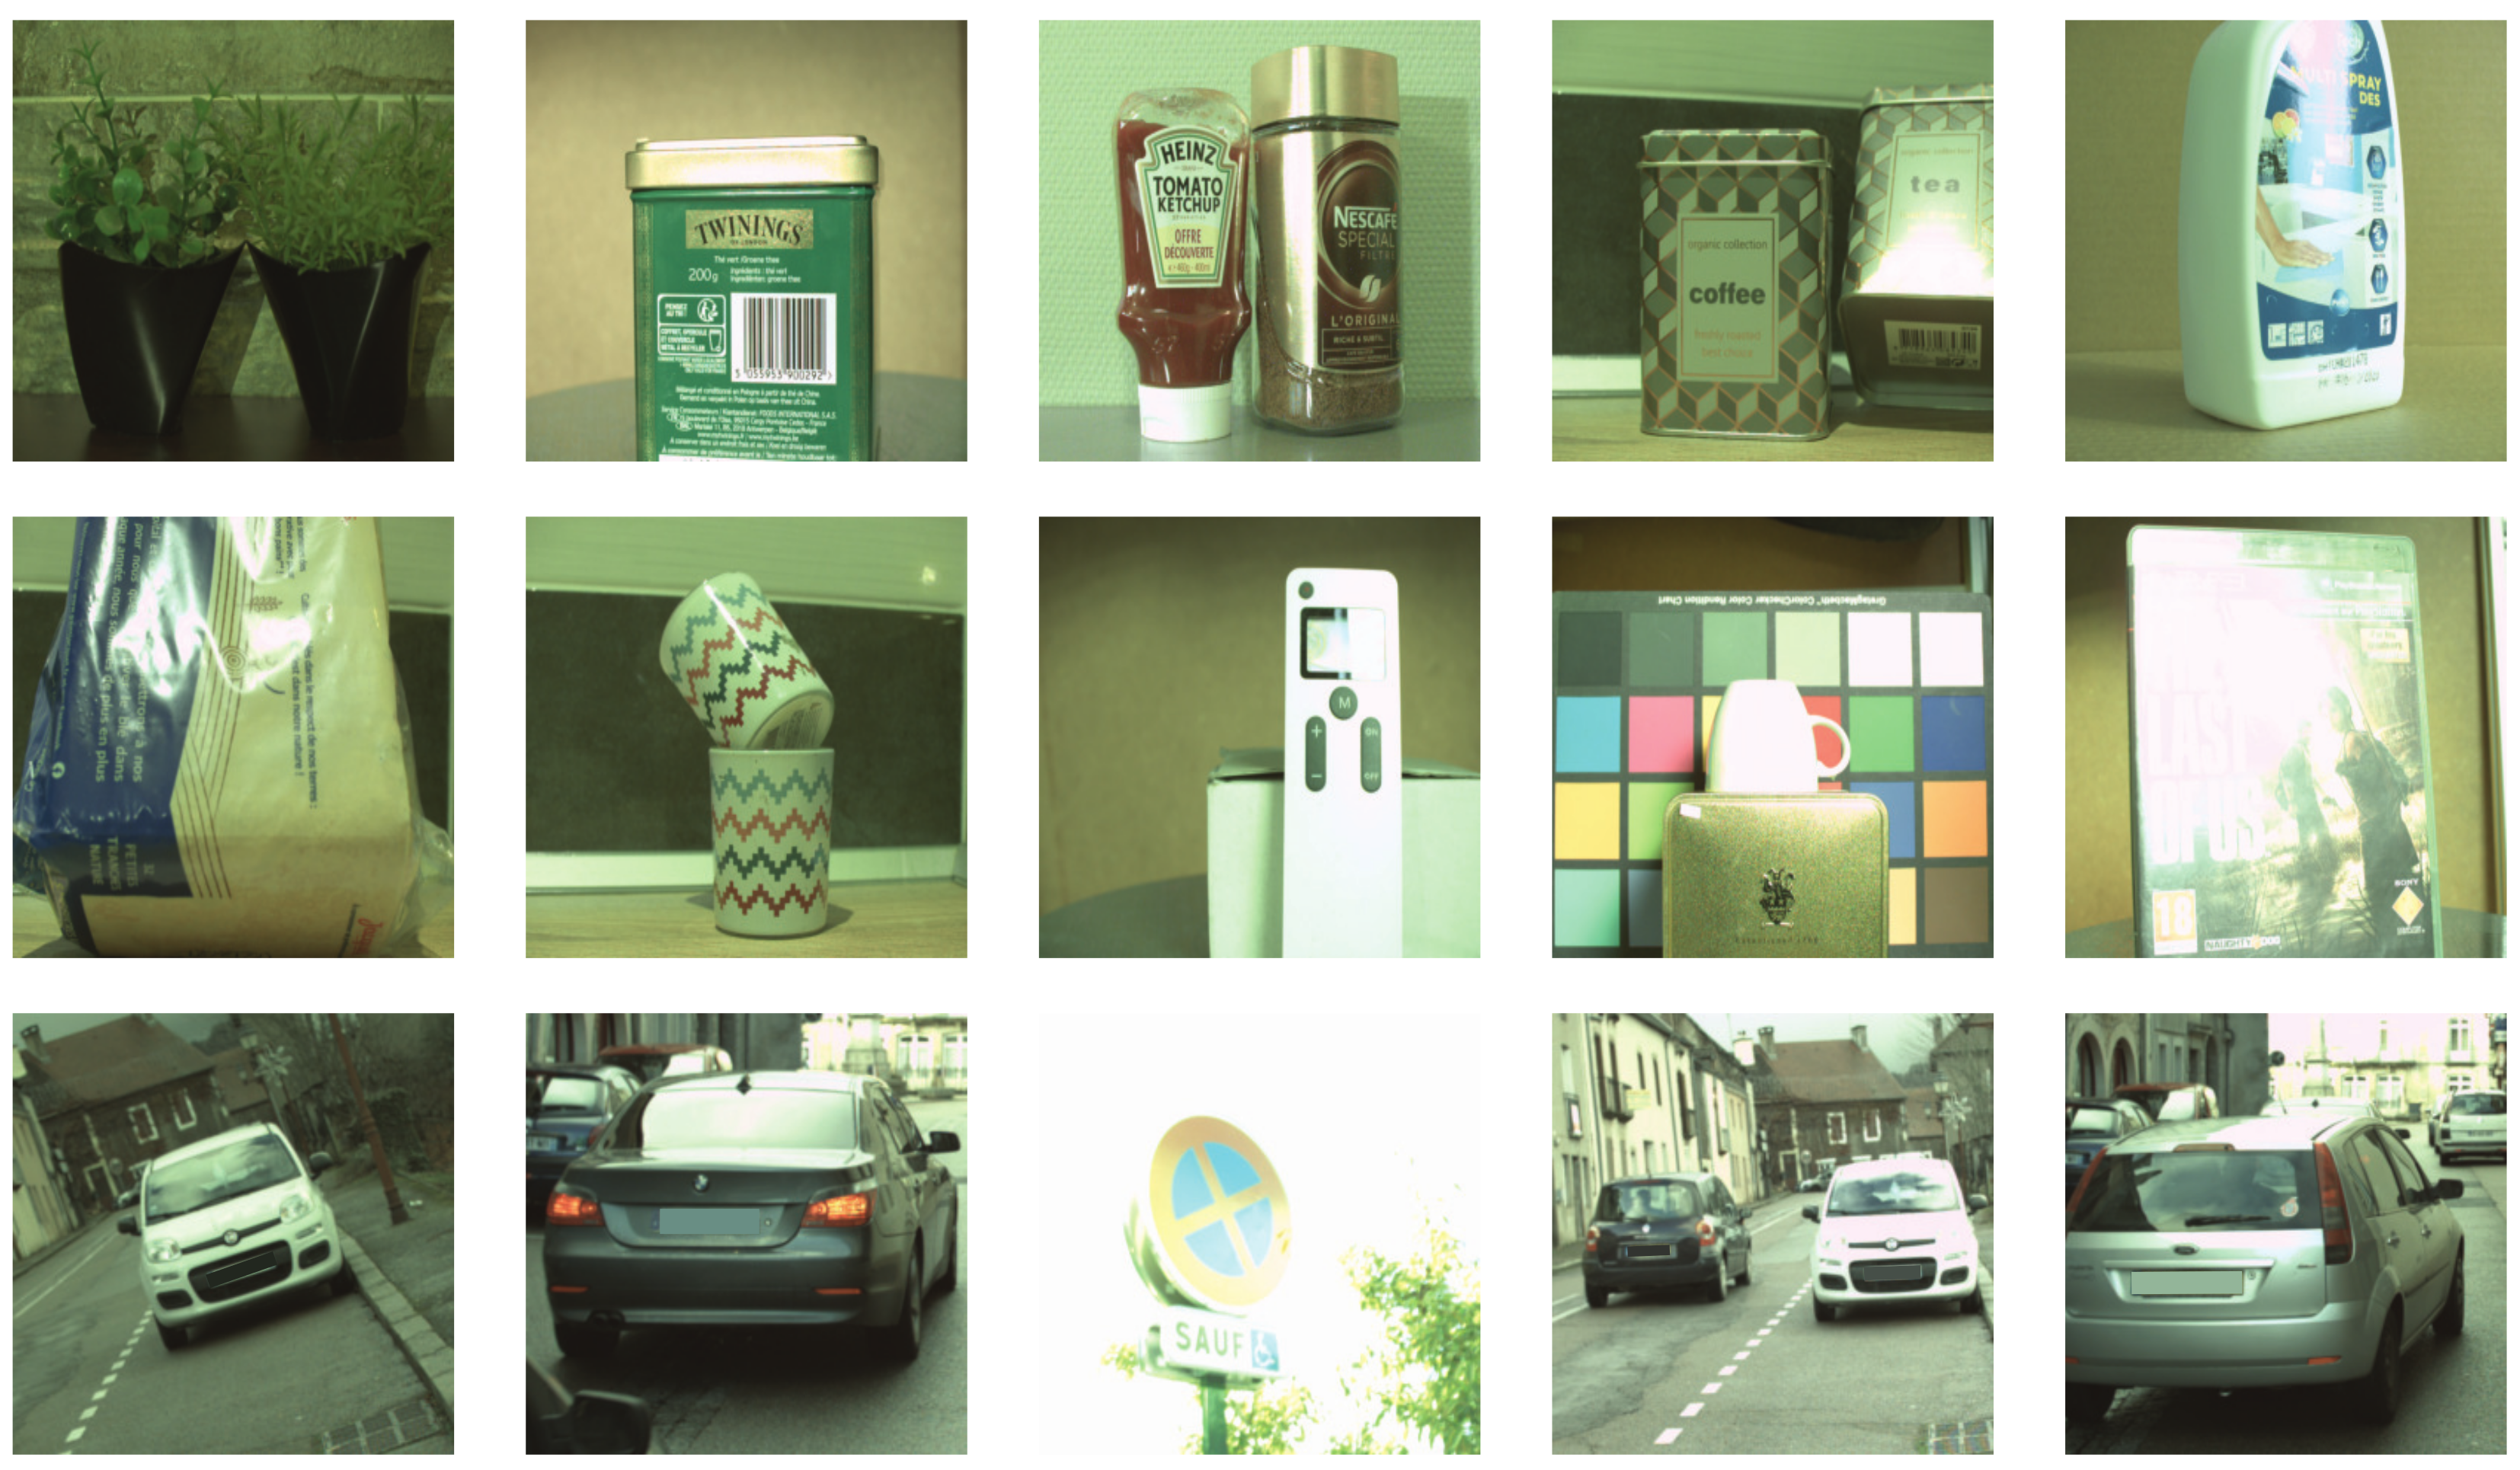
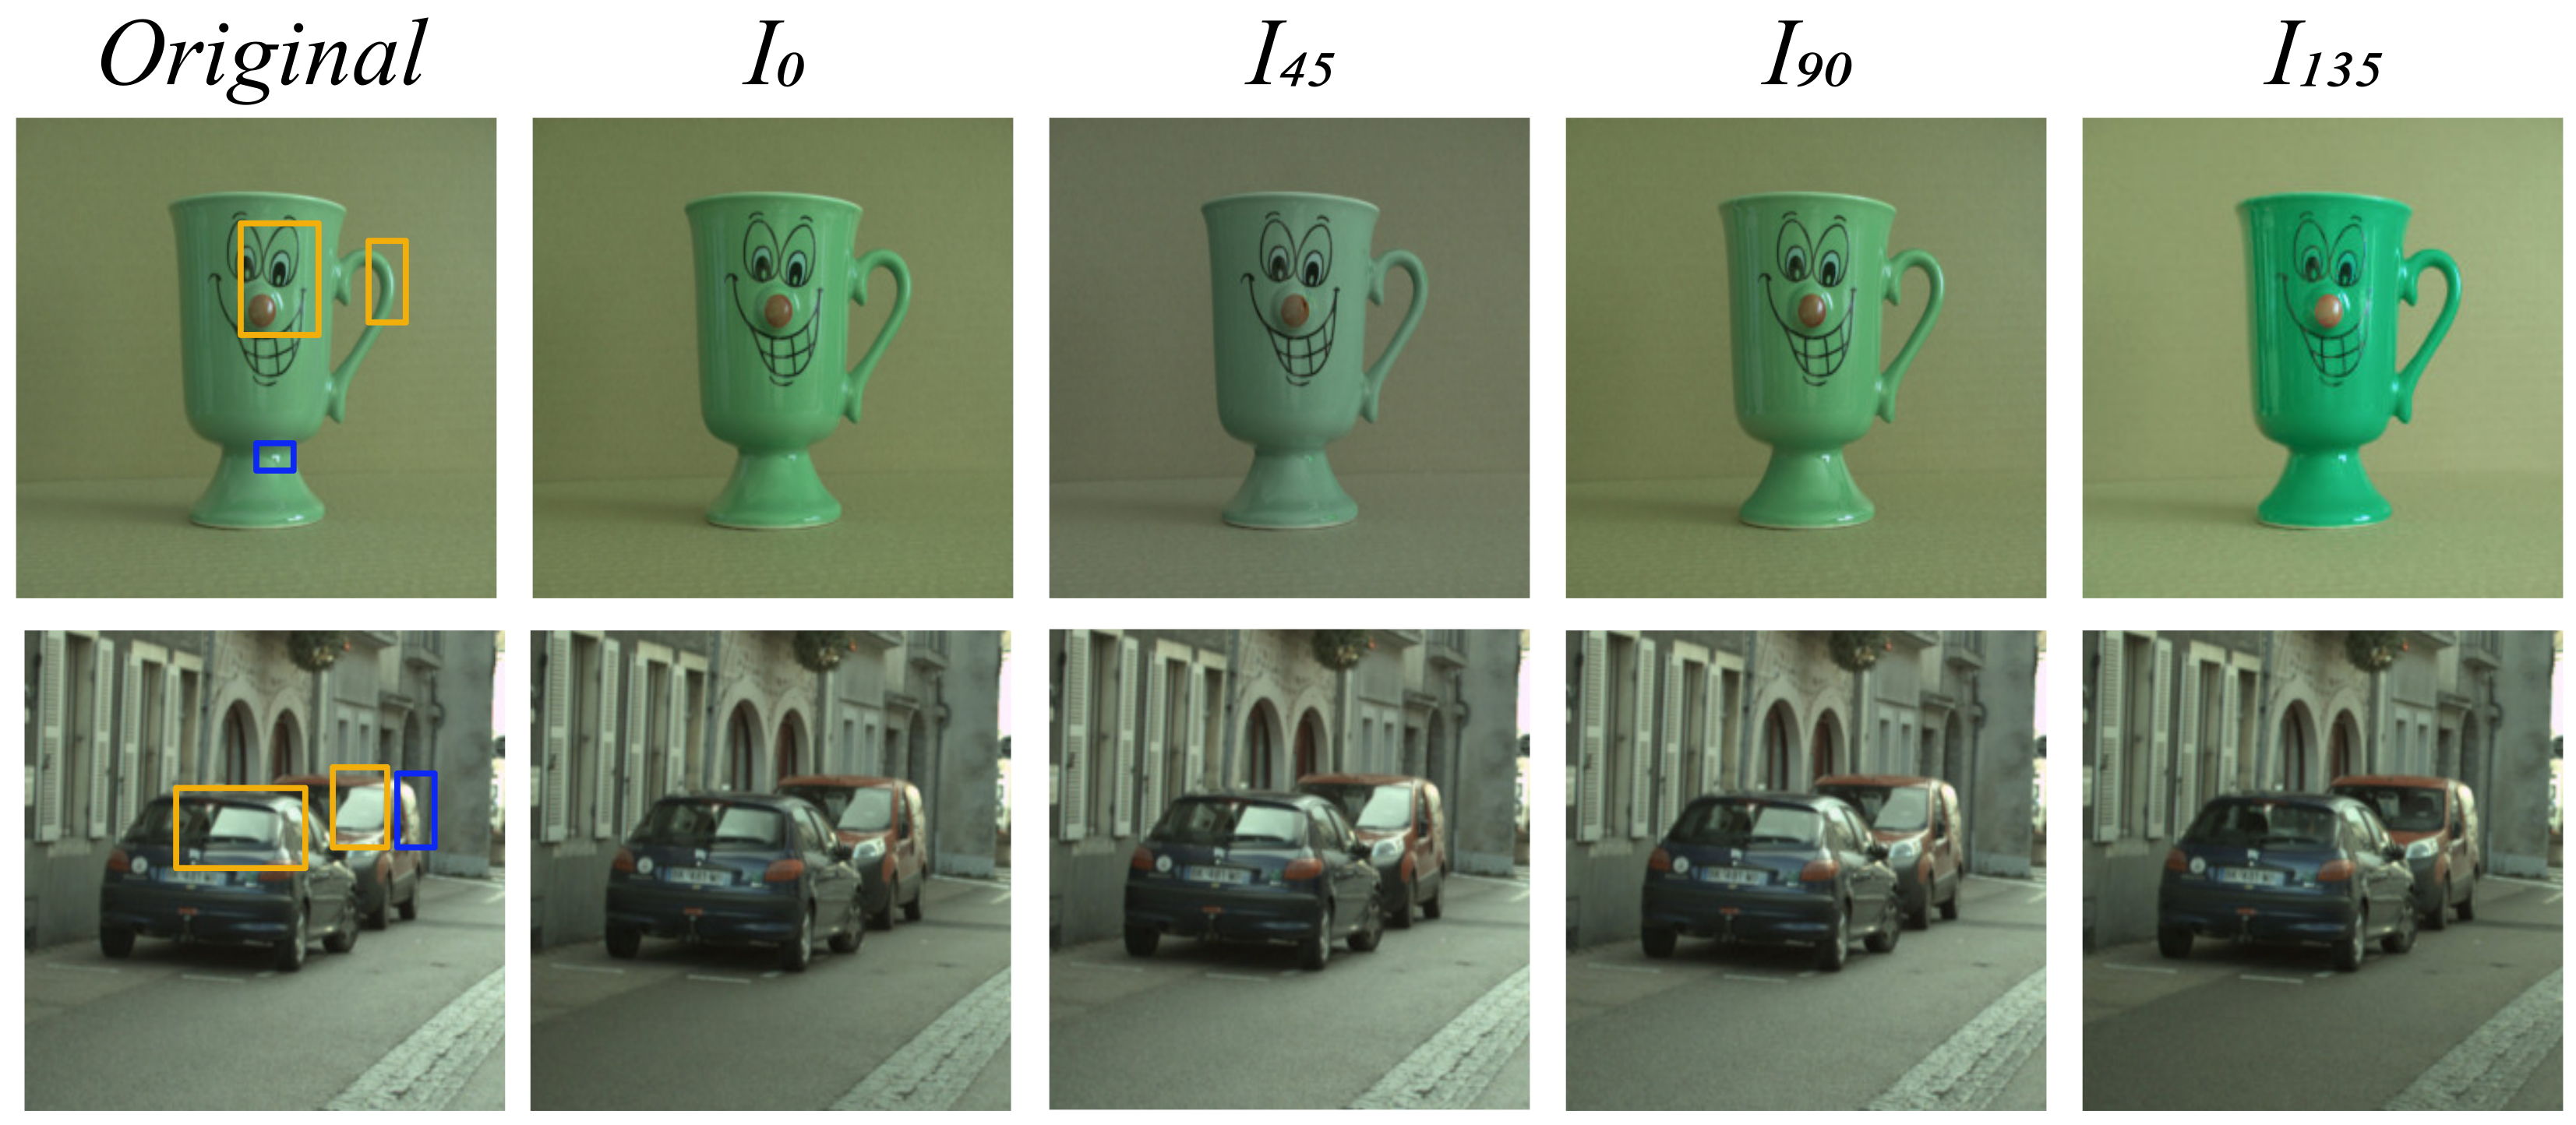
2.1.2. Polarisation, Low-Rank Approximations, and Other Approaches
2.2. Deep Learning Based Methods
2.3. Limitations of the Current State-of-the-Art
3. Specular Highlight Segmentation Network (SpecSeg Network)
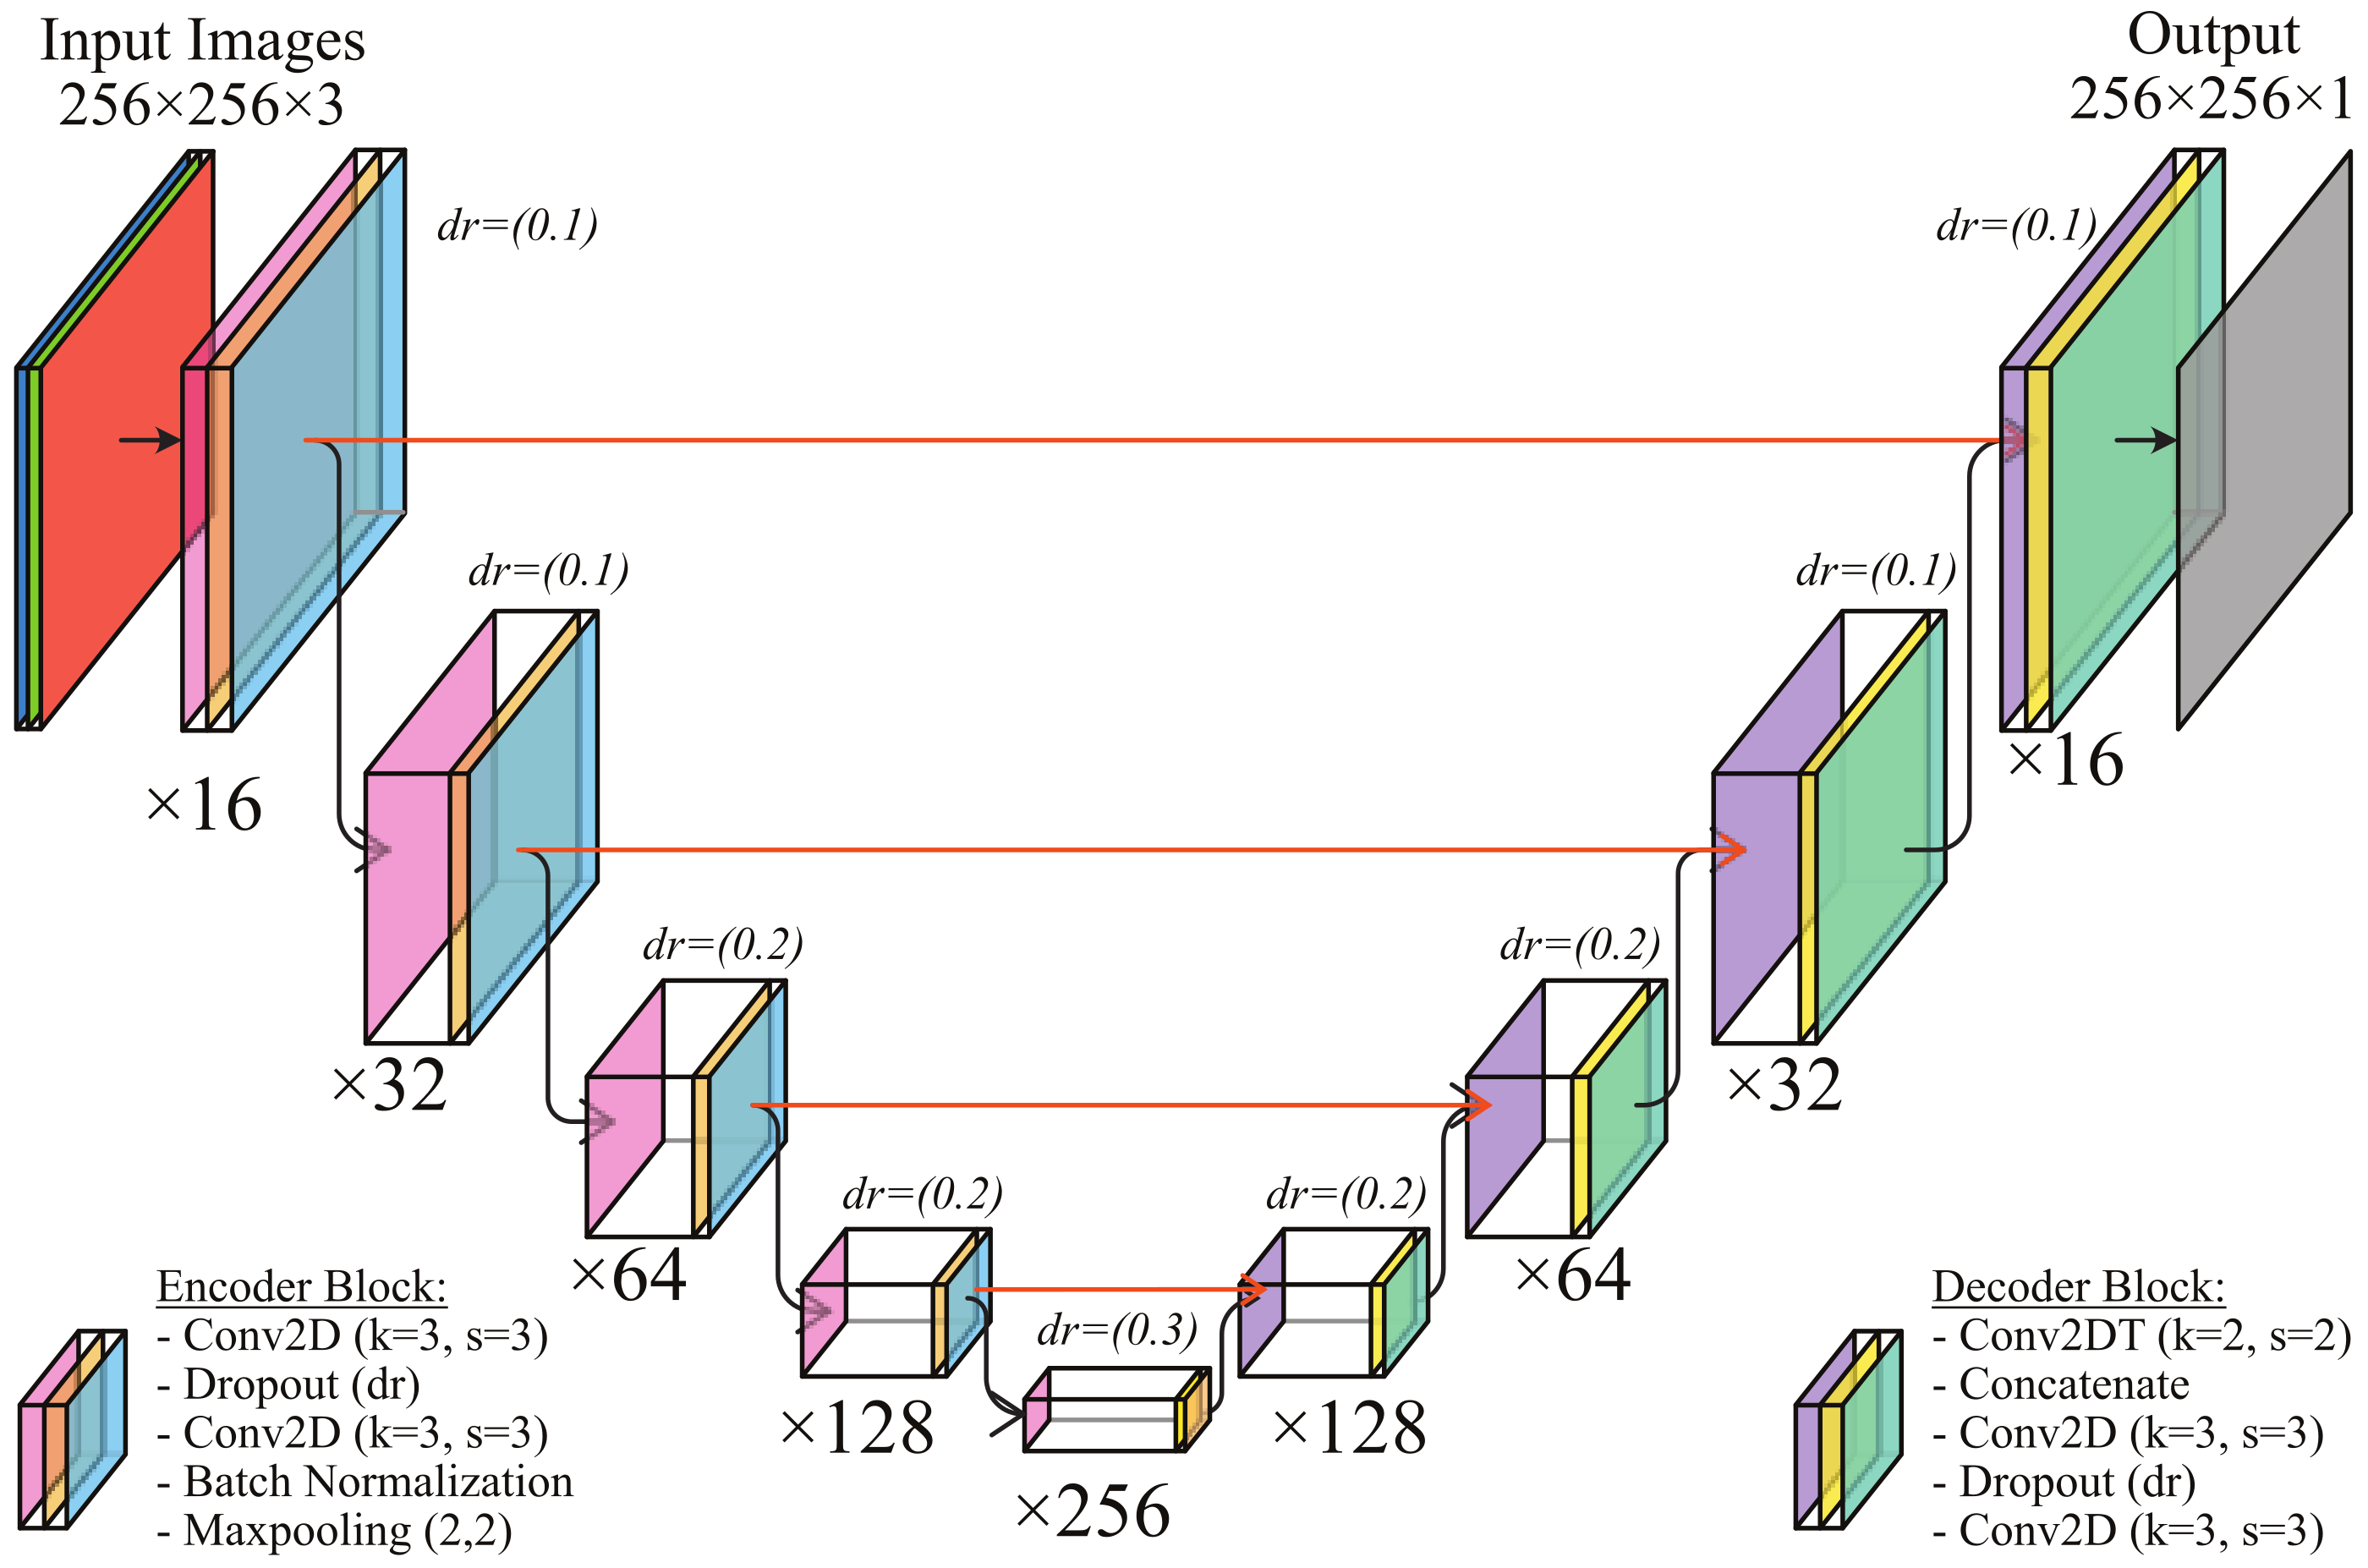
3.1. SpecSeg Network Model and Implementation
3.1.1. Encoder and Decoder Blocks
3.1.2. Loss Functions
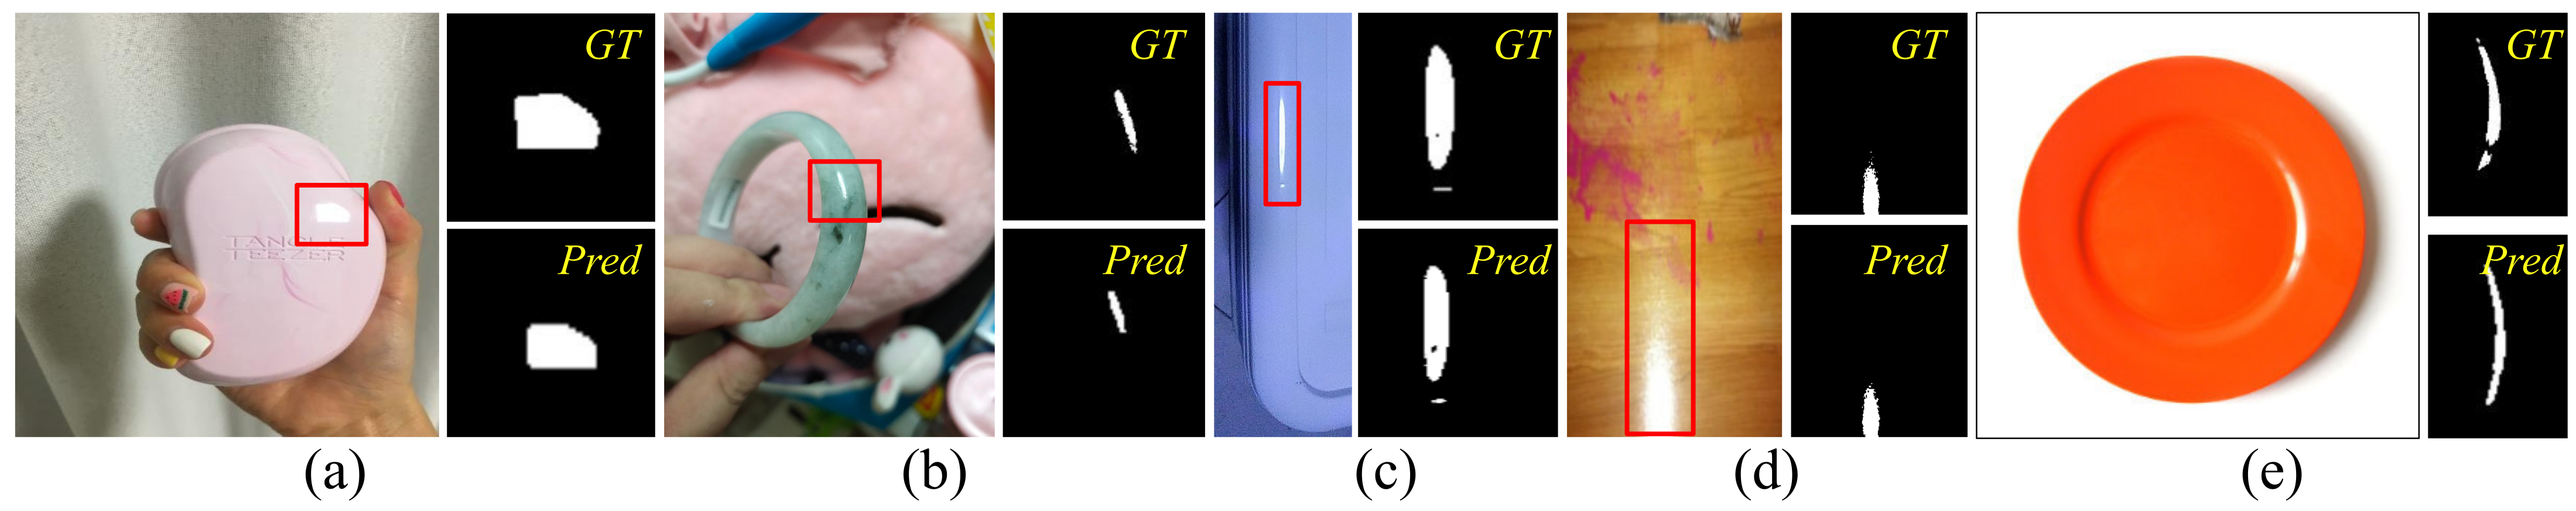
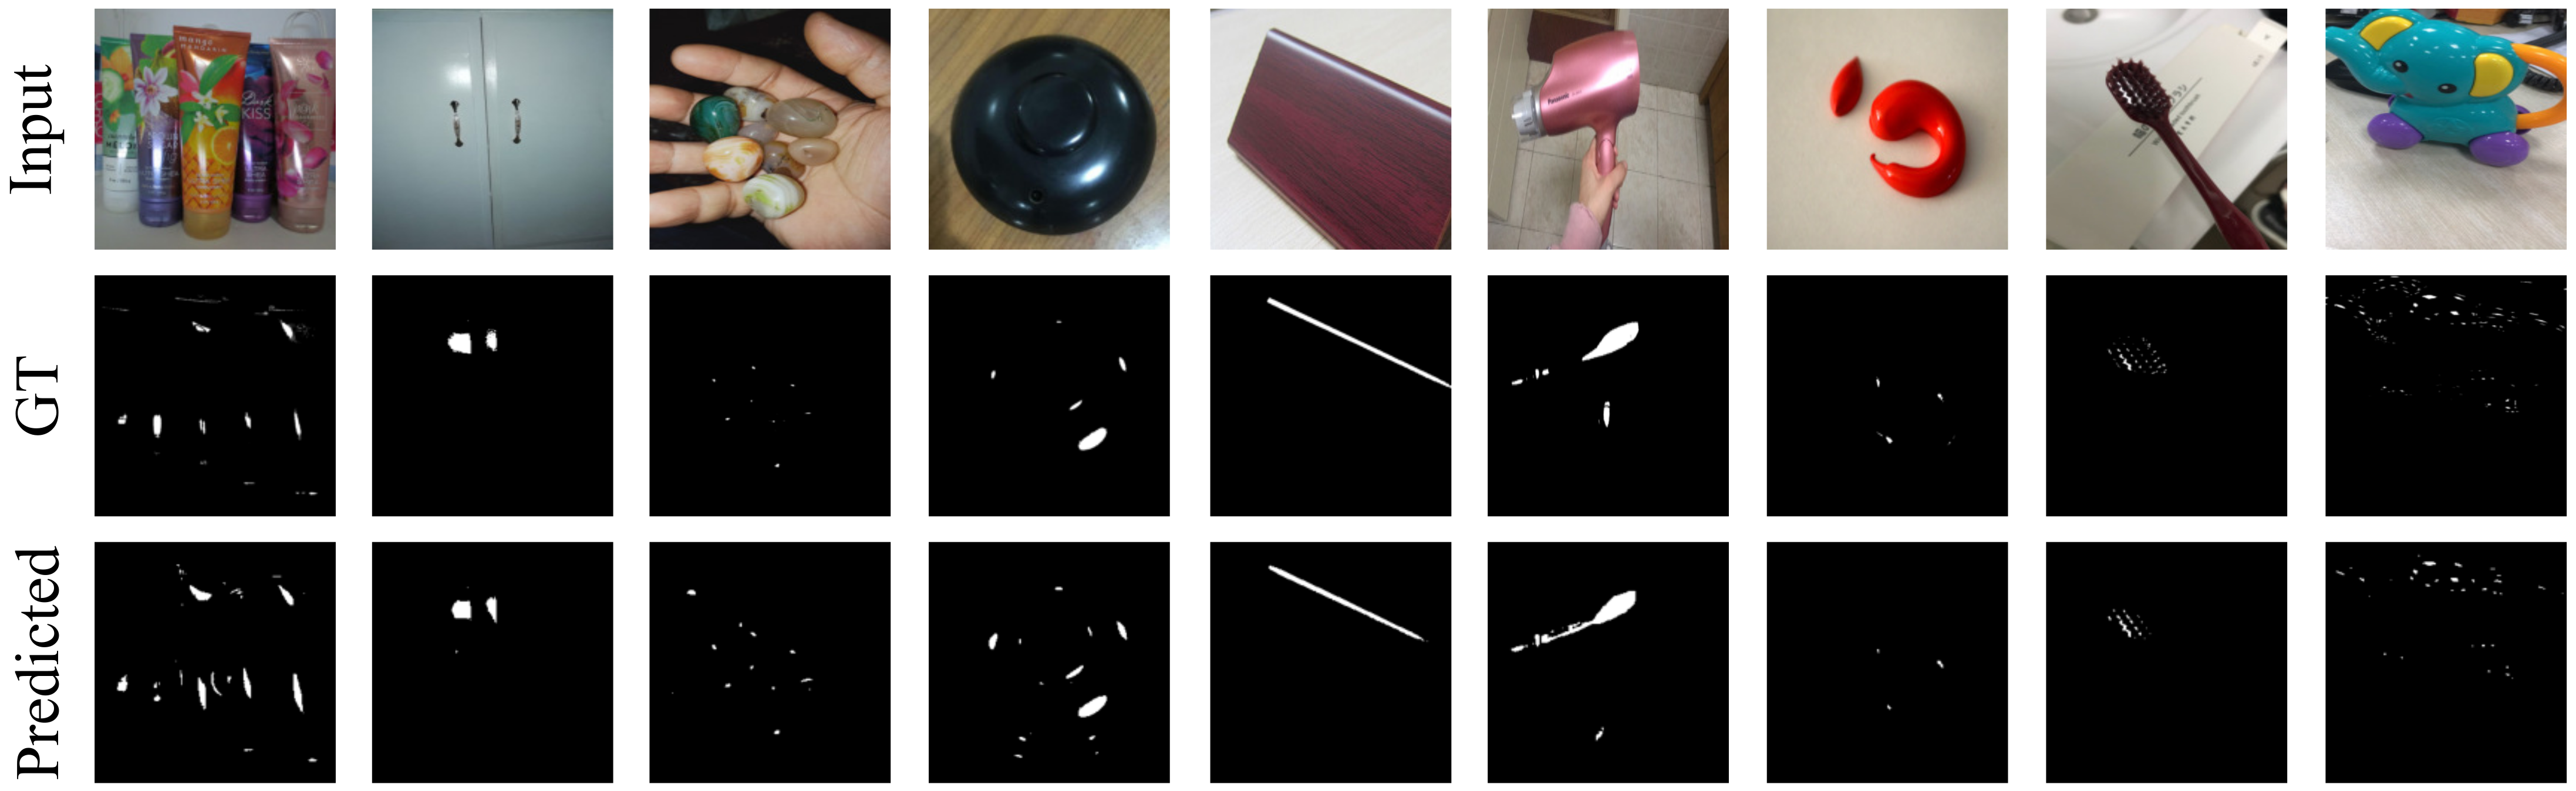
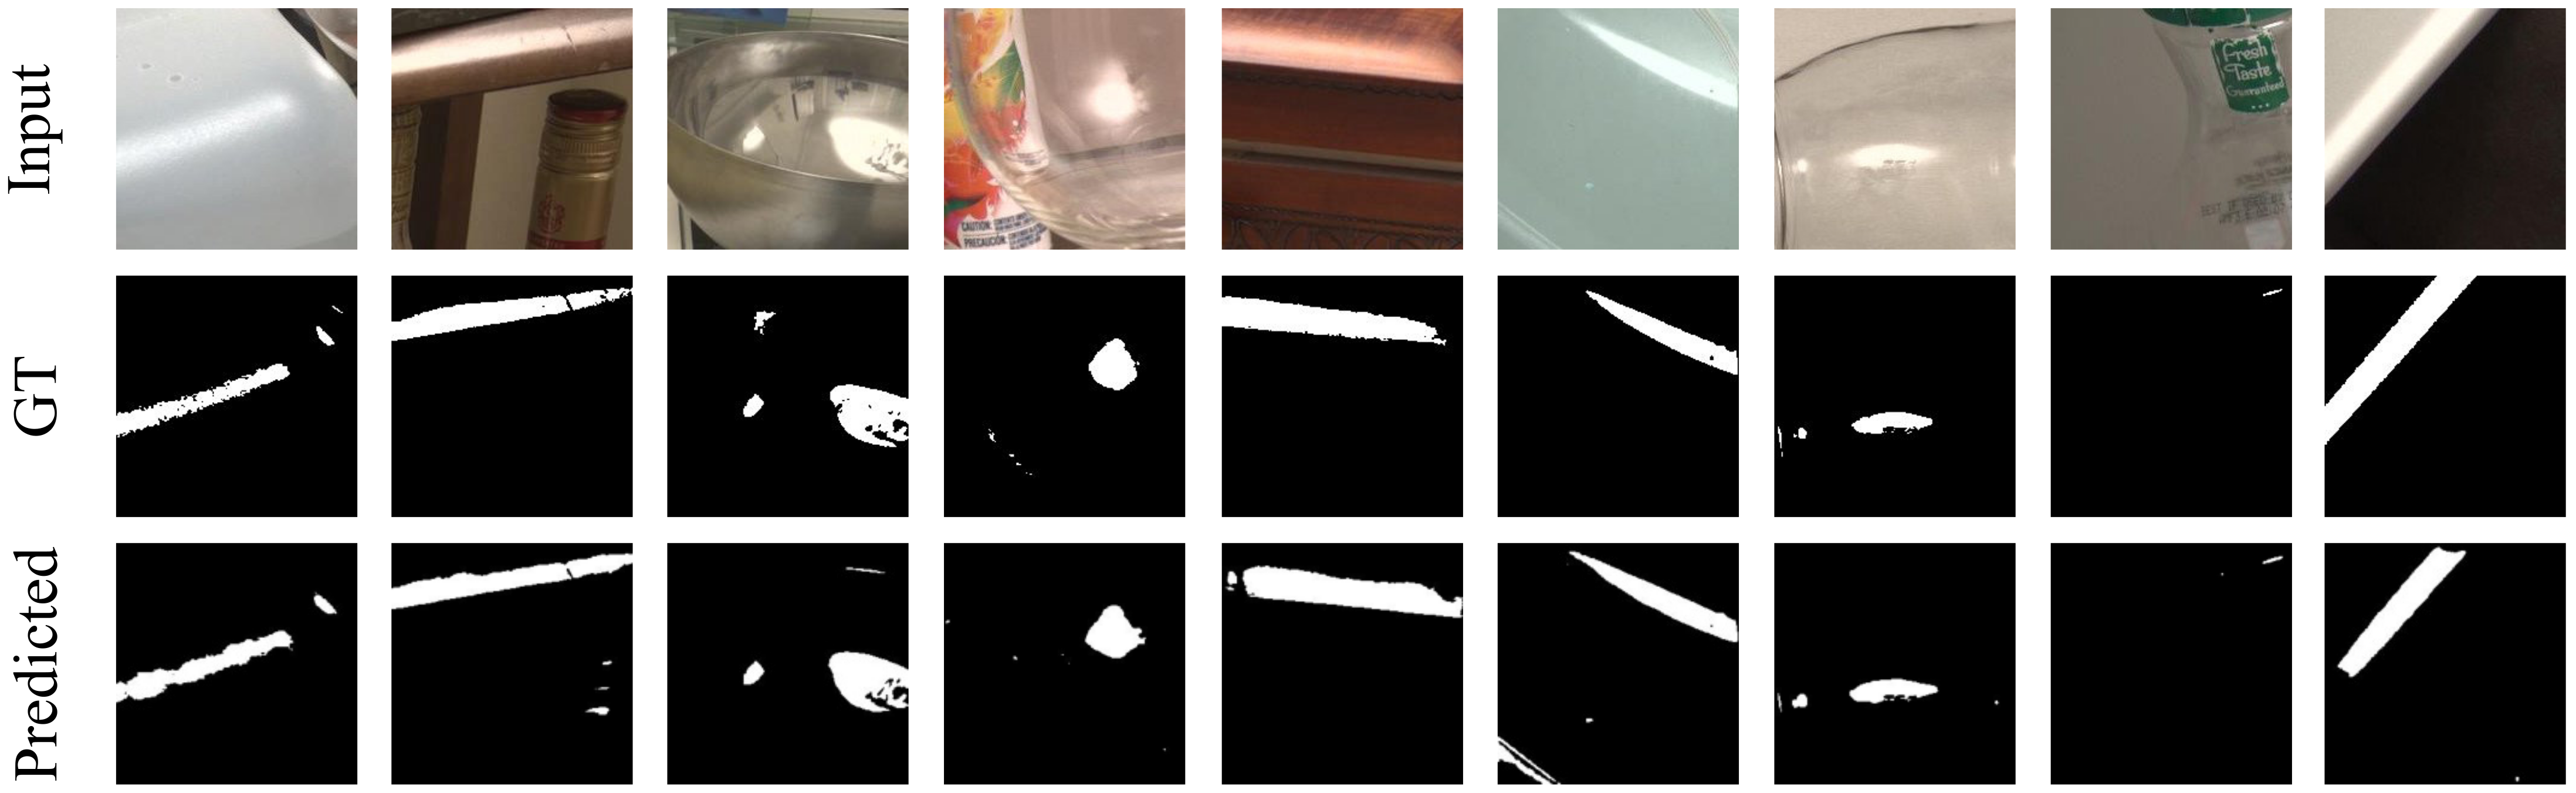
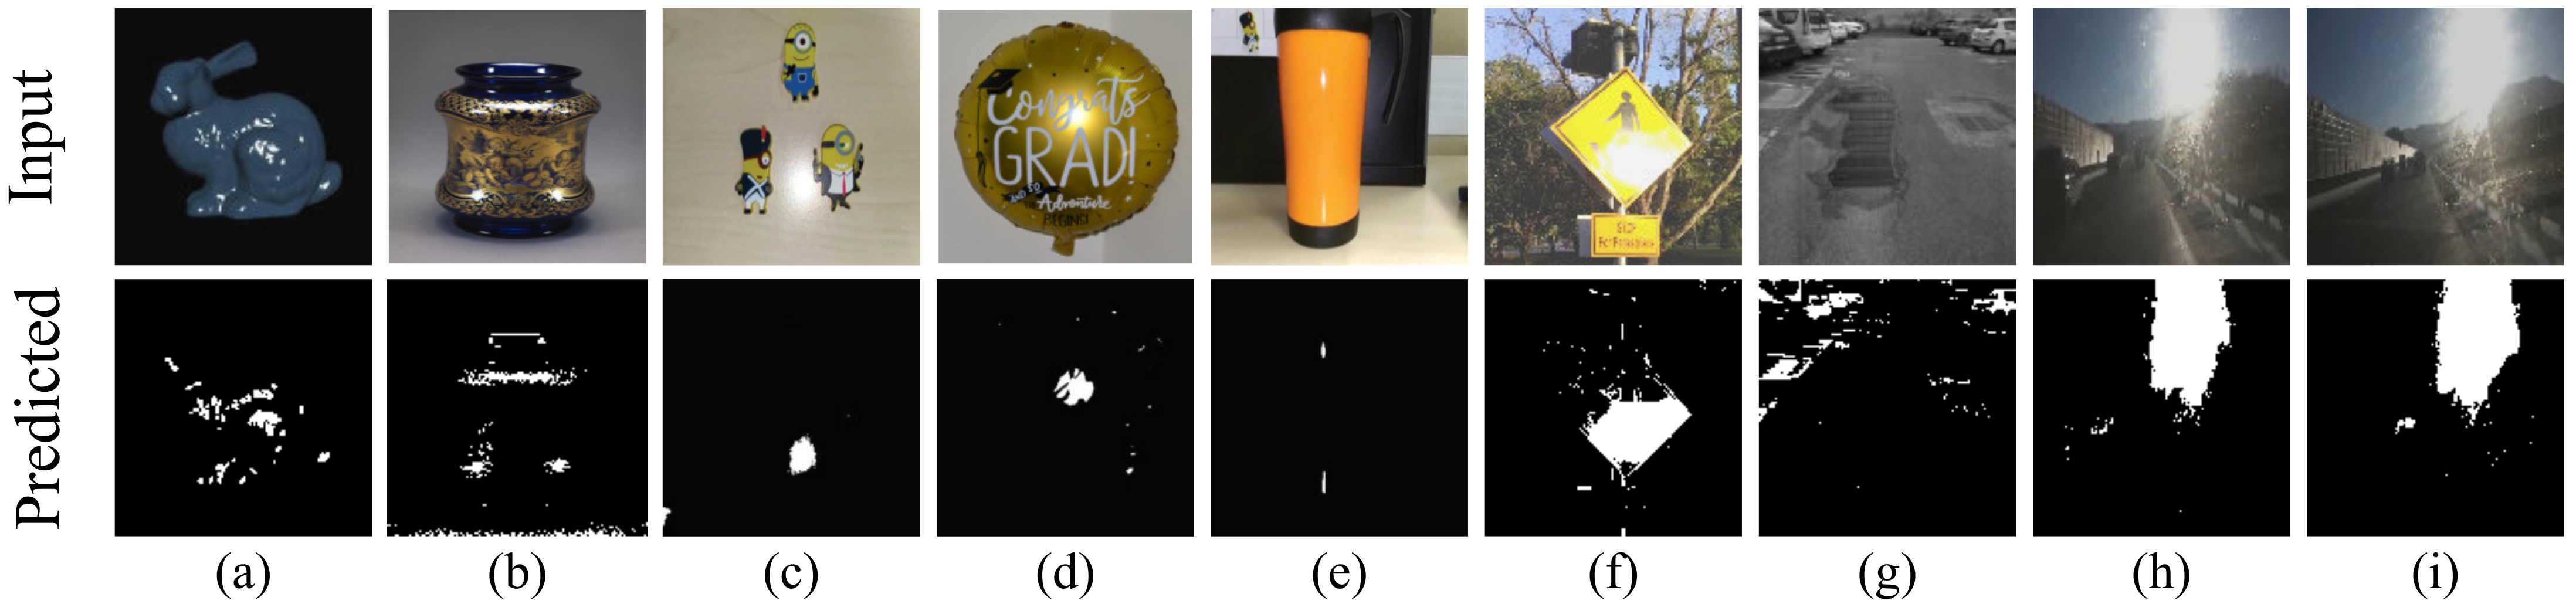
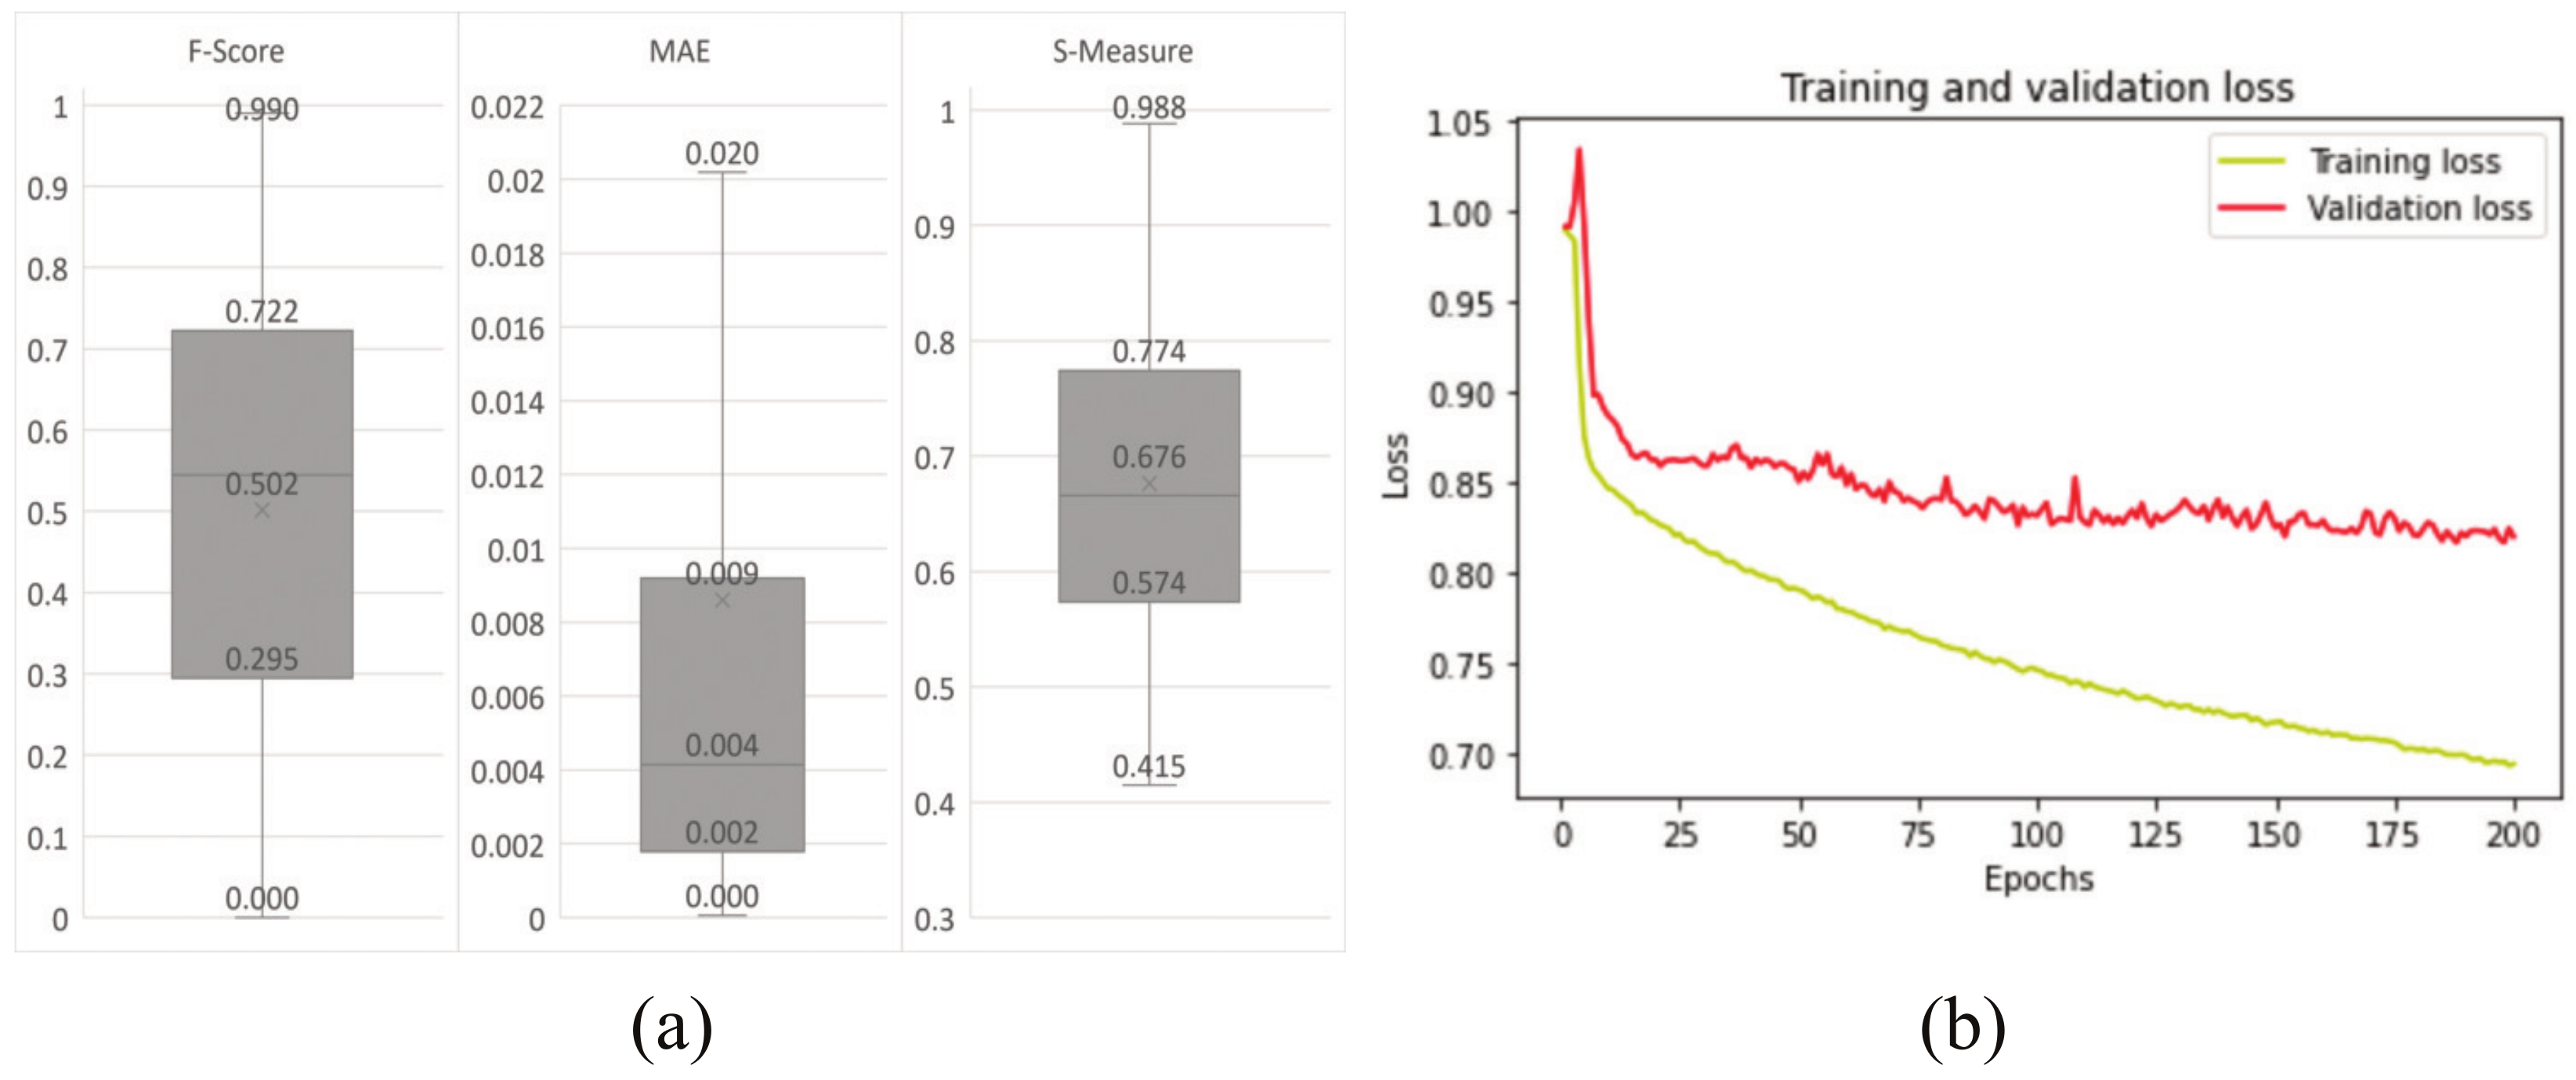
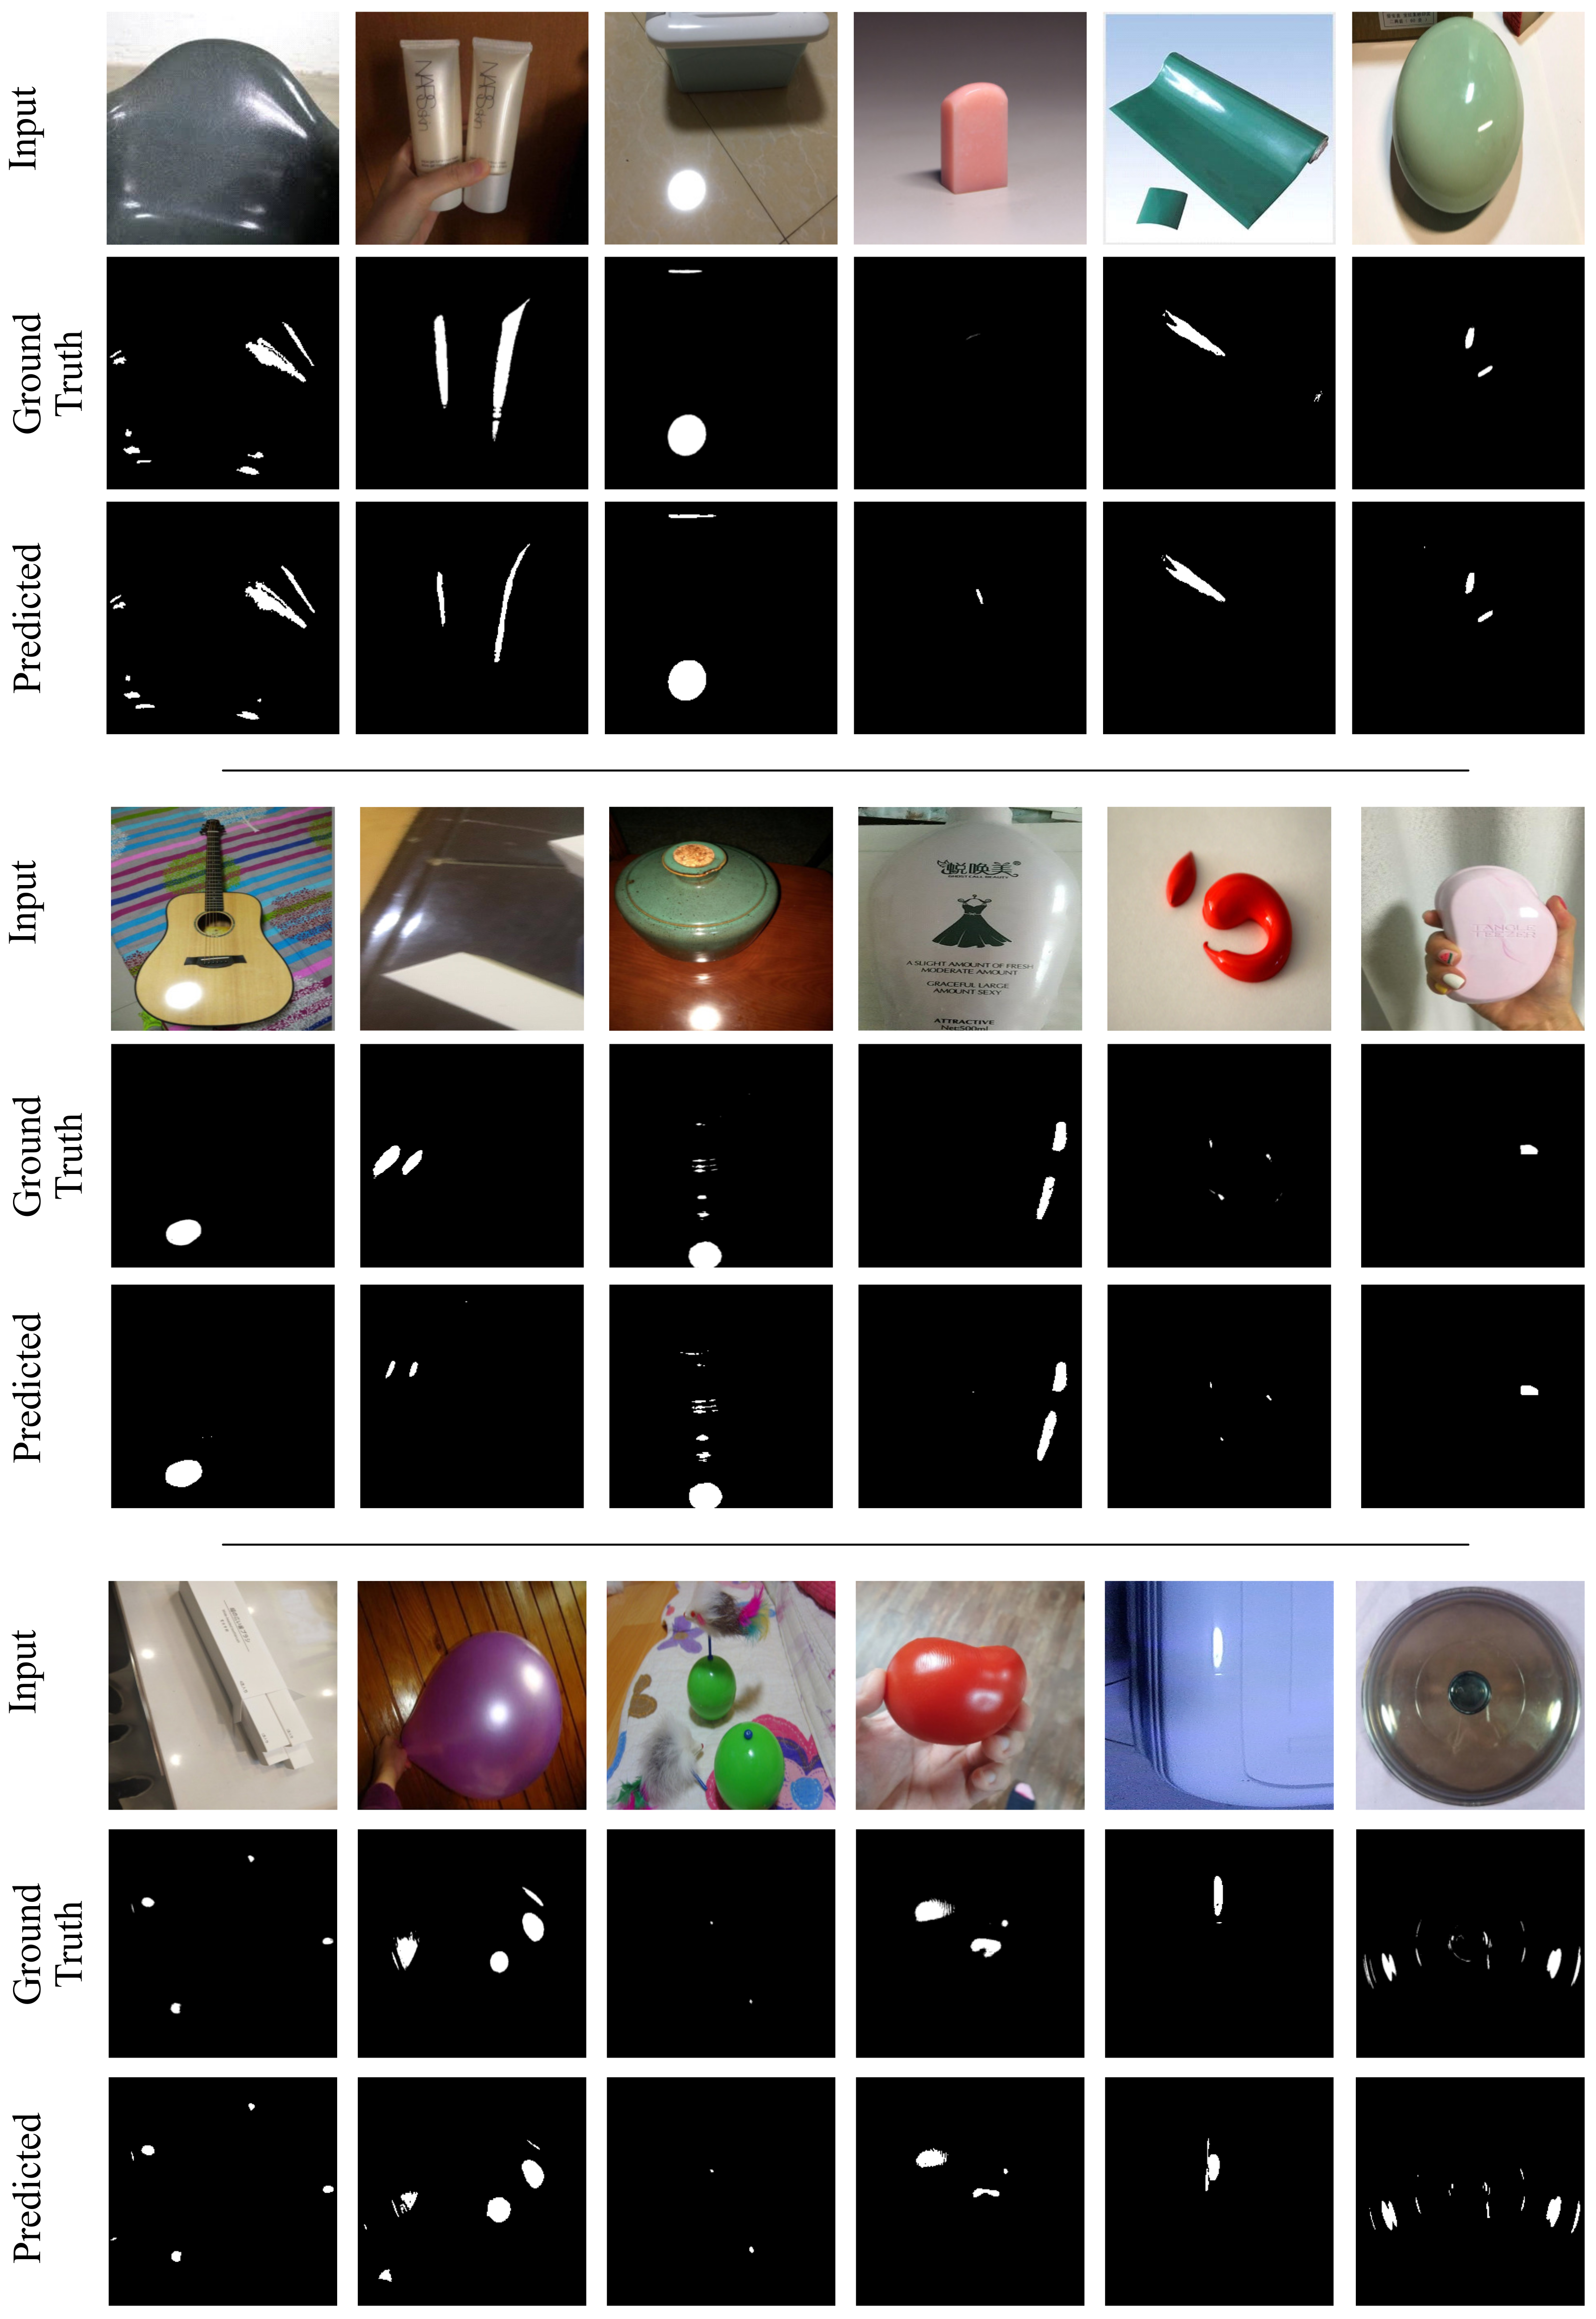
4. Results
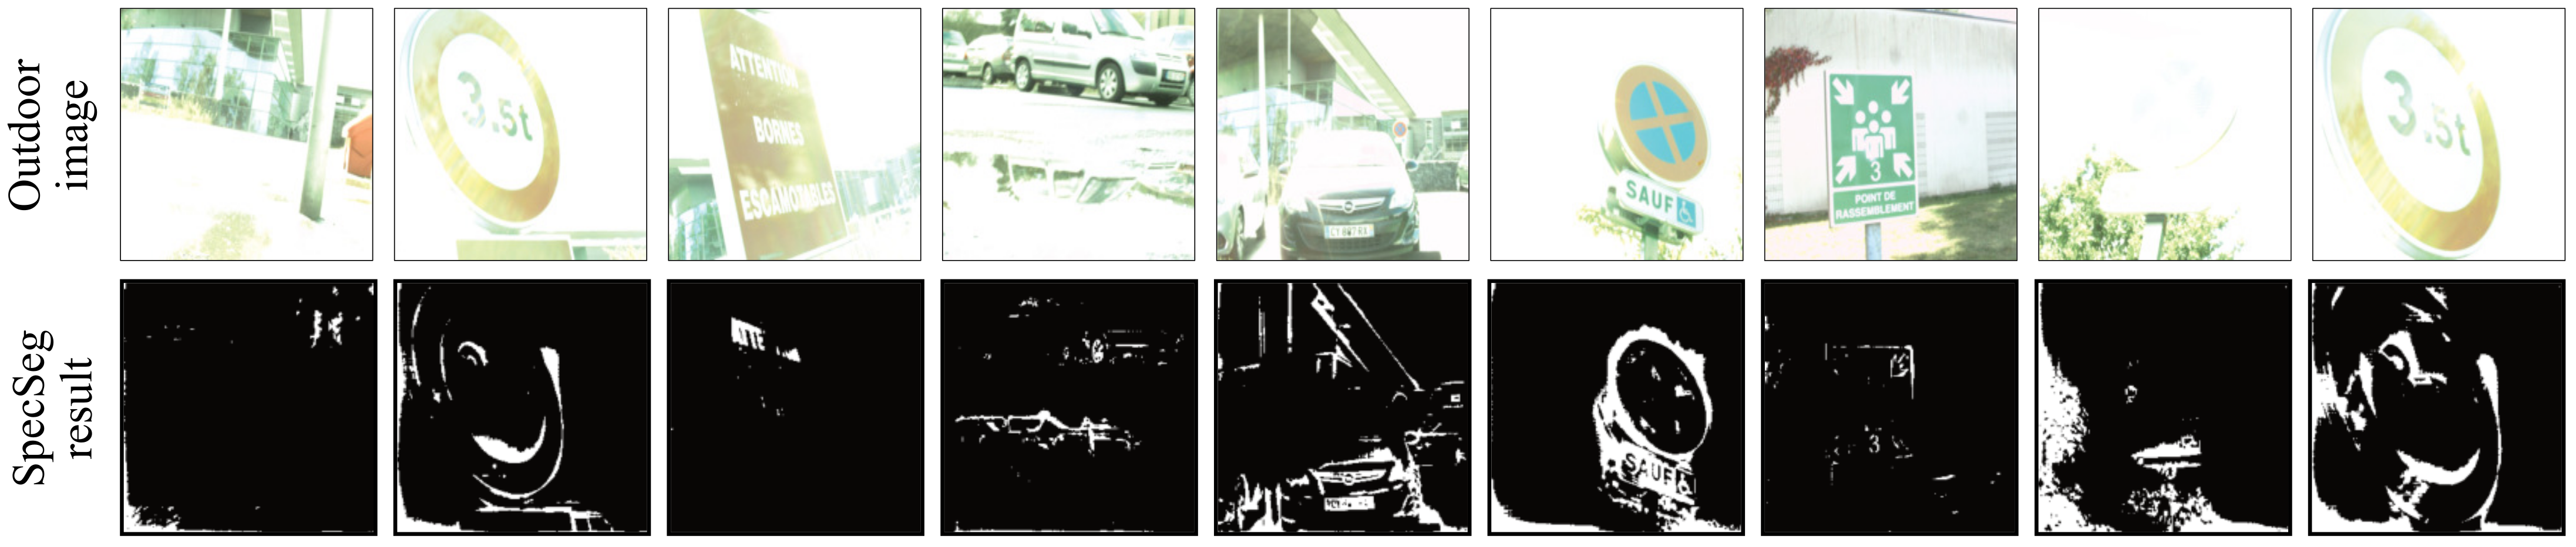
5. Discussions
5.1. Performance Comparison
5.2. Ablation Studies
6. Conclusions and Future Work
Author Contributions
Funding
Institutional Review Board Statement
Informed Consent Statement
Data Availability Statement
Conflicts of Interest
Appendix A. Additional SpecSeg Network Segmentation Results

References
- Klinker, G.J.; Shafer, S.A.; Kanade, T. A Physical Approach to Color Image Understanding. Int. J. Comput. Vis. 1990, 4, 7–38. [Google Scholar] [CrossRef]
- Shafer, S.A. Using Color to Separate Reflection Components. Color Res. Appl. 1985, 10, 210–218. [Google Scholar] [CrossRef]
- Phong, B.T. Illumination for Computer Generated Pictures. Commun. ACM 1975, 18, 311–317. [Google Scholar] [CrossRef]
- Klinker, G.J.; Shafer, S.A.; Kanade, T. The Measurement of Highlights in Color Images. Int. J. Comput. Vis. 1988, 2, 7–32. [Google Scholar] [CrossRef]
- Schlüns, K.; Teschner, M. Analysis of 2D Color Spaces for Highlight Elimination in 3D Shape Reconstruction. In Proceedings of the Asian Conference on Computer Vision II, Singapore, 5–8 December 1995; pp. 801–805. [Google Scholar]
- Bajcsy, R.; Lee, S.W.; Leonardis, A. Detection of Diffuse and Specular Interface Reflections and Inter-Reflections by Color Image Segmentation. Int. J. Comput. Vis. 1996, 17, 241–272. [Google Scholar] [CrossRef]
- Yang, J.; Cai, Z.; Wen, L.; Lei, Z.; Guo, G.; Li, S.Z. A New Projection Space for Separation of Specular-Diffuse Reflection Components in Color Images. In Computer Vision—ACCV 2012; Springer: Berlin/Heidelberg, Germany, 2013; Volume 7727, pp. 418–429. [Google Scholar] [CrossRef]
- Tan, R.; Ikeuchi, K. Separating Reflection Components of Textured Surfaces Using a Single Image. IEEE Trans. Pattern Anal. Mach. Intell. 2005, 27, 178–193. [Google Scholar] [CrossRef]
- Yoon, K.j.; Choi, Y.; Kweon, I.S. Fast Separation of Reflection Components Using a Specularity-Invariant Image Representation. In Proceedings of the 2006 International Conference on Image Processing, Atlanta, GA, USA, 8–11 October 2006; pp. 973–976. [Google Scholar]
- Shen, H.L.; Zhang, H.G.; Shao, S.J.; Xin, J.H. Chromaticity-Based Separation of Reflection Components in a Single Image. Pattern Recognit. 2008, 41, 2461–2469. [Google Scholar] [CrossRef]
- Shen, H.L.; Cai, Q.Y. Simple and Efficient Method for Specularity Removal in an Image. Appl. Opt. 2009, 48, 2711. [Google Scholar] [CrossRef]
- Yang, Q.; Tang, J.; Ahuja, N. Efficient and Robust Specular Highlight Removal. IEEE Trans. Pattern Anal. Mach. Intell. 2015, 37, 1304–1311. [Google Scholar] [CrossRef]
- An, D.; Suo, J.; Ji, X.; Wang, H.; Dai, Q. Fast and High Quality Highlight Removal from A Single Image. arXiv 2015, arXiv:1512.00237. [Google Scholar]
- Umeyama, S.; Godin, G. Separation of Diffuse and Specular Components of Surface Reflection by Use of Polarization and Statistical Analysis of Images. IEEE Trans. Pattern Anal. Mach. Intell. 2004, 26, 639–647. [Google Scholar] [CrossRef] [PubMed]
- Wolff, L.B. Polarization-Based Material Classification from Specular Reflection. IEEE Trans. Pattern Anal. Mach. Intell. 1990, 12, 1059–1071. [Google Scholar]
- Nayar, S.K.; Fang, X.S.; Boult, T. Separation of Reflection Components Using Color and Polarization. Int. J. Comput. Vis. 1997, 21, 163–186. [Google Scholar] [CrossRef]
- Kim, D.W.; Lin, S.; Hong, K.S.; Shum, H.Y. Variational Specular Separation Using Color and Polarization. In Proceedings of the IAPR Conference on Machine Vision Applications (IAPR MVA 2002), Nara-ken New Public Hall, Nara, Japan, 11–13 December 2002; pp. 176–179. [Google Scholar]
- Wen, S.; Zheng, Y.; Lu, F. Polarization Guided Specular Reflection Separation. arXiv 2021, arXiv:2103.11652. [Google Scholar] [CrossRef] [PubMed]
- Akashi, Y.; Okatani, T. Separation of Reflection Components by Sparse Non-Negative Matrix Factorization. Comput. Vis. Image Underst. 2016, 146, 77–85. [Google Scholar] [CrossRef]
- Bochko, V.; Parkkinen, J. Highlight Analysis Using a Mixture Model of Probabilistic PCA. In Proceedings of the 4th WSEAS International Conference on Signal Processing, Robotics and Automation (ISPRA’05), Salzburg, Austria, 13–15 February 2005; World Scientific and Engineering Academy and Society (WSEAS): Stevens Point, WI, USA, 2005. [Google Scholar]
- Guo, J.; Zhou, Z.; Wang, L. Single Image Highlight Removal with a Sparse and Low-Rank Reflection Model. In Proceedings of the Computer Vision—ECCV 2018, Munich, Germany, 8–14 September 2018; Ferrari, V., Hebert, M., Sminchisescu, C., Weiss, Y., Eds.; Springer International Publishing: Cham, Switzerland, 2018; Volume 11208, pp. 282–298. [Google Scholar] [CrossRef]
- Zhang, L.; Hancock, E.R.; Atkinson, G.A. Reflection Component Separation Using Statistical Analysis and Polarisation. In Pattern Recognition and Image Analysis, Proceedings of the 5th Iberian Conference, IbPRIA 2011, Las Palmas de Gran Canaria, Spain, 8–10 June 2011; Vitrià, J., Sanches, J.M.R., Hernández, M., Eds.; Lecture Notes in Computer Science; Springer: Berlin/Heidelberg, Germany, 2011; Volume 6669, pp. 476–483. [Google Scholar] [CrossRef]
- Fu, G.; Zhang, Q.; Song, C.; Lin, Q.; Xiao, C. Specular Highlight Removal for Real-world Images. Comput. Graph. Forum 2019, 38, 253–263. [Google Scholar] [CrossRef]
- Lee, S.W.; Bajcsy, R. Detection of Specularity Using Color and Multiple Views. In Proceedings of the Computer Vision—ECCV’92, Santa Margherita Ligure, Italy, 19–22 May 1992; Sandini, G., Ed.; Lecture Notes in Computer Science. Springer: Berlin/Heidelberg, Germany, 1992; pp. 99–114. [Google Scholar] [CrossRef]
- Wang, H.; Xu, C.; Wang, X.; Zhang, Y.; Peng, B. Light Field Imaging Based Accurate Image Specular Highlight Removal. PLoS ONE 2016, 11, e0156173. [Google Scholar]
- Islam, M.N.; Tahtali, M.; Pickering, M. Specular Reflection Detection and Inpainting in Transparent Object through MSPLFI. Remote Sens. 2021, 13, 455. [Google Scholar] [CrossRef]
- Zhouyu, F.; Tan, R.; Caelli, T. Specular Free Spectral Imaging Using Orthogonal Subspace Projection. In Proceedings of the 18th International Conference on Pattern Recognition (ICPR’06), Hong Kong, China, 20–24 August 2006; pp. 812–815. [Google Scholar] [CrossRef]
- Tan, P.; Quan, L.; Lin, S. Separation of Highlight Reflections on Textured Surfaces. In Proceedings of the 2006 IEEE Computer Society Conference on Computer Vision and Pattern Recognition, New York, NY, USA, 17–22 June 2006; Volume 2, pp. 1855–1860. [Google Scholar]
- Meslouhi, O.; Kardouchi, M.; Allali, H.; Gadi, T.; Benkaddour, Y. Automatic Detection and Inpainting of Specular Reflections for Colposcopic Images. Open Comput. Sci. 2011, 1, 341–354. [Google Scholar] [CrossRef]
- Yang, J.; Liu, L.; Li, S.Z. Separating Specular and Diffuse Reflection Components in the HSI Color Space. In Proceedings of the 2013 IEEE International Conference on Computer Vision Workshops, Sydney, Australia, 1–8 December 2013; pp. 891–898. [Google Scholar]
- Kim, H.; Jin, H.; Hadap, S.; Kweon, I. Specular Reflection Separation Using Dark Channel Prior. In Proceedings of the 2013 IEEE Conference on Computer Vision and Pattern Recognition, Portland, OR, USA, 23–28 June 2013; pp. 1460–1467. [Google Scholar]
- Zou, B.; Zhang, X.; Liao, S.; Wang, L. Specularity Removal Using Dark Channel Prior. J. Inf. Sci. Eng. 2013, 29, 17. [Google Scholar]
- Shah, S.M.A.; Marshall, S.; Murray, P. Removal of Specular Reflections from Image Sequences Using Feature Correspondences. Mach. Vis. Appl. 2017, 28, 409–420. [Google Scholar]
- Yamamoto, T.; Kitajima, T.; Kawauchi, R. Efficient Improvement Method for Separation of Reflection Components Based on an Energy Function. In Proceedings of the 2017 IEEE International Conference on Image Processing (ICIP), Beijing, China, 17–20 September 2017; pp. 4222–4226. [Google Scholar]
- Alsaleh, S.M.; Aviles-Rivero, A.I.; Debroux, N.; Hahn, J.K. Dim the Lights!—Low-Rank Prior Temporal Data for Specular-Free Video Recovery. arXiv 2019, arXiv:1912.07764. [Google Scholar]
- Li, R.; Pan, J.; Si, Y.; Yan, B.; Hu, Y.; Qin, H. Specular Reflections Removal for Endoscopic Image Sequences With Adaptive-RPCA Decomposition. IEEE Trans. Med. Imaging 2020, 39, 328–340. [Google Scholar] [PubMed]
- Son, M.; Lee, Y.; Chang, H.S. Toward Specular Removal from Natural Images Based on Statistical Reflection Models. IEEE Trans. Image Process. 2020, 29, 4204–4218. [Google Scholar] [CrossRef]
- Ramos, V.S. Real-Time Highlight Removal from a Single Image. Master’s Thesis, Federal University of Rio Grande do Norte, Natal, Brazil, 2021. [Google Scholar]
- Haefner, B.; Green, S.; Oursland, A.; Andersen, D.; Goesele, M.; Cremers, D.; Newcombe, R.; Whelan, T. Recovering Real-World Reflectance Properties and Shading From HDR Imagery. In Proceedings of the 2021 International Conference on 3D Vision (3DV), London, UK, 1–3 December 2021; p. 10. [Google Scholar]
- Bonekamp, J. Multi-Image Optimization Based Specular Reflection Removal from Non-Dielectric Surfaces. Master’s Thesis, Delft University of Technology, Delft, The Netherlands, 2021. [Google Scholar]
- Kim, S.; Ra, M.; Kim, W.Y. Specular Detection on Glossy Surface Using Geometric Characteristics of Specularity in Top-View Images. Sensors 2021, 21, 2079. [Google Scholar] [CrossRef]
- Tominaga, S. Spectral-Reflectance Estimation under Multiple Light Sources. Color Imaging Conf. 2021, 2021, 25–30. [Google Scholar]
- Li, B.; Furukawa, T. DRM-Based Colour Photometric Stereo Using Diffuse-Specular Separation for Non-Lambertian Surfaces. J. Imaging 2022, 8, 40. [Google Scholar] [CrossRef]
- Sánchez, F.J.; Bernal, J.; Sánchez-Montes, C.; Miguel, C.R.; Fernández-Esparrach, G. Bright Spot Regions Segmentation and Classification for Specular Highlights Detection in Colonoscopy Videos. Mach. Vis. Appl. 2017, 28, 917–936. [Google Scholar] [CrossRef]
- Akbari, M.; Mohrekesh, M.; Najariani, K.; Karimi, N.; Samavi, S.; Soroushmehr, S.R. Adaptive Specular Reflection Detection and Inpainting in Colonoscopy Video Frames. In Proceedings of the 2018 25th IEEE International Conference on Image Processing (ICIP), Athens, Greece, 7–10 October 2018; pp. 3134–3138. [Google Scholar]
- Lee, S.T.; Yoon, T.H.; Kim, K.S.; Kim, K.D.; Park, W. Removal of Specular Reflections in Tooth Color Image by Perceptron Neural Nets. In Proceedings of the 2010 2nd International Conference on Signal Processing Systems, Dalian, China, 5–7 July 2010; Volume 1, pp. 285–289. [Google Scholar]
- Funke, I.; Bodenstedt, S.; Riediger, C.; Weitz, J.; Speidel, S. Generative Adversarial Networks for Specular Highlight Removal in Endoscopic Images. In Medical Imaging 2018: Image-Guided Procedures, Robotic Interventions, and Modeling; Webster, R.J., Fei, B., Eds.; SPIE: Houston, TX, USA, 2018; p. 3. [Google Scholar] [CrossRef]
- Fu, G.; Zhang, Q.; Lin, Q.; Zhu, L.; Xiao, C. Learning to Detect Specular Highlights from Real-World Images. In Proceedings of the 28th ACM International Conference on Multimedia, Seattle, WA, USA, 12–16 October 2020; pp. 1873–1881. [Google Scholar]
- Fu, G.; Zhang, Q.; Zhu, L.; Li, P.; Xiao, C. A Multi-Task Network for Joint Specular Highlight Detection and Removal. In Proceedings of the 2021 IEEE/CVF Conference on Computer Vision and Pattern Recognition (CVPR), Nashville, TN, USA, 19–25 June 2021; pp. 7748–7757. [Google Scholar]
- Monkam, P.; Wu, J.; Lu, W.; Shan, W.; Chen, H.; Zhai, Y. EasySpec: Automatic Specular Reflection Detection and Suppression from Endoscopic Images. IEEE Trans. Comput. Imaging 2021, 7, 1031–1043. [Google Scholar] [CrossRef]
- Ronneberger, O.; Fischer, P.; Brox, T. U-Net: Convolutional Networks for Biomedical Image Segmentation. arXiv 2015, arXiv:1505.04597. [Google Scholar]
- He, K.; Zhang, X.; Ren, S.; Sun, J. Identity Mappings in Deep Residual Networks. arXiv 2016, arXiv:1603.05027. [Google Scholar]
- Alsallakh, B.; Kokhlikyan, N.; Miglani, V.; Yuan, J.; Reblitz-Richardson, O. Mind the Pad—CNNs Can Develop Blind Spots. arXiv 2020, arXiv:2010.02178. [Google Scholar]
- Chollet, F. Deep Learning with Python, 2nd ed.; Manning Publications: Shelter Island, Hong Kong, 2021. [Google Scholar]
- Milletari, F.; Navab, N.; Ahmadi, S.A. V-Net: Fully Convolutional Neural Networks for Volumetric Medical Image Segmentation. arXiv 2016, arXiv:1606.04797. [Google Scholar]
- Lin, T.Y.; Goyal, P.; Girshick, R.; He, K.; Dollár, P. Focal Loss for Dense Object Detection. arXiv 2018, arXiv:1708.02002. [Google Scholar]
- Wu, Z.; Zhuang, C.; Shi, J.; Guo, J.; Xiao, J.; Zhang, X.; Yan, D.M. Single-Image Specular Highlight Removal via Real-World Dataset Construction. IEEE Trans. Multimed. 2022, 24, 3782–3793. [Google Scholar] [CrossRef]
- Park, J.B.; Kak, A.C. A Truncated Least Squares Approach to the Detection of Specular Highlights in Color Images. In Proceedings of the 2003 IEEE International Conference on Robotics and Automation, ICRA 2003, Taipei, Taiwan, 14–19 September 2003; pp. 1397–1403. [Google Scholar] [CrossRef] [Green Version]
- Bernal, J.; Sánchez, F.J.; Fernández-Esparrach, G.; Gil, D.; Rodríguez, C.; Vilariño, F. WM-DOVA Maps for Accurate Polyp Highlighting in Colonoscopy: Validation vs. Saliency Maps from Physicians. Comput. Med. Imaging Graph. 2015, 43, 99–111. [Google Scholar] [CrossRef]
- Blanchon, M.; Sidibe, D.; Morel, O.; Seulin, R.; Braun, D.; Meriaudeau, F.; Evry, U.; Paris-Saclay, U. Polarimetric Image Augmentation. In Proceedings of the 2020 25th International Conference on Pattern Recognition (ICPR), Milan, Italy, 10–15 January 2021; p. 9. [Google Scholar] [CrossRef]
- Wang, X.; Tao, C.; Tao, X.; Zheng, Z. SIHRNet: A Fully Convolutional Network for Single Image Highlight Removal with a Real-World Dataset. J. Electron. Imaging 2022, 31, 033013. [Google Scholar] [CrossRef]
- Fan, D.P.; Cheng, M.M.; Liu, Y.; Li, T.; Borji, A. Structure-Measure: A New Way to Evaluate Foreground Maps. In Proceedings of the IEEE International Conference on Computer Vision, Venice, Italy, 22–29 October 2017. [Google Scholar]
- Stanford Bunny. The Stanford 3D Scanning Repository. Available online: https://graphics.stanford.edu/data/3Dscanrep/ (accessed on 22 August 2022).
- Unidentified, Vase, 1800–1900, Glass, Smithsonian American Art Museum, Gift of John Gellatly, 1929.8.461. Smithsonian American Art Museum. Available online: https://americanart.si.edu/artwork/vase-30571 (accessed on 22 August 2022).
- Rezaei, M.; Terauchi, M. Vehicle Detection Based on Multi-Feature Clues and Dempster-Shafer Fusion Theory. In Image and Video Technology; Klette, R., Rivera, M., Satoh, S., Eds.; Springer: Berlin/Heidelberg, Germany, 2014; pp. 60–72. [Google Scholar]
- Tchoulack, S.; Pierre Langlois, J.; Cheriet, F. A Video Stream Processor for Real-Time Detection and Correction of Specular Reflections in Endoscopic Images. In Proceedings of the 2008 Joint 6th International IEEE Northeast Workshop on Circuits and Systems and TAISA Conference, Montreal, QC, Canada, 22–25 June 2008; pp. 49–52. [Google Scholar]
- Chen, L.C.; Zhu, Y.; Papandreou, G.; Schroff, F.; Adam, H. Encoder-Decoder with Atrous Separable Convolution for Semantic Image Segmentation. arXiv 2018, arXiv:1802.02611. [Google Scholar]
- Zhang, W.; Zhao, X.; Morvan, J.M.; Chen, L. Improving Shadow Suppression for Illumination Robust Face Recognition. IEEE Trans. Pattern Anal. Mach. Intell. 2019, 41, 611–624. [Google Scholar]
- Hou, Q.; Cheng, M.M.; Hu, X.; Borji, A.; Tu, Z.; Torr, P.H.S. Deeply Supervised Salient Object Detection with Short Connections. IEEE Trans. Pattern Anal. Mach. Intell. 2019, 41, 815–828. [Google Scholar] [CrossRef]
- Zheng, Q.; Qiao, X.; Cao, Y.; Lau, R.W. Distraction-Aware Shadow Detection. In Proceedings of the IEEE Conference on Computer Vision and Pattern Recognition (CVPR), Long Beach, CA, USA, 16–20 June 2019. [Google Scholar]
- Hu, X.; Fu, C.W.; Zhu, L.; Qin, J.; Heng, P.A. Direction-Aware Spatial Context Features for Shadow Detection and Removal. IEEE Trans. Pattern Anal. Mach. Intell. 2020, 42, 2795–2808. [Google Scholar] [PubMed] [Green Version]


| Name | Year | Category 1,2 | Technique | Color Space |
|---|---|---|---|---|
| Bajcsy et al. [6] | 1996 | Segmentation | Segmentation by Hue, Saturation | S-space |
| Umeyama et al. [14] | 2004 | Separation | Polarisation, ICA | Greyscale |
| Tan et al. [8] | 2005 | Separation | Chromaticity, Colour Spaces | RGB |
| Tan et al. [28] | 2006 | Separation | Spatial Colour Distributions | RGB |
| Shen et al. [10] | 2008 | Separation | Chromaticity based | RGB |
| Shen et al. [11] | 2009 | Separation | Pixel clustering | RGBD |
| Mesloushi et al. [29] | 2011 | Segmentation | Chromaticity | CIE XYZ |
| Yang et al. [30] | 2013 | Separation | Region growing algorithm | HSI |
| Kim et al. [31] | 2013 | Segmentation | Dark Channel Prior | RGB |
| Zou et al. [32] | 2013 | Segmentation | Dark Channel Prior | RGB |
| Akashi et al. [19] | 2016 | Segmentation | NMF | RGB |
| Shah et al. [33] | 2017 | Segmentation | SIFT in sequential images | RGB |
| Yamamoto et al. [34] | 2017 | Separation | SVD, Energy minimisation | RGB |
| Alsaleh et al. [35] | 2019 | Separation | Low-Rank Temporal Data | RGB |
| Fu et al. [23] | 2019 | Separation | Optimisation | RGB |
| Li et al. [36] | 2020 | Separation | RPCA | RGB |
| Son et al. [37] | 2020 | Separation | convex optimisation | RGB |
| Ramos et al. [38] | 2021 | Separation | histogram matching | YCbCr |
| Haefner et al. [39] | 2021 | Separation | HDR Imaging for separation | RGB |
| Bonekamp et al. [40] | 2021 | Separation | Multi-Image Optimisation | RGB |
| Kim et al. [41] | 2021 | Segmentation | Geometric estimation | RGB |
| Ramos et al. [38] | 2021 | Separation | histogram matching | YCbCr |
| Tominaga et al. [42] | 2021 | Segmentation | Iterative estimation process | RGB |
| Wen et al. [18] | 2021 | Separation | Polarisation | RGB |
| Li Furukawa [43] | 2022 | Separation | RPCA, Photometric Stereo | RGB |
| Name | Year | Category 1,2 | Application 3 | Architecture | Loss Functions | Evaluation |
|---|---|---|---|---|---|---|
| Lee et al. [46] | 2010 | Segmentation, Mitigation | Real-world | Single layer perceptron | - | - |
| Sanchez et al. [44] | 2017 | Segmentation | MIS | SVM | - | DICE |
| Akbari et al. [45] | 2018 | Segmentation | MIS | SVM | - | DICE, Specificity, Precision |
| Funke et al. [47] | 2018 | Segmentation, Mitigation | MIS | SpecGAN | Cyclic loss | MSE PSNR, SSIM |
| Fu et al. [48] | 2020 | Segmentation | Real-world | SHDNet | BCE, IOUE | F-measure, MAE, S-measure |
| Fu et al. [49] | 2021 | Segmentation, Mitigation | Real-world | JSHDR | BCE, L2 | Accuracy, BER |
| Monkam et al. [50] | 2021 | Segmentation, Mitigation | MIS | Scaled-UNet, GatedResUNet | Mask loss, Valid loss, Perceptual loss, Style loss, Total variation loss | SNR, DICE, SSIM, IoU |
| Dataset Name | Year | Category | Total Images | Specular Mask | Diffuse Image | Test-Train Split | Size |
|---|---|---|---|---|---|---|---|
| Spec-DB [58] | 2003 | Real-world | 300 | ✓ | ✓ | ✗ | 10 MB |
| CVC-ClinicDB [59] | 2015 | Medical Imaging | 612 | ✓ | ✗ | ✗ | 263 MB |
| CVC-ClinicSpec [44] | 2017 | Medical Imaging | 59 | ✓ | ✗ | ✗ | 6 MB |
| Whu Specular [48] 1 | 2020 | Real-world | 4310 | ✓ | ✗ | ✓ | 2 GB |
| PolaBot [60] | 2020 | Real-world | 177 | ✓ | ✗ | ✗ | 584 MB |
| Specular Highlight Image Quadruples (SHIQ) [49] 2 | 2021 | Real-world | 16,000 | ✓ | ✗ | ✓ | 10.8 GB |
| 2022 SIHR [61] | 2022 | Real-world | 200 | ✗ | ✓ | ✓ | 503 MB |
| Metrics | Year | Type | S-m1 | meanF 1 | MAE 2 |
|---|---|---|---|---|---|
| Tchoulack et al. [66] | 2008 | Classical | 0.132 | 0.027 | 0.423 |
| Chen et al. [67] | 2018 | Deep learning | 0.619 | 0.451 | 0.019 |
| Zhang et al. [68] | 2019 | Classical | 0.521 | 0.410 | 0.021 |
| Hou et al. [69] | 2019 | Classical | 0.491 | 0.218 | 0.053 |
| Zheng et al. [70] | 2019 | Deep learning | 0.480 | 0.202 | 0.049 |
| Hu et al. [71] | 2020 | Deep learning | 0.412 | 0.108 | 0.091 |
| Fu et al. [48] | 2020 | Deep learning | 0.793 | 0.676 | 0.006 |
| SpecSeg | 2022 | Deep Learning | 0.676 | 0.502 | 0.008 |
| Author | Network | GPU | Epochs | Training Time | Inference Time |
|---|---|---|---|---|---|
| Monkam et al. [50] | ScaledUNet | GTX 2080Ti | 50 | - | 3.43 ms |
| Ronneberger et al. [51] | UI-Net | NVidia Titan | - | 10 h | 14.13 |
| Fu et al. [48] | SHDNet | GTX1080Ti | 100 | 80 h | - |
| Fu et al. [49] | JSHDR | GTX 2080Ti | 100 | 3 days | - |
| Ours | SpecSeg | Nvidia P100 | 140 | 40 min | 3.1 ms |
| PSNR ↑ | SSIM ↑ | MSE ↓ | F_m ↑ | S_m ↑ | |
|---|---|---|---|---|---|
| No BN | 23.7213 | 0.9539 | 0.0092 | 0.4662 | 0.6643 |
| BN + SparseCE loss | 25.2064 | 0.9628 | 0.0076 | 0.5072 | 0.6598 |
| Elu Activation | 21.9828 | 0.9494 | 0.0122 | 0.4308 | 0.6138 |
| Linear Activation | 24.0415 | 0.9609 | 0.0092 | 0.0067 | 0.5214 |
| Baseline (BN + LReLU + ) | 25.2211 | 0.9625 | 0.0073 | 0.5278 | 0.6761 |
Publisher’s Note: MDPI stays neutral with regard to jurisdictional claims in published maps and institutional affiliations. |
© 2022 by the authors. Licensee MDPI, Basel, Switzerland. This article is an open access article distributed under the terms and conditions of the Creative Commons Attribution (CC BY) license (https://creativecommons.org/licenses/by/4.0/).
Share and Cite
Anwer, A.; Ainouz, S.; Saad, M.N.M.; Ali, S.S.A.; Meriaudeau, F. SpecSeg Network for Specular Highlight Detection and Segmentation in Real-World Images. Sensors 2022, 22, 6552. https://doi.org/10.3390/s22176552
Anwer A, Ainouz S, Saad MNM, Ali SSA, Meriaudeau F. SpecSeg Network for Specular Highlight Detection and Segmentation in Real-World Images. Sensors. 2022; 22(17):6552. https://doi.org/10.3390/s22176552
Chicago/Turabian StyleAnwer, Atif, Samia Ainouz, Mohamad Naufal Mohamad Saad, Syed Saad Azhar Ali, and Fabrice Meriaudeau. 2022. "SpecSeg Network for Specular Highlight Detection and Segmentation in Real-World Images" Sensors 22, no. 17: 6552. https://doi.org/10.3390/s22176552
APA StyleAnwer, A., Ainouz, S., Saad, M. N. M., Ali, S. S. A., & Meriaudeau, F. (2022). SpecSeg Network for Specular Highlight Detection and Segmentation in Real-World Images. Sensors, 22(17), 6552. https://doi.org/10.3390/s22176552