
Automated Detection of Myocardial Infarction and Heart Conduction Disorders Based on Feature Selection and a Deep Learning Model

 ,
,  , , ,
, , ,  ,
,  and
and
Abstract
:1. Introduction
- Coronary artery disease.
- Hypoxia.
- Taking drugs or certain toxic chemicals, such as cocaine.
Related Work and Motivation
- Misclassification in some high-inter-class-imbalance cases.
- Increasing the data over-fitting as a result of depleting the datasets, which reduces detection accuracy and, particularly, sensitivity.
- Obtaining low accuracy when implementing these methods in real-time applications.
- Requiring the detection of the QRS complex.
- Using complex signal processing methods and inefficient MI detection methods.
- The deep features are extracted from the fine-tuned CNN architecture, which eliminates the requirement of handcrafted feature extraction techniques. The whole end-to-end system can also be called explainable artificial intelligence (XAI).
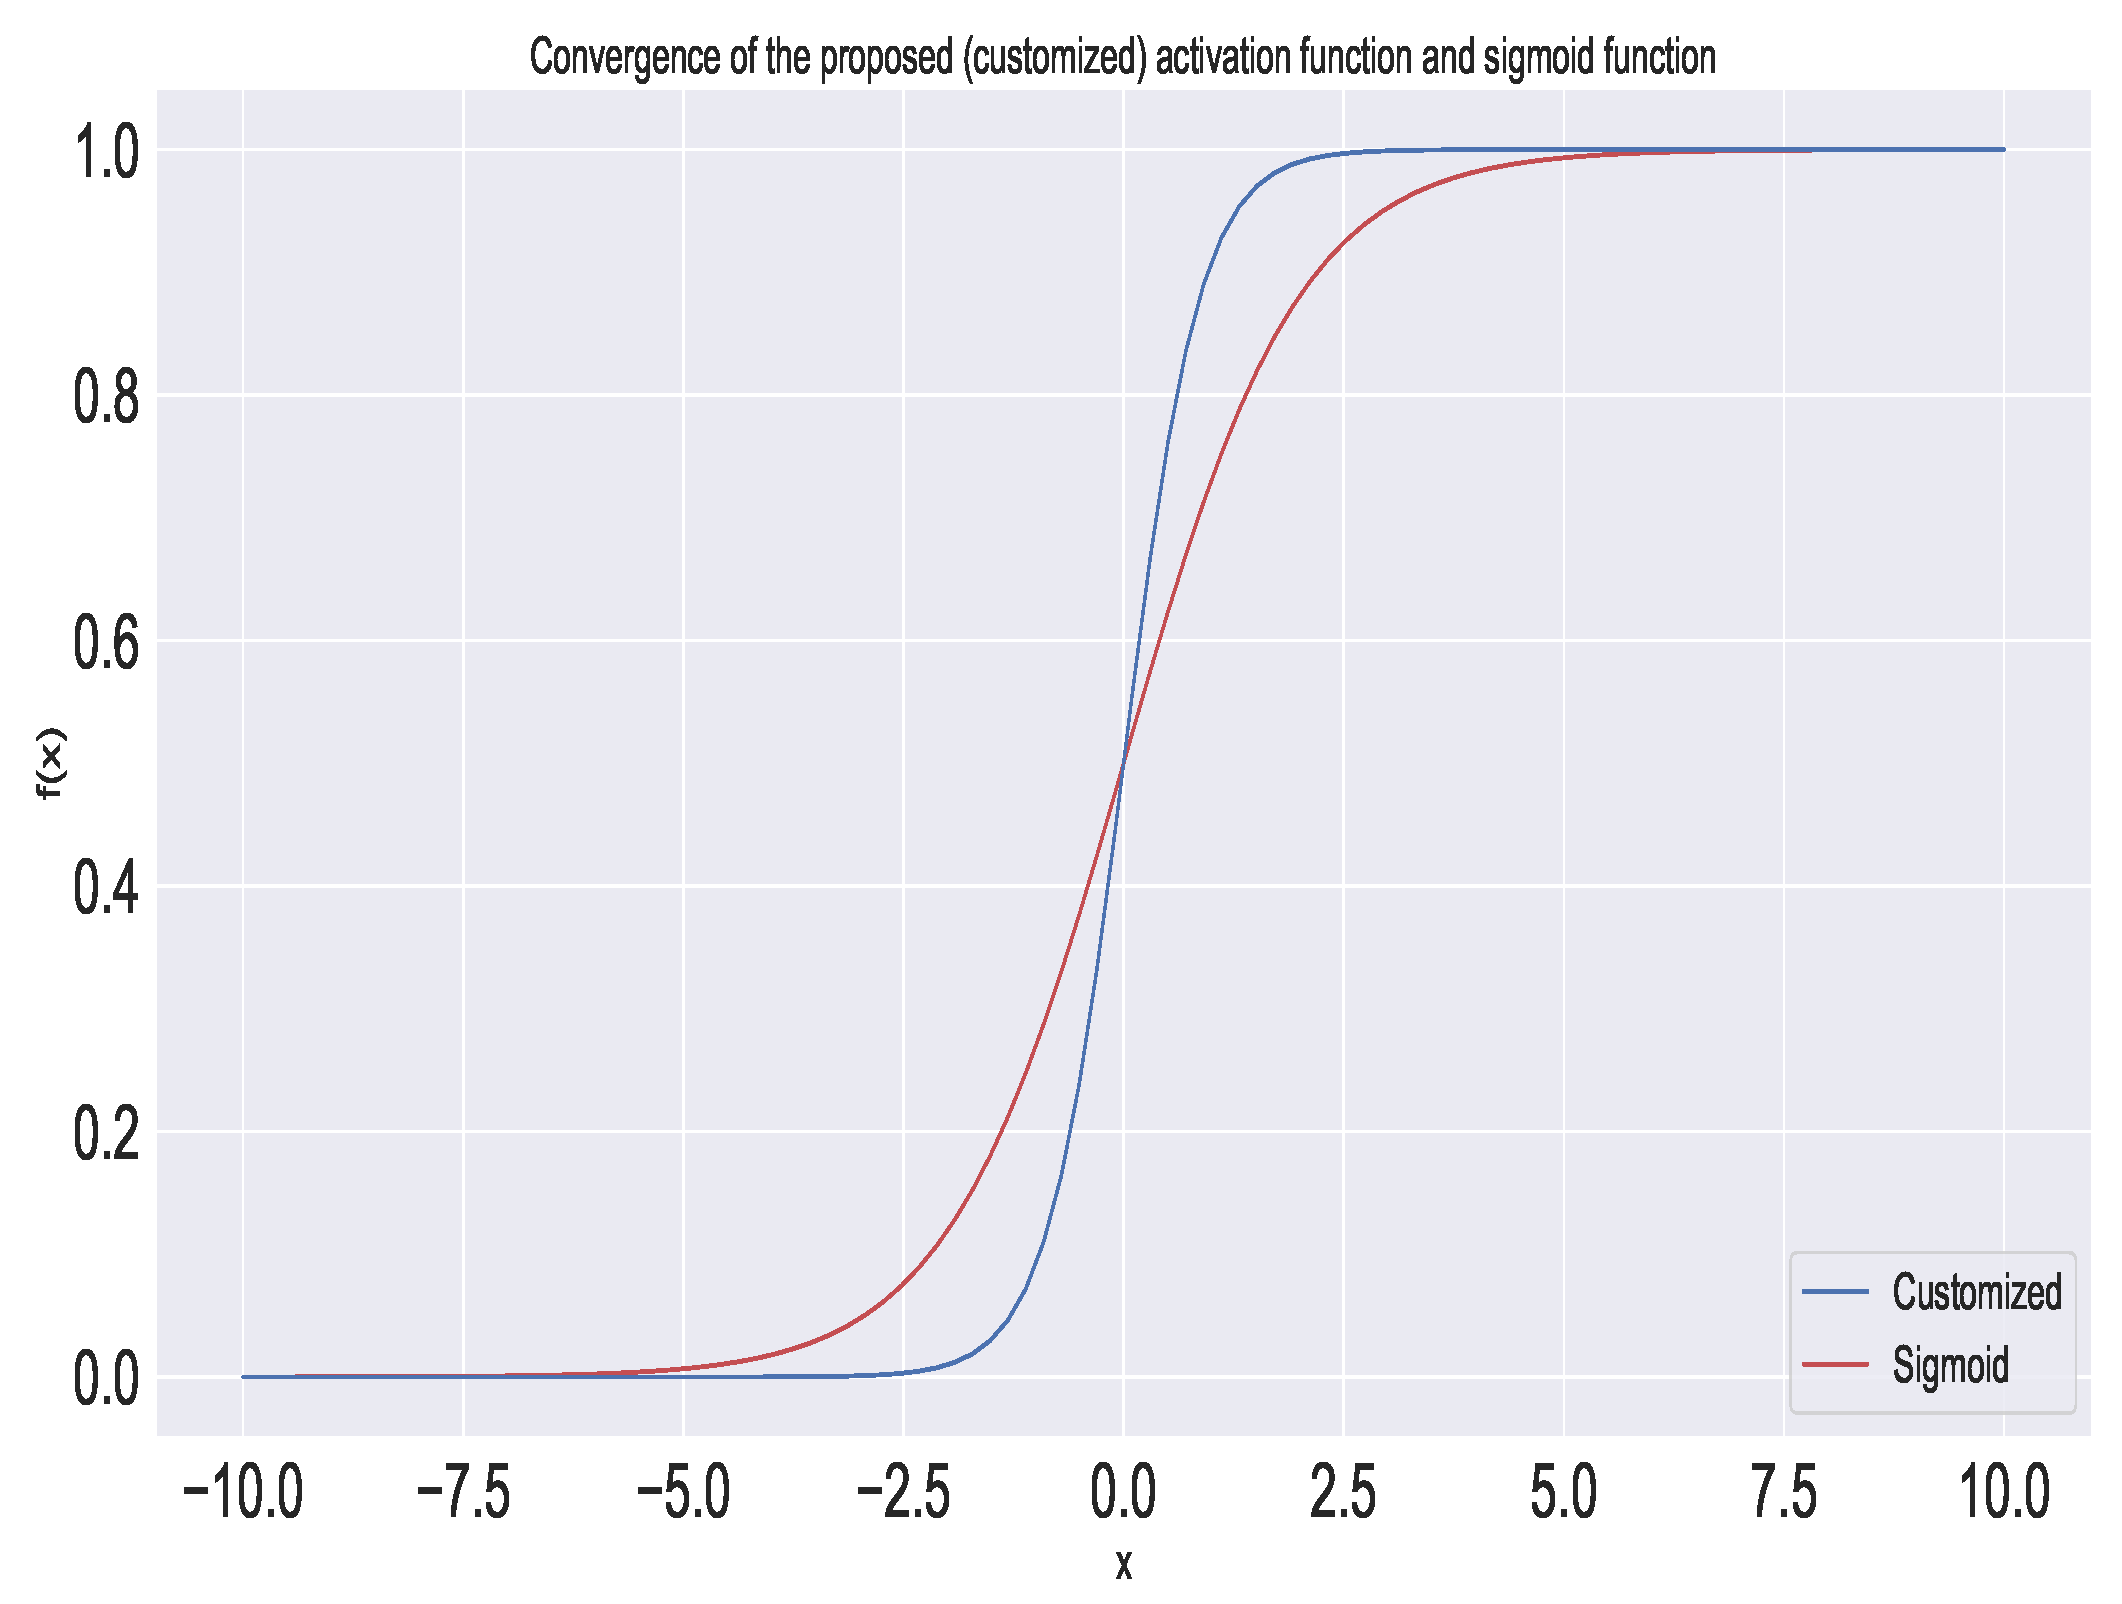
- A new customized activation function is designed and the convergence of the function is tested through experimentation. The proposed activation function is fast compared to the regular activation functions, such as the sigmoid function.
- The network is validated on a large publicly available dataset, i.e., PTB-XL, which allows the detection of crucial cardiac disorders, such as MI, CD, HYP, and STTC. This is the major contribution of the work, as more than 90% of the literature is based only on MIT-BIH and PTB.
- The proposed algorithm is able to achieve good results in classification tasks, which is an important component of the development of automated computer-aided systems for the detection of MI and CDs. The proposed method allows the user to understand the cause of the decision of the machine learning by analyzing feature maps extracted by the deep learning algorithm.
- The proposed end-to-end ECG beat classification system enables human users to understand and effectively manage emerging decisions in intensive care units (ICUs).
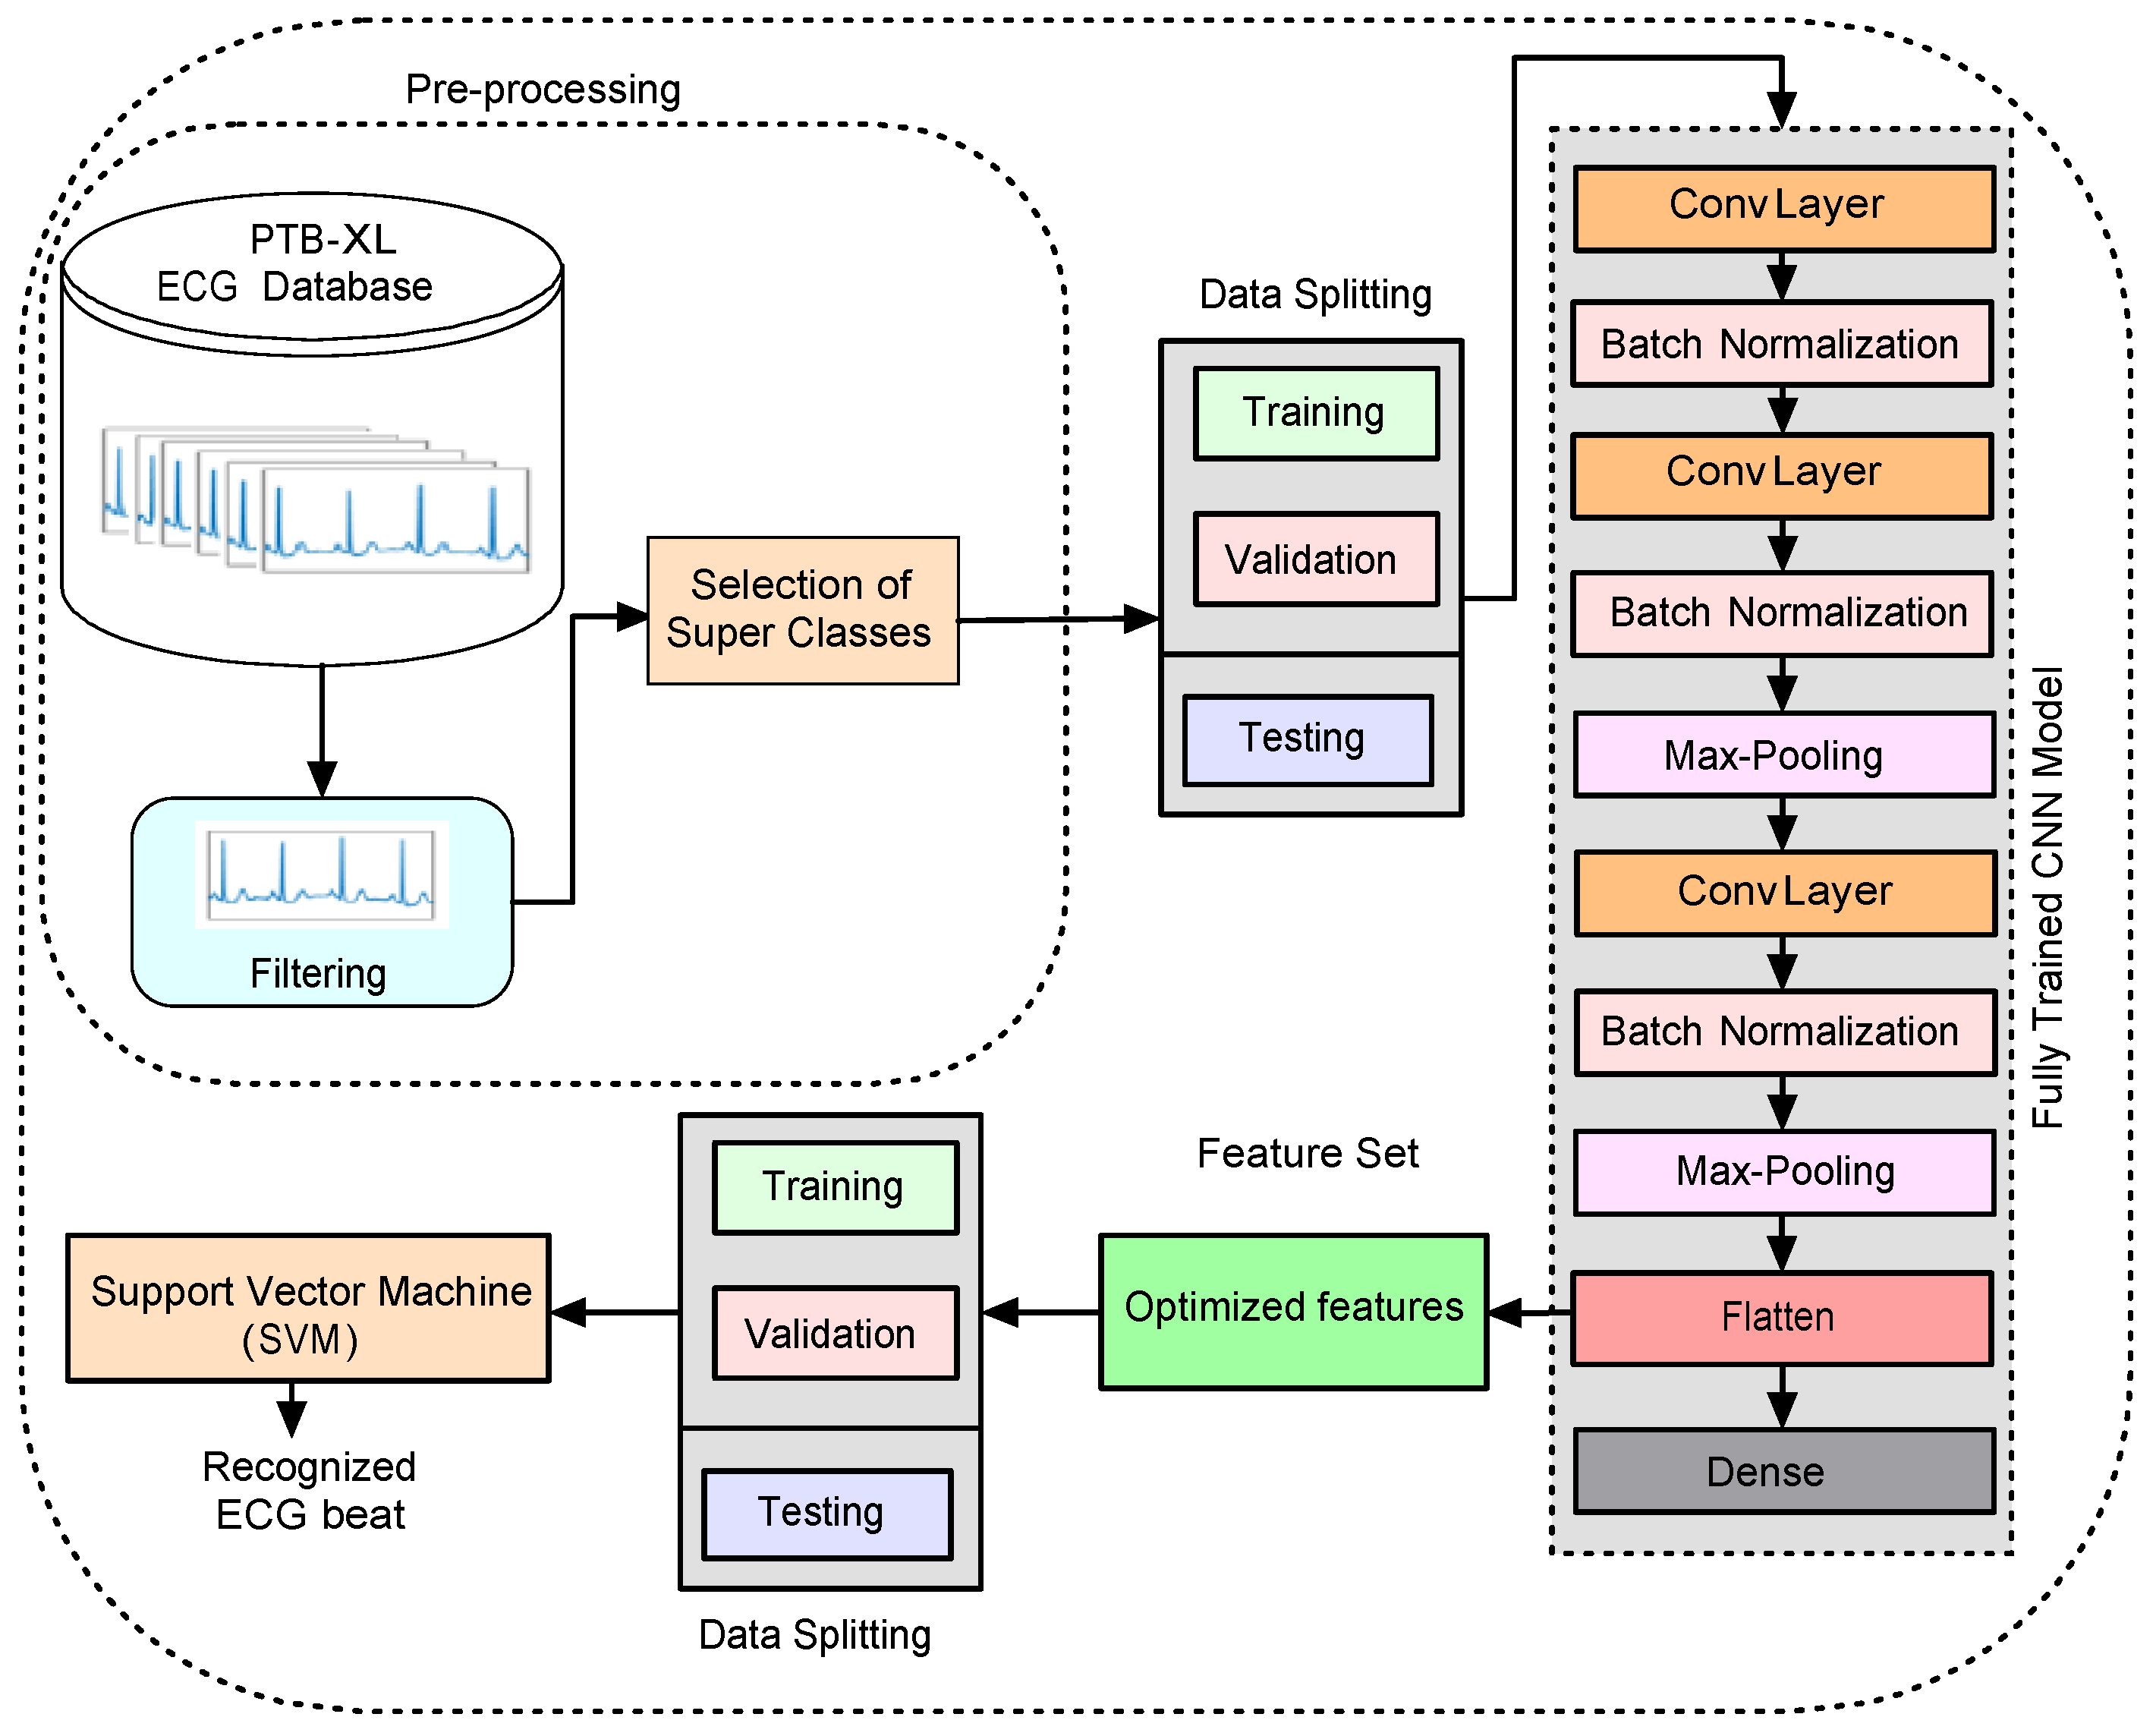
2. Methodology and Dataset
2.1. ECG Dataset Description
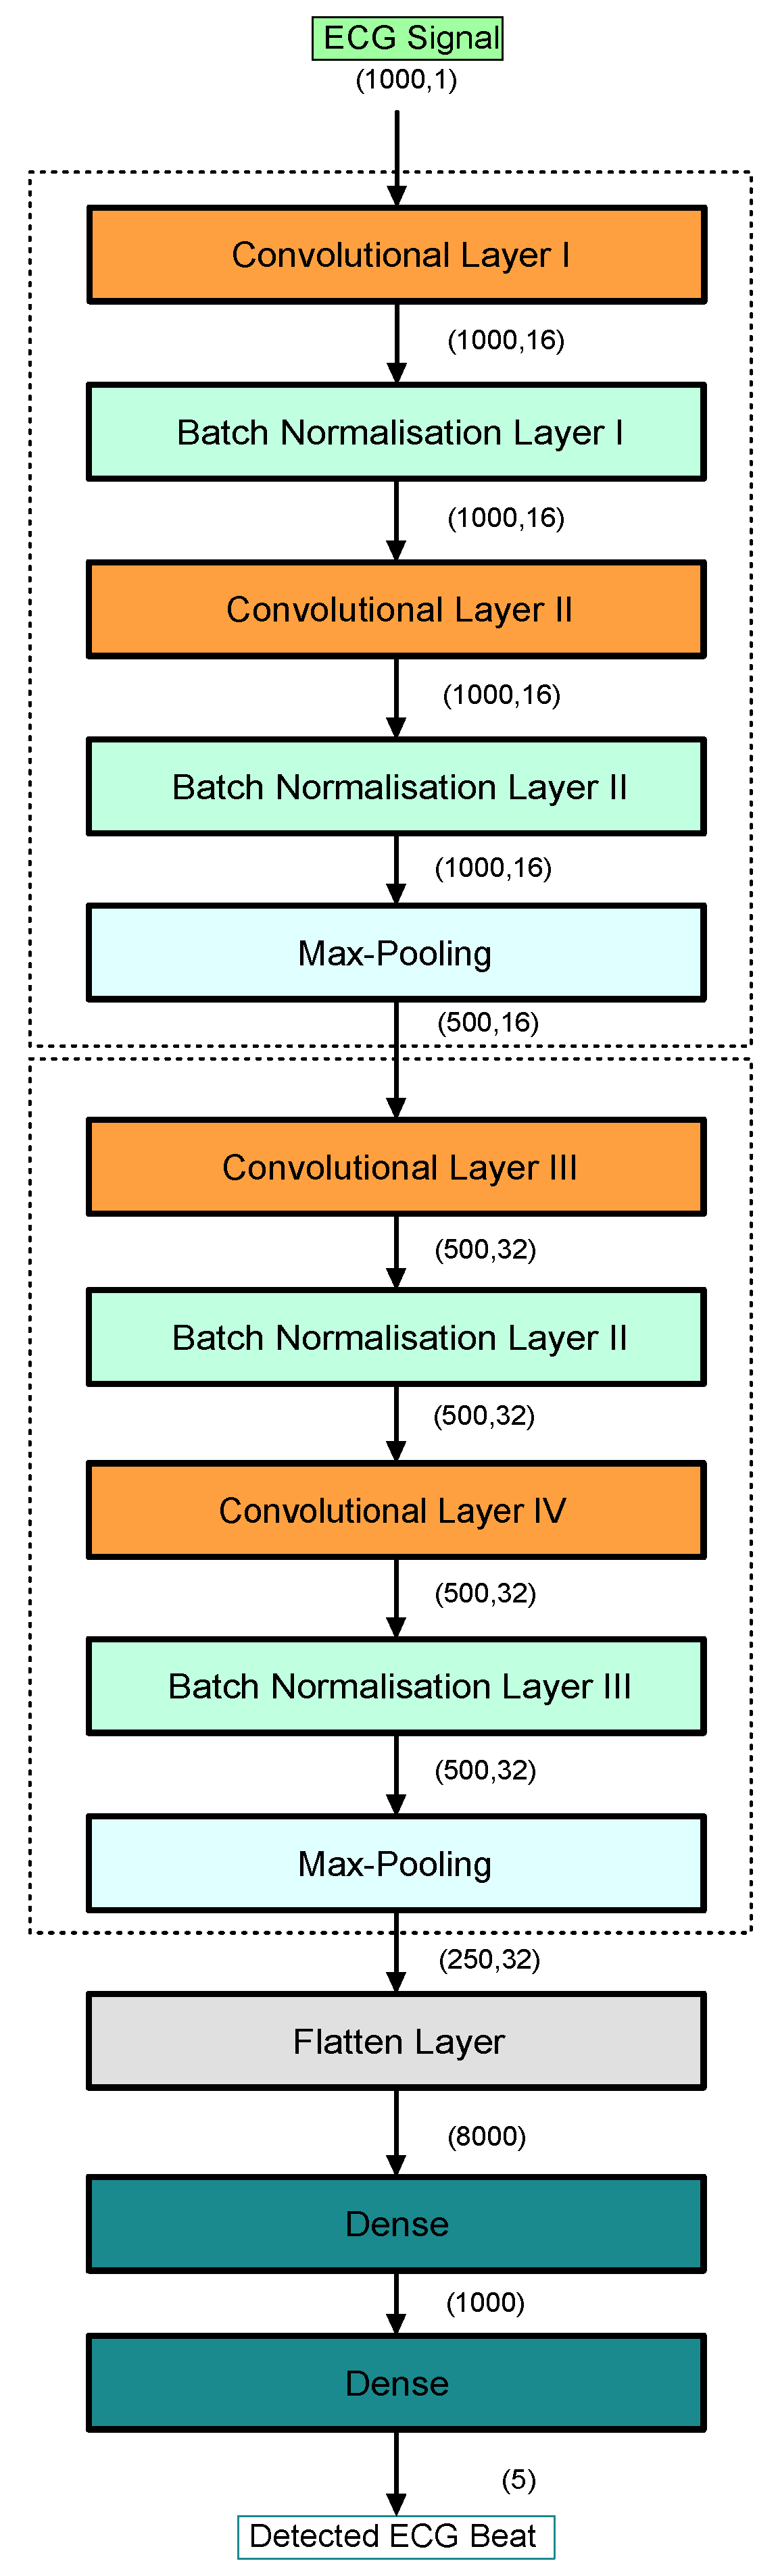
2.2. MI Methodology
2.2.1. ECG Signal Pre-Processing
- The test loss is small compared to those of conventional activation functions.
- There was faster initial convergence, which decreased the training time of the network.
- There was greater convergence stability over a larger range of learning rates.
- Deep neural networks can be trained much faster than before. High learning rates regularize the network, requiring a reduction of all other forms of regularization to maintain a balance between under-fitting and over-fitting.

2.2.2. SVM for MI Detection
- The one-vs.-one (OVO) approach.
- The one-vs.-all (OVA) approach.
3. Computational Results and Discussion
3.1. Performance Metrics for Evaluating the Proposed Method
3.2. Comparative Analysis
3.2.1. Results of the Proposed End-to-End CNN Model (First Scenario)
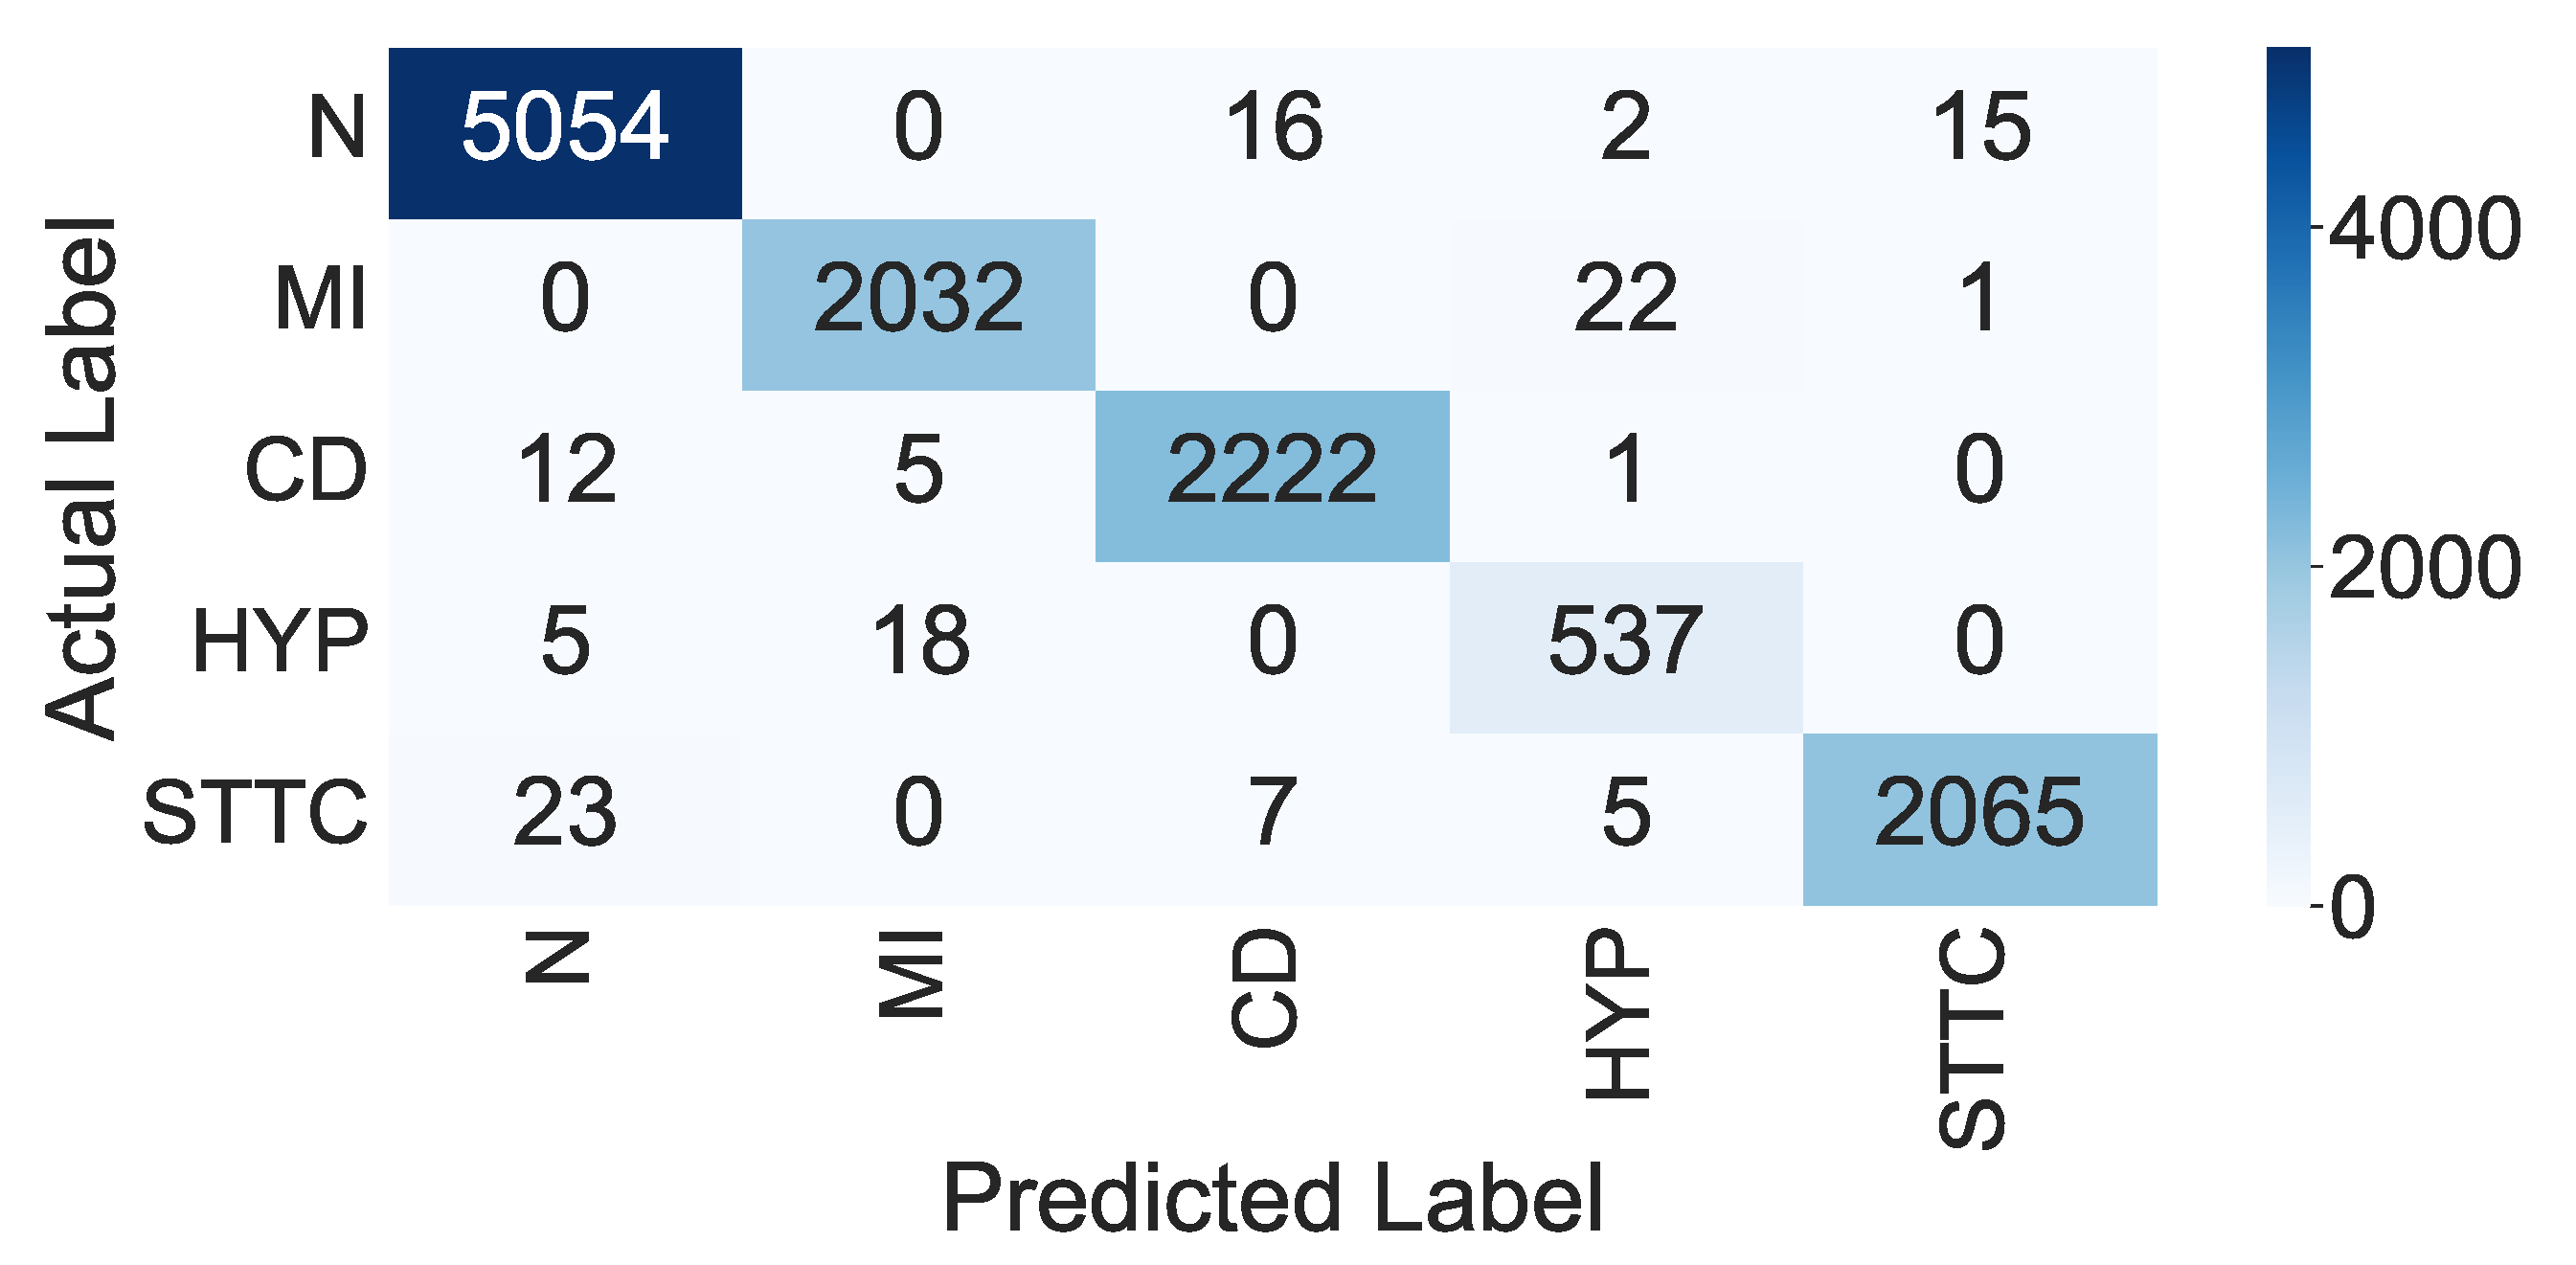
3.2.2. Results of the Proposed Deep CNN Model with the SVM Classifier (Second Scenario)
4. Conclusions
Author Contributions
Funding
Informed Consent Statement
Data Availability Statement
Conflicts of Interest
References
- Pustjens, T.; Appelman, Y.; Damman, P.; Ten Berg, J.; Jukema, J.; de Winter, R.; Agema, W.; van der Wielen, M.; Arslan, F.; Rasoul, S.; et al. Guidelines for the management of myocardial infarction/injury with non-obstructive coronary arteries (MINOCA): A position paper from the Dutch ACS working group. Neth. Heart J. 2020, 28, 116–130. [Google Scholar] [CrossRef] [PubMed]
- Menyar, A.A. Drug-induced myocardial infarction secondary to coronary artery spasm in teenagers and young adults. J. Postgrad. Med. 2006, 52, 51. [Google Scholar] [PubMed]
- Degerli, A.; Zabihi, M.; Kiranyaz, S.; Hamid, T.; Mazhar, R.; Hamila, R.; Gabbouj, M. Early Detection of Myocardial Infarction in Low-Quality Echocardiography. IEEE Access 2021, 9, 34442–34453. [Google Scholar] [CrossRef]
- Hammad, M.; Iliyasu, A.M.; Subasi, A.; Ho, E.S.; Abd El-Latif, A.A. A multitier deep learning model for arrhythmia detection. IEEE Trans. Instrum. Meas. 2020, 70, 1–9. [Google Scholar] [CrossRef]
- Sharma, L.D.; Sunkaria, R.K. Inferior myocardial infarction detection using stationary wavelet transform and machine learning approach. Signal Image Video Process. 2018, 12, 199–206. [Google Scholar] [CrossRef]
- Fatimah, B.; Singh, P.; Singhal, A.; Pramanick, D.; Pranav, S.; Pachori, R.B. Efficient detection of myocardial infarction from single lead ECG signal. Biomed. Signal Process. Control 2021, 68, 102678. [Google Scholar] [CrossRef]
- Jahmunah, V.; Ng, E.; San, T.R.; Acharya, U.R. Automated detection of coronary artery disease, myocardial infarction and congestive heart failure using GaborCNN model with ECG signals. Comput. Biol. Med. 2021, 134, 104457. [Google Scholar] [CrossRef]
- Śmigiel, S.; Pałczyński, K.; Ledziński, D. Deep Learning Techniques in the Classification of ECG Signals Using R-Peak Detection Based on the PTB-XL Dataset. Sensors 2021, 21, 8174. [Google Scholar] [CrossRef] [PubMed]
- Prakash, A.J. Capsule Network for the Identification of Individuals Using Quantized ECG Signal Images. IEEE Sens. Lett. 2022, 6, 7003004. [Google Scholar] [CrossRef]
- Gupta, D.; Bajpai, B.; Dhiman, G.; Soni, M.; Gomathi, S.; Mane, D. Review of ECG arrhythmia classification using deep neural network. Mater. Today Proc. 2021. [Google Scholar] [CrossRef]
- Pałczyński, K.; Śmigiel, S.; Ledziński, D.; Bujnowski, S. Study of the Few-Shot Learning for ECG Classification Based on the PTB-XL Dataset. Sensors 2022, 22, 904. [Google Scholar] [CrossRef] [PubMed]
- Prabhakararao, E.; Dandapat, S. Multi-Scale Convolutional Neural Network Ensemble for Multi-Class Arrhythmia Classification. IEEE J. Biomed. Health Inform. 2021, 26, 3802–3812. [Google Scholar] [CrossRef] [PubMed]
- Zhang, J.; Liang, D.; Liu, A.; Gao, M.; Chen, X.; Zhang, X.; Chen, X. MLBF-Net: A multi-lead-branch fusion network for multi-class arrhythmia classification using 12-Lead ECG. IEEE J. Transl. Eng. Health Med. 2021, 9, 1900211. [Google Scholar] [CrossRef] [PubMed]
- Śmigiel, S.; Pałczyński, K.; Ledziński, D. ECG Signal Classification Using Deep Learning Techniques Based on the PTB-XL Dataset. Entropy 2021, 23, 1121. [Google Scholar] [CrossRef]
- Prakash, A.J.; Samantray, S.; Bala, C.L.; Narayana, Y.V. An Automated Diagnosis System for Cardiac Arrhythmia Classification. In Analysis of Medical Modalities for Improved Diagnosis in Modern Healthcare; CRC Press: Boca Raton, FL, USA, 2021; pp. 301–313. [Google Scholar]
- Tadesse, G.A.; Javed, H.; Weldemariam, K.; Liu, Y.; Liu, J.; Chen, J.; Zhu, T. DeepMI: Deep multi-lead ECG fusion for identifying myocardial infarction and its occurrence-time. Artif. Intell. Med. 2021, 121, 102192. [Google Scholar] [CrossRef]
- Anand, A.; Kadian, T.; Shetty, M.K.; Gupta, A. Explainable AI decision model for ECG data of cardiac disorders. Biomed. Signal Process. Control 2022, 75, 103584. [Google Scholar] [CrossRef]
- He, Z.; Yuan, Z.; An, P.; Zhao, J.; Du, B. MFB-LANN: A lightweight and updatable myocardial infarction diagnosis system based on convolutional neural networks and active learning. Comput. Methods Programs Biomed. 2021, 210, 106379. [Google Scholar] [CrossRef]
- Ibrahim, L.; Mesinovic, M.; Yang, K.W.; Eid, M.A. Explainable prediction of acute myocardial infarction using machine learning and shapley values. IEEE Access 2020, 8, 210410–210417. [Google Scholar] [CrossRef]
- Cho, Y.; Kwon, J.M.; Kim, K.H.; Medina-Inojosa, J.R.; Jeon, K.H.; Cho, S.; Lee, S.Y.; Park, J.; Oh, B.H. Artificial intelligence algorithm for detecting myocardial infarction using six-lead electrocardiography. Sci. Rep. 2020, 10, 20495. [Google Scholar] [CrossRef]
- Sharma, L.; Sunkaria, R. Myocardial infarction detection and localization using optimal features based lead specific approach. Irbm 2020, 41, 58–70. [Google Scholar] [CrossRef]
- Ramaraj, E. A novel deep learning based gated recurrent unit with extreme learning machine for electrocardiogram (ECG) signal recognition. Biomed. Signal Process. Control 2021, 68, 102779. [Google Scholar]
- Khan, M.A.; Alhaisoni, M.; Tariq, U.; Hussain, N.; Majid, A.; Damaševičius, R.; Maskeliūnas, R. COVID-19 case recognition from chest CT images by deep learning, entropy-controlled firefly optimization, and parallel feature fusion. Sensors 2021, 21, 7286. [Google Scholar] [CrossRef]
- Srinivasu, P.N.; SivaSai, J.G.; Ijaz, M.F.; Bhoi, A.K.; Kim, W.; Kang, J.J. Classification of skin disease using deep learning neural networks with MobileNet V2 and LSTM. Sensors 2021, 21, 2852. [Google Scholar] [CrossRef]
- Almadhor, A.; Rauf, H.T.; Lali, M.I.U.; Damaševičius, R.; Alouffi, B.; Alharbi, A. AI-driven framework for recognition of guava plant diseases through machine learning from DSLR camera sensor based high resolution imagery. Sensors 2021, 21, 3830. [Google Scholar] [CrossRef]
- Wagner, P.; Strodthoff, N.; Bousseljot, R.D.; Kreiseler, D.; Lunze, F.I.; Samek, W.; Schaeffter, T. PTB-XL, a large publicly available electrocardiography dataset. Sci. Data 2020, 7, 154. [Google Scholar] [CrossRef]
- Yadav, S.; Shukla, S. Analysis of k-fold cross-validation over hold-out validation on colossal datasets for quality classification. In Proceedings of the 2016 IEEE 6th International Conference on Advanced Computing (IACC), Bhimavaram, India, 27–28 February 2016; pp. 78–83. [Google Scholar]
- Shin, H.J.; Eom, D.H.; Kim, S.S. One-class support vector machines—An application in machine fault detection and classification. Comput. Ind. Eng. 2005, 48, 395–408. [Google Scholar] [CrossRef]
- Bousseljot, R.; Kreiseler, D.; Schnabel, A. Nutzung der EKG-Signaldatenbank CARDIODAT der PTB über das Internet. Biomed. Eng. 1995, 40, 317–318. [Google Scholar] [CrossRef]
- Leng, L.; Li, M.; Kim, C.; Bi, X. Dual-source discrimination power analysis for multi-instance contactless palmprint recognition. Multimed. Tools Appl. 2017, 76, 333–354. [Google Scholar] [CrossRef]
- Leng, L.; Li, M.; Teoh, A.B.J. Conjugate 2DPalmHash code for secure palm-print-vein verification. In Proceedings of the 2013 6th International Congress on Image and Signal Processing (CISP), Hangzhou, China, 16–18 December 2013; Volume 3, pp. 1705–1710. [Google Scholar]
- Leng, L.; Zhang, J. Palmhash code vs. palmphasor code. Neurocomputing 2013, 108, 1–12. [Google Scholar] [CrossRef]


| Literature | Year | Database | Classifiers | Remarks (Accuracy in %) |
|---|---|---|---|---|
| Smigiel et al. [14] | 2021 | PTB-XL | CNN SincNet | 72.00 73.00 |
| Smigiel et al. [8] | 2021 | PTB-XL | Neural networks | 76.20 |
| Pałczynski et al. [11] | 2022 | PTB-XL | Neural networks | 80.20 |
| Prabhakararao et al. [12] | 2022 | PTB-XL CinC-training | DMSCE | 84.50 88.30 |
| Zhang et al. [13] | 2021 | China Physiological Signal Challenge 2018 | MLBF-Net | 87.70 |
| Jahmunah et al. [15] | 2021 | PTB | GABORCNN | 98.84 |
| Alghamdi et al. [16] | 2020 | PTB | VGG-Net | 99.20 |
| Anand et al. [17] | 2022 | PTB-XL | CNN | 95.80 |
| He et al. [18] | 2021 | Combination of PTB and PTB-XL | Multi-feature-branch lead attention neural network (MFB-LANN) | 94.19 |
| Beat Name | Number of Beats Utilized for Training and Cross-Validation | Number of Beats Utilized for Testing |
|---|---|---|
| Normal (Norm) | 5087 | 2150 |
| Myocardial infarction (MI) | 2055 | 881 |
| Conduction disturbance (CD) | 2240 | 992 |
| Hypertrophy (HYP) | 560 | 255 |
| ST/T change (STTC) | 2100 | 964 |
| Total Number of Beats in the PTB-XL ECG Database | Number of Beats for Training and 10-Fold Validation (70%) | Number of Beats for Testing (30%) |
|---|---|---|
| 17,232 | 12,040 | 5242 |
| No | Activation Function Name | Performance in Detection of the ECG Beats (in %) |
|---|---|---|
| 1 | Sigmoid | 98.46 |
| 2 | tanh | 96.32 |
| 3 | ReLU | 93.67 |
| 4 | Customized activation function | 99.56 |
| Hyperparameters | Values |
|---|---|
| Regularization parameter C | 1.0 |
| Kernel | `Radial Basis Function (RBF) kernel’ |
| Degree of the polynomial kernel function | 3 |
| Gamma (kernel coefficient for `rbf’) | `scale’ |
| Shrinking | True (if the number of iterations is large, then shrinking can shorten the training time) |
| Probability | False (Whether probability estimates are enabled—this must be enabled before running the fit; it will slow down that method as it utilizes 10-fold cross-validation internally, and the predict_proba may differ from predict). |
| Tol | 0.001 (tolerance for the stopping criterion). |
| Cache_size | 200 (specifying the size of the kernel cache). |
| max_iter | −1 (hard limit on iterations within the solver, or −1 for no limit). |
| decision_function_shape | `ovr’. |
| break_ties | True (if true, decision_function_shape = `ovr’ and number of classes > 2, predict will break ties based on the confidence values of decision_function; otherwise, the first tied class is returned. Please note that breaking ties incurs a somewhat large computational cost relative to a simple prediction). |
| random_state | None (controls the creation of pseudo-random numbers for shuffling data for probability estimates. When the probability is False, it is ignored. An integer is passed for output that is reproducible over several function calls). |
| Class | n (Truth) | n (Classified) | Accuracy (in %) | Precision (in %) | Recall (in %) | F-Score |
|---|---|---|---|---|---|---|
| N | 5054 | 5087 | 99.39 | 99.21 | 99.35 | 0.992 |
| MI | 2032 | 2055 | 99.62 | 98.88 | 98.77 | 0.988 |
| CD | 2022 | 2240 | 99.66 | 98.98 | 99.20 | 0.990 |
| HYP | 537 | 560 | 99.56 | 94.74 | 95.89 | 0.953 |
| STTC | 2065 | 2100 | 99.57 | 99.23 | 98.33 | 0.987 |
| Overall Accuracy | 98.90 (in %) | |||||
| Class | n (Truth) | n (Classified) | Accuracy (in %) | Precision (in %) | Recall (in %) | F-Score |
|---|---|---|---|---|---|---|
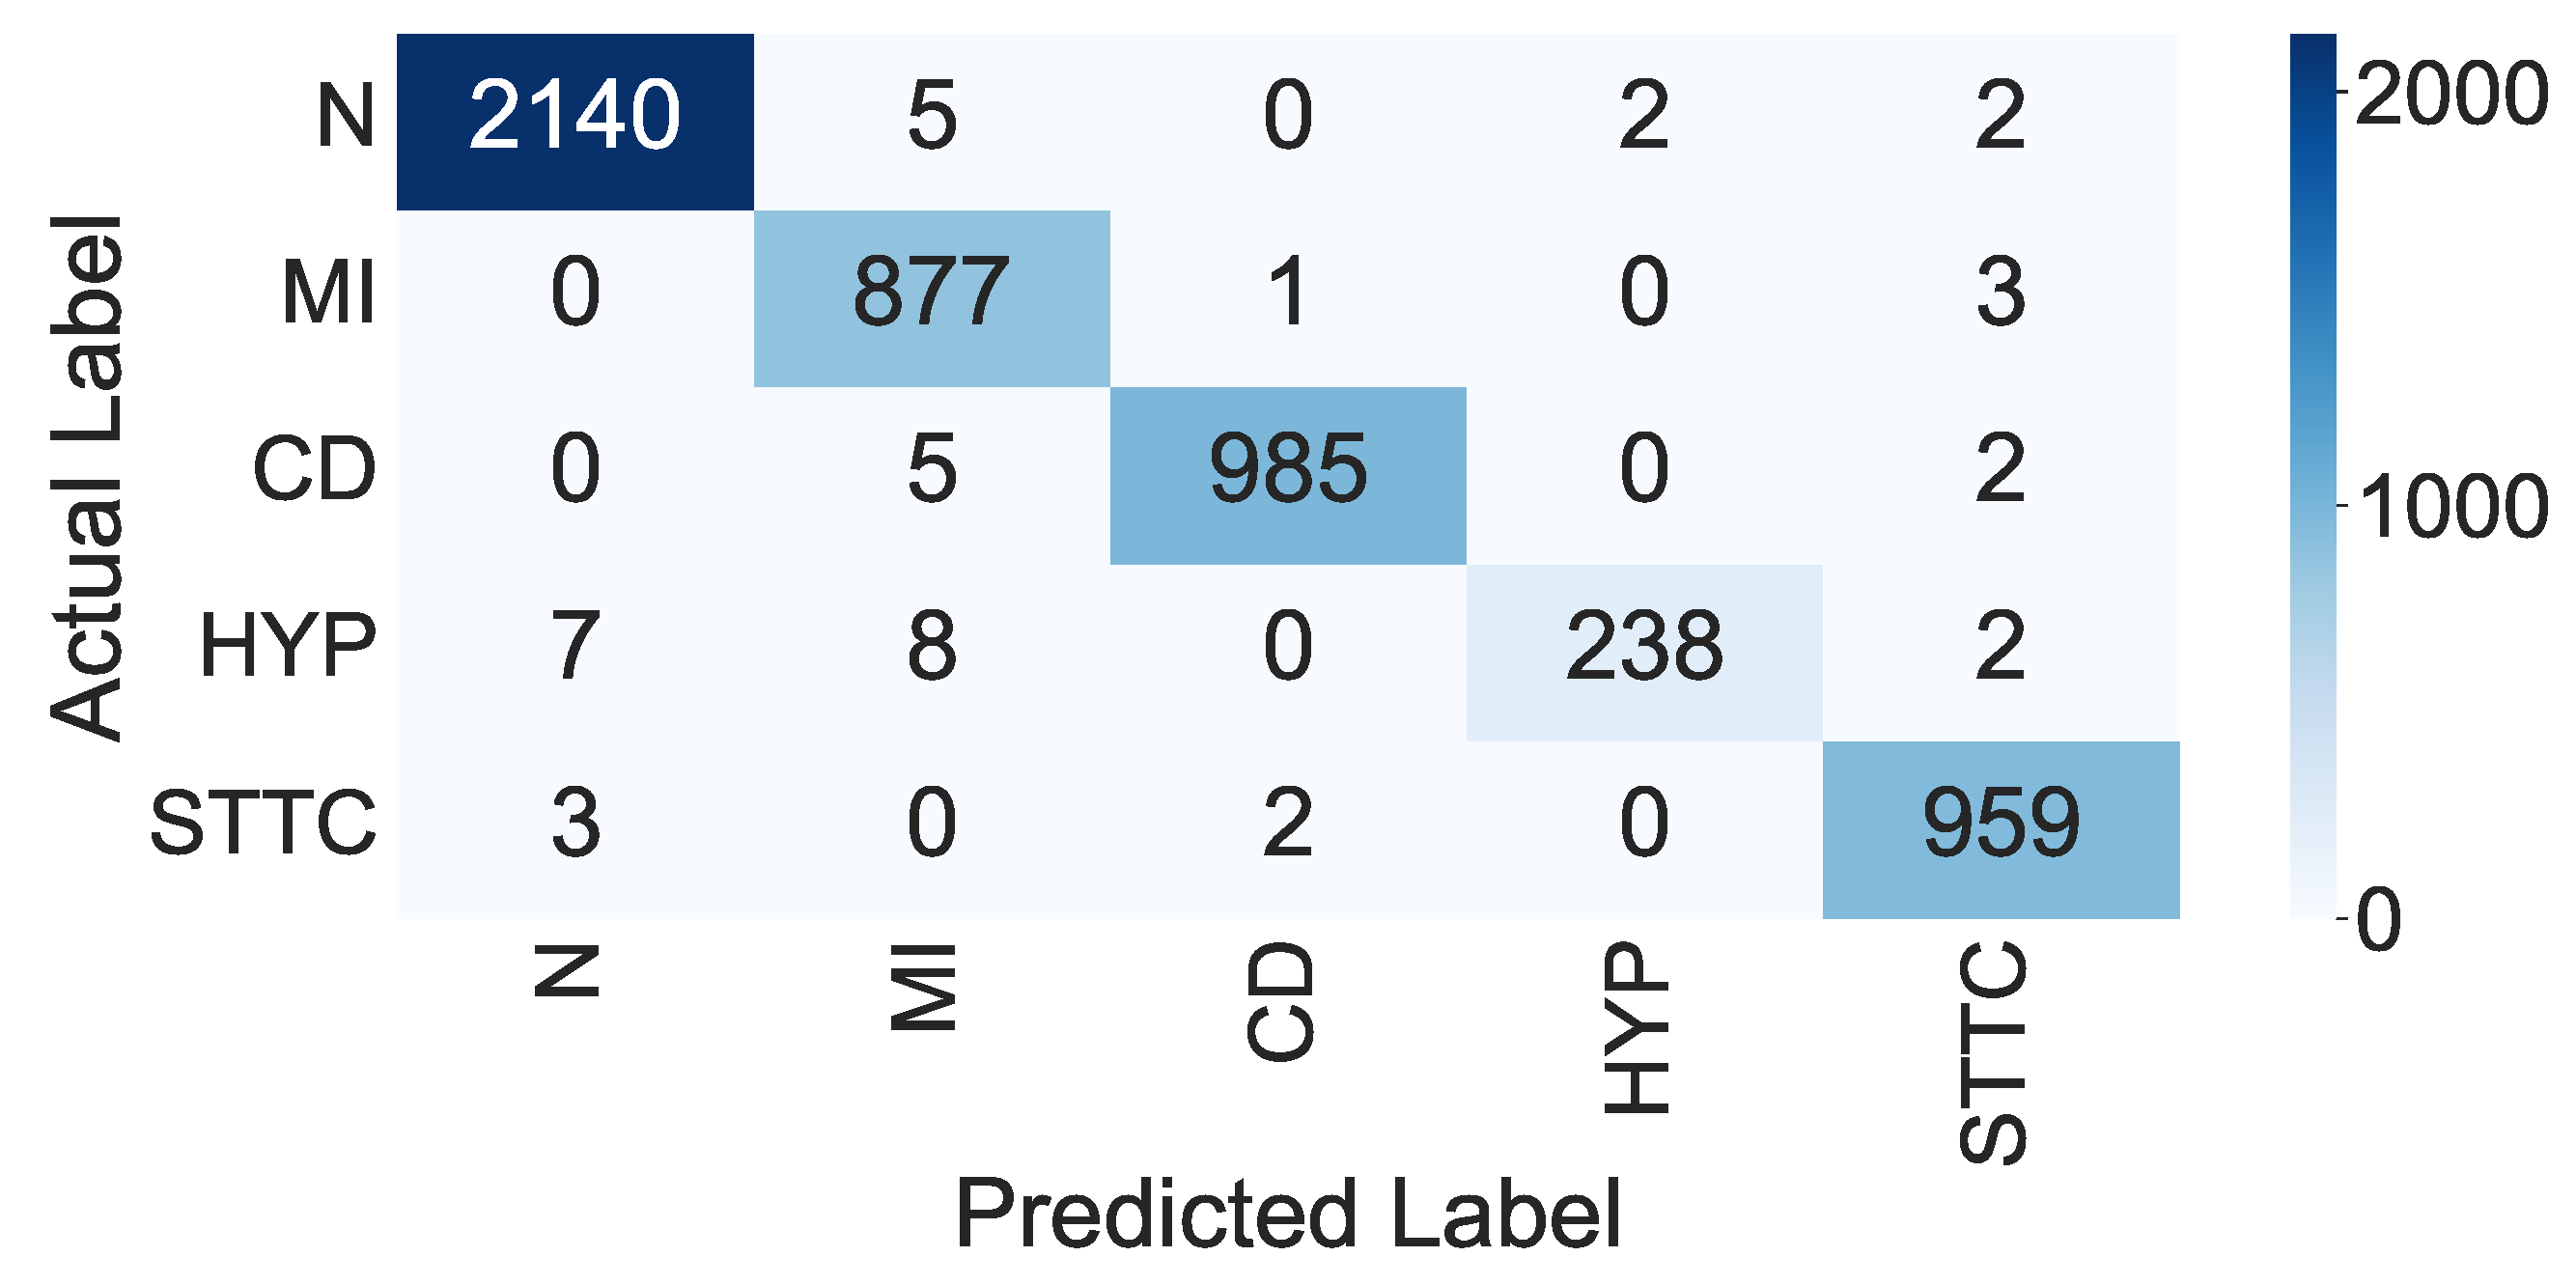
| N | 2140 | 2149 | 99.64 | 99.53 | 99.58 | 0.995 |
| MI | 877 | 881 | 99.58 | 97.99 | 99.55 | 0.987 |
| CD | 985 | 992 | 99.81 | 99.70 | 99.29 | 0.994 |
| HYP | 238 | 255 | 99.64 | 99.17 | 93.33 | 0.961 |
| STTC | 959 | 964 | 99.73 | 99.07 | 99.48 | 0.992 |
| Overall Accuracy | 99.20 (in %) | |||||
| Literature | Year | Database | Technique | Acc (in %) | Pre (in %) | Rec (in %) | F-Score |
|---|---|---|---|---|---|---|---|
| Smigiel et al. [14] | 2021 | PTB-XL | CNN and entropy-based features | 89.14 | 71.40 | 66.20 | 68.00 |
| Smigiel et al. [8] | 2021 | PTB-XL | Deep learning and R-peak detection | 76.20 | 66.7 | 66.7 | 68.30 |
| Pałczynski et al. [11] | 2022 | PTB-XL | Deep CNN and QRS complex detection | 79.00 | 70.60 | 70.60 | 70.60 |
| Prabhakararao et al. [12] | 2021 | PTB-XL | CNN ensemble | 85.65 | 84.25 | 85.21 | 84.55 |
| Zhang et al. [13] | 2021 | PTB-XL | Multi-lead-branch fusion network | 93.10 | 94.30 | 93.10 | 92.80 |
| Proposed Method | 2022 | PTB-XL | Deep CNN model with SVM classifier | 99.20 | 98.20 | 99.20 | 98.60 |
Publisher’s Note: MDPI stays neutral with regard to jurisdictional claims in published maps and institutional affiliations. |
© 2022 by the authors. Licensee MDPI, Basel, Switzerland. This article is an open access article distributed under the terms and conditions of the Creative Commons Attribution (CC BY) license (https://creativecommons.org/licenses/by/4.0/).
Share and Cite
Hammad, M.; Chelloug, S.A.; Alkanhel, R.; Prakash, A.J.; Muthanna, A.; Elgendy, I.A.; Pławiak, P. Automated Detection of Myocardial Infarction and Heart Conduction Disorders Based on Feature Selection and a Deep Learning Model. Sensors 2022, 22, 6503. https://doi.org/10.3390/s22176503
Hammad M, Chelloug SA, Alkanhel R, Prakash AJ, Muthanna A, Elgendy IA, Pławiak P. Automated Detection of Myocardial Infarction and Heart Conduction Disorders Based on Feature Selection and a Deep Learning Model. Sensors. 2022; 22(17):6503. https://doi.org/10.3390/s22176503
Chicago/Turabian StyleHammad, Mohamed, Samia Allaoua Chelloug, Reem Alkanhel, Allam Jaya Prakash, Ammar Muthanna, Ibrahim A. Elgendy, and Paweł Pławiak. 2022. "Automated Detection of Myocardial Infarction and Heart Conduction Disorders Based on Feature Selection and a Deep Learning Model" Sensors 22, no. 17: 6503. https://doi.org/10.3390/s22176503
APA StyleHammad, M., Chelloug, S. A., Alkanhel, R., Prakash, A. J., Muthanna, A., Elgendy, I. A., & Pławiak, P. (2022). Automated Detection of Myocardial Infarction and Heart Conduction Disorders Based on Feature Selection and a Deep Learning Model. Sensors, 22(17), 6503. https://doi.org/10.3390/s22176503