
Quantifying Two-Dimensional Surface Displacements Using High-Resolution Cosmo-SkyMed, TerraSAR-X and Medium-Resolution Sentinel-1 SAR Interferometry: Case Study for the Tengiz Oilfield


Abstract
:1. Introduction
- Geospatial comparative data analytics and cross-validation of vertical and horizontal interferometric measurements derived from high-resolution CKS, TSX and medium-resolution SNT1 satellite missions;
- Coupling of CSK and TSX SAR processing results for the decomposition of line-of-sight measurements to vertical and horizontal measurements;
- Assessment of vertical and horizontal displacement velocities, cumulative vertical displacements and associated movement hotspots using CSK, TSX and SNT1 imagery acquired during the period 2018–2021.
2. Study Area
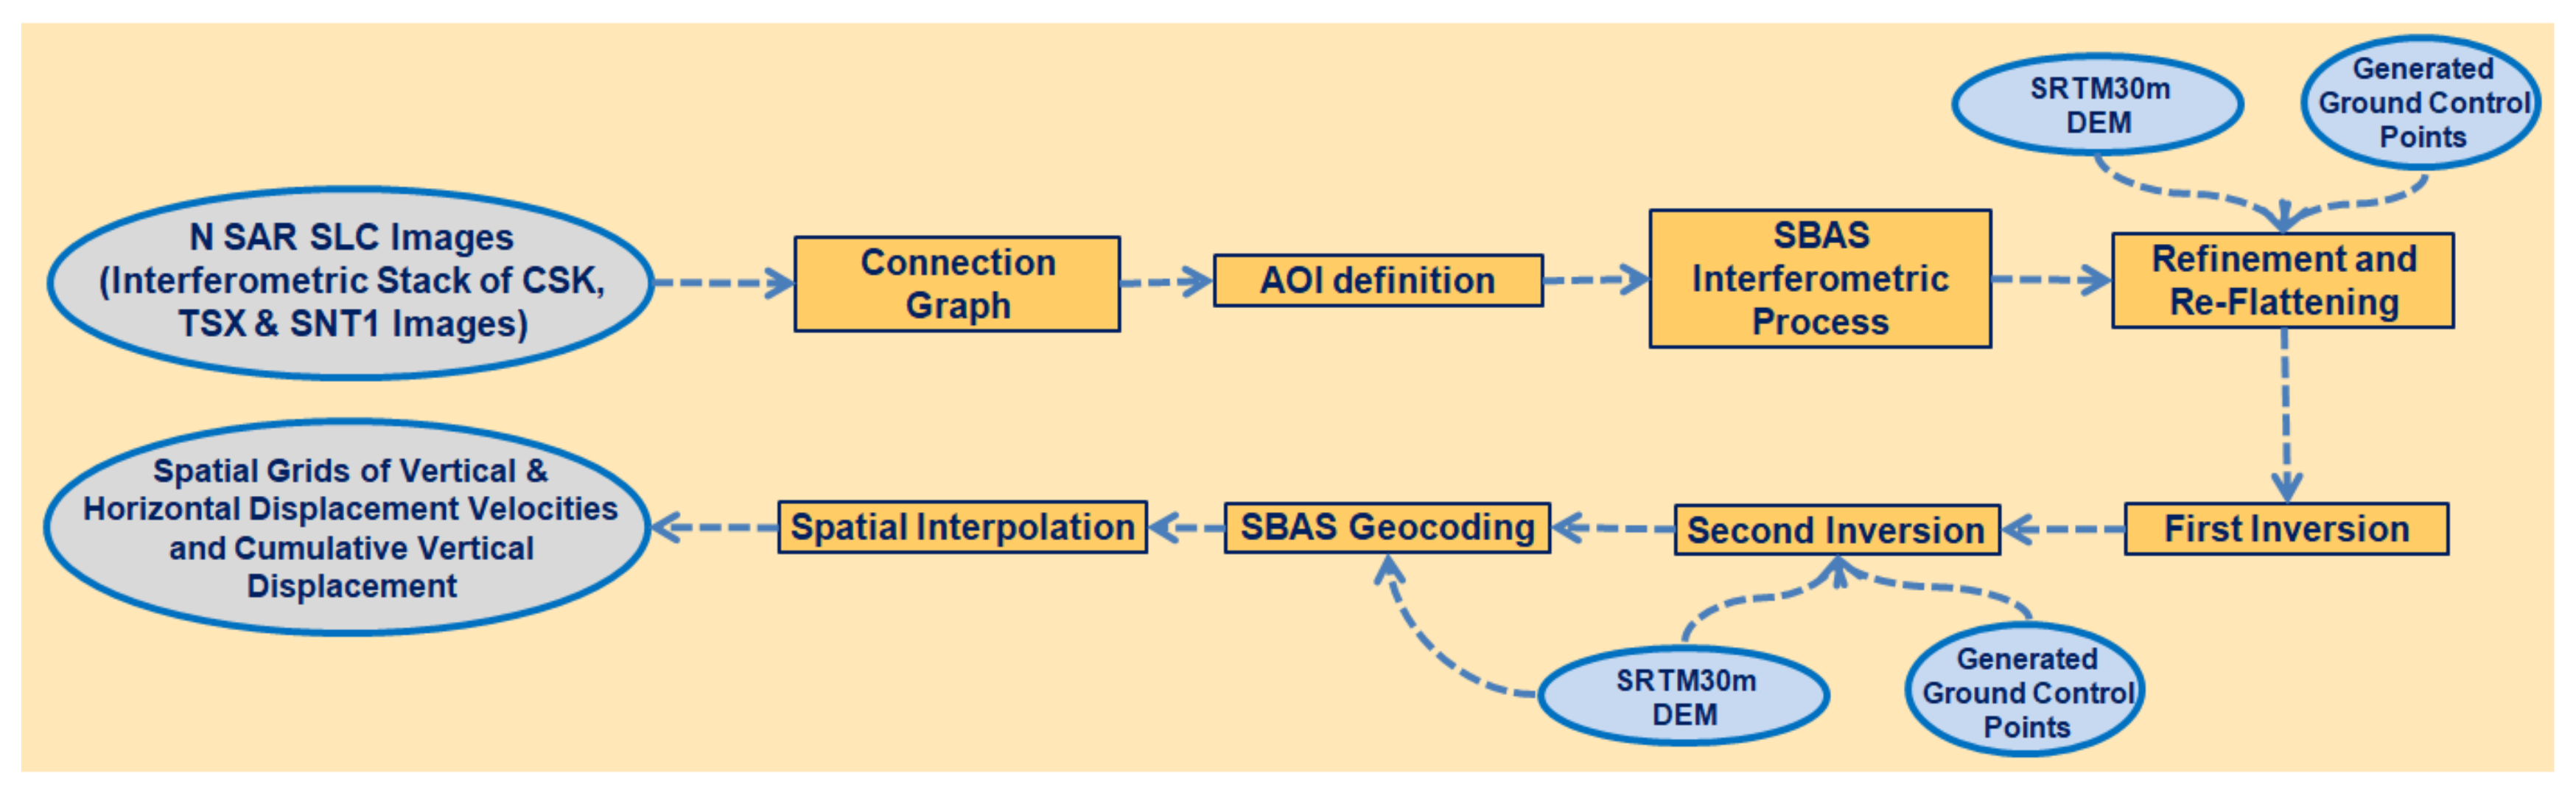
3. Data Processing
4. Results
5. Discussion
6. Conclusions
Author Contributions
Funding
Data Availability Statement
Acknowledgments
Conflicts of Interest
References
- Rabus, B.; Werner, C.; Wegmueller, U.; McCardle, A. Interferometric point target analysis of RADARSAT-1 data for deformation monitoring at the Belridge/Lost Hills oil fields. In Proceedings of the IEEE Geoscience and Remote Sensing Symposium 2004 (IGARSS’04), Institute of Electrical and Electronics Engineers, Anchorage, AK, USA, 20–24 September 2004; Volume 4, pp. 2611–2613. [Google Scholar]
- Zhou, W.; Chen, G.; Li, S.; Ke, J. InSAR Application in Detection of Oilfield Subsidence on Alaska North Slope. In Proceedings of the 41st US Symposium on Rock Mechanics (USRMS), Golden, CO, USA, 17–21 June 2006. [Google Scholar]
- Tamburini, A.; Bianchi, M.; Giannico, C.; Novali, F. Retrieving Surface Deformation by PS Insar™ Technology: A Powerful Tool in Reservoir Monitoring. Int. J. Greenh. Gas Control 2010, 4, 928–937. [Google Scholar] [CrossRef]
- Ferretti, A.; Tamburini, A.; Novali, F.; Fumagalli, A.; Falorni, G.; Rucci, A. Impact of high resolution radar imagery on reservoir monitoring. Energy Procedia 2011, 4, 3465–3471. [Google Scholar] [CrossRef]
- Gee, D.; Sowter, A.; Novellino, A.; Marsh, S.; Gluyas, J. Monitoring land motion due to natural gas extraction: Validation of the Intermittent SBAS (ISBAS) DInSAR algorithm over gas fields of North Holland, The Netherlands. Mar. Pet. Geol. 2016, 77, 1338–1354. [Google Scholar] [CrossRef]
- Taylor, K.; Ghuman, P.; McCardle, A. Operational mine monitoring with InSAR. In Proceedings of the First Asia Pacific Slope Stability in Mining Conference, Brisbane, Australia, 6–8 September 2016; Australian Centre for Geomechanics: Perth, Australia, 2016; pp. 695–706. [Google Scholar]
- Yang, C.; Zhang, D.; Zhao, C.; Han, B.; Sun, R.; Du, J.; Chen, L. Ground Deformation Revealed by Sentinel-1 MSBAS-InSAR Time-Series over Karamay Oilfield, China. Remote Sens. 2019, 11, 2027. [Google Scholar] [CrossRef]
- Benetatos, C.; Codegone, G.; Ferraro, C.; Mantegazzi, A.; Rocca, V.; Tango, G.; Trillo, F. Multidisciplinary Analysis of Ground Movements: An Underground Gas Storage Case Study. Remote Sens. 2020, 12, 3487. [Google Scholar] [CrossRef]
- Bayramov, E.; Buchroithner, M.; Kada, M.; Bayramov, R. Quantitative assessment of ground deformation risks, controlling factors and movement trends for onshore petroleum and gas industry using satellite radar remote sensing and spatial statistics. Georisk Assess. Manag. Risk Eng. Syst. Geohazards 2022, 16, 283–300. [Google Scholar] [CrossRef]
- Staniewicz, S.; Chen, J.; Lee, H.; Olson, J.; Savvaidis, A.; Reedy, R.; Breton, C.; Rathje, E.; Hennings, P. InSAR reveals complex surface deformation patterns over an 80,000 km2 oil-producing region in the Permian Basin. Geophys. Res. Lett. 2020, 47, e2020GL090151. [Google Scholar] [CrossRef]
- Togaibekov, A.Z. Monitoring of Oil-Production-Induced Subsidence and Uplift. Master’s Thesis, Massachusetts Institute of Technology, Cambridge, MA, USA, 2020. [Google Scholar]
- Holloway, S.; Pearce, J.M.; Hards, V.L.; Ohsumi, T.; Gale, J. Natural emissions of CO2 from the geosphere and their bearing on the geological storage of carbon dioxide. Energy 2007, 32, 1194–1201. [Google Scholar] [CrossRef]
- Xu, Y. Analysis of common geological hazards in oil and gas fields. Heilongjiang Sci. Technol. Inf. 2014, 16, 71. [Google Scholar]
- Shi, J.; Yang, H.; Peng, J.; Wu, J.; Xu, B.; Liu, Y.; Zhao, B. InSAR Monitoring and analysis of ground deformation due to fluid or gas injection in Fengcheng oil field, Xinjiang, China. J. Indian Soc. Remote Sens. 2019, 47, 455–466. [Google Scholar] [CrossRef]
- Fokker, P.A.; Visser, K.; Peters, E.; Kunakbayeva, G.; Muntendam-Bos, A.G. Inversion of surface subsidence data to quantify reservoir compartmentalization: A field study. J. Pet. Sci. Eng. 2012, 96, 10–21. [Google Scholar] [CrossRef]
- Del Conte, S.; Tamburini, A.; Cespa, S.; Rucci, A.; Ferretti, A. Advanced InSAR Technology for Reservoir Monitoring and Geomechanical Model Calibration. In Proceedings of the SPE Kuwait Oil and Gas Show and Conference, Kuwait City, Kuwait, 8–10 October 2013. [Google Scholar] [CrossRef]
- Rocca, F.; Rucci, A.; Ferretti, A.; Bohane, A. Advanced InSAR interferometry for reservoir monitoring. First Break 2013, 31, 77–85. [Google Scholar] [CrossRef]
- Even, M.; Westerhaus, M.; Simon, V. Complex Surface Displacements above the Storage Cavern Field at Epe, NW-Germany, Observed by Multi-Temporal SAR-Interferometry. Remote Sens. 2020, 12, 3348. [Google Scholar] [CrossRef]
- Comola, F.; Janna, C.; Lovison, A.; Minini, M.; Tamburini, A.; Teatini, P. Efficient global optimization of reservoir geomechanical parameters based on synthetic aperture radar-derived ground displacements. Geophysics 2016, 81, M23–M33. [Google Scholar] [CrossRef]
- Grebby, S.; Orynbassarova, E.; Sowter, A.; Gee, D.; Athab, A. Delineating ground deformation over the Tengiz oil field, Kazakhstan, using the Intermittent SBAS (ISBAS) DInSAR algorithm. Int. J. Appl. Earth Obs. Geoinf. 2019, 81, 37–46. [Google Scholar] [CrossRef]
- Orynbassarova, E. Improvement of the Method of Integrated Preparation and Use of Space Images in Tasks of Assessment of Sedimentation of Industrial Surface in the Conditions of Operation of Tengiz Oil and Gas Field. Ph.D. Thesis, Satbayev University, Almaty, Kazakhstan, 2019. [Google Scholar]
- Bayramov, E.; Buchroithner, M.; Kada, M.; Zhuniskenov, Y. Quantitative Assessment of Vertical and Horizontal Deformations Derived by 3D and 2D Decompositions of InSAR Line-of-Sight Measurements to Supplement Industry Surveillance Programs in the Tengiz Oilfield (Kazakhstan). Remote Sens. 2021, 13, 2579. [Google Scholar] [CrossRef]
- Bayramov, E.; Buchroithner, M.; Kada, M.; Duisenbiyev, A.; Zhuniskenov, Y. Multi-Temporal SAR Interferometry for Vertical Displacement Monitoring from Space of Tengiz Oil Reservoir Using SENTINEL-1 and COSMO-SKYMED Satellite Missions. Front. Environ. Sci. 2022, 10, 783351. [Google Scholar] [CrossRef]
- Zhantaev, Z.; Fremd, A.; Ivanchukova, A.; Kaldybayev, A.; Nurakynov, S.; Kantemirov, Y.; Nikiforov, S. Satellite radar monitoring of land surface subsidence over Tengiz oil and gas field. Geomat. Mag. 2012, 1, 61–71. (In Russian) [Google Scholar]
- Zhantayev, Z.; Fremd, A.; Ivanchukova, A. Using of SAR data and PSINSAR technique for monitoring of ground deformation in Western Kazakhstan. In Proceedings of the 13th International Multidisciplinary Scientific GeoConference SGEM 2013, Albena, Bulgaria, 16–22 June 2013; pp. 727–731. [Google Scholar]
- Peake, W.T.; Camerlo, R.H.; Tankersley, T.H.; Zhumagulova, A. Tengiz Reservoir Uncertainty Characterization and Modeling. In Proceedings of the SPE Caspian Carbonates Technology Conference, Atyrau, Kazakhstan, 8–10 November 2010; p. SPE139561. [Google Scholar] [CrossRef]
- Anissimov, L.; Postnova, E.; Merkulov, O. Tengiz oilfield: Geological model based on hydrodynamic data. Pet. Geosci. 2000, 6, 59–65. [Google Scholar] [CrossRef]
- Imamoglu, M.; Kahraman, F.; Çakir, Z.; Sanli, F.B. Ground Deformation Analysis of Bolvadin (W. Turkey) by Means of Multi-Temporal InSAR Techniques and Sentinel-1 Data. Remote Sens. 2019, 11, 1069. [Google Scholar] [CrossRef] [Green Version]
- Vaka, D.S.; Sharma, S.; Rao, Y.S. Comparison of HH and VV Polarizations for Deformation Estimation using Persistent Scatterer Interferometry. In Proceedings of the 38th Asian Conference on Remote Sensing—Space Applications: Touching Human Lives, ACRS 2017, New Delhi, India, 23–27 October 2017. [Google Scholar]
- Ittycheria, N.; Vaka, D.S.; Rao, Y.S. Time series analysis of surface deformation of Bengaluru city using Sentinel-1 images. Remote Sensing and Spatial Information Sciences. In Proceedings of the 2018 ISPRS TC V Mid-Term Symposium “Geospatial Technology—Pixel to People”, Dehradun, India, 20–23 November 2018; Volume IV–V. [Google Scholar]
- Tapete, D.; Cigna, F. COSMO-SkyMed SAR for Detection and Monitoring of Archaeological and Cultural Heritage Sites. Remote Sens. 2019, 11, 1326. [Google Scholar] [CrossRef]
- Yang, Y.-J.; Hwang, C.; Hung, W.-C.; Fuhrmann, T.; Chen, Y.-A.; Wei, S.-H. Surface Deformation from Sentinel-1A InSAR: Relation to Seasonal Groundwater Extraction and Rainfall in Central Taiwan. Remote Sens. 2019, 11, 2817. [Google Scholar] [CrossRef]
- Berardino, P.; Fornaro, G.; Lanari, R.; Sansosti, E. A new algorithm for surface deformation monitoring based on small baseline differential SAR interferograms. IEEE Trans. Geosci. Remote Sens. 2002, 40, 2375–2383. [Google Scholar] [CrossRef]
- Sarmap. SBAS Tutorial. 2021. Available online: https://www.sarmap.ch/index.php/software/sarscape (accessed on 29 June 2022).
- Loesch, E.; Sagan, V. SBAS Analysis of Induced Ground Surface Deformation from Wastewater Injection in East Central Oklahoma, USA. Remote Sens. 2018, 10, 283. [Google Scholar] [CrossRef]
- Lanari, R.; Mora, O.; Manunta, M.; Mallorquí, J.J.; Berardino, P.; Sansosti, E. A small-baseline approach for investigating deformations on full-resolution differential SAR interferograms. IEEE Trans. Geosci. Remote Sens. 2004, 42, 1377–1386. [Google Scholar] [CrossRef]
- Hooper, A.; Zebker, H.A. Phase unwrapping in three dimensions with application to InSAR time series. JOSA A 2007, 24, 2737–2747. [Google Scholar] [CrossRef]
- Tizzani, P.; Berardino, P.; Casu, F.; Euillades, P.; Manzo, M.; Ricciardi, G.P.; Zeni, G.; Lanari, R. Surface deformation of Long Valley caldera and Mono Basin, California, investigated with the SBAS-InSAR approach. Remote Sens. Environ. 2007, 108, 277–289. [Google Scholar] [CrossRef]
- Qiu, Z.; Jiang, T.; Zhou, L.; Wang, C.; Luzi, G. Study of subsidence monitoring in Nanjing City with small-baseline InSAR approach. Geomat. Nat. Hazards Risk 2019, 10, 1412–1424. [Google Scholar] [CrossRef]
- Pawluszek-Filipiak, K.; Borkowski, A. Integration of DInSAR and SBAS Techniques to Determine Mining-Related Deformations Using Sentinel-1 Data: The Case Study of Rydułtowy Mine in Poland. Remote Sens. 2020, 12, 242. [Google Scholar] [CrossRef]
- Farr, T.; Rosen, P.; Caro, E.; Crippen, R.; Duren, R.; Hensley, S.; Alsdorf, D. The shuttle radar topography mission. Rev. Geophys. 2007, 45, 183. [Google Scholar] [CrossRef] [Green Version]
- Gaber, A.; Darwish, N.; Koch, M. Minimizing the Residual Topography Effect on Interferograms to Improve DInSAR Results: Estimating Land Subsidence in Port-Said City, Egypt. Remote Sens. 2017, 9, 752. [Google Scholar] [CrossRef]
- Aimaiti, Y.; Yamazaki, F.; Liu, W.; Kasimu, A. Monitoring of Land-Surface Deformation in the Karamay Oilfield, Xinjiang, China, Using SAR Interferometry. Appl. Sci. 2017, 7, 772. [Google Scholar] [CrossRef]
- Darvishi, M.; Schlögel, R.; Kofler, C.; Cuozzo, G.; Rutzinger, M.; Zieher, T.; Toschi, I.; Remondino, F.; Mejia-Aguilar, A.; Thiebes, B.; et al. Sentinel-1 and Ground-Based Sensors for Continuous Monitoring of the Corvara Landslide (South Tyrol, Italy). Remote Sens. 2018, 10, 1781. [Google Scholar] [CrossRef]
- Khorrami, M.; Abrishami, S.; Maghsoudi, Y.; Alizadeh, B.; Perissin, D. Extreme Subsidence in a Populated City (Mashhad) Detected by PSInSAR Considering Groundwater Withdrawal and Geotechnical Properties. Sci. Rep. 2020, 10, 111357. [Google Scholar] [CrossRef]
- Makabayi, B.; Musinguzi, M.; Otukei, J. Estimation of Ground Vertical Displacement in Landslide Prone Areas Using PS-InSAR. A Case Study of Bududa, Uganda. Int. J. Geosci. 2021, 12, 347–380. [Google Scholar] [CrossRef]
- Fialko, Y. Interseismic strain accumulation and the earthquake potential on the southern San Andreas Fault system. Nature 2006, 441, 968. [Google Scholar] [CrossRef]
- Motagh, M.; Shamshiri, R.; HaghshenasHaghighi, M.; Wetzel, H.U.; Akbari, B.; Nahavandchi, H.; Roessner, S.; Arabi, S. Quantifying groundwater exploitation induced subsidence in the Rafsanjan plain, southeastern Iran, using InSAR time-series and in situ measurements. Eng. Geol. 2017, 218, 134–151. [Google Scholar] [CrossRef]
- Fernandez, J.; Prieto, J.F.; Escayo, J.; Camacho, A.G.; Luzón, F.; Tiampo, K.F.; Mimmo, P.; Tamara, A.; Enrique, P.; Guadalupe, P.; et al. Modeling the two- and three-dimensional displacement field in Lorca, Spain, subsidence and the global implications. Sci. Rep. 2018, 8, 14782. [Google Scholar] [CrossRef]
- Aslan, G.; Cakir, Z.; Lasserre, C.; Renard, F. Investigating Subsidence in the Bursa Plain, Turkey, Using Ascending and Descending Sentinel-1 Satellite Data. Remote Sens. 2019, 11, 85. [Google Scholar] [CrossRef]
- Alatza, S.; Papoutsis, I.; Paradissis, D.; Kontoes, C.; Papadopoulos, G.A. Multi-Temporal InSAR Analysis for Monitoring Ground Deformation in Amorgos Island, Greece. Sensors 2020, 20, 338. [Google Scholar] [CrossRef] [Green Version]
- Minh, D.H.T.; NGO, Y.; Lê, T.T.; Le, T.C.; Bui, H.S.; Vuong, Q.V.; Le Toan, T. Quantifying Horizontal and Vertical Movements in Ho Chi Minh City by Sentinel-1 Radar Interferometry. Preprints 2020, 2020120382. [Google Scholar] [CrossRef]
- Aslan, G. Monitoring of surface deformation in northwest Turkey from high-resolution insar: Focus on tectonic a seismic slip and subsidence. In Tectonics; Istanbul Teknik Üniversitesity: Istanbul, Turkey, 2019. [Google Scholar]
- Baghdadi, N.; El Hajj, M.; Dubois-Fernandez, P.; Zribi, M.; Belaud, G.; Cheviron, B. Signal Level Comparison Between TerraSAR-X and COSMO-SkyMed SAR Sensors. IEEE Geosci. Remote Sens. Lett. 2014, 12, 448–452. [Google Scholar] [CrossRef]
- Pettinato, S.; Santi, E.; Paloscia, S.; Pampaloni, P.; Fontanelli, G. The Intercomparison of X-Band SAR Images from COSMO-SkyMed and TerraSAR-X Satellites: Case Studies. Remote Sens. 2013, 5, 2928–2942. [Google Scholar] [CrossRef]
- Mora, Ó.; Pérez-Aragüés, F.; Marchán, J.F.; Pipia, L. Sentinel IWS vs. Cosmo-SkyMed Stripmap: A Sensitivity Analysis. Sentinel IWS vs. Cosmo-SkyMed Stripmap: A Sensitivity Analysis. Fringe 2017 Workshop. 2017. Available online: https://www.icgc.cat/content/download/79789/695658/version/1/file/2017_POSTER_FRINGE_PSI_S1_vs_CSK.pdf (accessed on 29 June 2022).
- Brew, G.E.; Horiuchi, M.; Leezenberg, P.B.; Tabak, A. Monitoring and Analysis of Surface Deformation with InSAR and Subsurface Data, Sab Joaquin Valley, California. In Proceedings of the AAPG Pacific Section and Rocky Mountain Section Joint Meeting, Las Vegas, NV, USA, 2–5 October 2016. [Google Scholar]
- Leezenberg, P.B.; Allan, M.E. InSAR: Pro-Active Technology for Monitoring Environmental Safety and for Reservoir Management. In Proceedings of the SPE Western Regional Meeting, Bakersfield, CA, USA, 23–27 April 2017. [Google Scholar] [CrossRef]
- Mahajan, S.; Hassan, H.; Duggan, T.; Rakesh, D. Compaction and Subsidence Assessment to Optimize Field Development Planning for an Oil Field in Sultanate of Oman. In Proceedings of the Abu Dhabi International Petroleum Exhibition & Conference, Abu Dhabi, United Arab Emirates, 12–15 November 2018. [Google Scholar] [CrossRef]
- Nagel, N.B. Compaction and Subsidence Issues within the Petroleum Industry: From wilmington to Ekofisk and beyond. Phys. Chem. Earth A Solid Earth Geod. 2001, 26, 3–14. [Google Scholar] [CrossRef]
- Fuhrmann, T.; Garthwaite, M.C. Resolving Three-Dimensional Surface Motion with InSAR: Constraints from Multi-Geometry Data Fusion. Remote Sens. 2019, 11, 241. [Google Scholar] [CrossRef]
- Mastro, P.; Masiello, G.; Serio, C.; Pepe, A. Change Detection Techniques with Synthetic Aperture Radar Images: Experiments with Random Forests and Sentinel-1 Observations. Remote Sens. 2022, 14, 3323. [Google Scholar] [CrossRef]
- Naghibi, S.A.; Khodaei, B.; Hashemi, H. An integrated InSAR-machine learning approach for ground deformation rate modeling in arid areas. J. Hydrol. 2022, 608, 127627. [Google Scholar] [CrossRef]
- Brengman, C.M.J.; Barnhart, W.D. Identification of surface deformation in InSAR using machine learning. Geochem. Geophys. Geosyst. 2021, 22, e2020GC009204. [Google Scholar] [CrossRef]
- Anantrasirichai, N.; Biggs, J.; Albino, F.; Bull, D. The application of convolutional neural networks to detect slow, sustaineddeformation in InSAR time series. Geophys. Res. Lett. 2019, 46, 11850–11858. [Google Scholar] [CrossRef]
- Anantrasirichai, N.; Biggs, J.; Kelevitz, K.; Sadeghi, Z.; Wright, T.; Achim, A.M.; Bull, D. Detecting Ground Deformation in the Built Environment Using Sparse Satellite InSAR Data With a Convolutional Neural Network. IEEE Trans. Geosci. Remote Sens. 2020, 59, 2940–2950. [Google Scholar] [CrossRef]
- Mukherjee, S.; Zimmer, A.; Sun, X.; Ghuman, P.; Cheng, I. CNN-based InSAR Coherence Classification. In Proceedings of the 2018 IEEE SENSORS, New Delhi, India, 28–31 October 2018; pp. 1–4. [Google Scholar]
- Liu, Y.; Yao, X.; Gu, Z.; Zhou, Z.; Liu, X.; Chen, X.; Wei, S. Study of the Automatic Recognition of Landslides by Using InSAR Images and the Improved Mask R-CNN Model in the Eastern Tibet Plateau. Remote Sens. 2022, 14, 3362. [Google Scholar] [CrossRef]


| Sensor Imaging Mode | Track | Resolutions: Range Azimuth [m × m] &Swath [km] | Revisit Time (Days) | Count of Images | Temporal Span | Polarization Used | Interferometric Mode | Wavelength |
|---|---|---|---|---|---|---|---|---|
| TerraSAR-X (TSX) | ACS | 3 × 3; 30 | 11 | 119 | 1 January 2018 and 31 December 2021 | HH | StripMap | X-band (3 cm, 9.65 GHz) |
| Cosmo-SkyMED (CSK) Stripmap mode | DSC | 3 × 3; 40 | 4 | 87 | 1 January 2018 and 31 December 2020 | HH | StripMap HIMAGE | X-band (3.1 cm, 9.6 GHz) |
| ASC | 28 | |||||||
| 60 | ||||||||
| Sentinel-1 (SNT1) | DSC | 5 × 20; 250 | 6 | 117 | 1 January 2018 and 31 December 2021 | VV | Interferometric Wide Swath (IW) mode | C-band (5.6 cm wavelength and 5.4 GHz) |
| ASC | 121 | |||||||
| 114 |
Publisher’s Note: MDPI stays neutral with regard to jurisdictional claims in published maps and institutional affiliations. |
© 2022 by the authors. Licensee MDPI, Basel, Switzerland. This article is an open access article distributed under the terms and conditions of the Creative Commons Attribution (CC BY) license (https://creativecommons.org/licenses/by/4.0/).
Share and Cite
Bayramov, E.; Tessari, G.; Kada, M. Quantifying Two-Dimensional Surface Displacements Using High-Resolution Cosmo-SkyMed, TerraSAR-X and Medium-Resolution Sentinel-1 SAR Interferometry: Case Study for the Tengiz Oilfield. Sensors 2022, 22, 6416. https://doi.org/10.3390/s22176416
Bayramov E, Tessari G, Kada M. Quantifying Two-Dimensional Surface Displacements Using High-Resolution Cosmo-SkyMed, TerraSAR-X and Medium-Resolution Sentinel-1 SAR Interferometry: Case Study for the Tengiz Oilfield. Sensors. 2022; 22(17):6416. https://doi.org/10.3390/s22176416
Chicago/Turabian StyleBayramov, Emil, Giulia Tessari, and Martin Kada. 2022. "Quantifying Two-Dimensional Surface Displacements Using High-Resolution Cosmo-SkyMed, TerraSAR-X and Medium-Resolution Sentinel-1 SAR Interferometry: Case Study for the Tengiz Oilfield" Sensors 22, no. 17: 6416. https://doi.org/10.3390/s22176416
APA StyleBayramov, E., Tessari, G., & Kada, M. (2022). Quantifying Two-Dimensional Surface Displacements Using High-Resolution Cosmo-SkyMed, TerraSAR-X and Medium-Resolution Sentinel-1 SAR Interferometry: Case Study for the Tengiz Oilfield. Sensors, 22(17), 6416. https://doi.org/10.3390/s22176416