
Measurement of Linear Springs’ Stiffness Factor Using Ultrasonic Sensing


Abstract
1. Introduction
2. Experimental Method
2.1. Linear Spring Stiffness Factor k
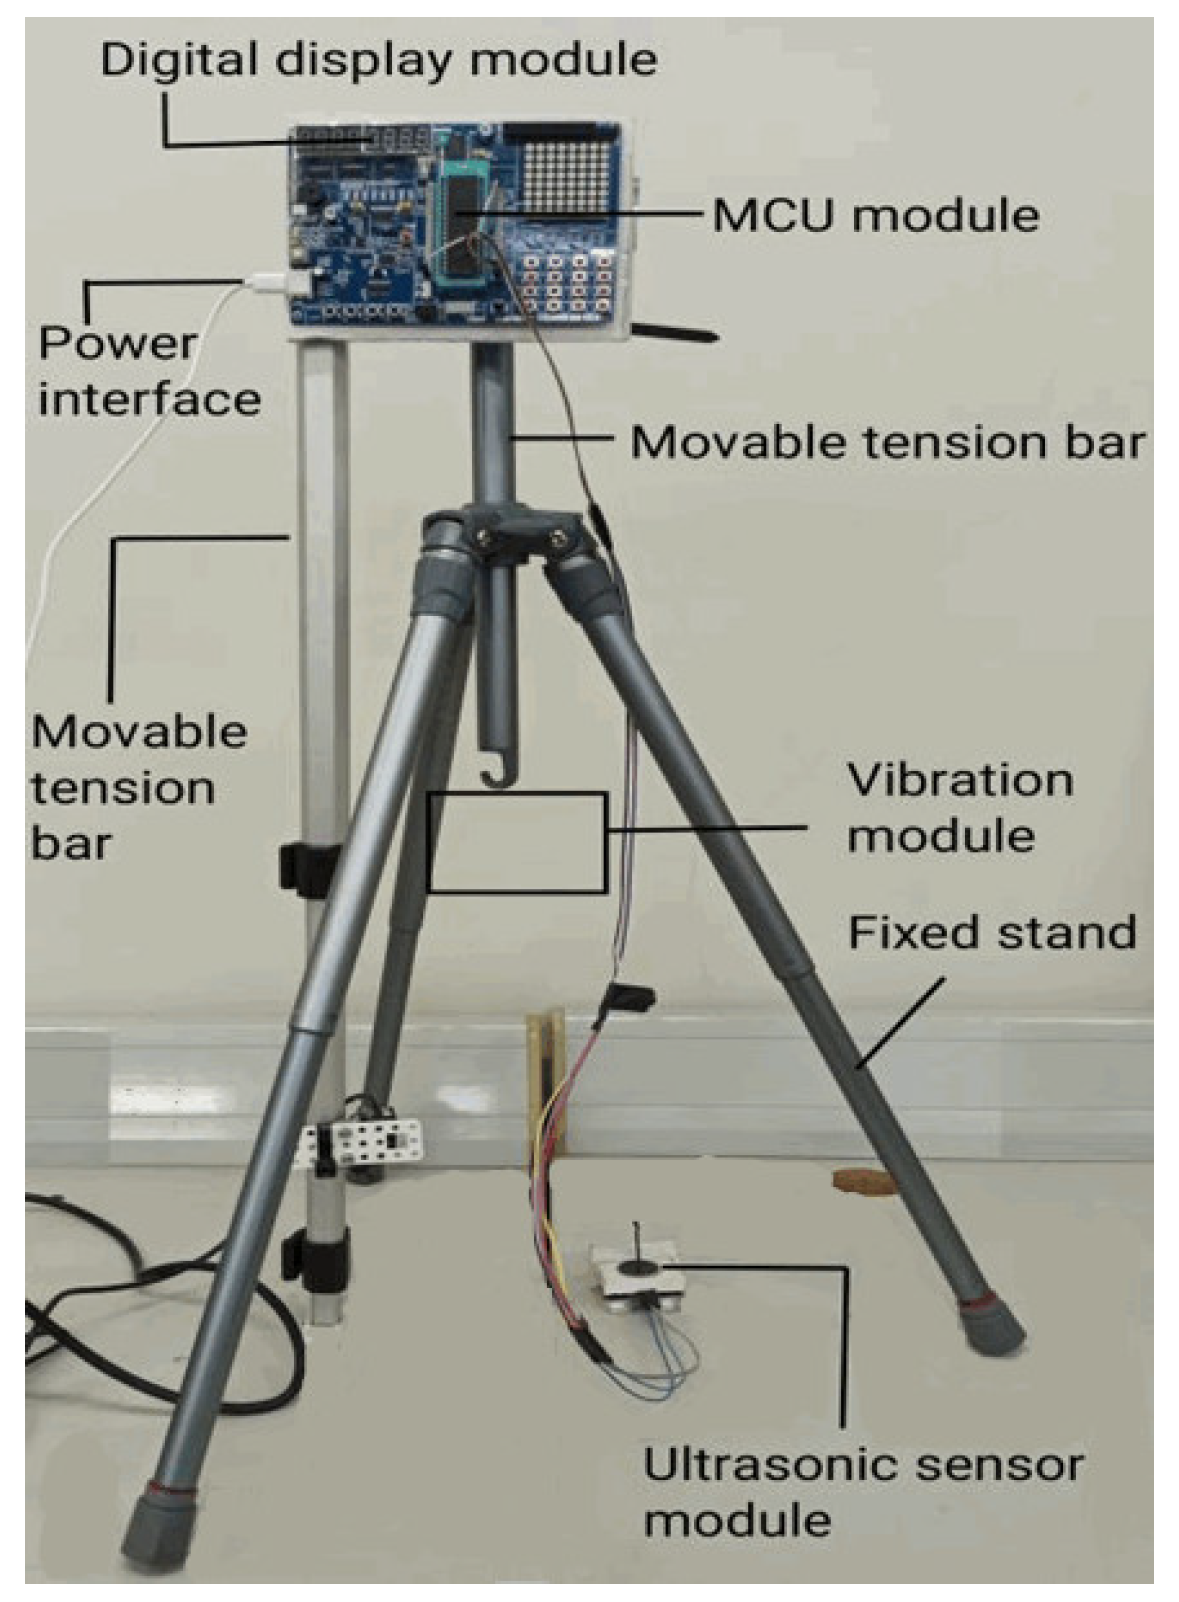
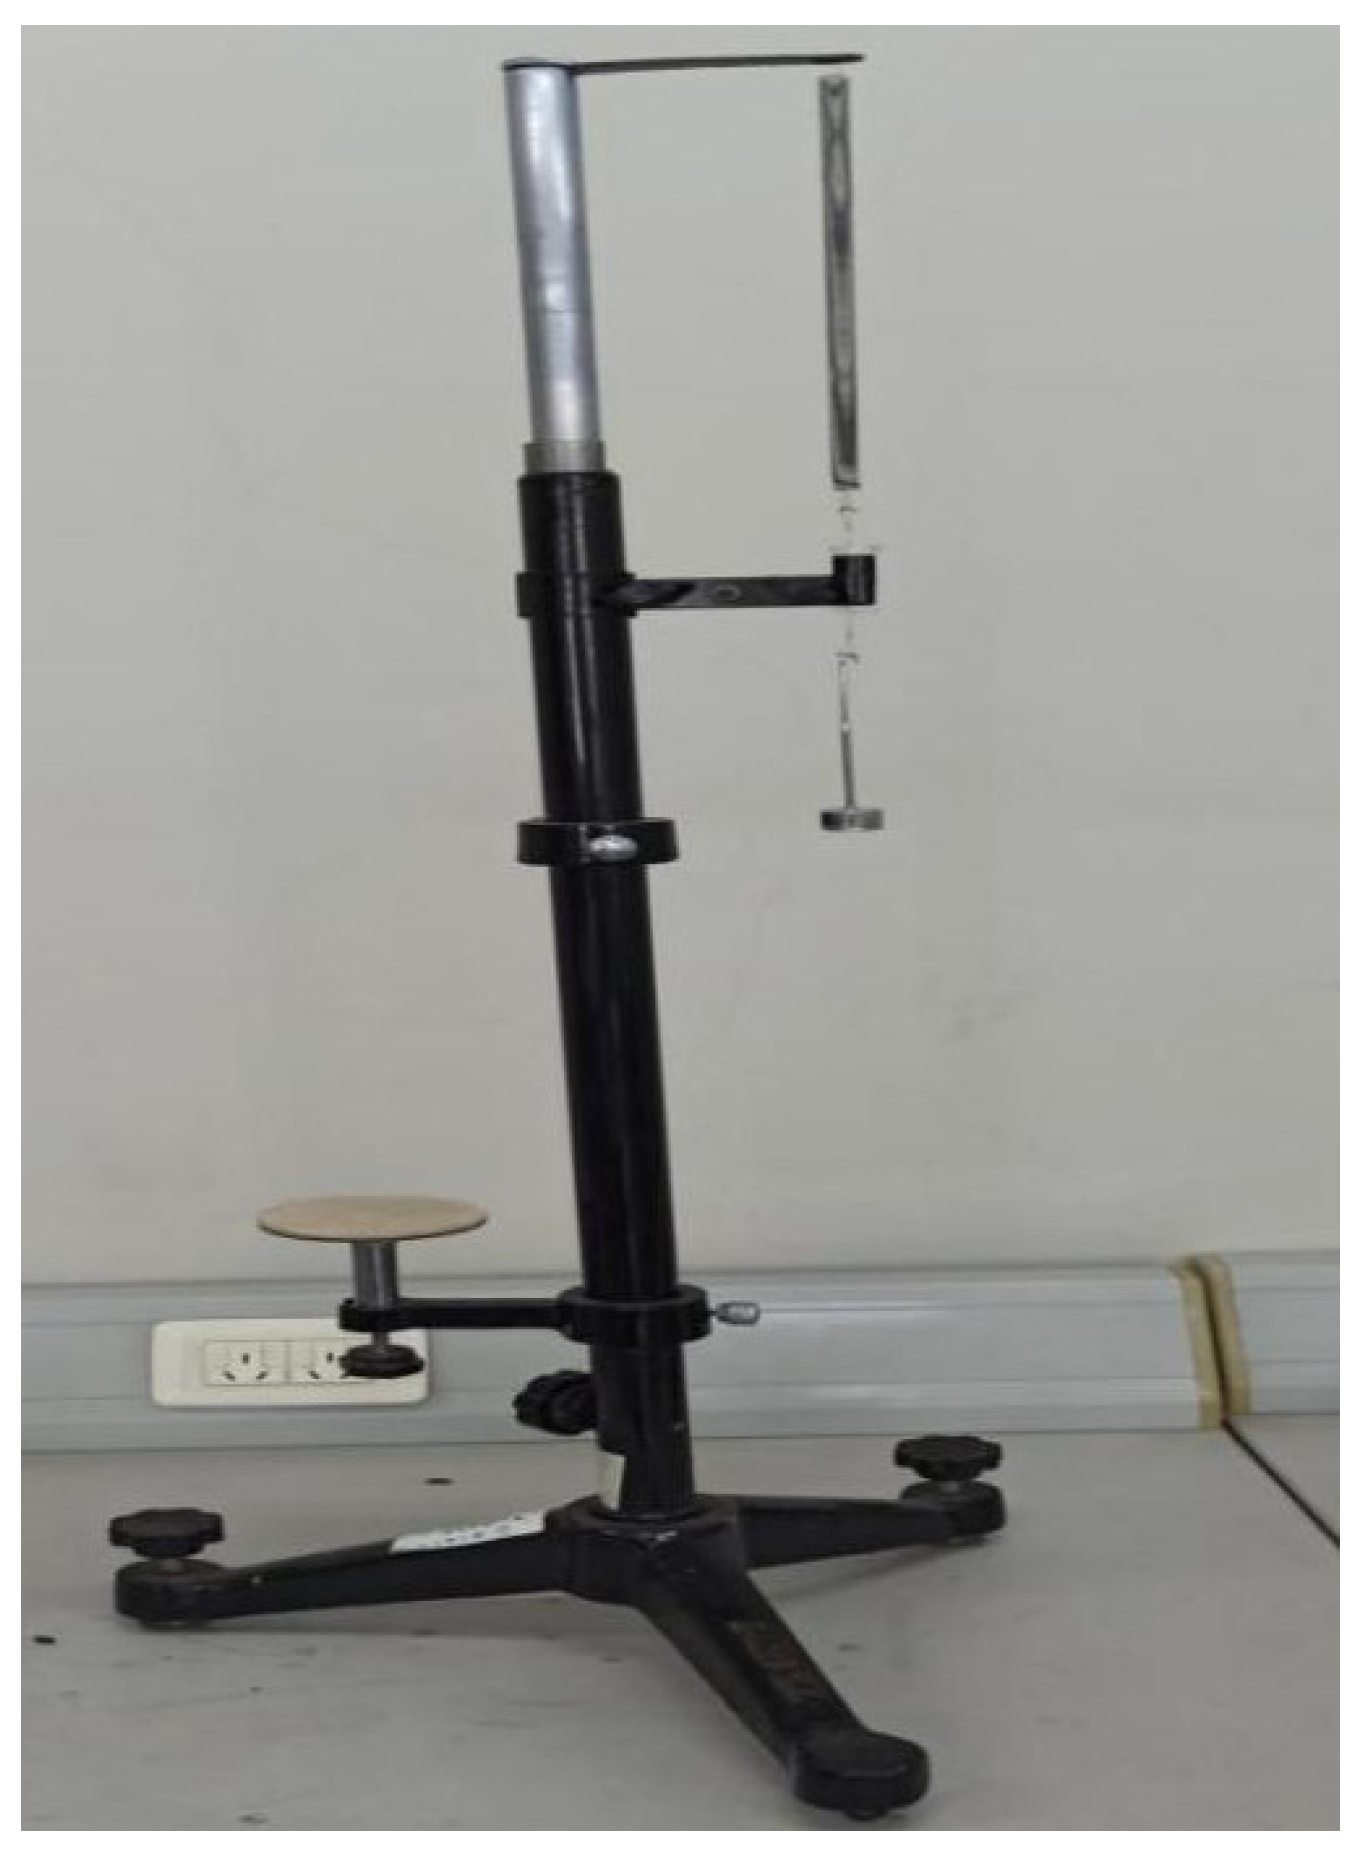
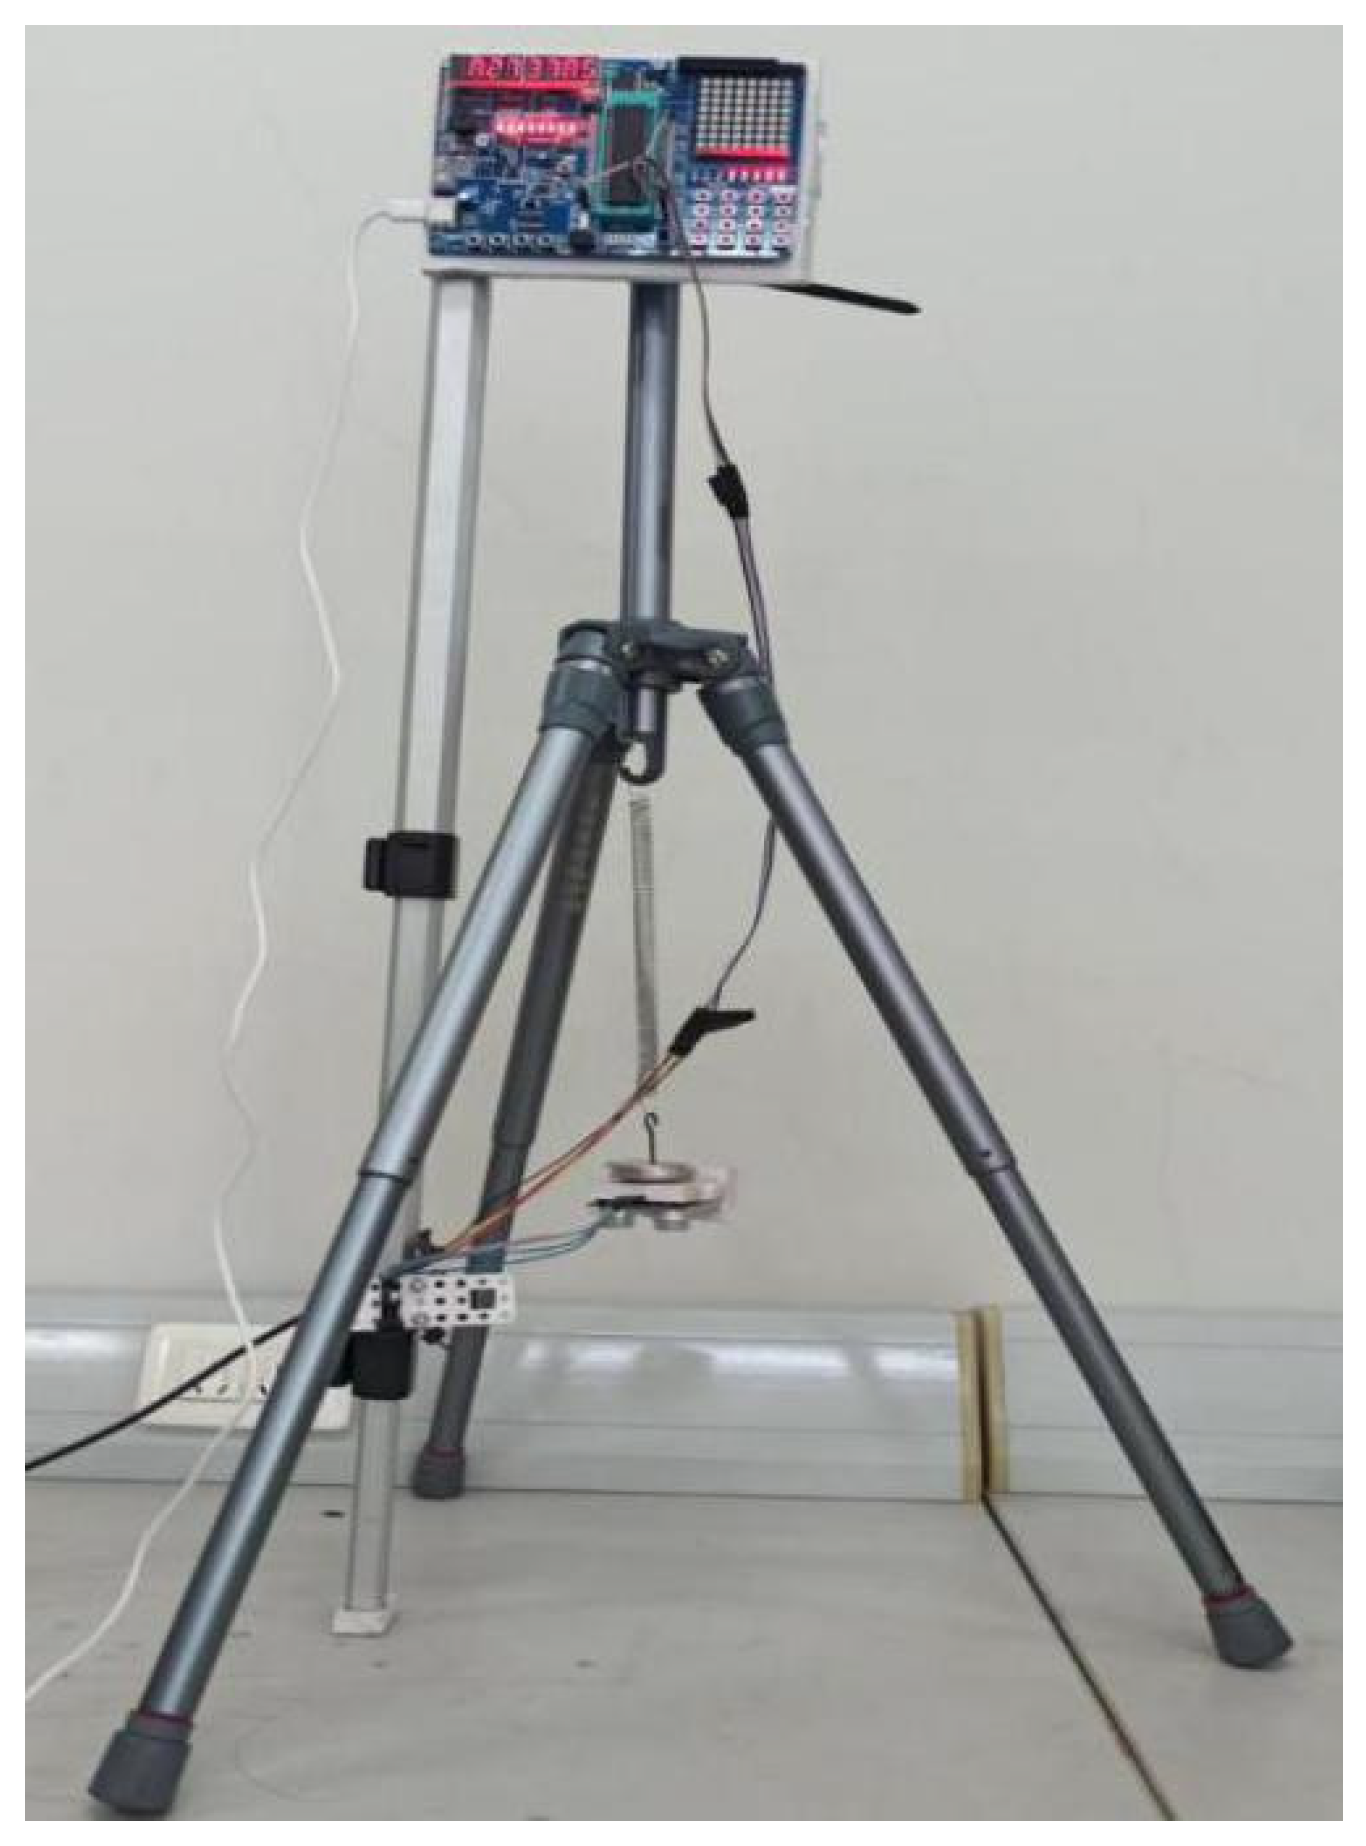
2.2. Device Composition
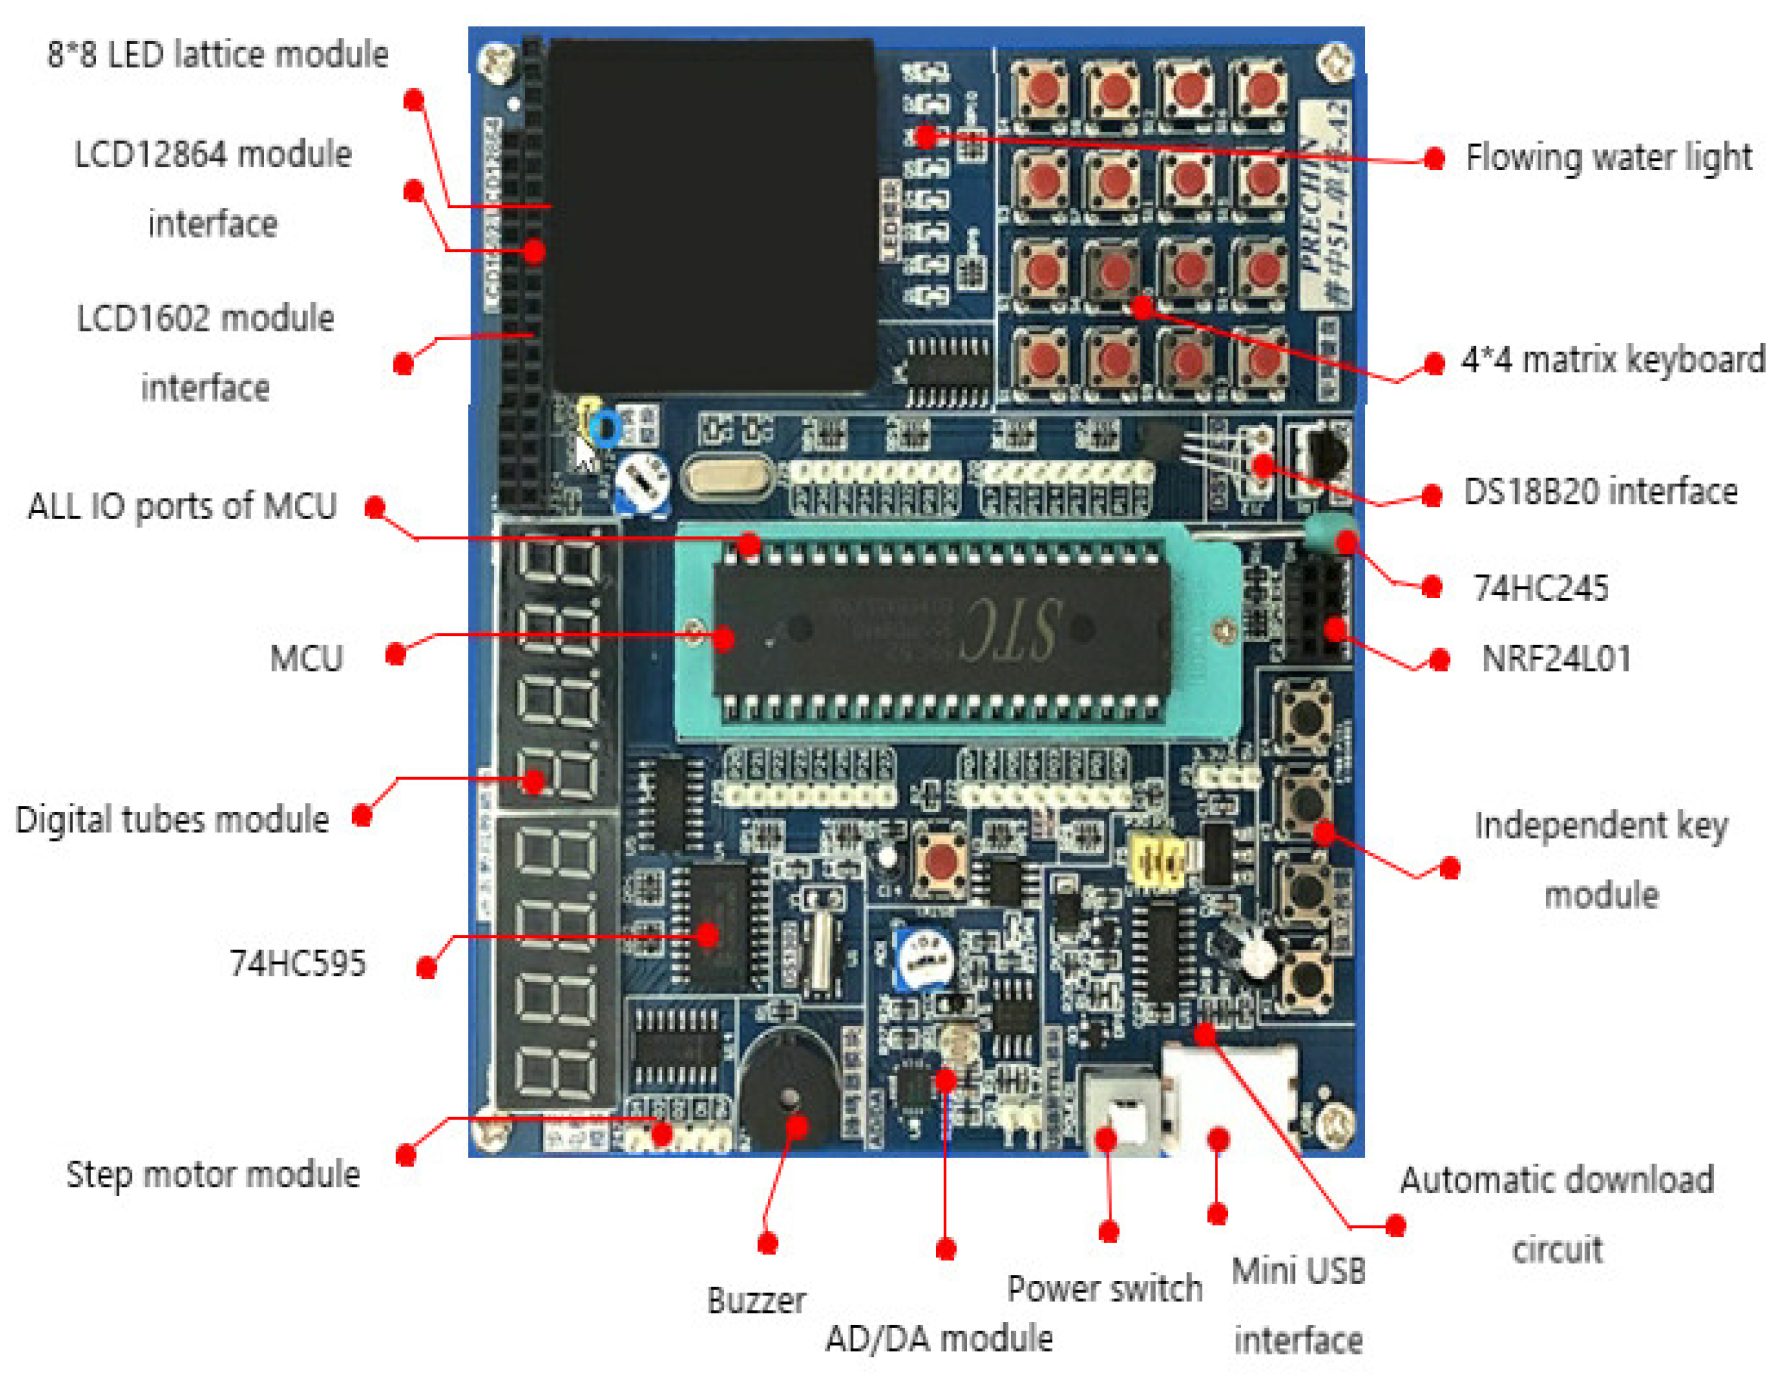
2.2.1. Single-Chip MCU Module
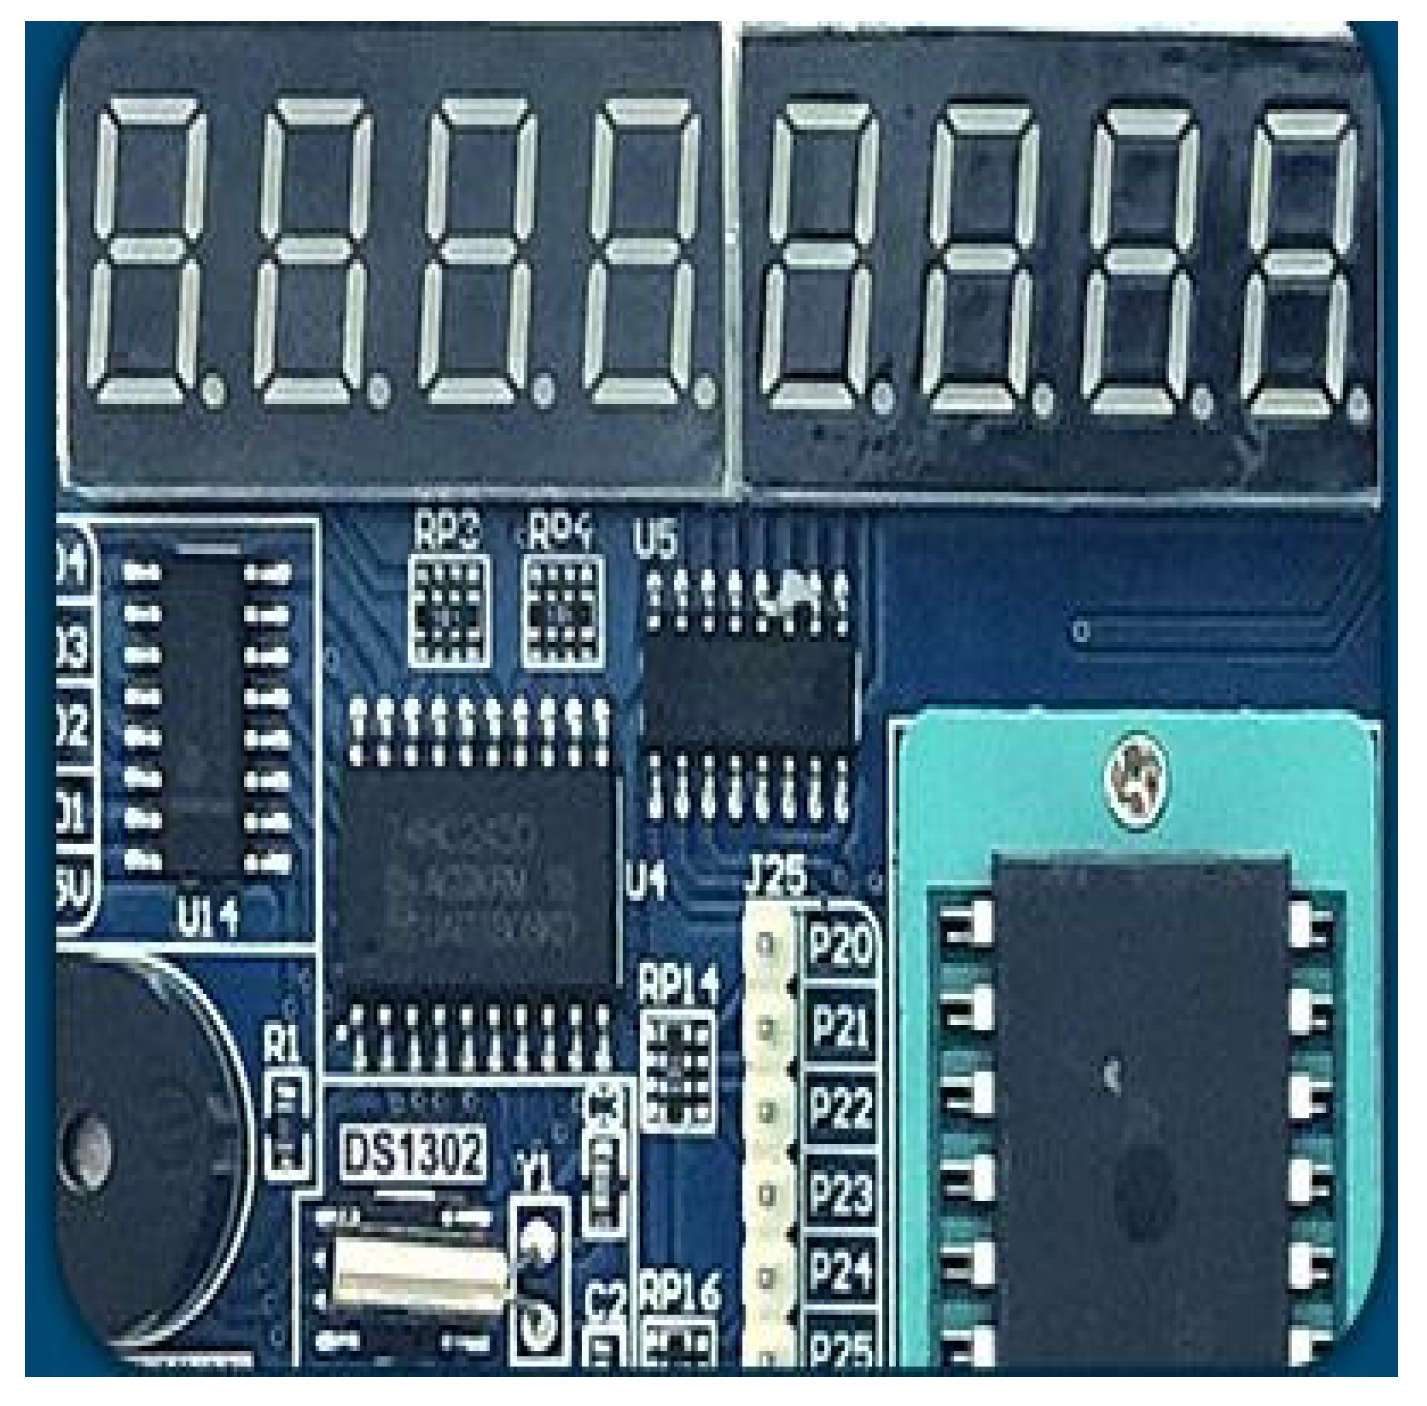
2.2.2. Digital Display Module
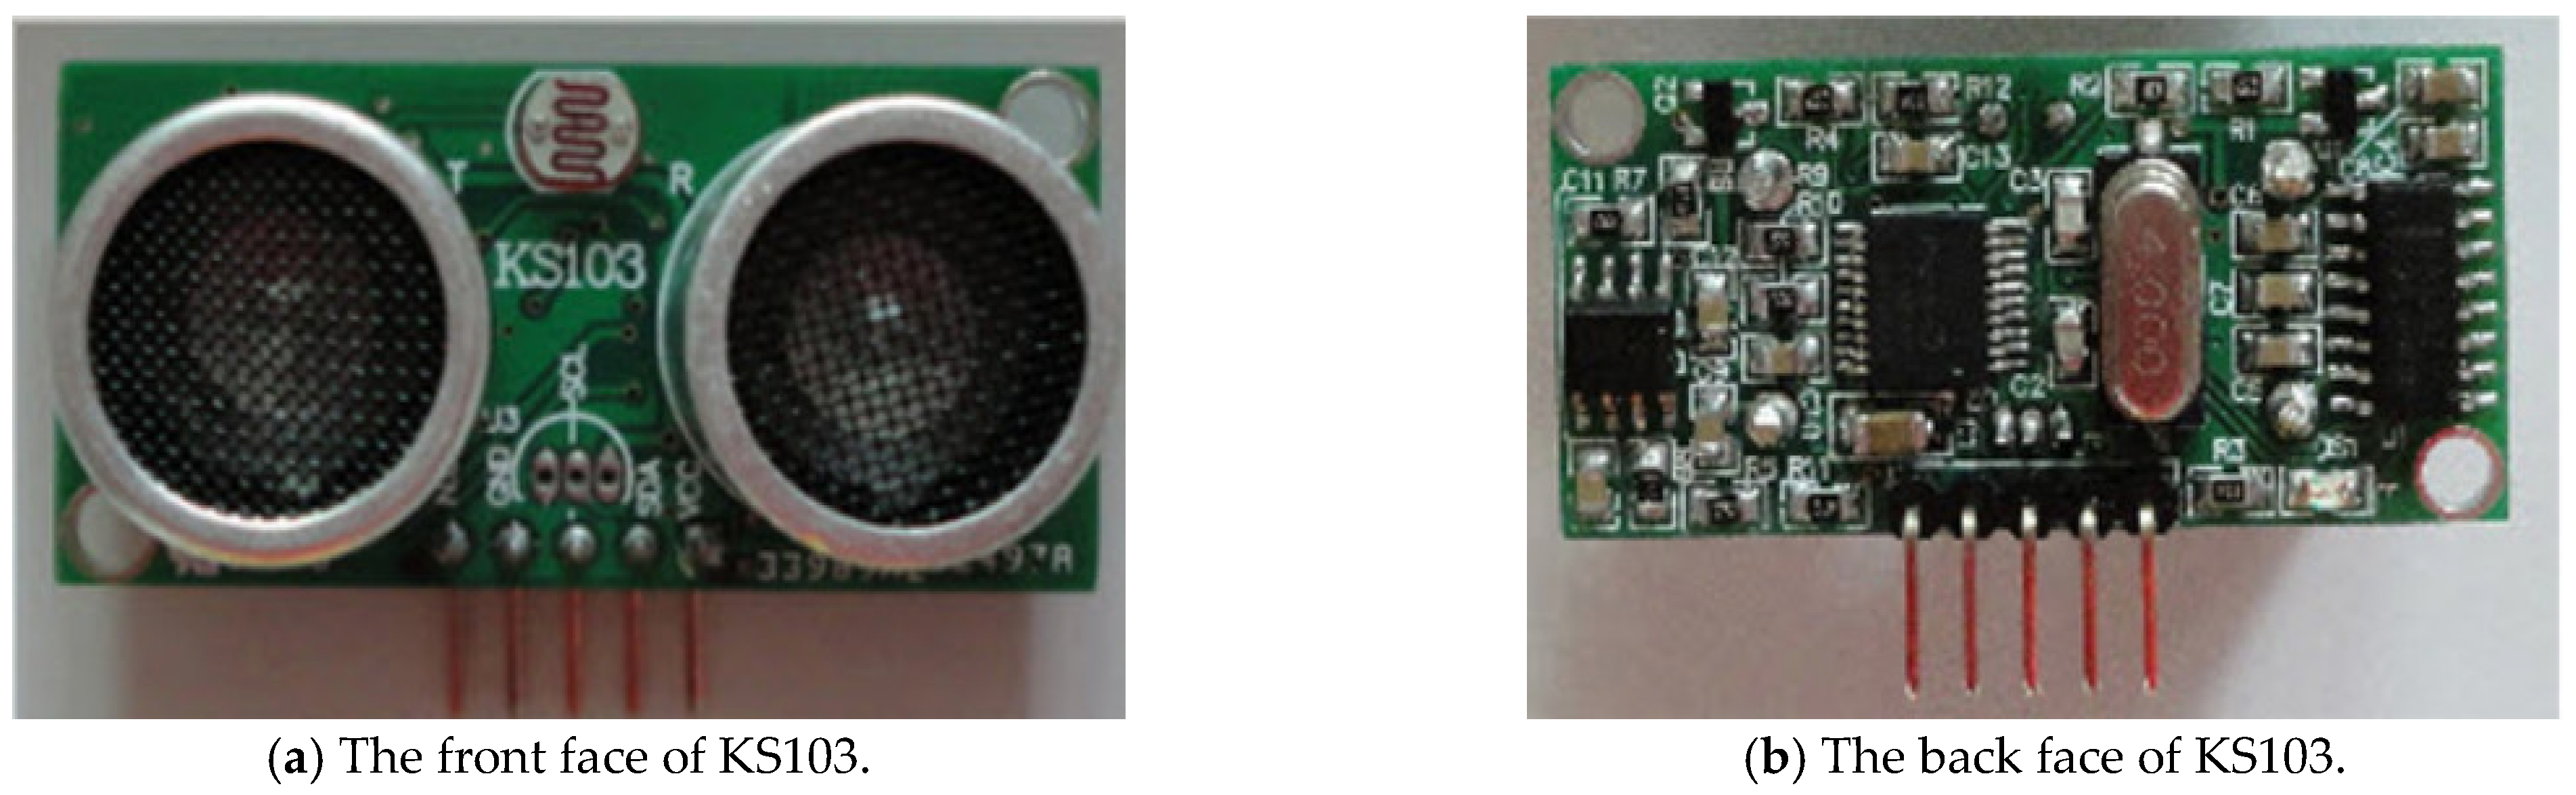
2.2.3. Ultrasonic Sensor Module
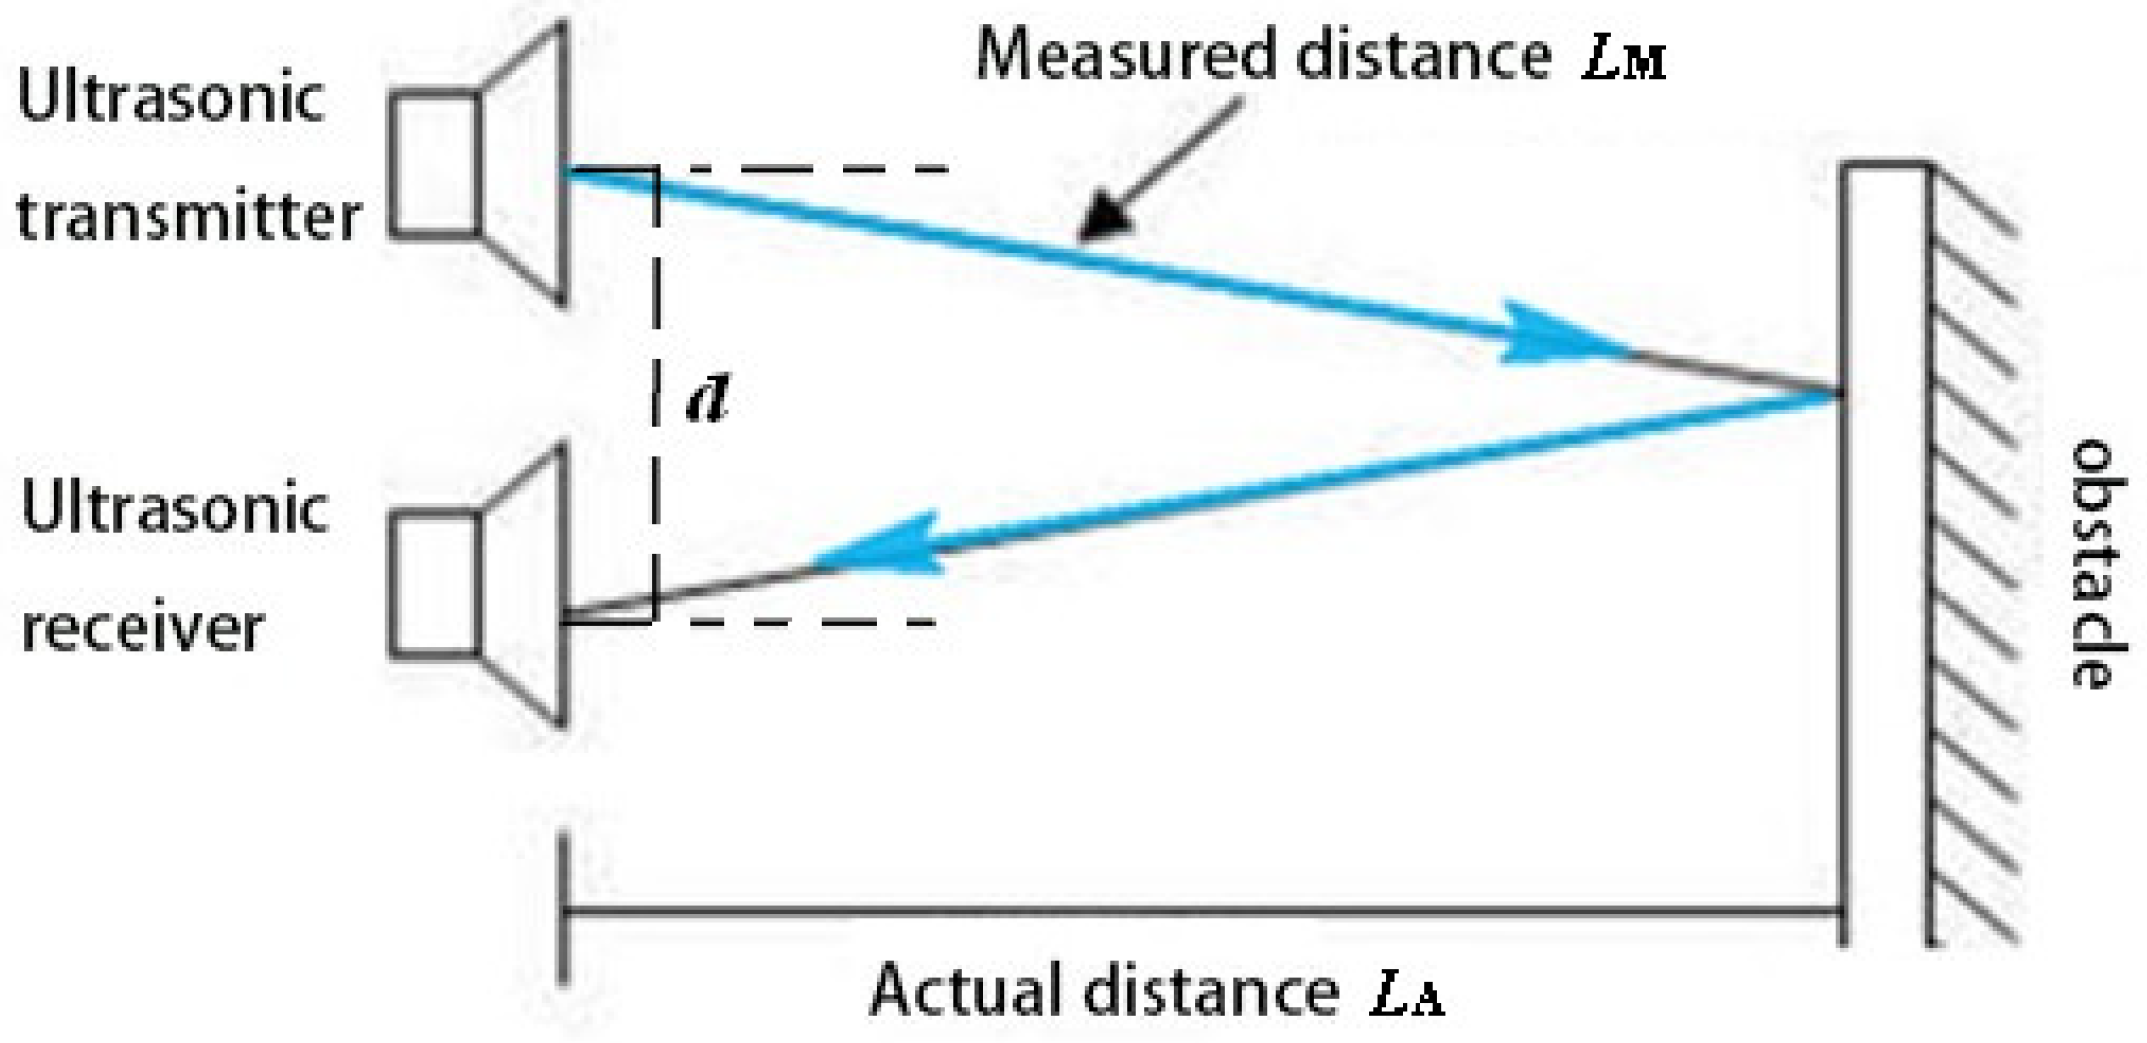
2.3. Physical Principle of Ultrasonic Ranging
3. Measuring Linear Springs’ Stiffness Factors
4. Conclusions
Author Contributions
Funding
Institutional Review Board Statement
Informed Consent Statement
Data Availability Statement
Acknowledgments
Conflicts of Interest
References
- Tan, B.; Feyzullahoglu, E. The investigation of effects of environmental conditions on fatigue strength and spring stiffness of rubber materials. J. Elastom. Plast. 2021, 53, 632–652. [Google Scholar] [CrossRef]
- Liu, M.; Zhan, J.; Zhu, B.; Zhang, X. Topology optimization of compliant mechanism considering actual output displacement using adaptive output spring stiffness. Mech. Mach. Theory 2020, 146, 103728. [Google Scholar] [CrossRef]
- Wu, J.; Zhang, L.; Wan, L. A mode-III crack under adhesion studied by non-uniform linear spring models. Acta Mech. 2017, 228, 1621–1629. [Google Scholar] [CrossRef]
- Chung, D.D.L.; Shi, K. Sensing the stress in steel by capacitance measurement. Sens. Actuators A Phys. 2018, 274, 244–251. [Google Scholar] [CrossRef]
- Yi, H. Simulation of Shape Memory Alloy (SMA)-Bias Spring Actuation for Self-Shaping Architecture: Investigation of Parametric Sensitivity. Materials 2020, 13, 2485. [Google Scholar] [CrossRef]
- Rantz, R.; Halim, M.A.; Xue, T.; Zhang, Q.; Gu, L.; Yang, K.; Roundy, S. Architectures for wrist-worn energy harvesting. Smart Mater. Struct. 2018, 27, 0440014. [Google Scholar] [CrossRef]
- Jiang, Q.; Qiao, Y.; Zhao, F.; Pan, Z.; Wu, X.; Wu, L.; Fu, H. Composite helical spring with skin-core structure: Structural design and compression property evaluation. Polym. Compos. 2020, 42, 1292–1304. [Google Scholar] [CrossRef]
- Xue, Z.; Sun, M.; Dong, T.; Tang, Z.; Zhao, Y.; Wang, J.; Wei, X.; Yu, L.; Chen, Q.; Xu, J.; et al. Deterministic Line-Shape Programming of Silicon Nanowires for Extremely Stretchable Springs and Electronics. Nano. Lett. 2017, 17, 7638–7646. [Google Scholar] [CrossRef]
- Chunling, Z.; Qian, S.; Xiumei, C.; Lei, T. Discussion on the experiment of measuring the effective mass of spring by Jolly’s scale. Coll. Phys. 2017, 36, 31–35. [Google Scholar]
- Graves, J.; Kuang, Y.; Zhu, M. Pendulum energy harvester with torsion spring mechanical energy storage regulator. Sens. Actuators A Phys. 2022, 339, 113505. [Google Scholar] [CrossRef]
- Martynov, N.I. Complex Form of Hooke’s Law of Anisotropic Elastic Body. Mech. Solids 2020, 55, 514–535. [Google Scholar] [CrossRef]
- Fahy, S.; O’Riordan, J.; O’Sullivan, C.; Twomey, P. How reflected wave fronts dynamically establish Hooke’s law in a spring. Eur. J. Phys. 2012, 33, 417–426. [Google Scholar] [CrossRef]
- Zhu, X.; Huang, Z.; Wang, G.; Li, W.; Zou, D.; Li, C. Ultrasonic detection based on polarization-dependent optical reflection. Opt. Lett. 2017, 42, 439–441. [Google Scholar] [CrossRef] [PubMed]
- Kim, G.; Seo, M.; Choi, N.; Baek, K.S.; Kim, K. Application of KLM Model for an Ultrasonic Through-Transmission Method. Int. J. Precis Eng. Man. 2019, 20, 383–393. [Google Scholar] [CrossRef]
- Kang, H.S.; Song, C.G.; Lee, K.I. Simultaneous measurement of acoustic pressure and temperature at the focus of high intensity focused ultrasound in a tissue-mimicking phantom by using a fiber-optic hydrophone. Jpn. J. Appl. Phys. 2019, 58, 0909089. [Google Scholar] [CrossRef]
- Cao, Y.; Chen, Q.; Zheng, H.; Lu, L.; Wang, Y.; Zhu, J. Study on the Mechanism of Ultrasonic Power Measurement Sensor based on Pyroelectric Effect. Acoust. Phys. 2018, 64, 789–795. [Google Scholar] [CrossRef]
- Bakhtiari-Nejad, M. Multi-focal transmission acoustic phase holograms in contactless ultrasonic power transfer systems. Sens. Actuators A Phys. 2022, 340, 113551. [Google Scholar] [CrossRef]
- Kang, L.; Feeney, A.; Dixon, S. The High Frequency Flexural Ultrasonic Transducer for Transmitting and Receiving Ultrasound in Air. IEEE Sens. J. 2020, 20, 7653–7660. [Google Scholar] [CrossRef]
- Zhong, H.; Duan, T.; Lan, H.; Zhou, M.; Gao, F. Review of Low-Cost Photoacoustic Sensing and Imaging Based on Laser Diode and Light-Emitting Diode. Sensors 2018, 18, 2264. [Google Scholar] [CrossRef]
- Harvey, G.; Gachagan, A.; Mutasa, T. Review of High-Power Ultrasound-Industrial Applications and Measurement Methods. IEEE T. Ultrason. Ferr. 2014, 61, 481–495. [Google Scholar] [CrossRef]
- De Simone, M.C.; Rivera, Z.B.; Guida, D. Obstacle Avoidance System for Unmanned Ground Vehicles by Using Ultrasonic Sensors. Machines 2018, 6, 18. [Google Scholar] [CrossRef]
- Li, S.; Feng, C.; Liang, X.; Qin, H.; Li, H.; Shi, L. A Guided Vehicle under Fire Conditions Based on a Modified Ultrasonic Obstacle Avoidance Technology. Sensors 2018, 18, 4366. [Google Scholar] [CrossRef] [PubMed]
- Li, H.; Liu, Y.; Deng, J.; Chen, W.; Li, K. Design philosophy for ultrasonic motors using the bending hybrid modes. Sens. Actuators A Phys. 2021, 331, 113029. [Google Scholar] [CrossRef]
- Fitzka, M.; Rennhofer, H.; Catoor, D.; Reiterer, M.; Lichtenegger, H.; Checchia, S.; di Michiel, M.; Irrasch, D.; Gruenewald, T.A.; Mayer, H. High Speed In Situ Synchrotron Observation of Cyclic Deformation and Phase Transformation of Superelastic Nitinol at Ultrasonic Frequency. Exp. Mech. 2020, 60, 317–328. [Google Scholar] [CrossRef]
- Robichaud, A.; Cicek, P.; Deslandes, D.; Nabki, F. Frequency Tuning Technique of Piezoelectric Ultrasonic Transducers for Ranging Applications. J. Microelectromech. S. 2018, 27, 570–579. [Google Scholar] [CrossRef]
- Wang, Y.; Qiao, Y.; Zhang, H.; Gao, Y.; Zhang, M.; Tan, H.; Wang, D.; Jin, B. Transformerless Ultrasonic Ranging System with the Feature of Intrinsic Safety for Explosive Environment. Sensors 2018, 18, 4397. [Google Scholar] [CrossRef]
- Liu, L.; Guo, R.; Wu, J. Design of a fast echo matching algorithm to reduce crosstalk with Doppler shifts in ultrasonic ranging. Meas. Sci. Technol. 2017, 28, 025103. [Google Scholar] [CrossRef]
- Zhang, B.; Wei, Y.; Liu, W.; Zhang, Y.; Yao, Z.; Zhang, L.; Xiong, J. A Novel Ultrasonic Method for Liquid Level Measurement Based on the Balance of Echo Energy. Sensors 2017, 17, 706. [Google Scholar] [CrossRef]
- Mujahid, A.; Afzal, A.; Dickert, F.L. An Overview of High Frequency Acoustic Sensors-QCMs, SAWs and FBARs-Chemical and Biochemical Applications. Sensors 2019, 19, 4395. [Google Scholar] [CrossRef]
- Guntekin, E.; Aydin, T.Y.; Niemz, P. Prediction of Compression Properties in Three Orthotropic Directions for Some Important Turkish Wood Species Using Ultrasound. Bioresources 2015, 10, 7252–7262. [Google Scholar] [CrossRef]


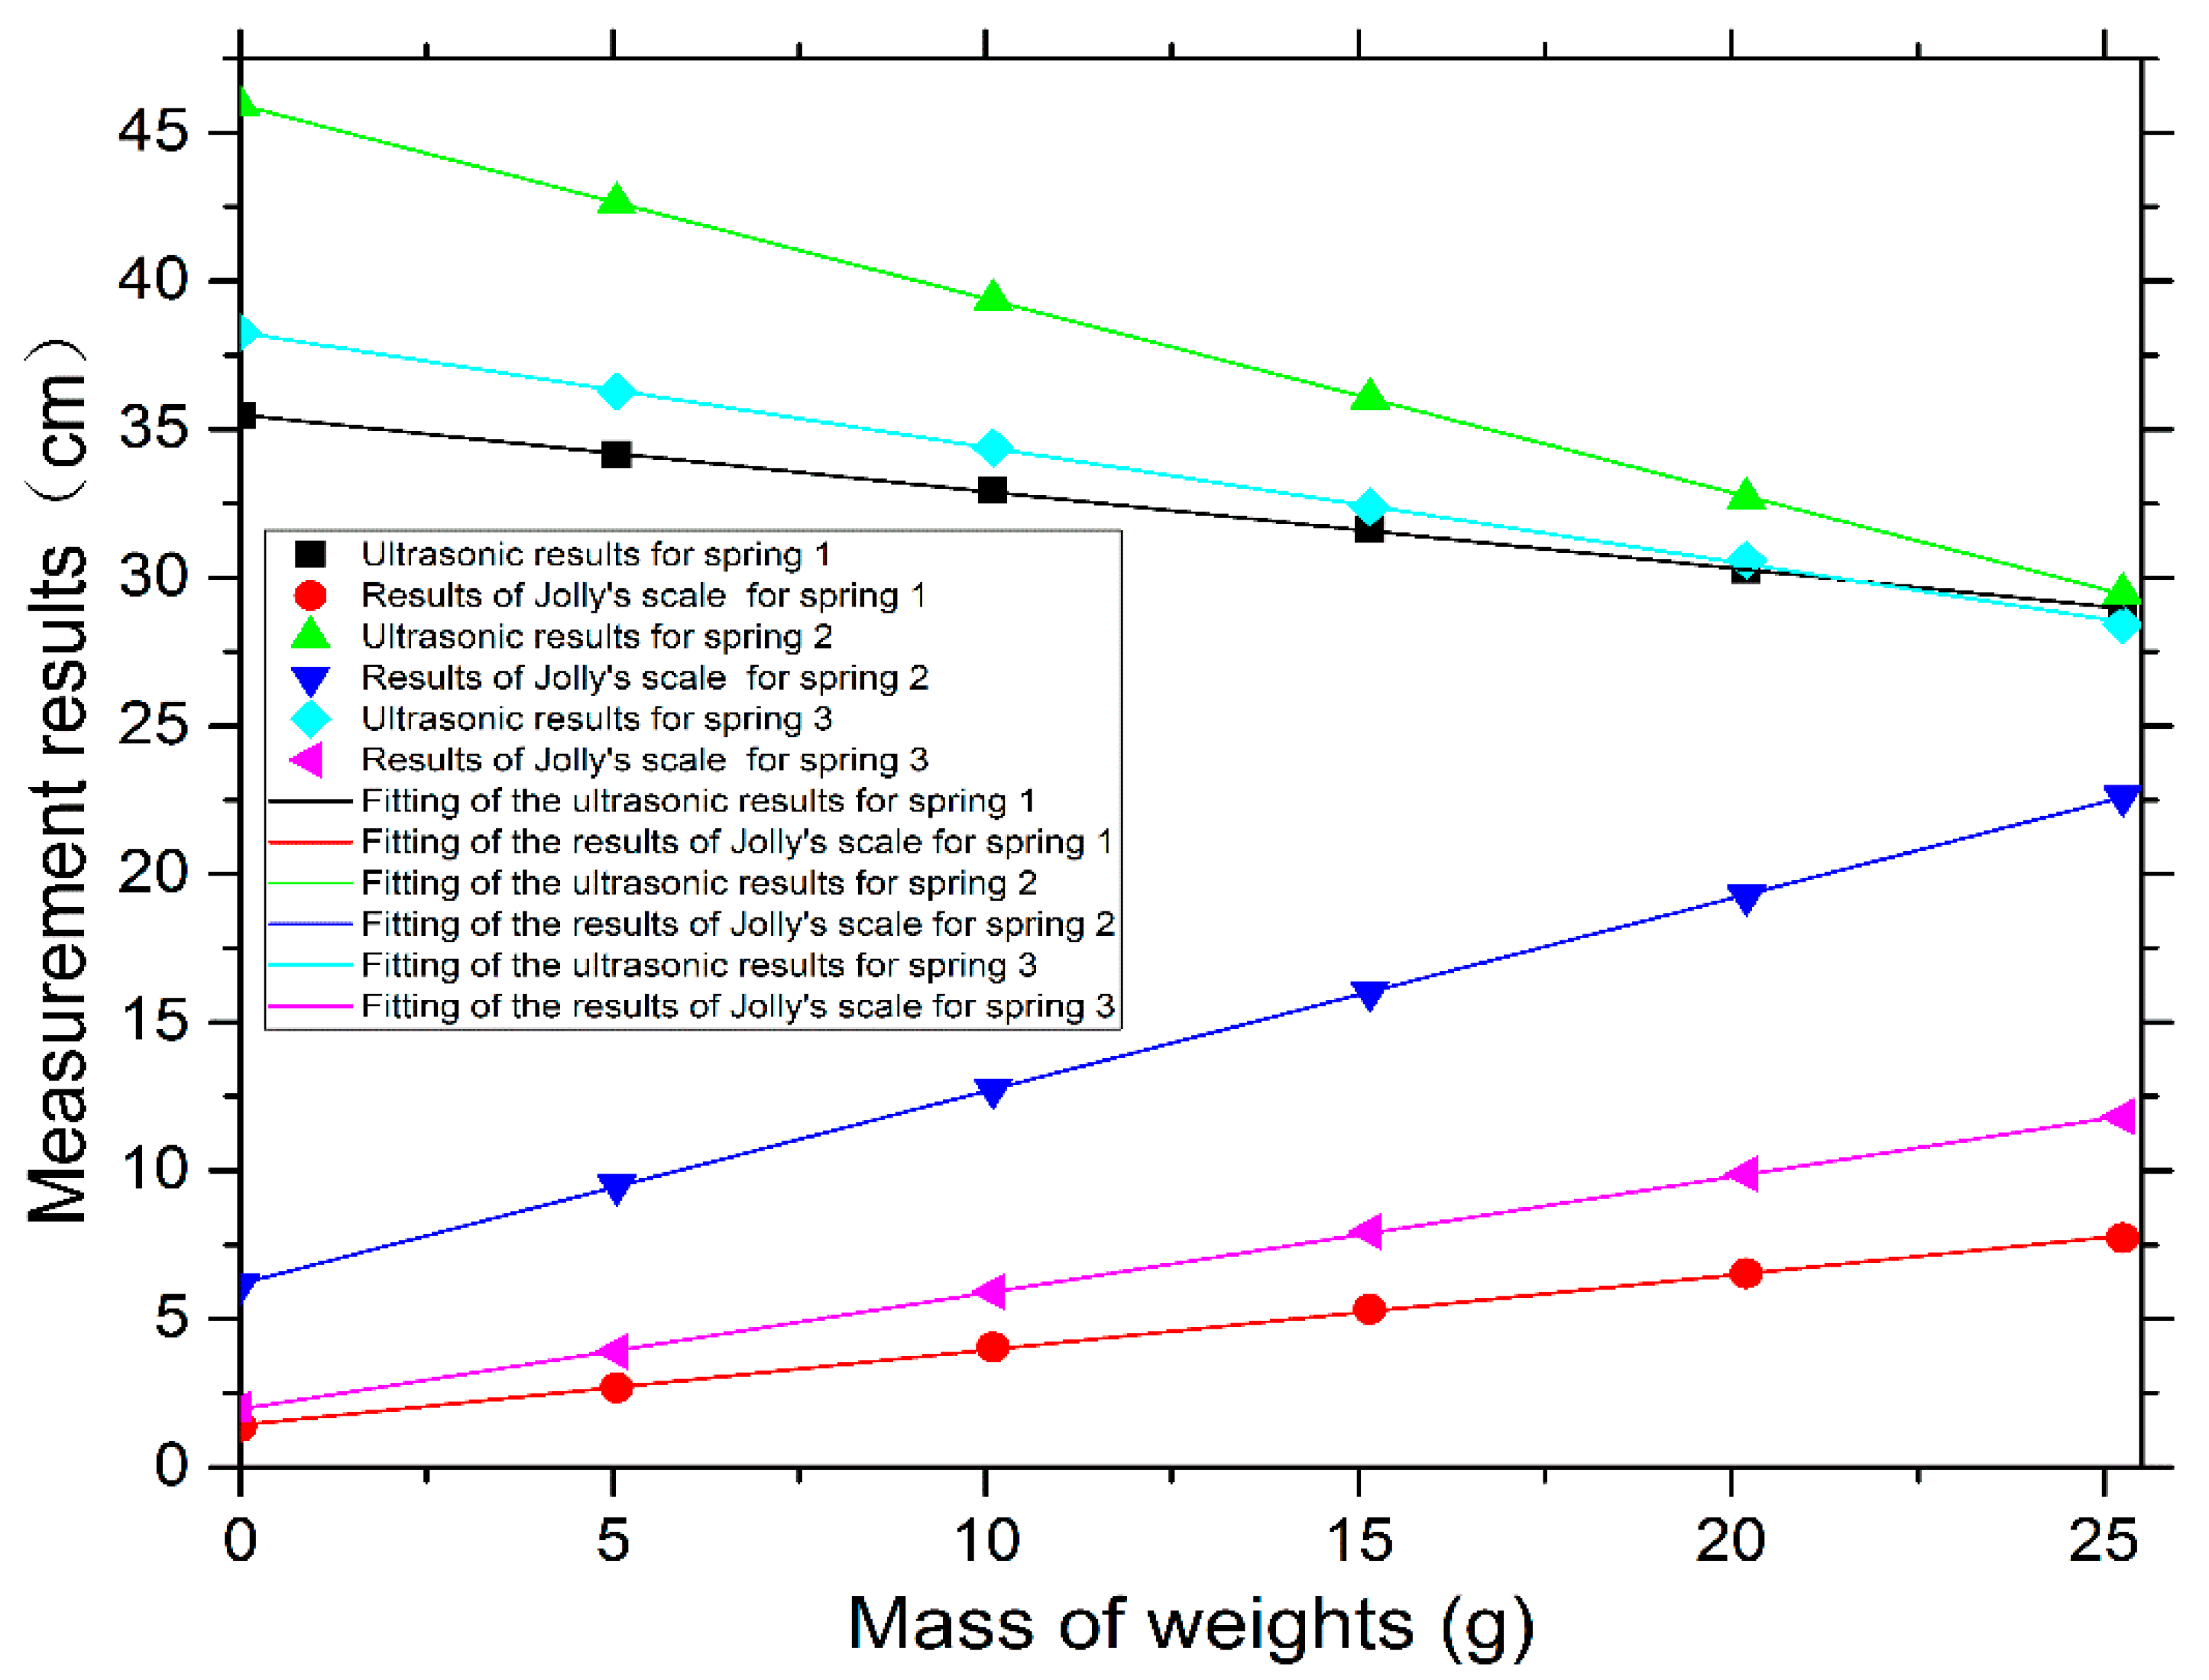
| Mass of Weights (g) | 0.00 | 5.05 | 10.10 | 15.15 | 20.20 | 25.25 | |||||
|---|---|---|---|---|---|---|---|---|---|---|---|
| Group | Measuring Tool | k (N/m) | Standard Deviation of the Deformation (cm) | Relative Error of k (%) | |||||||
| Spring 1 | Jolly’s scale | 1.37 | 2.67 | 4.05 | 5.33 | 6.54 | 7.73 | 3.84 | 3.87 | 0.14 | 1.8 |
| Ultrasonic sensor | 35.45 | 34.16 | 32.94 | 31.61 | 30.26 | 28.92 | 3.92 | 3.79 | 0.09 | 0.26 | |
| True value k0 | / | / | / | / | / | / | / | 3.80 | / | / | |
| Spring 2 | Jolly’s scale | 6.16 | 9.50 | 12.76 | 16.03 | 19.27 | 22.61 | 9.83 | 1.51 | 0.05 | 0.67 |
| Ultrasonic sensor | 45.92 | 42.64 | 39.37 | 36.04 | 32.69 | 29.47 | 9.91 | 1.50 | 0.04 | 0.00 | |
| True value k0 | / | / | / | / | / | / | / | 1.50 | / | / | |
| Spring 3 | Jolly’s scale | 1.98 | 3.90 | 5.91 | 7.84 | 9.78 | 11.72 | 5.85 | 2.54 | 0.04 | 1.6 |
| Ultrasonic sensor | 38.26 | 36.27 | 34.38 | 32.32 | 30.34 | 28.46 | 5.93 | 2.50 | 0.01 | 0.00 | |
| True value k0 | / | / | / | / | / | / | / | 2.50 | / | / |
| Mass of Weights (g) | 0.00 | 5.05 | 10.10 | 15.15 | 20.20 | 25.25 | ||||
|---|---|---|---|---|---|---|---|---|---|---|
| Date | Time | Temperature (°C) | Humidity (%) | ki (N/m) | ||||||
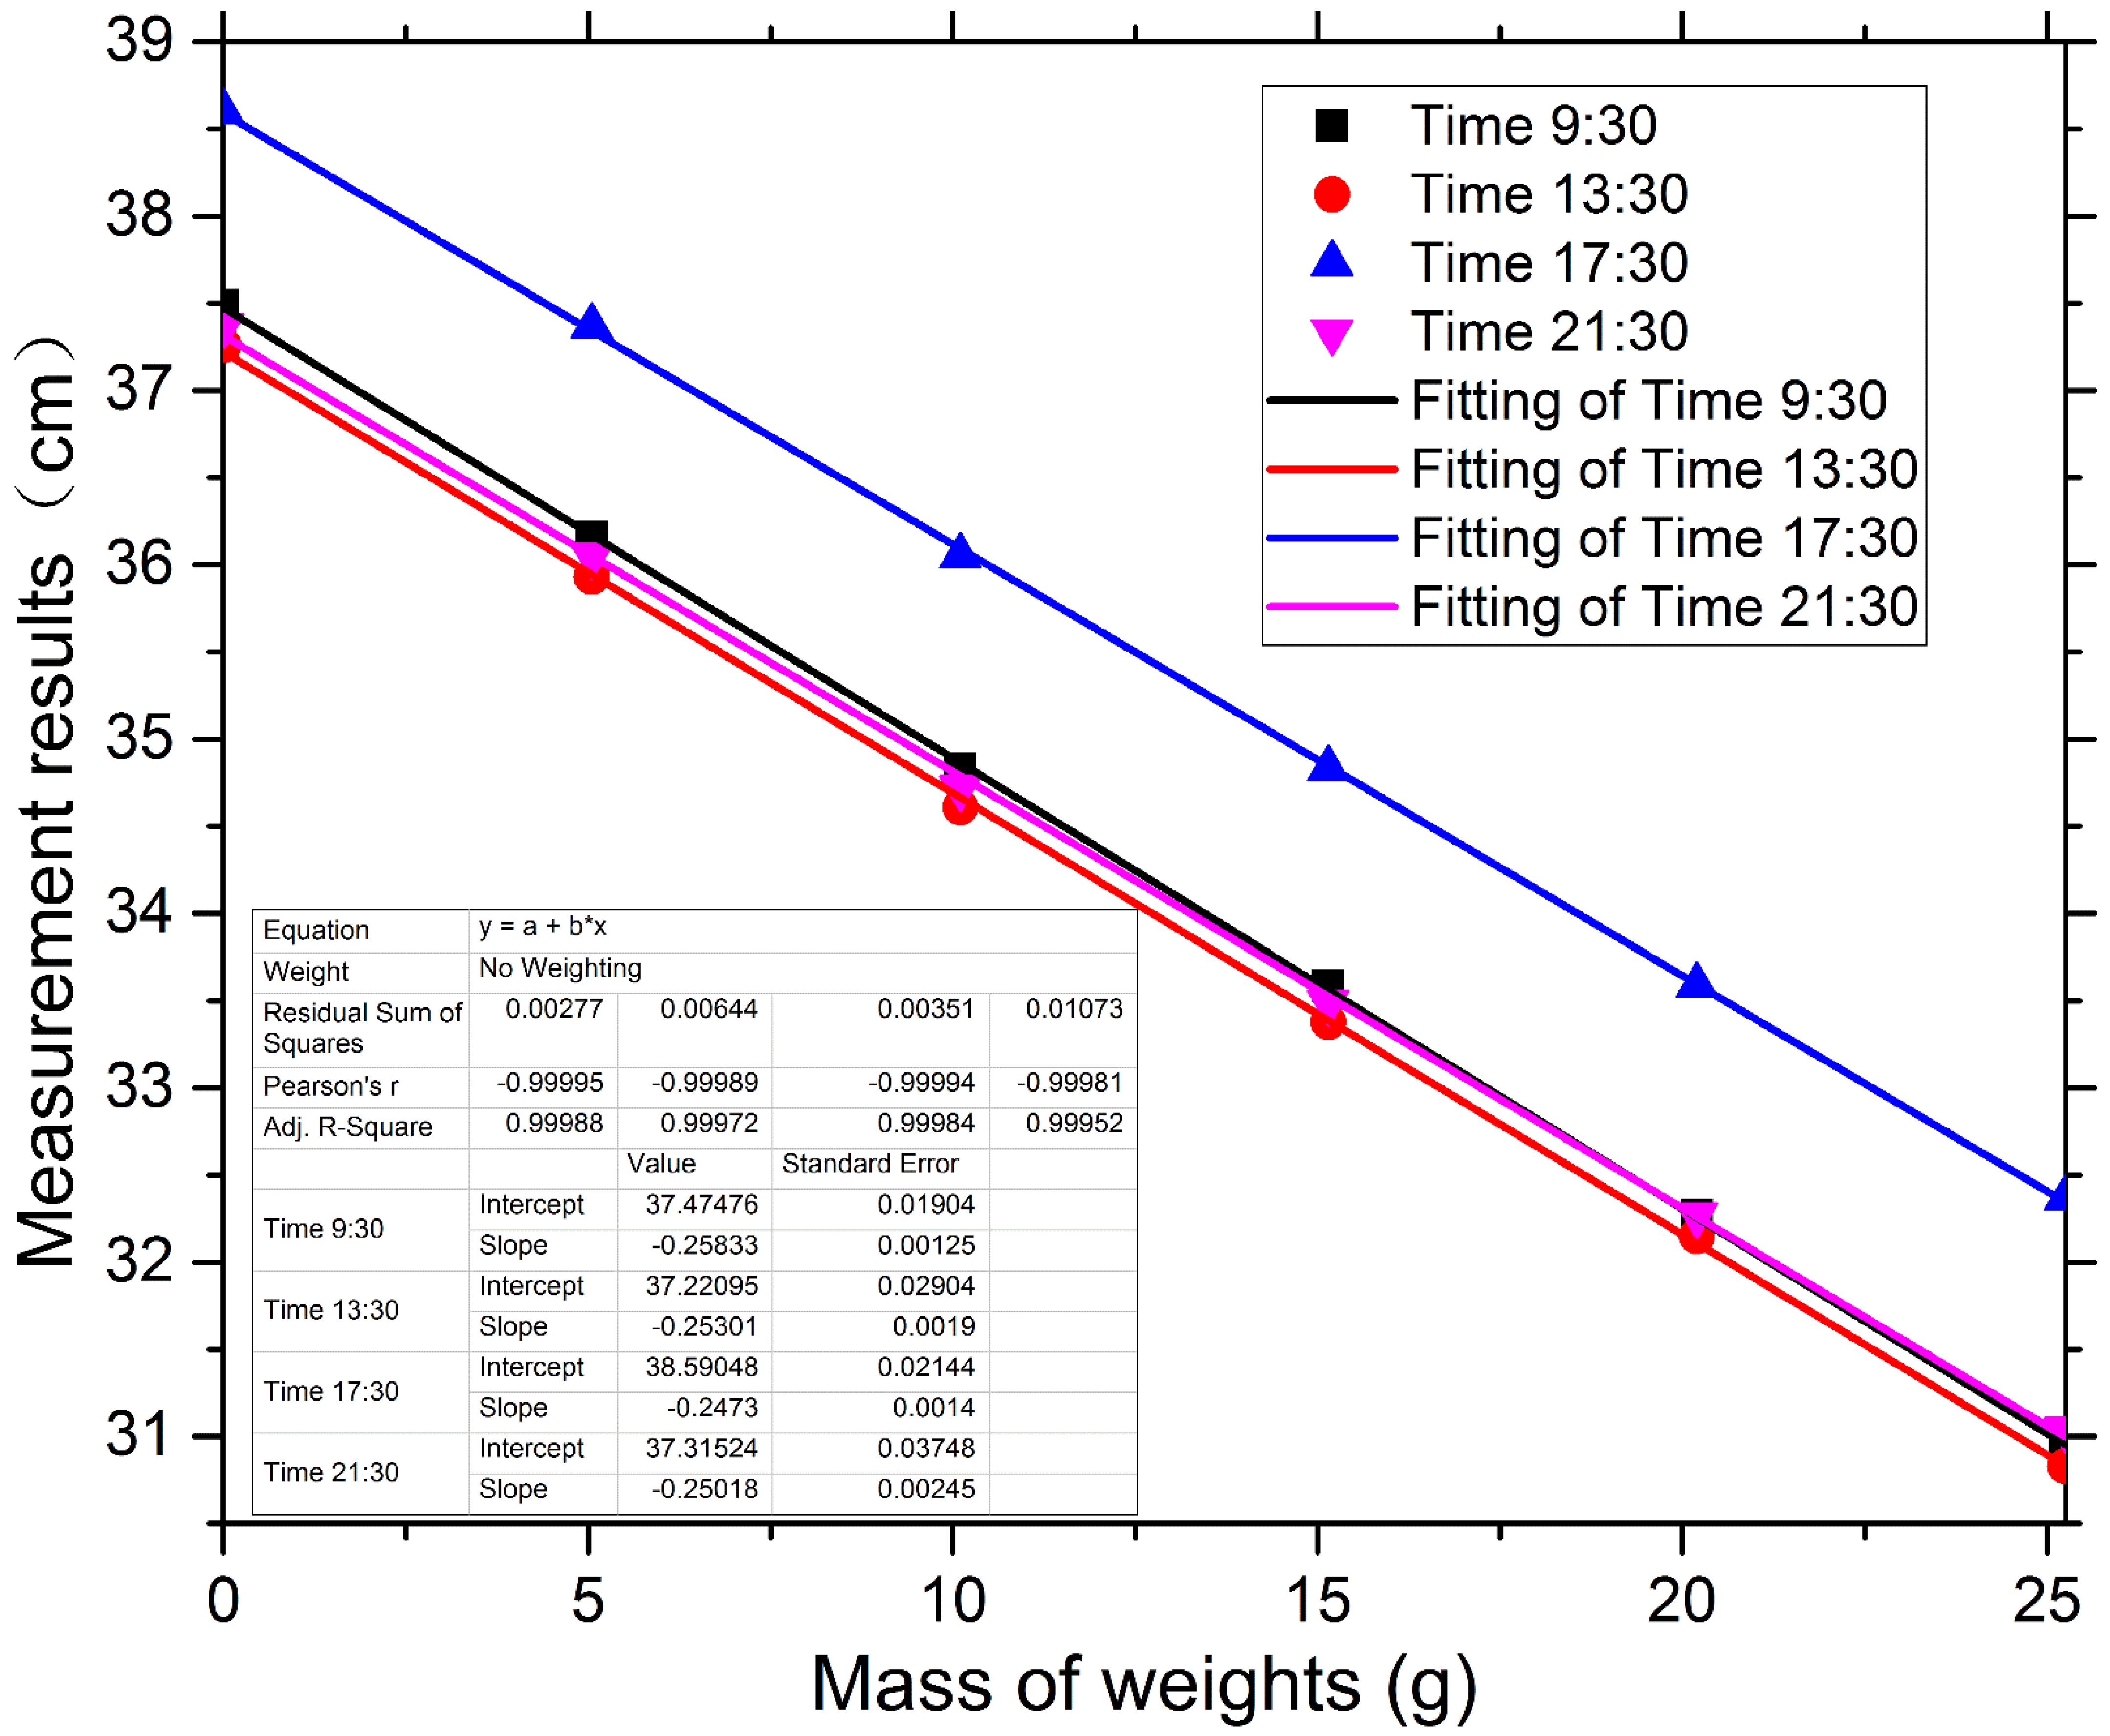
| On the same day | 9:30 | 17.2 | 74 | 37.51 | 36.16 | 34.83 | 33.55 | 32.27 | 30.94 | 3.794220 |
| 13:30 | 18.1 | 71 | 37.29 | 35.96 | 34.71 | 33.34 | 32.1 | 30.77 | 3.791127 | |
| 17:30 | 16.4 | 79 | 38.68 | 37.47 | 36.15 | 34.73 | 33.49 | 32.33 | 3.791928 | |
| 21:30 | 15.2 | 80 | 37.41 | 36.14 | 34.82 | 33.44 | 32.21 | 30.97 | 3.791342 | |
| True value k0 | / | / | / | / | / | / | 3.80 |
| Temperature (°C) | Humidity (%) | ki (N/m) | ReAD (%) | SE (N/m) | ||||
|---|---|---|---|---|---|---|---|---|
| 17.2 | 74 | 3.794220 | 3.79 | 0.04 | 0.07 | 1.6 | 0.26 | 0.03 |
| 18.1 | 71 | 3.791127 | 0.05 | 0.03 | ||||
| 16.4 | 79 | 3.791928 | 0.09 | 0.05 | ||||
| 15.2 | 80 | 3.791342 | 0.07 | 0.04 | ||||
| True value k0 | 3.80 | / | / | / | / | / | / | |
Publisher’s Note: MDPI stays neutral with regard to jurisdictional claims in published maps and institutional affiliations. |
© 2022 by the authors. Licensee MDPI, Basel, Switzerland. This article is an open access article distributed under the terms and conditions of the Creative Commons Attribution (CC BY) license (https://creativecommons.org/licenses/by/4.0/).
Share and Cite
Zhang, Z.; Zhang, X.; Ma, B.; Ding, M.; Zhu, B.; Tong, D. Measurement of Linear Springs’ Stiffness Factor Using Ultrasonic Sensing. Sensors 2022, 22, 5878. https://doi.org/10.3390/s22155878
Zhang Z, Zhang X, Ma B, Ding M, Zhu B, Tong D. Measurement of Linear Springs’ Stiffness Factor Using Ultrasonic Sensing. Sensors. 2022; 22(15):5878. https://doi.org/10.3390/s22155878
Chicago/Turabian StyleZhang, Zhongwei, Xiyan Zhang, Bohui Ma, Mengyao Ding, Bowen Zhu, and Dezheng Tong. 2022. "Measurement of Linear Springs’ Stiffness Factor Using Ultrasonic Sensing" Sensors 22, no. 15: 5878. https://doi.org/10.3390/s22155878
APA StyleZhang, Z., Zhang, X., Ma, B., Ding, M., Zhu, B., & Tong, D. (2022). Measurement of Linear Springs’ Stiffness Factor Using Ultrasonic Sensing. Sensors, 22(15), 5878. https://doi.org/10.3390/s22155878