
A Multiwall Path-Loss Prediction Model Using 433 MHz LoRa-WAN Frequency to Characterize Foliage’s Influence in a Malaysian Palm Oil Plantation Environment

 , ,
, ,  ,
,  ,
,
Abstract
1. Introduction
- A multiwall path-loss model for palm oil plantation foliage is proposed.
- Path-loss prediction is modeled for LoRa LPWAN 433 MHz frequency channels.
- The proposed and predicted path-loss models are compared with existing empirical models.
2. Related Work
3. Materials and Methods
3.1. Related Empirical Models
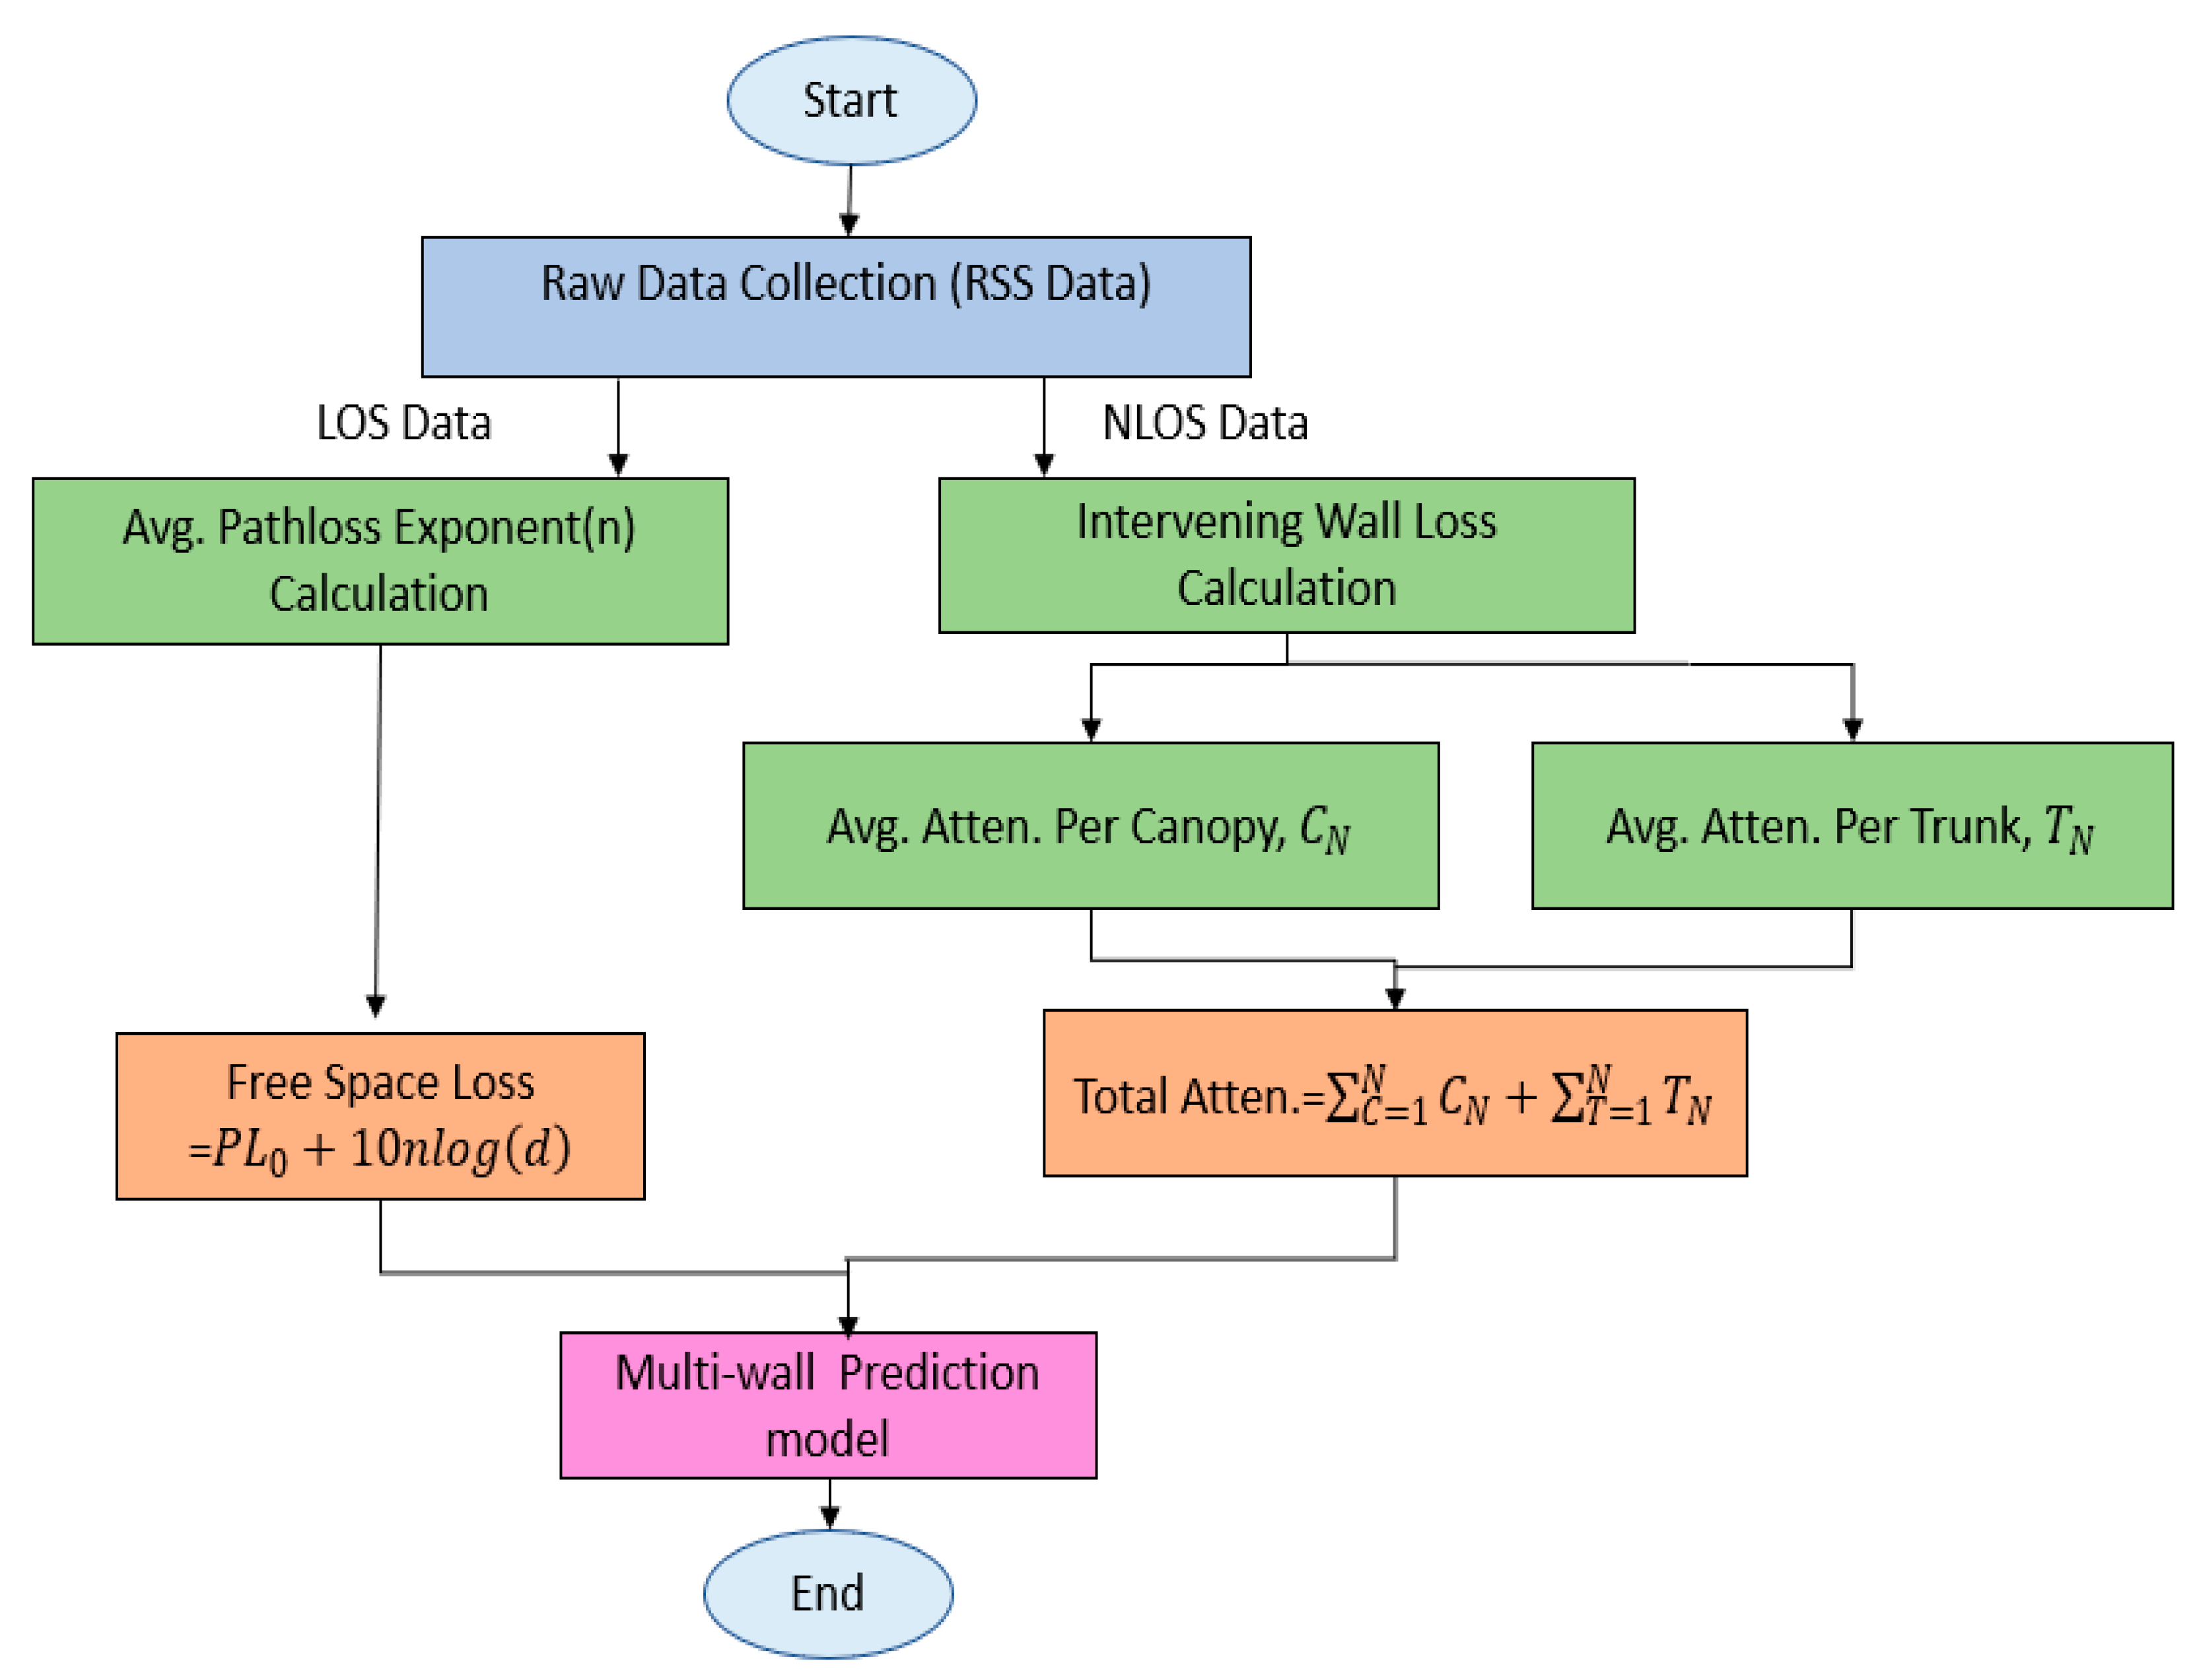
3.2. The Multiwall Path-Loss Model for Palm Oil Plantations
- = Attenuation caused by N number of canopies.
- = Attenuation caused by N number of trunks.
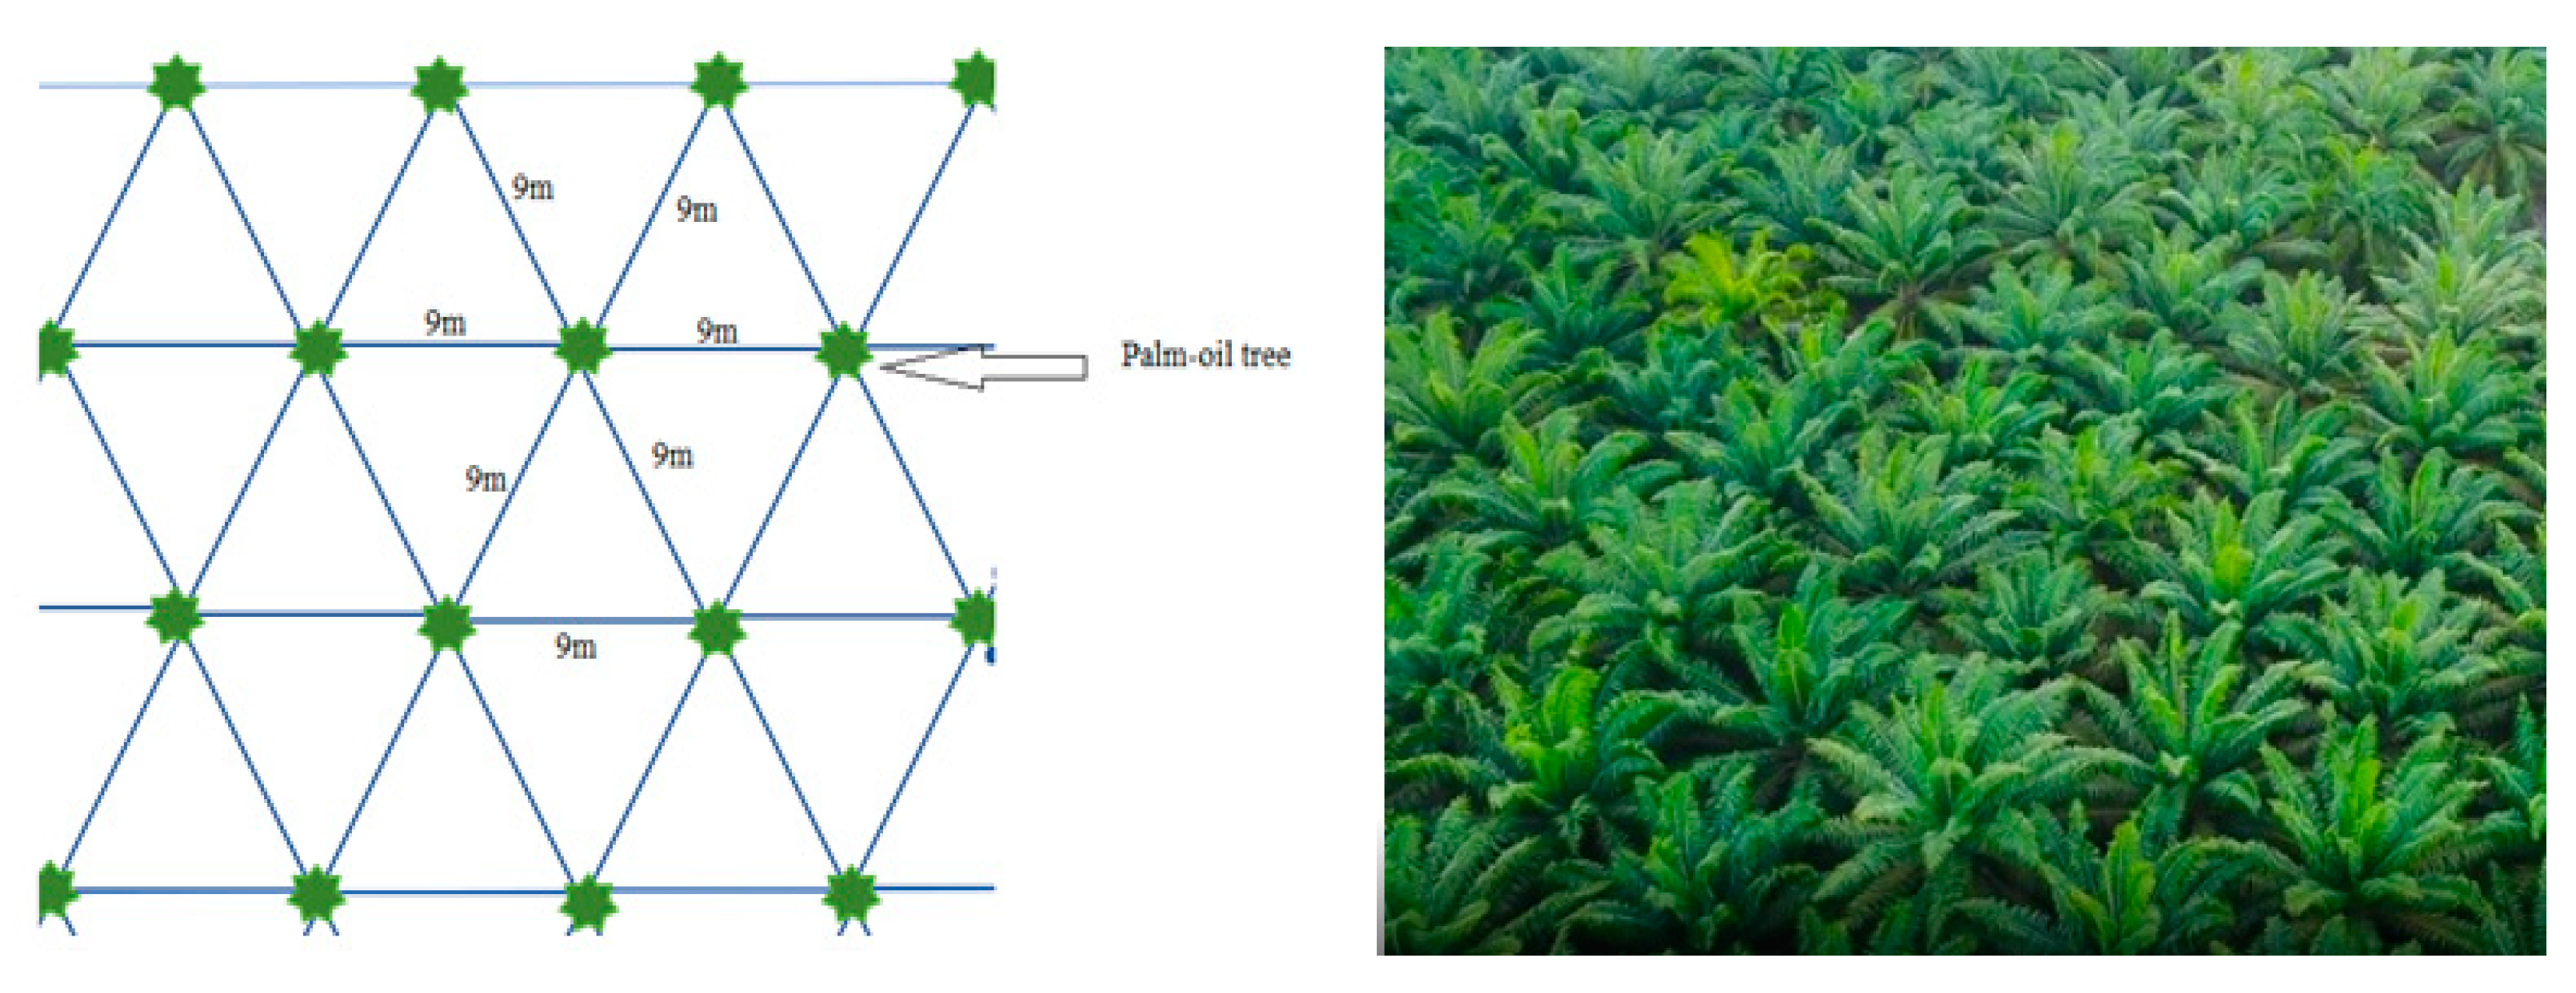
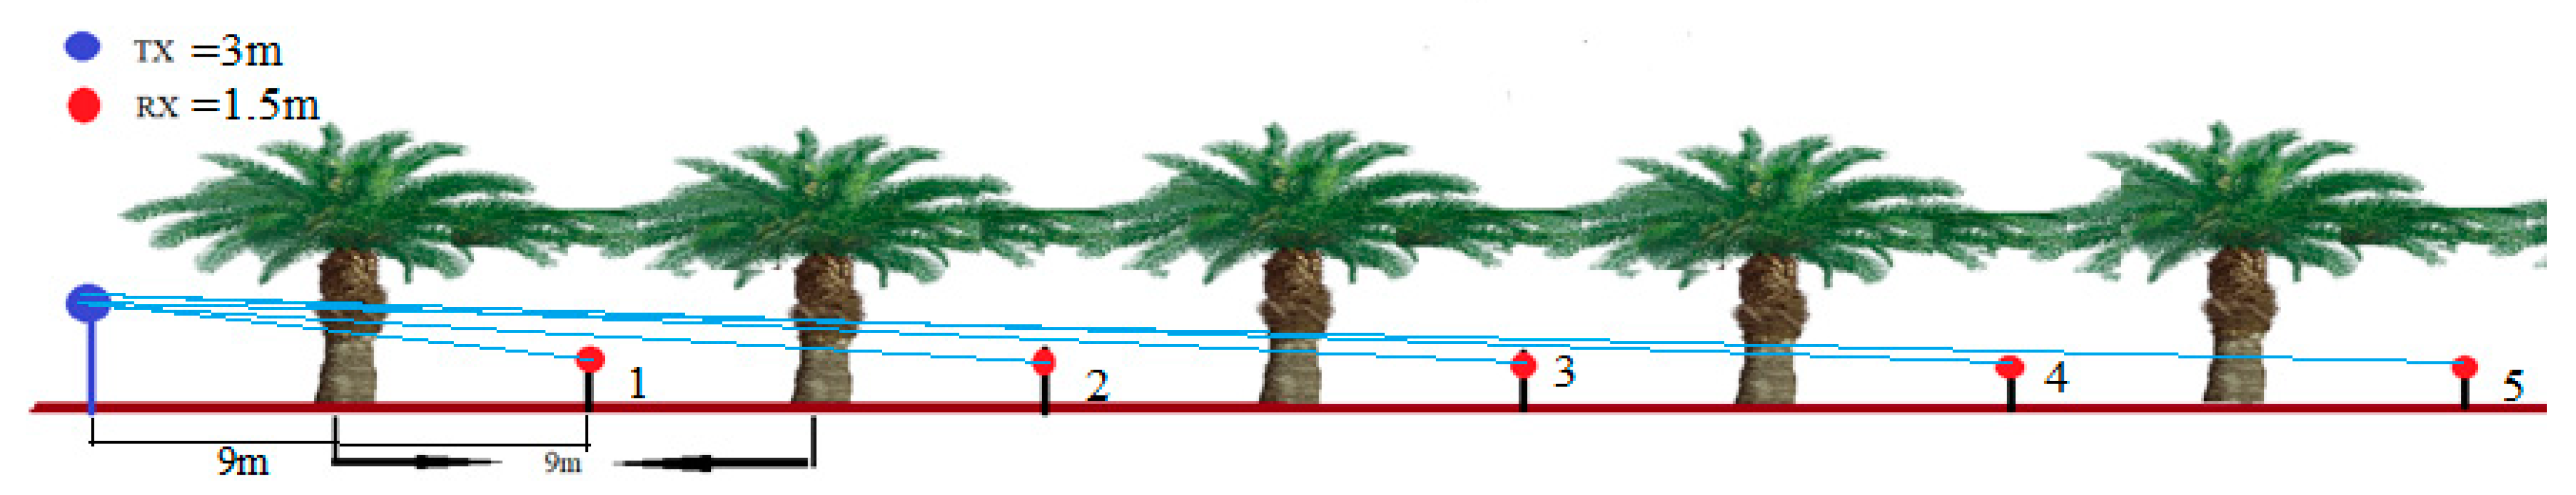
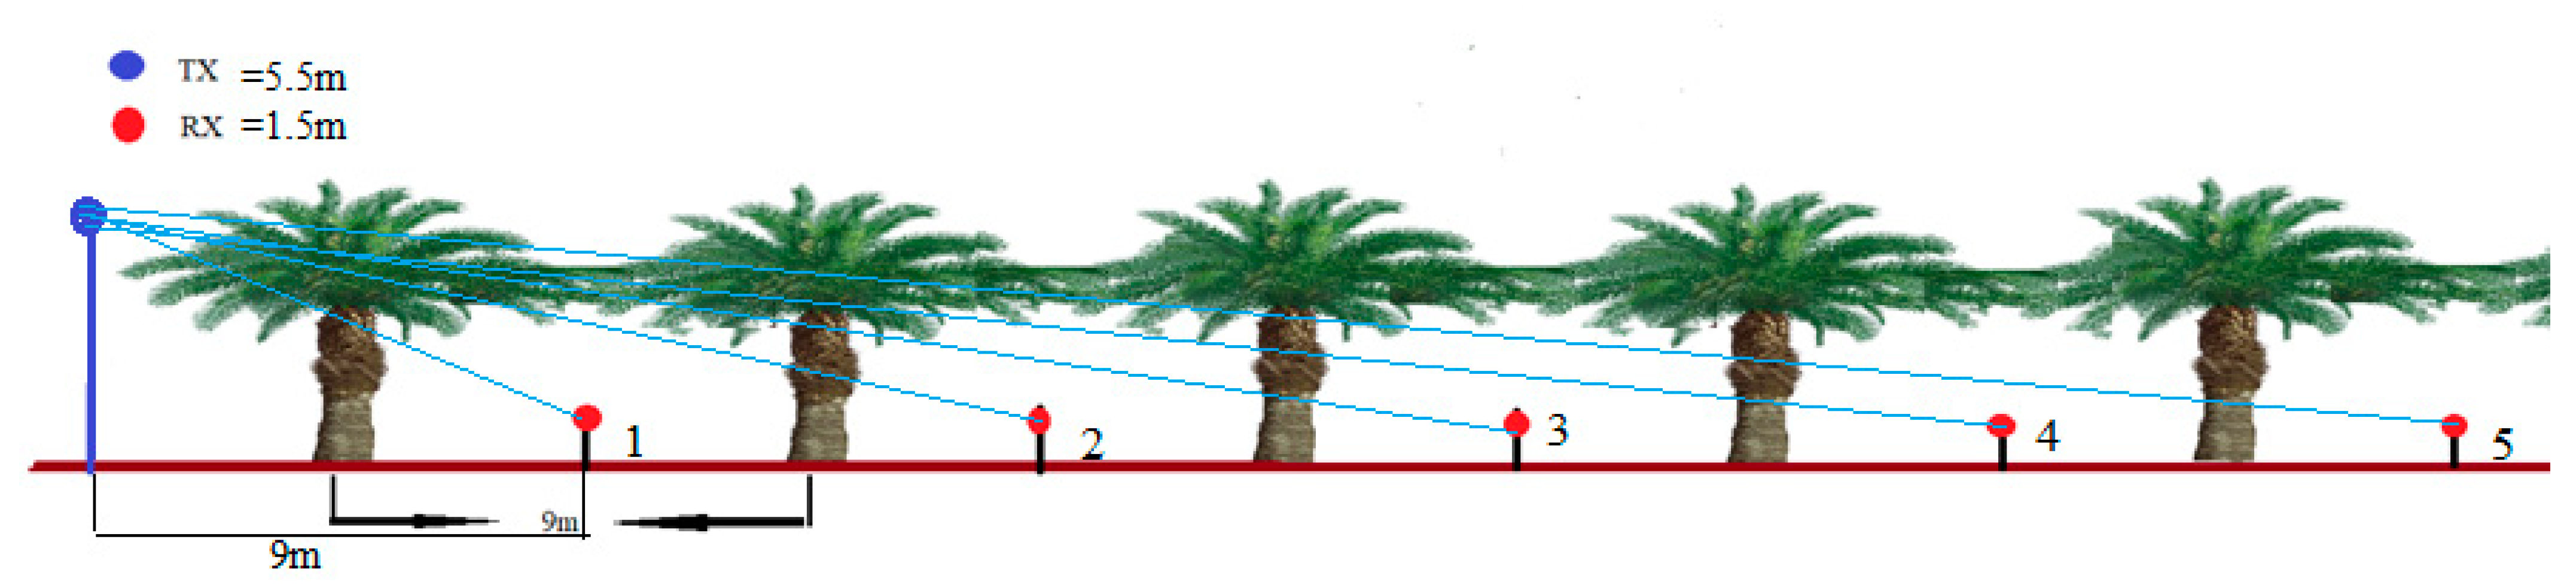
3.3. Measurement Environment
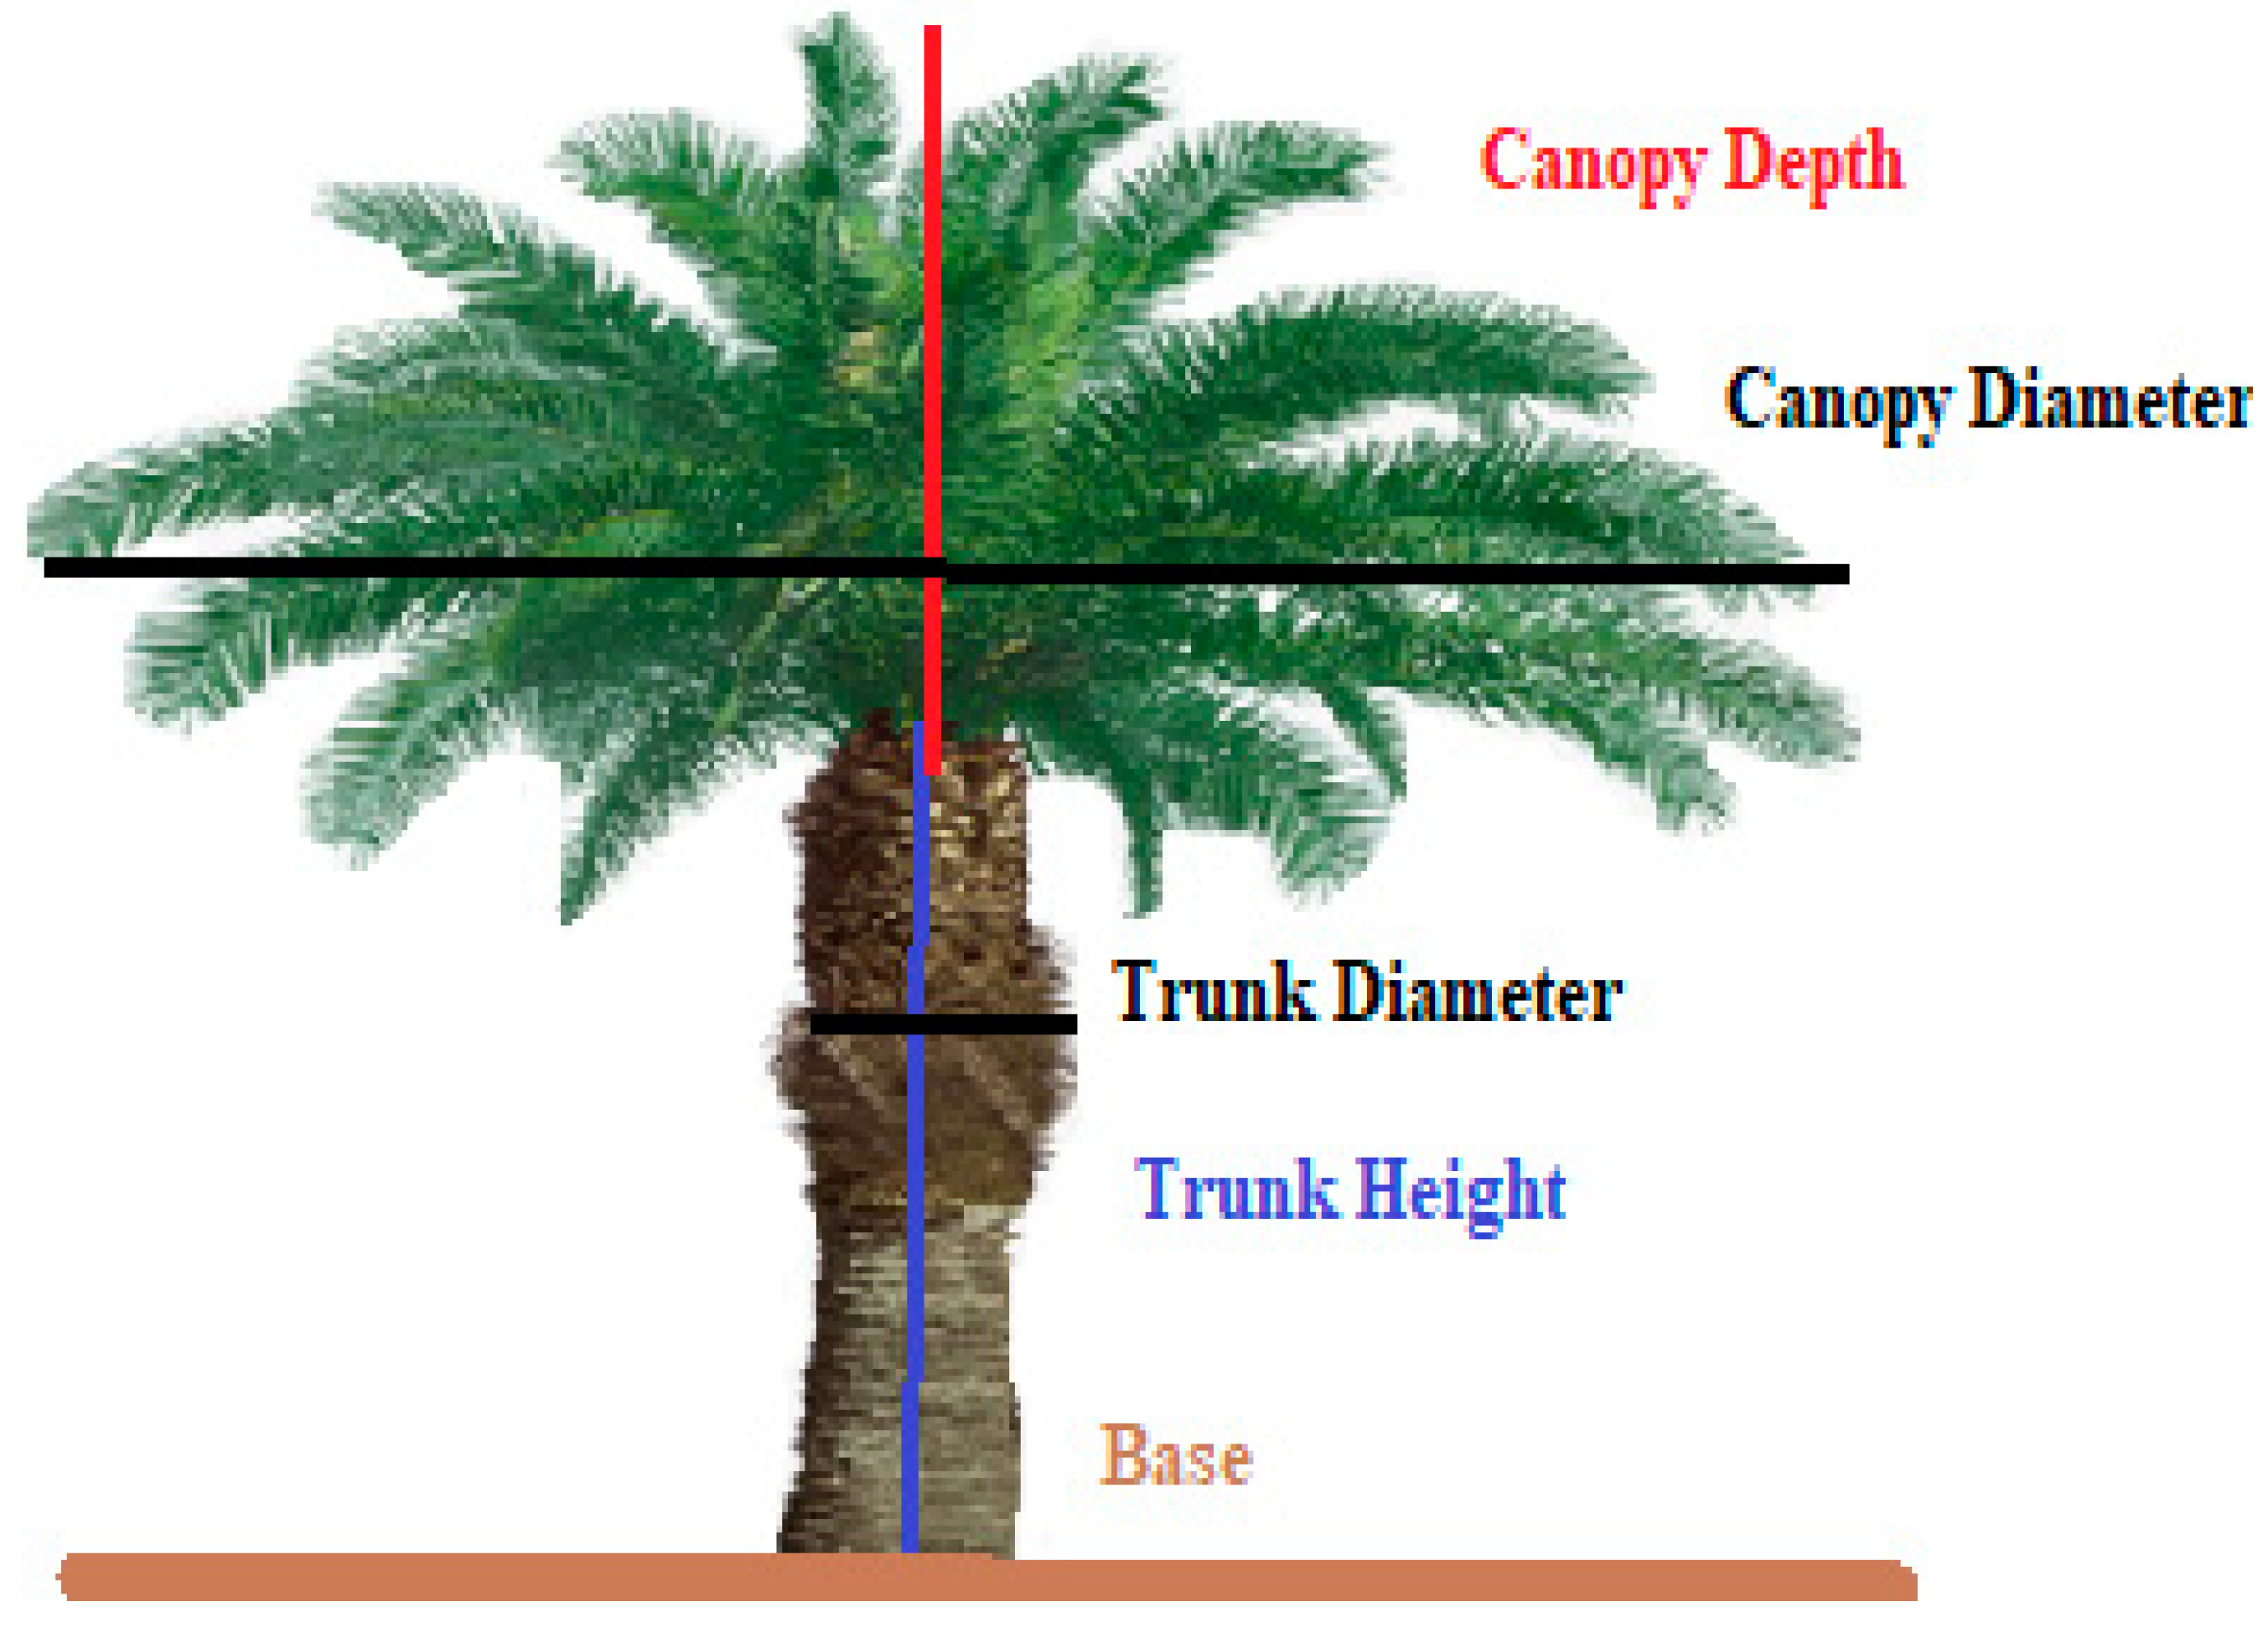
3.4. Oil Palm Tree Specifications
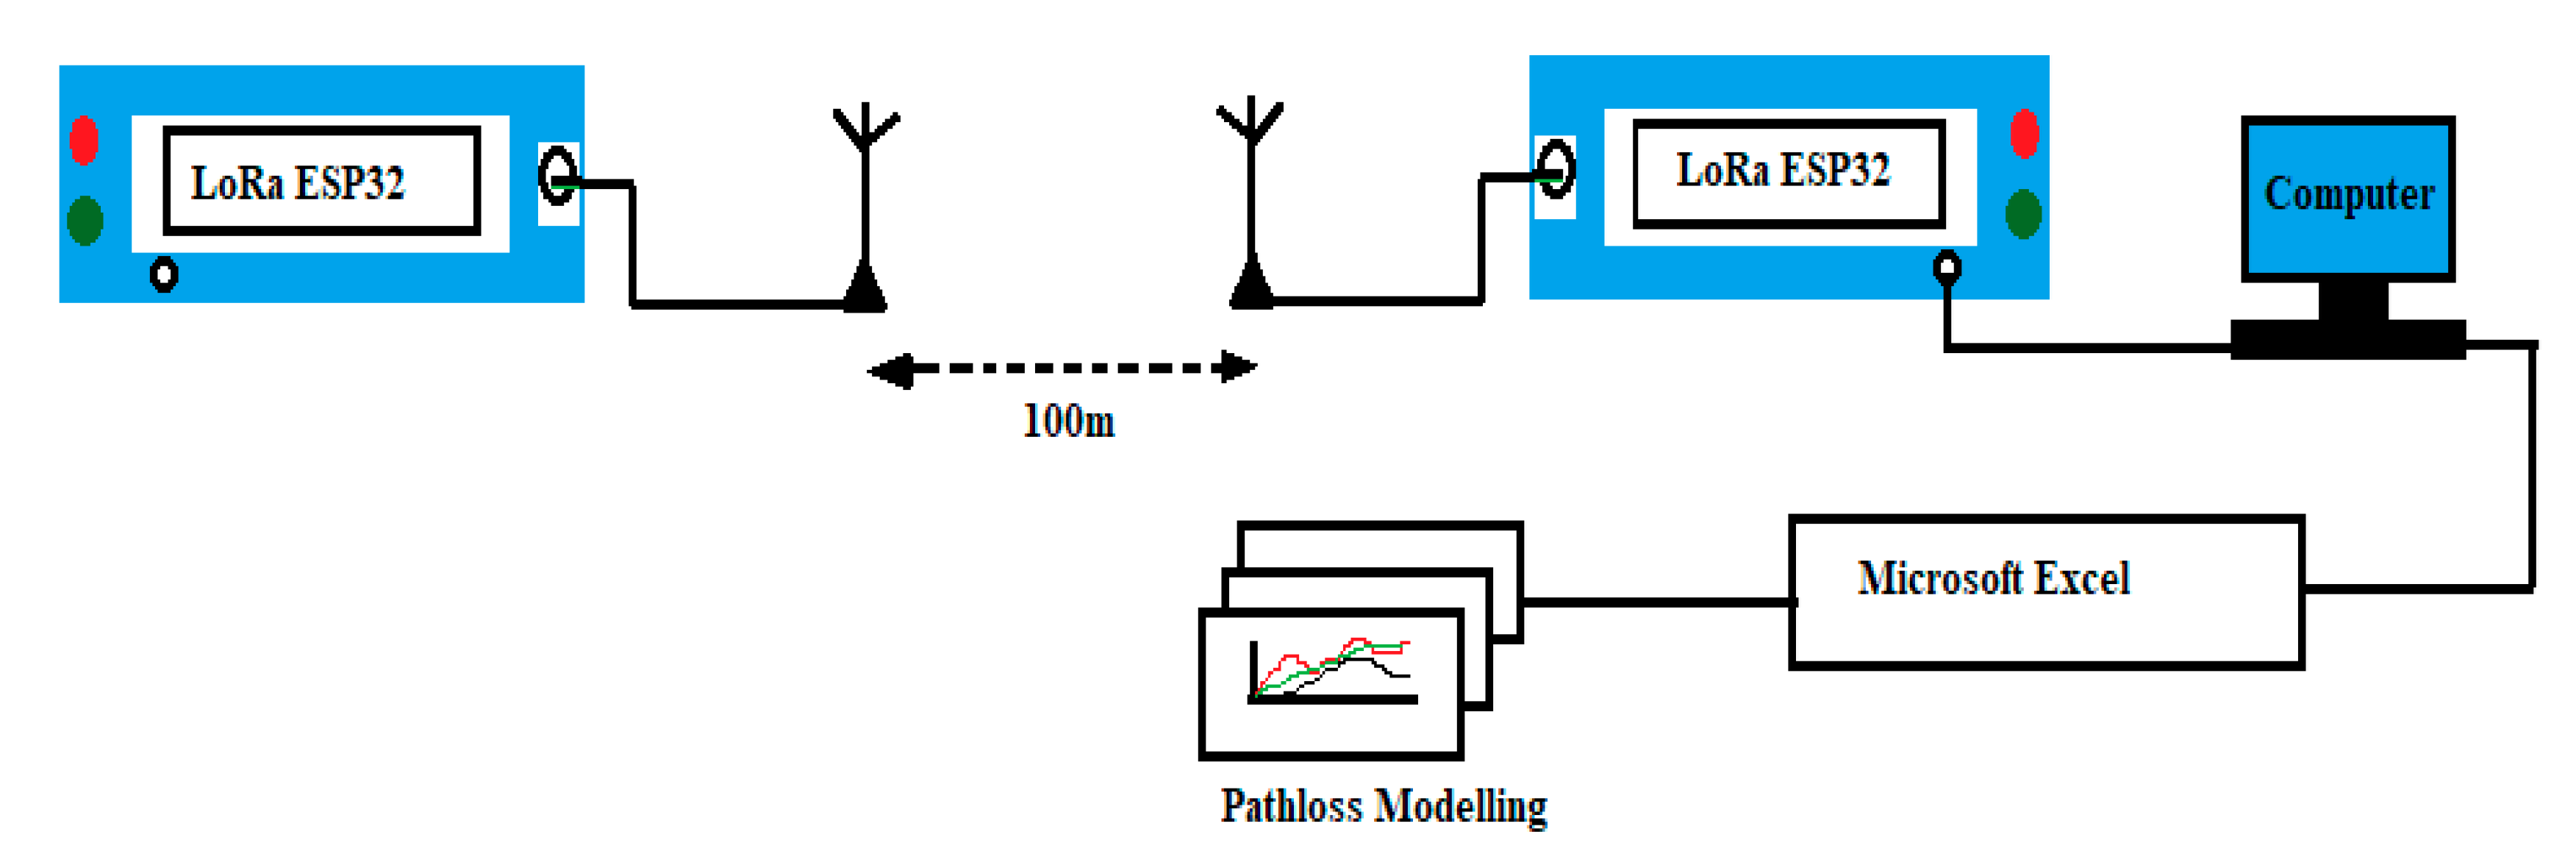
3.5. Measurement Equipment
3.6. Data Gathering Method
- Scenario 1: Propagation through the trunk.
- Scenario 2: Propagation through the canopy.
4. Results and Discussion
4.1. Data Analysis and Prediction Model
4.1.1. LoS Link Data Analysis
4.1.2. NLoS Link Data Analysis
4.1.3. Validation of the Prediction Model
4.2. PL Measurement Analysis
- Obstacle loss due to the oil palm trees in the plantation region degraded the LoRa signal quality. As demonstrated by Petäjäjärvi et al., increasing the bandwidth decreases the communication range and sensitivity [42]. This was also witnessed in the palm oil plantation propagation medium.
- Obstacle loss in the palm oil plantation was caused by two main parts of the oil palm tree (i.e., trunk and canopy). Due to the symmetric pattern of the palm oil plantation and similarity in the tree structure, the path loss did not fluctuate drastically. Therefore, the path-loss prediction is generally easier in palm oil plantation scenario.
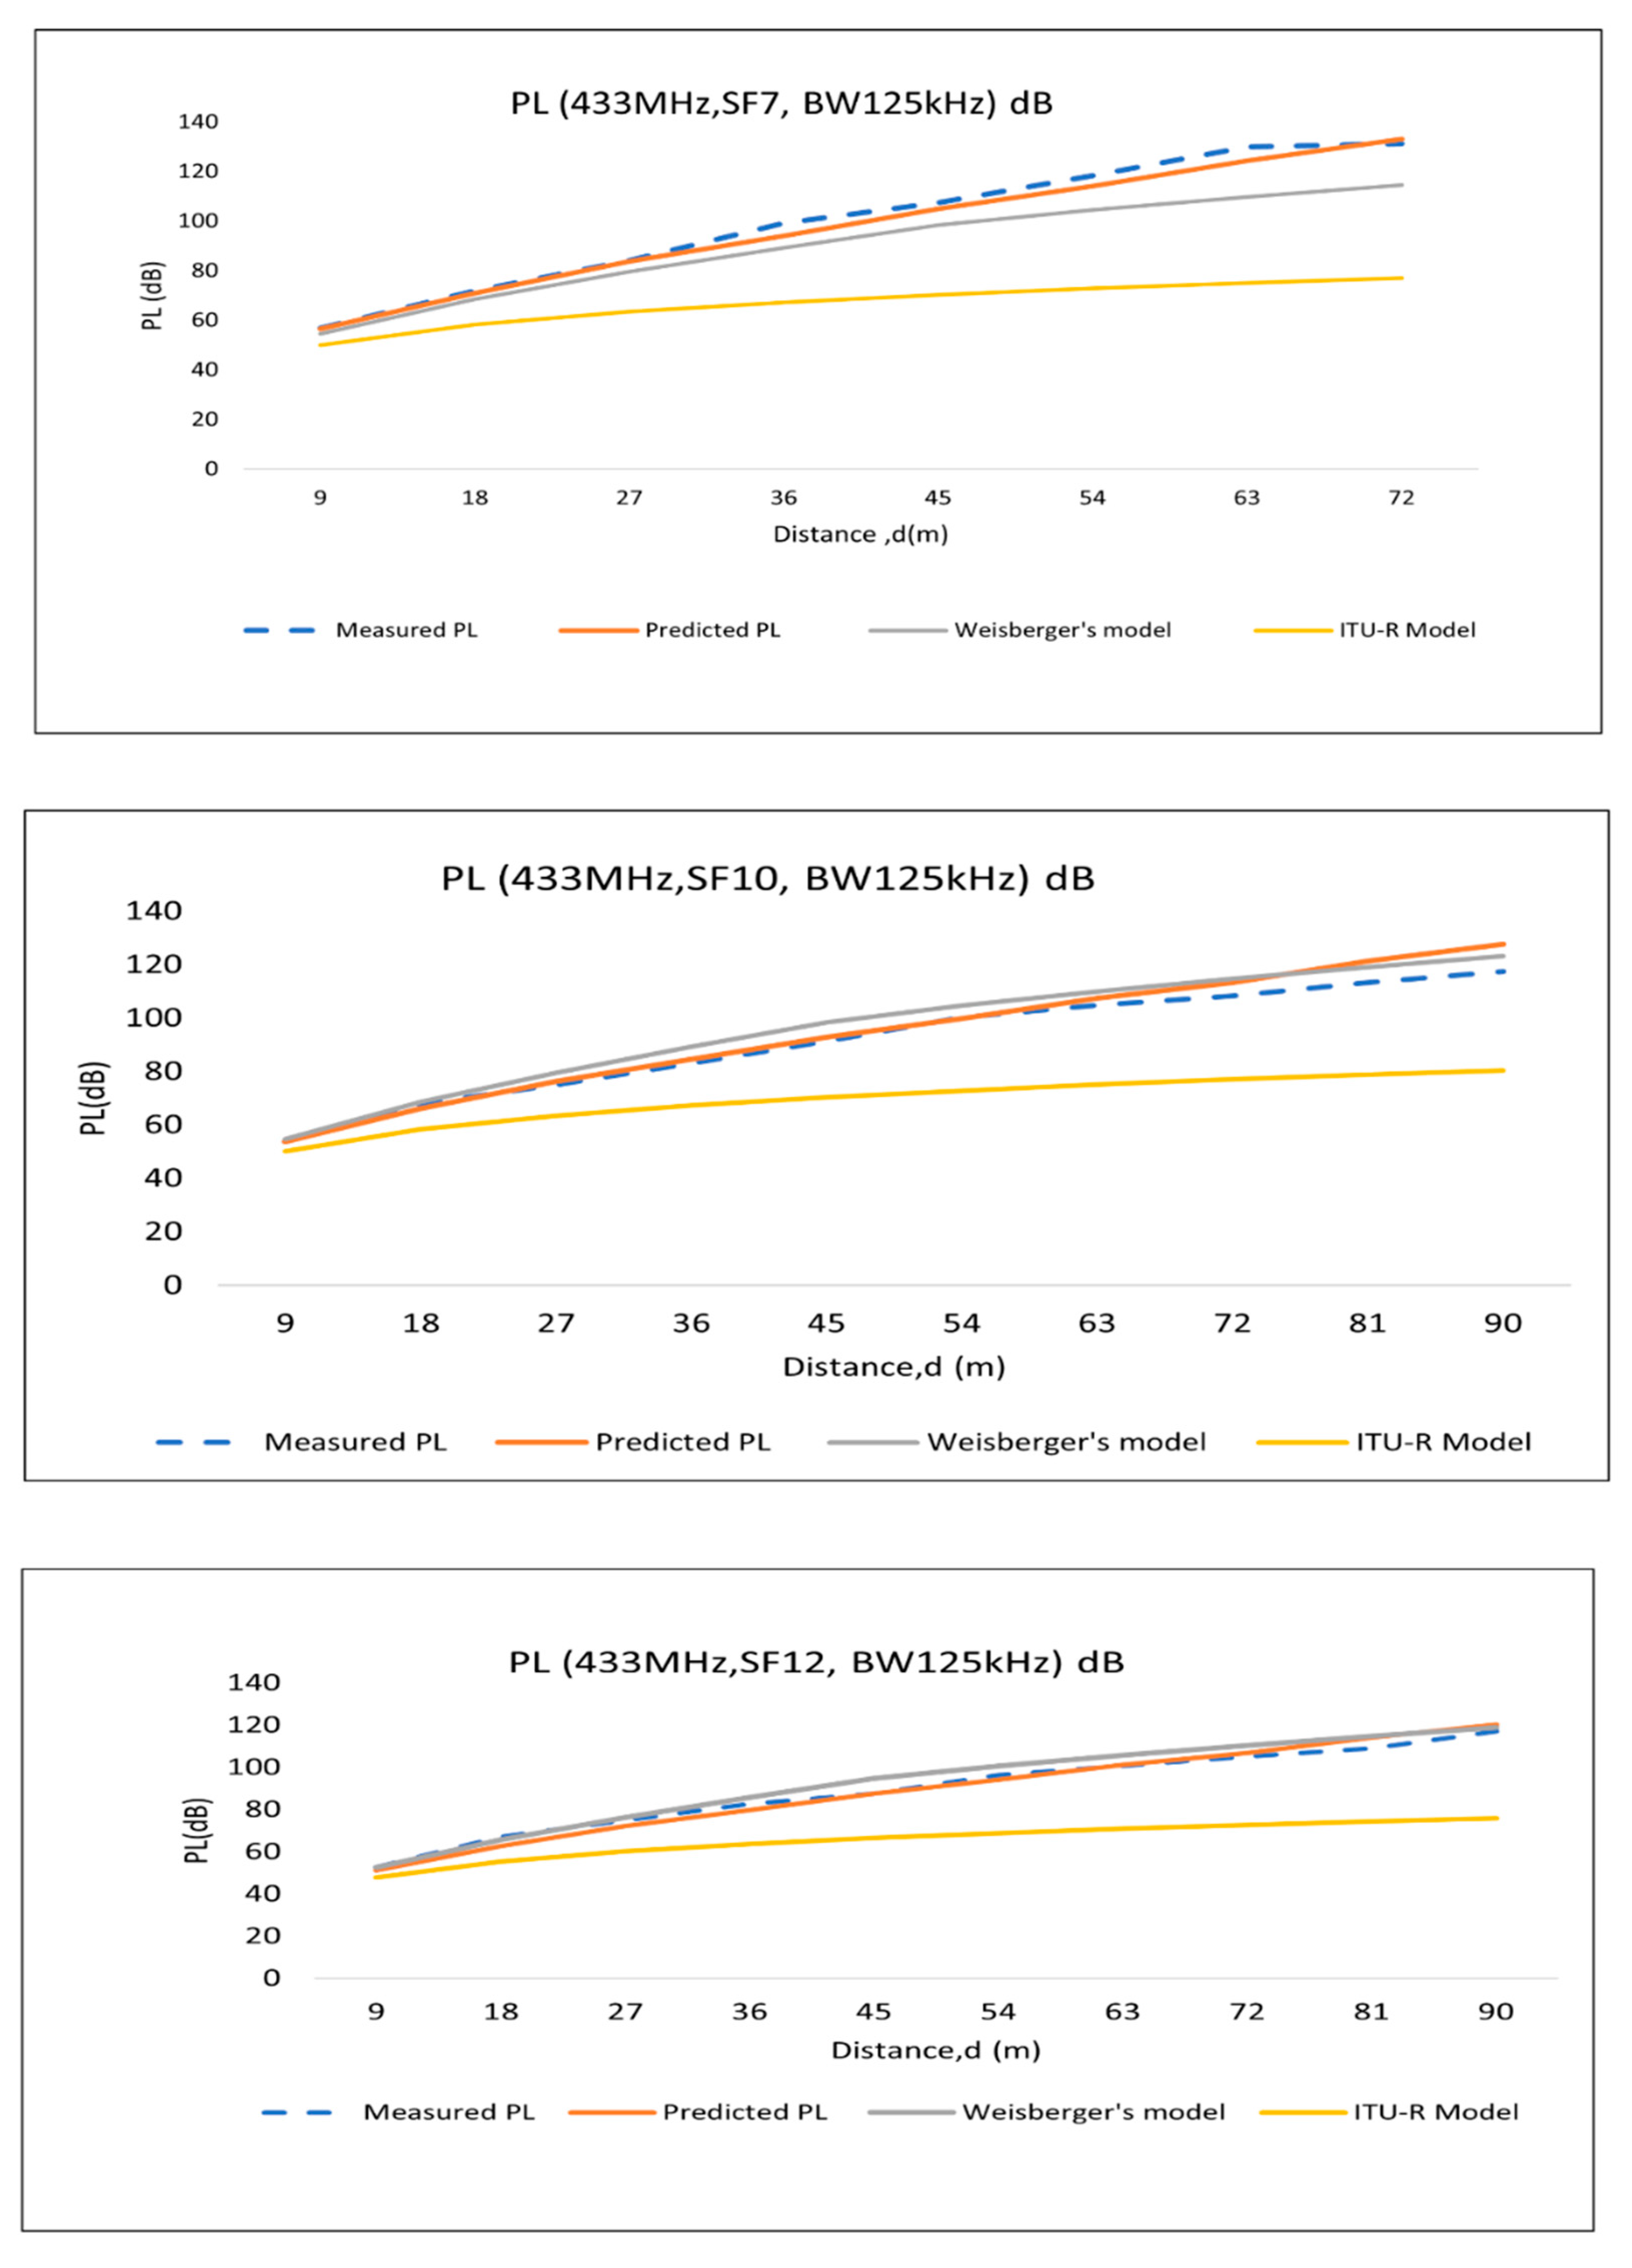
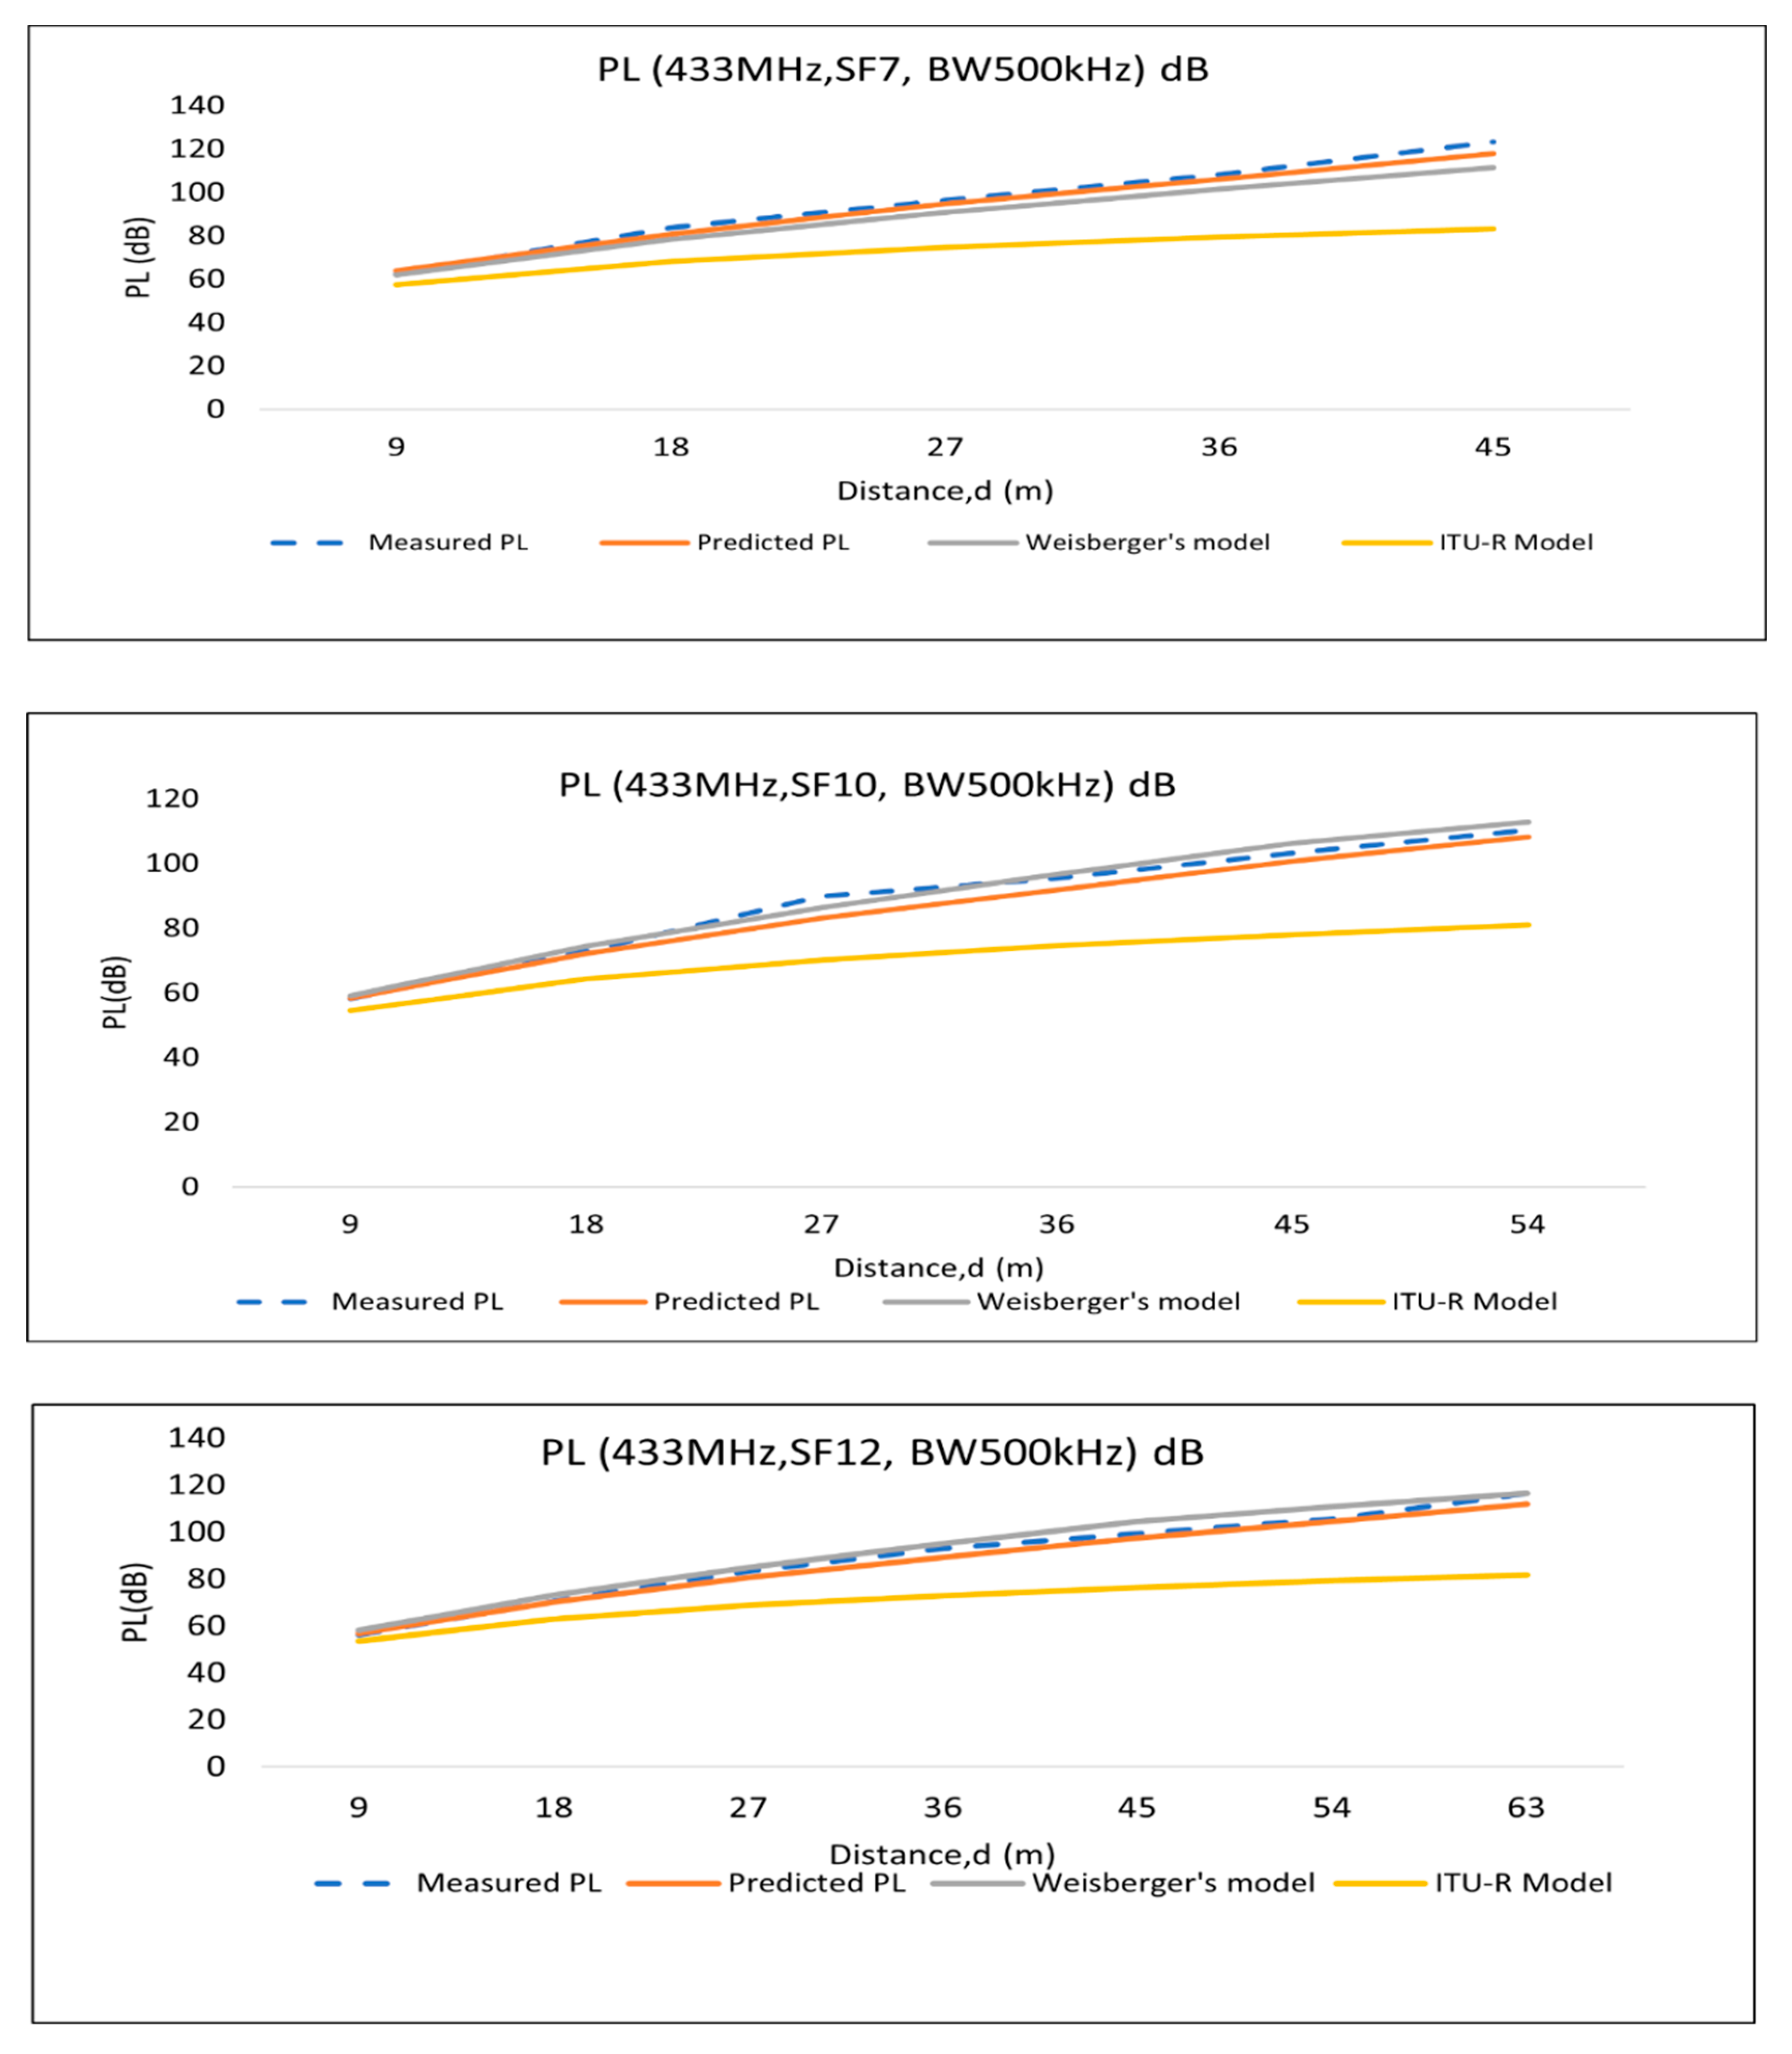
4.3. Comparison with Empirical Path-Loss Models
5. Conclusions and Future Work
Author Contributions
Funding
Institutional Review Board Statement
Informed Consent Statement
Data Availability Statement
Acknowledgments
Conflicts of Interest
References
- Miles, B.; Bourennane, E.-B.; Boucherkha, S.; Chikhi, S. A study of LoRaWAN protocol performance for IoT applications in smart agriculture. Comput. Commun. 2020, 164, 148–157. [Google Scholar] [CrossRef]
- Citoni, B.; Fioranelli, F.; Imran, M.A.; Abbasi, Q.H. Internet of Things and LoRaWAN-Enabled Future Smart Farming. IEEE Internet Things Mag. 2019, 2, 14–19. [Google Scholar] [CrossRef]
- Anzum, R.; Habaebi, M.H.; Islam, R.; Hakim, G.P.N. Modeling and Quantifying Palm Trees Foliage Loss using LoRa Radio Links for Smart Agriculture Applications. In Proceedings of the 2021 IEEE 7th International Conference on Smart Instrumentation, Measurement and Applications (ICSIMA), Bandung, Indonesia, 23–25 August 2021; pp. 105–110. [Google Scholar] [CrossRef]
- Wahab, A.; Mustika, F.A.; Bahaweres, R.B.; Setiawan, D.; Alaydrus, M. Energy Efficiency and Loss of Transmission Data on Wireless Sensor Network with Obstacle. In Proceedings of the 2016 10th International Conference on Telecommunication Systems Services and Applications (TSSA), Denpasar, Indonesia, 6–7 October 2016; pp. 1–6. [Google Scholar] [CrossRef]
- Cama-Pinto, D.; Damas, M.; Holgado-Terriza, J.A.; Arrabal-Campos, F.M.; Gómez-Mula, F.; Martínez-Lao, J.A.M.; Cama-Pinto, A. Empirical Model of Radio Wave Propagation in the Presence of Vegetation inside Greenhouses Using Regularized Regressions. Sensors 2020, 20, 6621. [Google Scholar] [CrossRef] [PubMed]
- Meng, Y.S.; Lee, Y.H. Investigations of foliage effect on modern wireless communication systems: A review. Prog. Electromagn. Res. 2010, 105, 313–332. [Google Scholar] [CrossRef]
- Bria, R.; Wahab, A.; Alaydrus, M. Energy Efficiency Analysis of TEEN Routing Protocol with Isolated Nodes. In Proceedings of the 2019 Fourth International Conference on Informatics and Computing (ICIC), Semarang, Indonesia, 16–17 October 2019; pp. 1–5. [Google Scholar] [CrossRef]
- Ashraf, S.; Raza, A.; Aslam, Z.; Naeem, H.; Ahmed, T. Underwater Resurrection Routing Synergy Using Astucious Energy Pods. J. Robot. Control (JRC) 2020, 1, 173–184. [Google Scholar] [CrossRef]
- Li, Z.; Xu, M.; Liu, T.; Yu, L. A Network Coding-Based Braided Multipath Routing Protocol for Wireless Sensor Networks. Wirel. Commun. Mob. Comput. 2019, 2019, 7601. [Google Scholar] [CrossRef]
- Arsad, A.; Rahman, T.A.; Rahim, S.K.A. Measurement and Modeling of RFID Propagation Channel in Palm Oil Trees. J. Teknol. 2012, 58, 1–6. [Google Scholar] [CrossRef]
- Richardson Ansah, M.; Sowah, R.A.; Melià-Seguí, J.; Katsriku, F.A.; Vilajosana, X.; Owusu Banahene, W. Characterising foliage influence on LoRaWAN pathloss in a tropical vegetative environment. IET Wirel. Sens. Syst. 2020, 10, 198–207. [Google Scholar] [CrossRef]
- Silva, J.C.; Siqueira, G.L.; Castellanos, P.V.G. Propagation Model for Path Loss Through Vegetated Environments at 700–800 MHz Band. J. Microw. Optoelectron. Electromagn. Appl. 2018, 17, 179–187. [Google Scholar] [CrossRef]
- Johnson, E.H.; Ibanga, E.B.; Ezuruike Okafor, S.F. Comparative evaluation of single constant tuning method and function of residue tuning method for the Early ITU foliage propagation loss model. J. Multidiscip. Eng. Sci. Technol. 2018, 5, 12. [Google Scholar]
- Phaiboon, S.; Phokharatkul, P. An Empirical Path Loss Model for Wireless Sensor Network Placement in Banana Plantation. In Proceedings of the 2021 Photonics & Electromagnetics Research Symposium (PIERS), Hangzhou, China, 21–25 November 2021; pp. 354–357. [Google Scholar] [CrossRef]
- Cama-Pinto, D.; Damas, M.; Holgado-Terriza, J.A.; Gómez-Mula, F.; Cama-Pinto, A. Path Loss Determination Using Linear and Cubic Regression Inside a Classic Tomato Greenhouse. Int. J. Environ. Res. Public Health 2019, 16, 1744. [Google Scholar] [CrossRef]
- Zhang, Y.; Anderson, C.R.; Michelusi, N.; Love, D.J.; Baker, K.R.; Krogmeier, J.V. Propagation Modeling Through Foliage in a Coniferous Forest at 28 GHz. IEEE Wirel. Commun. Lett. 2019, 8, 901–904. [Google Scholar] [CrossRef]
- Raheemah, A.; Sabri, N.; Salim, M.; Ehkan, P.; Ahmad, R.B. New empirical path loss model for wireless sensor networks in mango greenhouses. Comput. Electron. Agric. 2016, 127, 553–560. [Google Scholar] [CrossRef]
- Arshad, K.; Katsriku, F.; Lasebae, A. Radiowave VHF Propagation Modelling in Forest Using Finite Elements. In Proceedings of the 2006 2nd International Conference on Information & Communication Technologies, Damascus, Syria, 24–28 April 2006. [Google Scholar] [CrossRef]
- Seville, A.; Craig, K. Semi-empirical model for millimetre-wave vegetation attenuation rates. Electron. Lett. 1995, 31, 1507–1508. [Google Scholar] [CrossRef]
- Al-Nuaimi, M.O.; Stephens, R.B.L. Measurements and Prediction Model Optimisation for Signal Attenuation in Vegetation Media at Centimetre Wave Frequencies. Antennas Propag. IEEE Proc.-Microw. 1998, 145, 201–206. [Google Scholar] [CrossRef]
- Erceg, V.; Greenstein, L.J.; Tjandra, S.Y.; Parkoff, S.R.; Gupta, A.; Kulic, B.; Julius, A.A.; Bianchi, R. An empirically based path loss model for wireless channels in suburban environments. IEEE J. Sel. Areas Commun. 1999, 17, 1205–1211. [Google Scholar] [CrossRef]
- Erceg, V.; Michelson, D.G.; Ghassemzadeh, S.S.; Greenstein, L.J.; Rustako, A.J.; Guerlain, P.B.; Dennison, M.K.; Roman, R.S.; Barnickel, D.J.; Wang, S.C.; et al. A Model for the Multipath Delay Profile of Fixed Wireless Channels. IEEE J. Sel. Areas Commun. 1999, 17, 399–410. [Google Scholar] [CrossRef]
- Lott, M.; Forkel, I. A Multi-Wall-and-Floor Model for Indoor Radio Propagation. In Proceedings of the IEEE VTS 53rd Vehicular Technology Conference, Rhodes, Greece, 6–9 May 2002. [Google Scholar] [CrossRef]
- Chrysikos, T.; Georgopoulos, G.; Kotsopoulos, S. Wireless Channel Characterization for a Home Indoor Propagation Topology at 2.4 GHz. In Proceedings of the 2011 Wireless Telecommunications Symposium (WTS), New York, NY, USA, 13–15 April 2011; pp. 1–10. [Google Scholar] [CrossRef]
- Li, L.; Ibdah, Y.; Ding, Y.; Eghbali, H.; Muhaidat, S.H.; Ma, X. Indoor Multi-wall Path Loss Model at 1.93 GHz. In Proceedings of the MILCOM 2013 - 2013 IEEE Military Communications Conference, San Diego, CA, USA, 18–20 November 2013; pp. 1233–1237. [Google Scholar] [CrossRef]
- Aung, S.M.Y.; Pattanaik, K.K. Path Loss Measurement for Wireless Communication in Industrial Environments. In Proceedings of the 2020 International Conference on Computer Science, Engineering and Applications (ICCSEA), Gunupur, India, 13–14 March 2020; pp. 1–5. [Google Scholar] [CrossRef]
- Chrysikos, T.; Georgopoulos, G.; Kotsopoulos, S. Empirical Calculation of Shadowing Deviation for Complex Indoor Propagation Topologies at 2.4 GHz. In Proceedings of the 2009 International Conference on Ultra-Modern Telecommunications & Workshops, St. Petersburg, Russia, 12–14 October 2009; pp. 1–6. [Google Scholar] [CrossRef]
- Ben Zineb, A.; Ayadi, M. A Multi-wall and Multi-frequency Indoor Path Loss Prediction Model Using Artificial Neural Networks. Arab. J. Sci. Eng. 2015, 41, 987–996. [Google Scholar] [CrossRef]
- Zyoud, A.; Chebil, J.; Habaebi, M.; Islam, R.; Lwas, A.K. Investigation of Three-Dimensional Empirical Indoor Path Loss Models for Femtocell Networks. IOP Conf. Series: Mater. Sci. Eng. 2013, 53, 012021. [Google Scholar] [CrossRef]
- Kang, T.; Seo, J. Practical Simplified Indoor Multiwall Path-Loss Model. In Proceedings of the 2020 20th International Conference on Control, Automation and Systems (ICCAS), Busan, Korea, 13–16 October 2020. [Google Scholar] [CrossRef]
- Kacou, M.; Guillet, V.; El Zein, G.; Zaharia, G. A Multi-Wall and Multi-Frequency Home Environment Path Loss Characterization and Modeling. In Proceedings of the 12th European Conference on Antennas and Propagation (EuCAP 2018), London, UK, 9–13 April 2018. [Google Scholar] [CrossRef]
- Aung, S.M.Y.; Maw, M.M. Analysis of Path Loss through the Partitions in Indoor Propagation. Int. J. Adv. Res. Comput. Commun. Eng. 2017, 6, 7. [Google Scholar]
- Plets, D.; Joseph, W.; Vanhecke, K.; Tanghe, E.; Martens, L. Simple Indoor Path Loss Prediction Algorithm and Validation in Living Lab Setting. Wirel. Pers. Commun. 2011, 68, 535–552. [Google Scholar] [CrossRef]
- Zorbas, D.; Papadopoulos, G.Z.; Maille, P.; Montavont, N.; Douligeris, C. Improving LoRa Network Capacity Using Multiple Spreading Factor Configurations. In Proceedings of the 2018 25th International Conference on Telecommunications (ICT), Saint-Malo, France, 26–28 June 2018; pp. 516–520. [Google Scholar] [CrossRef]
- Liang, R.; Zhao, L.; Wang, P. Performance Evaluations of LoRa Wireless Communication in Building Environments. Sensors 2020, 20, 3828. [Google Scholar] [CrossRef] [PubMed]
- Rasool, I.; Kemp, A.; Salman, N. RSSI-Based Positioning in Unknown Path-Loss Model for WSN. In Proceedings of the Sensor Signal Processing for Defence (SSPD 2012), London, UK, 25–27 September 2012. [Google Scholar] [CrossRef]
- Suroso, D.J.; Arifin, M.; Cherntanomwong, P. Distance-based Indoor Localization using Empirical Path Loss Model and RSSI in Wireless Sensor Networks. J. Robot. Control (JRC) 2020, 1, 199–207. [Google Scholar] [CrossRef]
- Hakim, G.P.N.; Habaebi, M.H.; Toha, S.F.; Islam, M.R.; Yusoff, S.H.B.; Adesta, E.Y.T.; Anzum, R. Near Ground Pathloss Propagation Model Using Adaptive Neuro Fuzzy Inference System for Wireless Sensor Network Communication in Forest, Jungle and Open Dirt Road Environments. Sensors 2022, 22, 3267. [Google Scholar] [CrossRef] [PubMed]
- Alfaresi, B.; Barlian, T.; Ardianto, F.; Hurairah, M. Path Loss Propagation Evaluation and Modelling based ECC-Model in Lowland Area on 1800 MHz Frequency. J. Robot. Control (JRC) 2020, 1, 167–172. [Google Scholar] [CrossRef]
- Freeman, R.L. Radio System Design for Telecommunication, 3rd ed.; John Wiley & Sons: Hoboken, NJ, USA, 2006. [Google Scholar]
- Garah, M.; Oudira, H.; Djouane, L.; Hamdiken, N. Particle Swarm Optimization for the Path Loss Reduction in Suburban and Rural Area. Int. J. Electr. Comput. Eng. (IJECE) 2017, 7, 2125. [Google Scholar] [CrossRef]
- Petäjäjärvi, J.; Mikhaylov, K.; Pettissalo, M.; Janhunen, J.; Iinatti, J.H. Performance of a low-power wide-area network based on LoRa technology: Doppler robustness, scalability, and coverage. Int. J. Distrib. Sens. Netw. 2017, 13, 1–16. [Google Scholar] [CrossRef]


| Oil Palm Tree | Tree Height (m) | Trunk Height (m) | Trunk Diameter (m) | Canopy Depth (m) | Canopy Diameter (m) |
|---|---|---|---|---|---|
| Tree 1 | 6.50 | 3.50 | 0.64 | 3.00 | 9.00 |
| Tree 2 | 6.72 | 3.52 | 0.64 | 3.22 | 9.31 |
| Tree 3 | 6.65 | 3.65 | 0.71 | 3.01 | 9.32 |
| Tree 4 | 6.72 | 3.71 | 0.79 | 3.51 | 9.57 |
| Tree 5 | 7.35 | 3.85 | 0.79 | 3.52 | 9.51 |
| Average | 6.79 | 3.65 | 0.714 | 3.25 | 9.34 |
| Parameter | Value |
|---|---|
| Frequency | 433 MHz |
| Bandwidth (BW) | 125 kHz, 250 kHz, 500 kHz |
| Spreading Factor (SF) | SF7, SF8, SF9, SF10, SF11, SF12 |
| Antenna Gain | 2 dBi |
| Tx-Power | 14 dbm |
| Coding Rate (CR) | 4/5 |
| Output power | 14 dBm |
| Measurement Type | Area | Height (Tx)m | Height (Rx)m | Initial Distance between Tx-Rx (m) |
|---|---|---|---|---|
| Line-of-Sight (LoS) | Open Space | 1 | 1 | 1 |
| Non-Line-of-Sight (NLoS) | Trunk | 3 | 1.5 | 9 |
| Non-Line-of-Sight (NLoS) | Canopy | 5.5 | 1.5 | 9 |
| Path-Loss Exponent, n | |||||
|---|---|---|---|---|---|
| SFs | BW 125 kHz | BW 250 kHz | Average | BW 500 kHz | Average |
| SF7 | 2.37 | 2.36 | 2.34 | 3.15 | 2.9 |
| SF8 | 2.63 | 2.52 | 2.98 | ||
| SF9 | 2.39 | 2.44 | 2.87 | ||
| SF10 | 2.37 | 2.33 | 2.84 | ||
| SF 11 | 2.12 | 2.26 | 2.71 | ||
| SF12 | 2.14 | 2.16 | 2.74 | ||
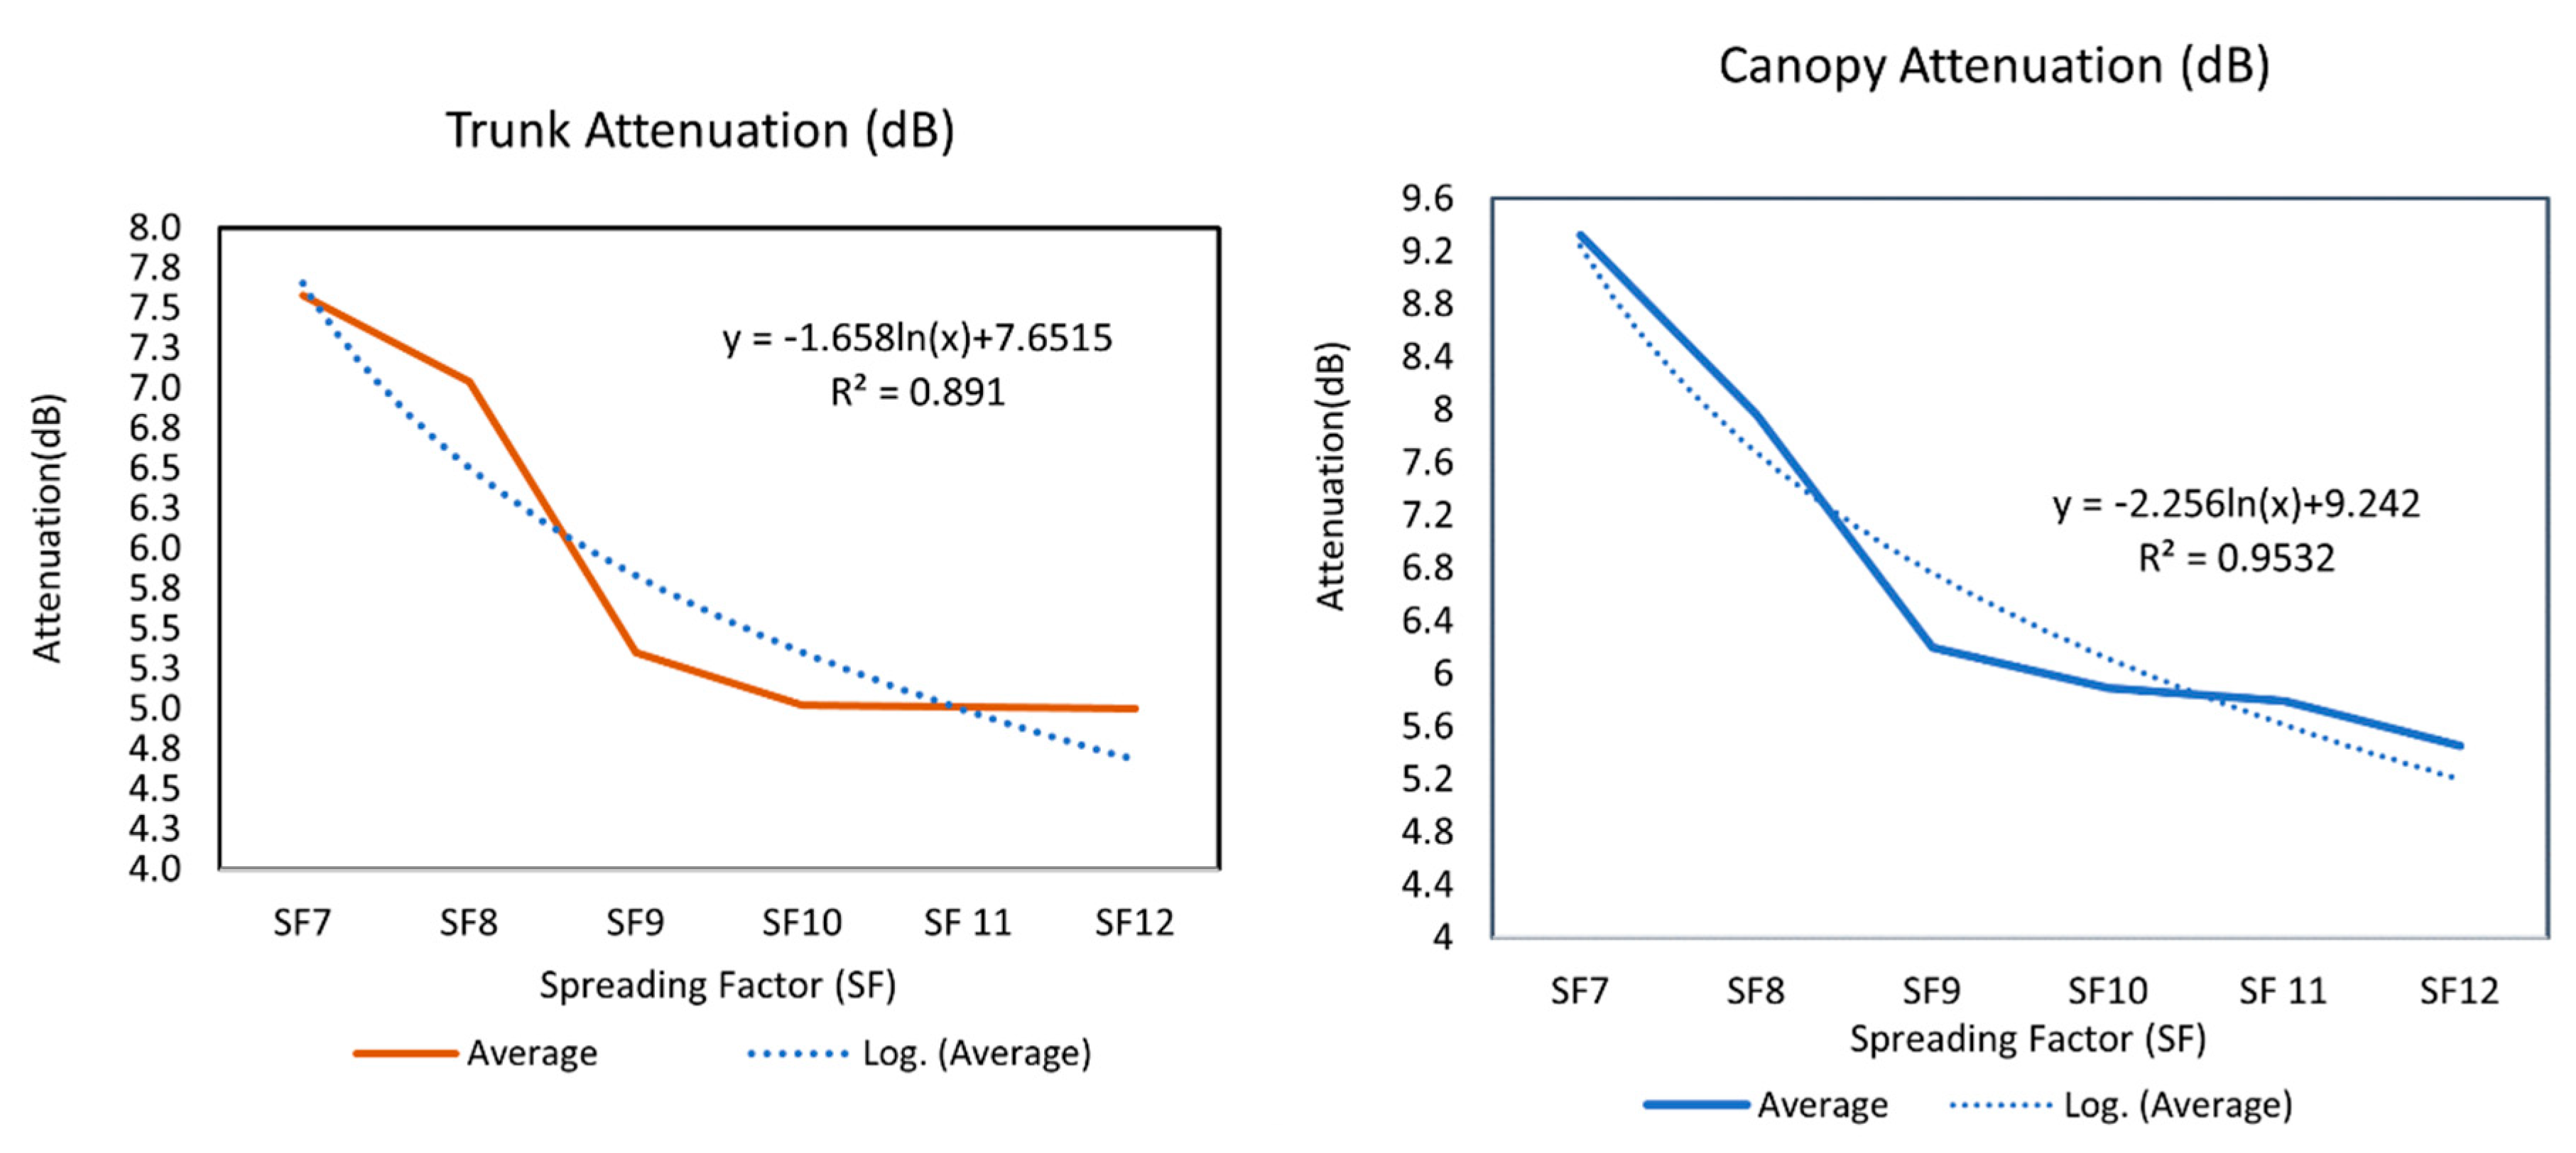
| Trunk Attenuation (dB) | Canopy Attenuation (dB) | |||||||
|---|---|---|---|---|---|---|---|---|
| SFs | 125 kHz | 250 kHz | 500 kHz | Avg. | 125 kHz | 250 kHz | 500 kHz | Avg. |
| SF7 | 7.5 | 7.57 | 7.66 | 7.58 | 8.98 | 9.56 | 9.42 | 9.32 |
| SF8 | 7 | 7 | 7.11 | 7.04 | 7.85 | 7.99 | 8.04 | 7.96 |
| SF9 | 5.5 | 5.5 | 5.04 | 5.35 | 5.94 | 6.24 | 6.43 | 6.2 |
| SF10 | 5 | 5 | 5.06 | 5.02 | 5.62 | 5.72 | 6.33 | 5.89 |
| SF11 | 5 | 5.05 | 4.98 | 5.01 | 5.7 | 5.65 | 6.01 | 5.79 |
| SF12 | 5 | 5 | 5.01 | 5.00 | 5.5 | 5.47 | 5.37 | 5.45 |
| Components | Function |
|---|---|
| , f = 433 MHz | |
| n | 2.34 (BW 125 to 250 kHz) |
| 2.9 (BW 500 kHz) | |
| T | y = −1.658 ln(x) + 7.6515 |
| C | y = −2.256 ln(x) + 9.242 |
| LoRa Channels | RMSE (dB) | ||
|---|---|---|---|
| 433 MHz | Predicted | Weissberger | ITU-R |
| SF7, BW 125 kHz | 3.24 | 10.73 | 34.1 |
| SF10, BW 125 kHz | 2.04 | 4.75 | 19.12 |
| SF12, BW 125 kHz | 2.07 | 3.9 | 20.08 |
| SF7, BW 500 kHz | 3.10 | 7.04 | 25.02 |
| SF10, BW 500 kHz | 3.39 | 2.32 | 20.02 |
| SF12, BW 500 kHz | 2.62 | 3.19 | 21.1 |
| Avg. | 2.74 | 5.32 | 23.24 |
Publisher’s Note: MDPI stays neutral with regard to jurisdictional claims in published maps and institutional affiliations. |
© 2022 by the authors. Licensee MDPI, Basel, Switzerland. This article is an open access article distributed under the terms and conditions of the Creative Commons Attribution (CC BY) license (https://creativecommons.org/licenses/by/4.0/).
Share and Cite
Anzum, R.; Habaebi, M.H.; Islam, M.R.; Hakim, G.P.N.; Khandaker, M.U.; Osman, H.; Alamri, S.; AbdElrahim, E. A Multiwall Path-Loss Prediction Model Using 433 MHz LoRa-WAN Frequency to Characterize Foliage’s Influence in a Malaysian Palm Oil Plantation Environment. Sensors 2022, 22, 5397. https://doi.org/10.3390/s22145397
Anzum R, Habaebi MH, Islam MR, Hakim GPN, Khandaker MU, Osman H, Alamri S, AbdElrahim E. A Multiwall Path-Loss Prediction Model Using 433 MHz LoRa-WAN Frequency to Characterize Foliage’s Influence in a Malaysian Palm Oil Plantation Environment. Sensors. 2022; 22(14):5397. https://doi.org/10.3390/s22145397
Chicago/Turabian StyleAnzum, Rabeya, Mohamed Hadi Habaebi, Md Rafiqul Islam, Galang P. N. Hakim, Mayeen Uddin Khandaker, Hamid Osman, Sultan Alamri, and Elrashed AbdElrahim. 2022. "A Multiwall Path-Loss Prediction Model Using 433 MHz LoRa-WAN Frequency to Characterize Foliage’s Influence in a Malaysian Palm Oil Plantation Environment" Sensors 22, no. 14: 5397. https://doi.org/10.3390/s22145397
APA StyleAnzum, R., Habaebi, M. H., Islam, M. R., Hakim, G. P. N., Khandaker, M. U., Osman, H., Alamri, S., & AbdElrahim, E. (2022). A Multiwall Path-Loss Prediction Model Using 433 MHz LoRa-WAN Frequency to Characterize Foliage’s Influence in a Malaysian Palm Oil Plantation Environment. Sensors, 22(14), 5397. https://doi.org/10.3390/s22145397