
Design of an Integrated Micro-Viscometer for Monitoring Engine Oil

 , ,
, ,  and
and
Abstract
:
1. Introduction
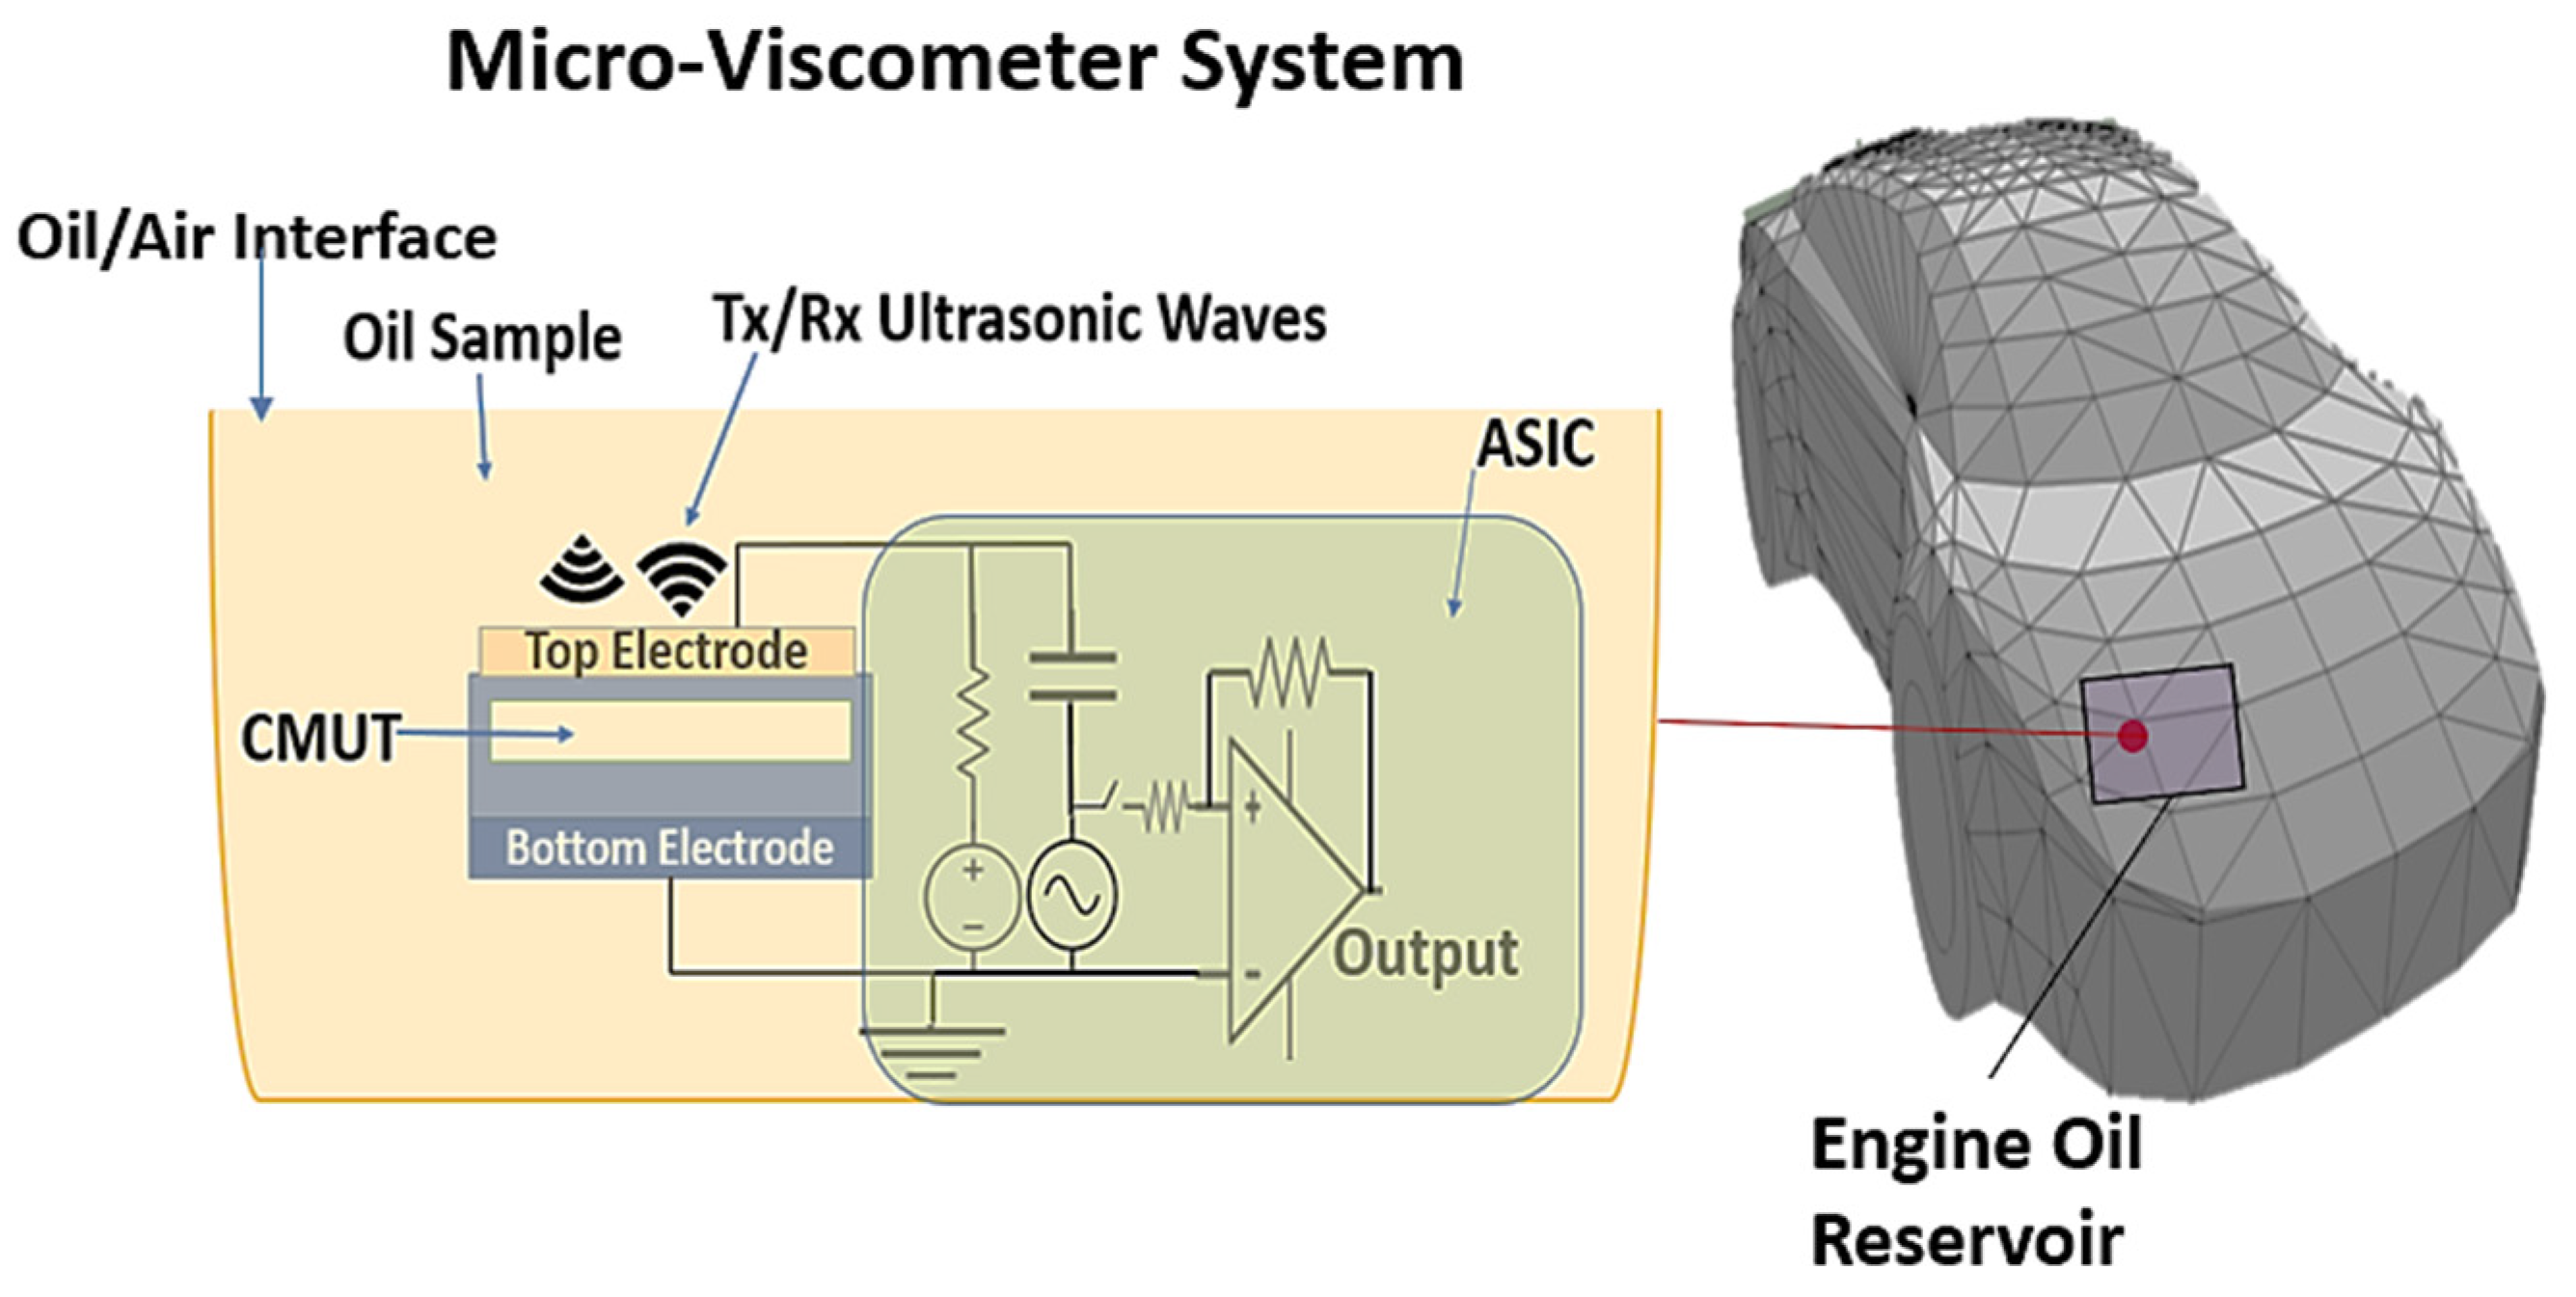
2. CMUT and ASIC Design Methodology
2.1. Theoretical Model
2.2. Structure and Fabrication
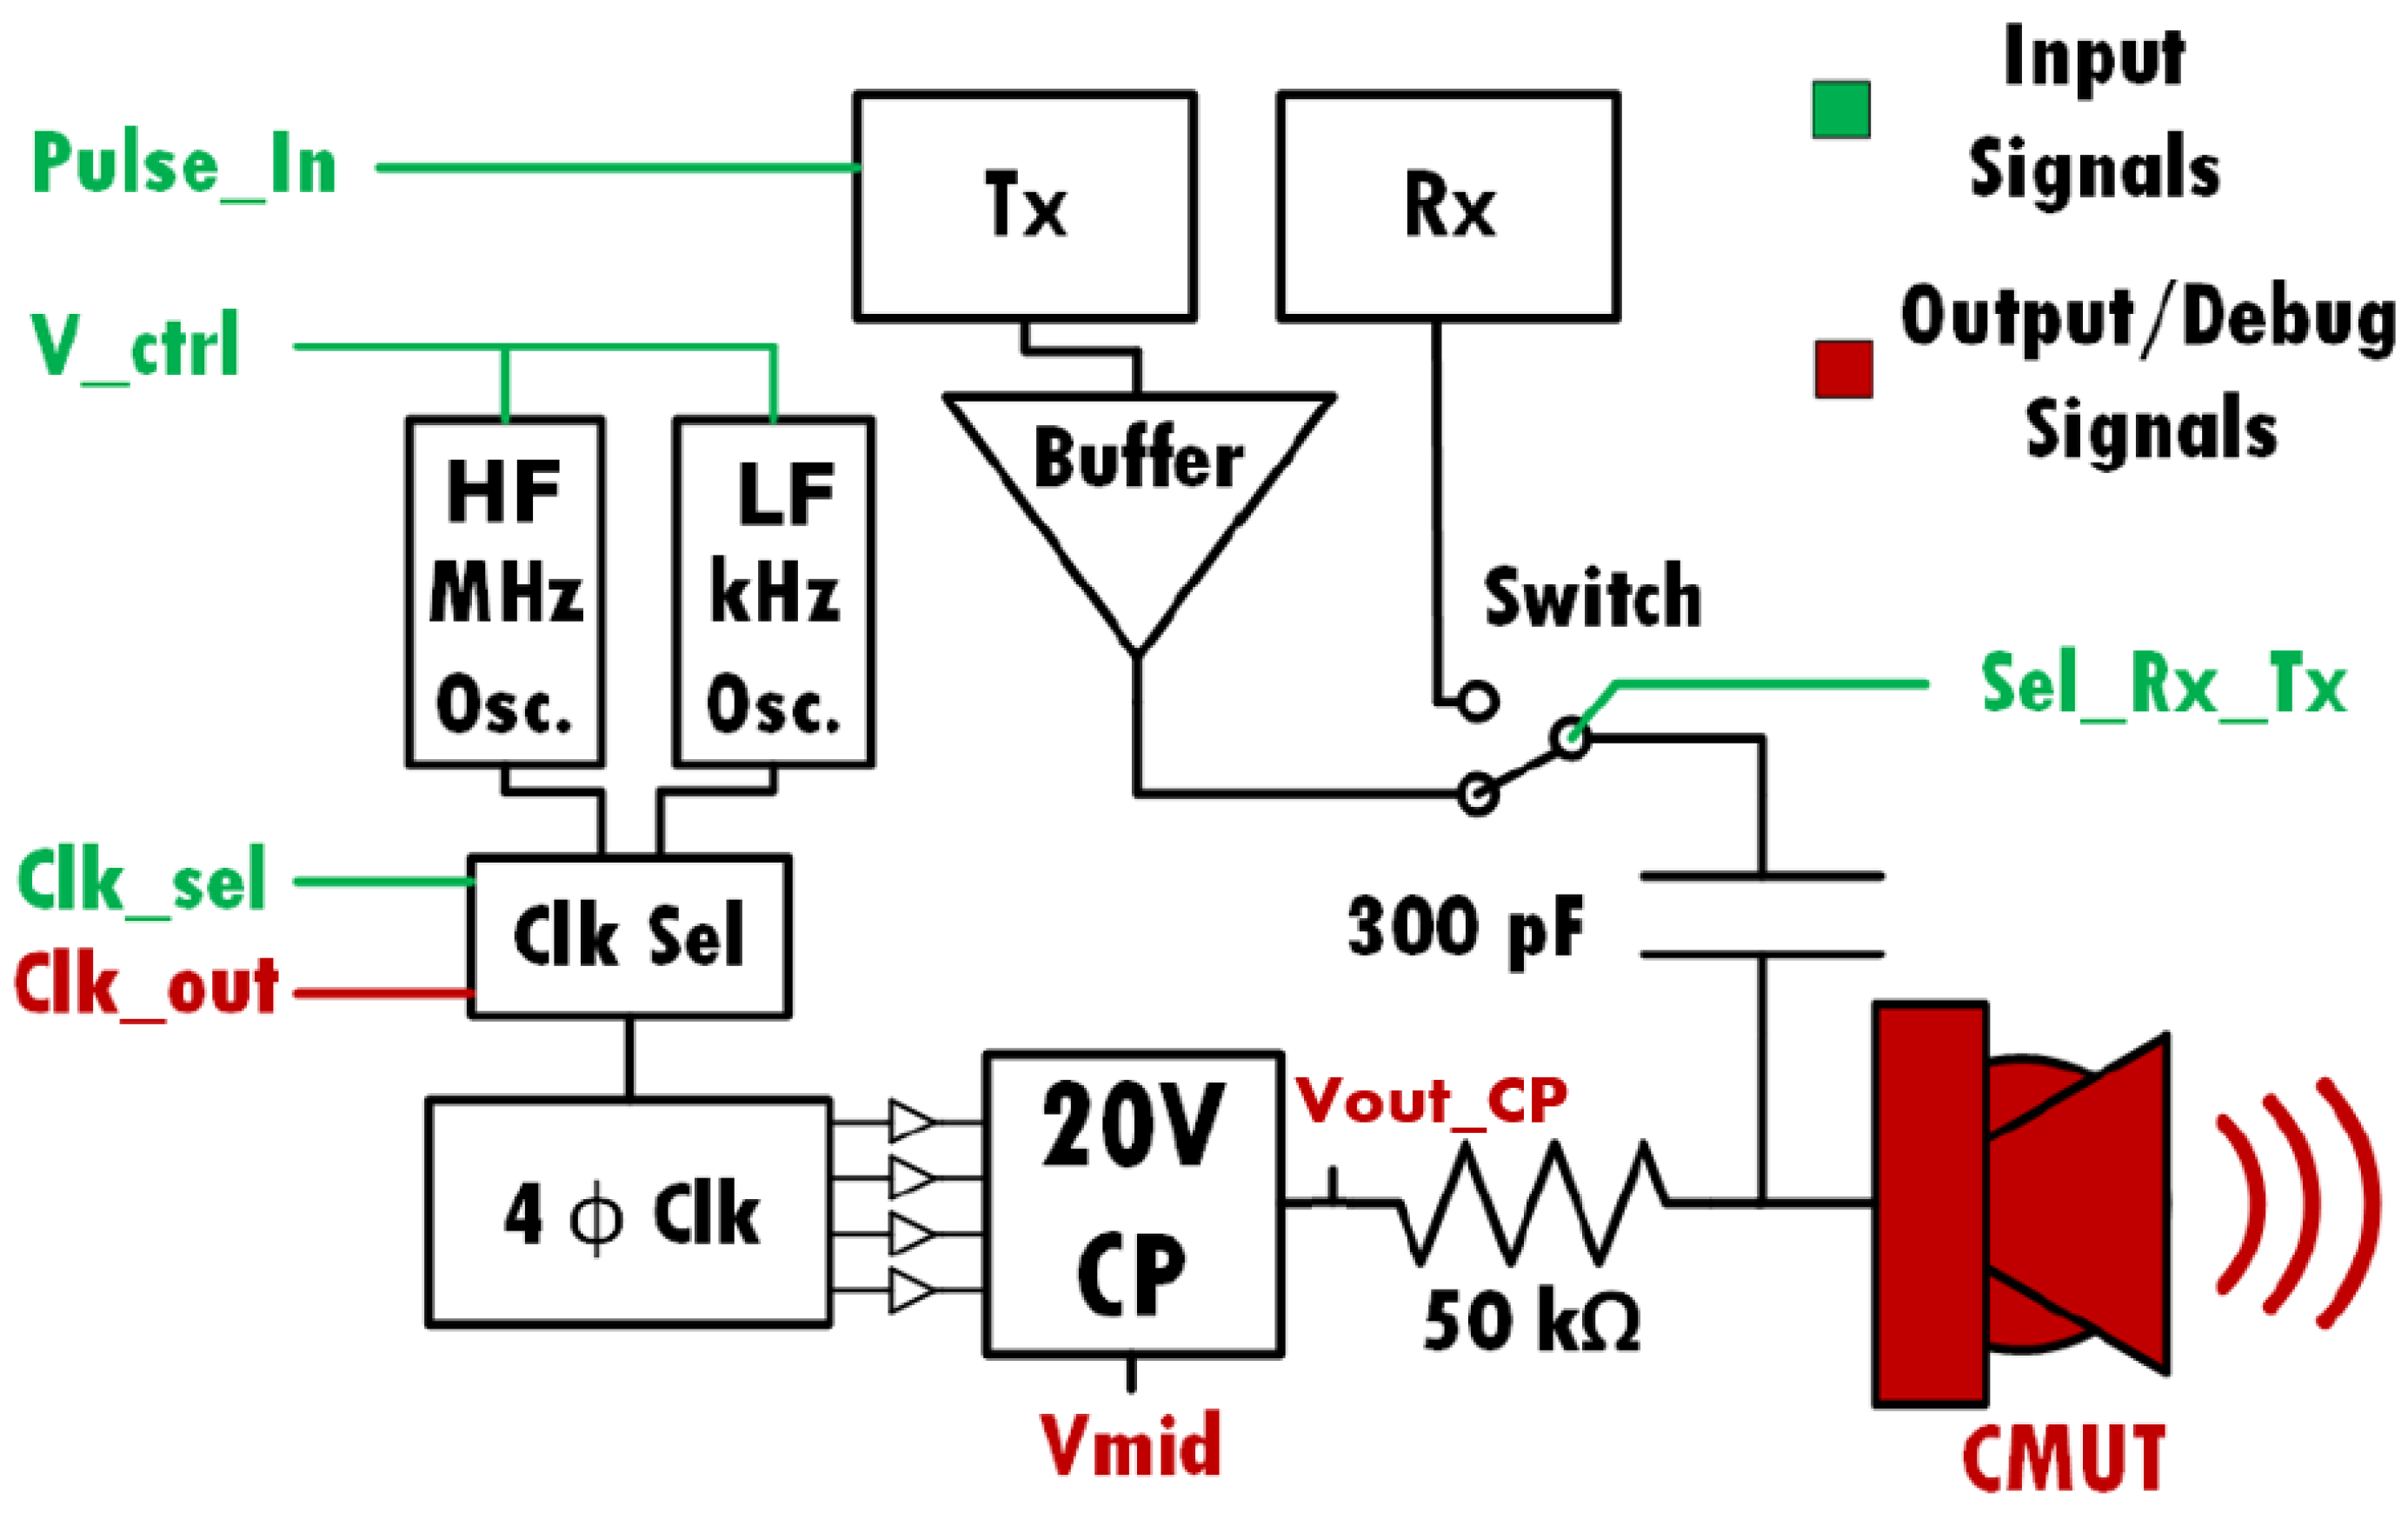
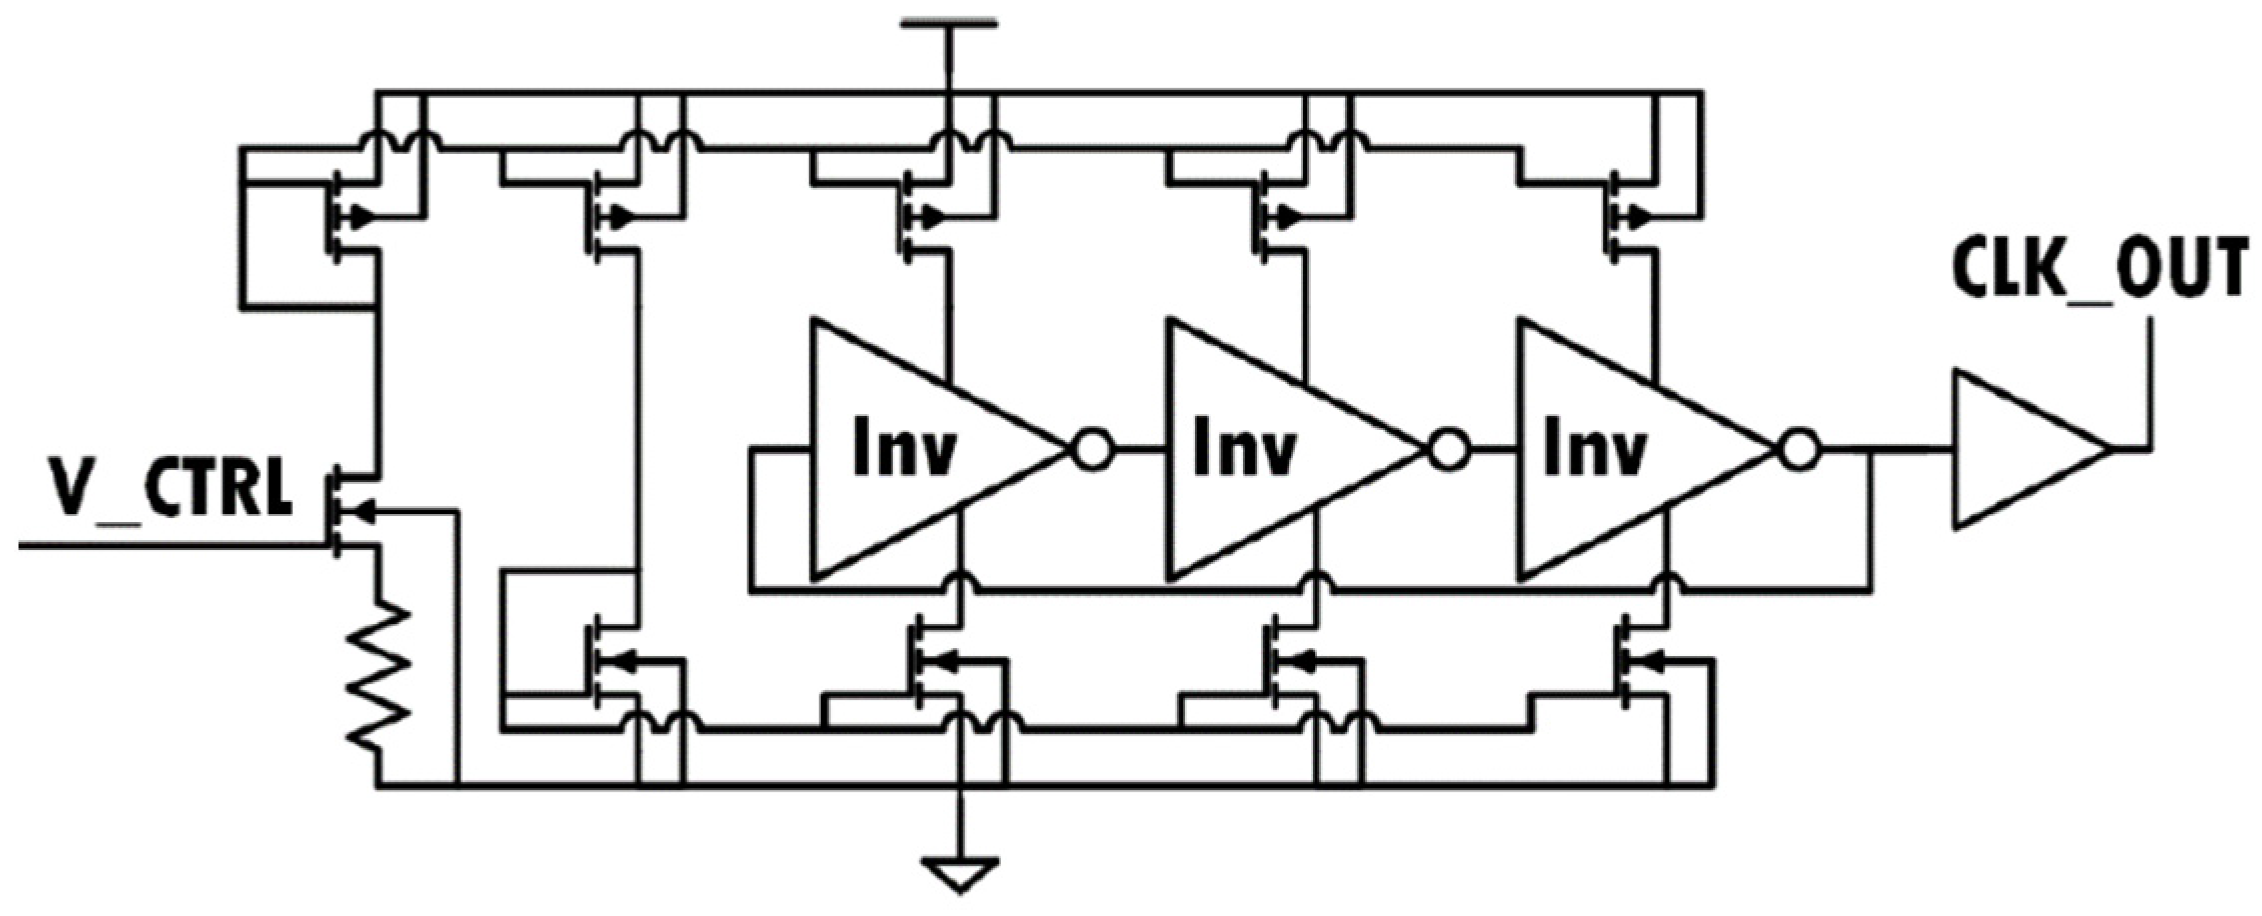
2.3. Analog Front End (AFE)—Transceiver ASIC
2.3.1. Transmitter
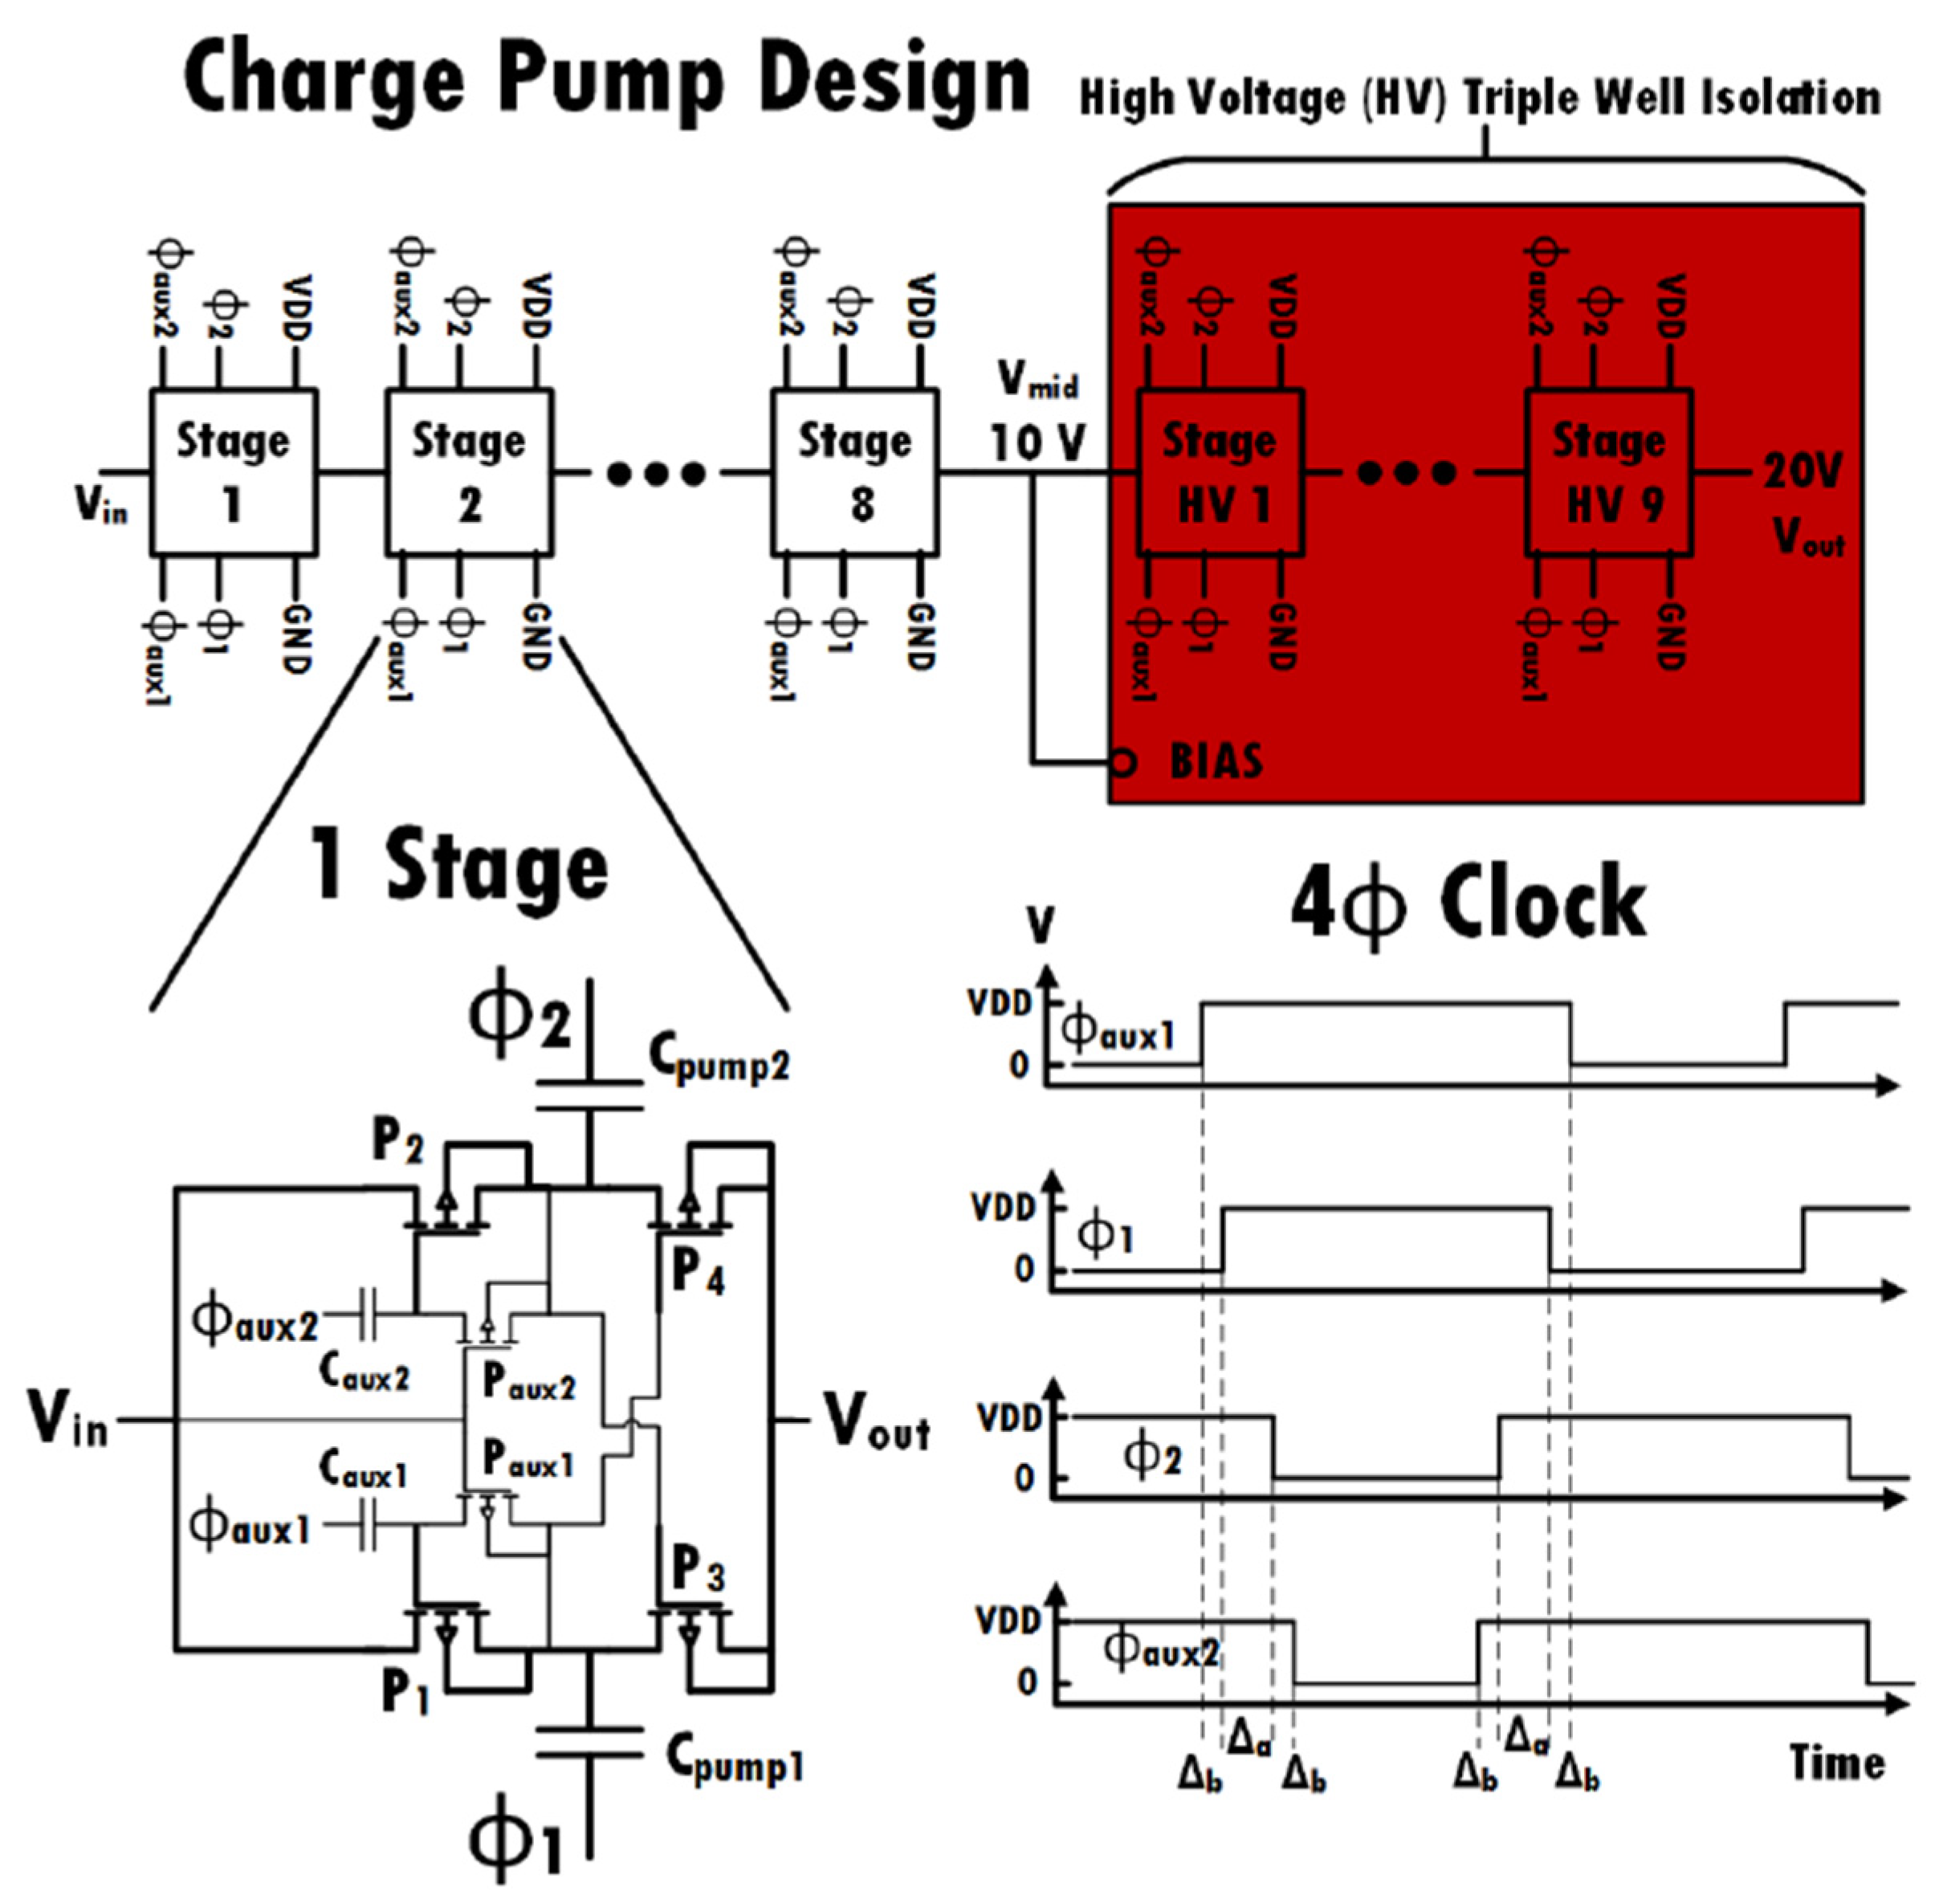
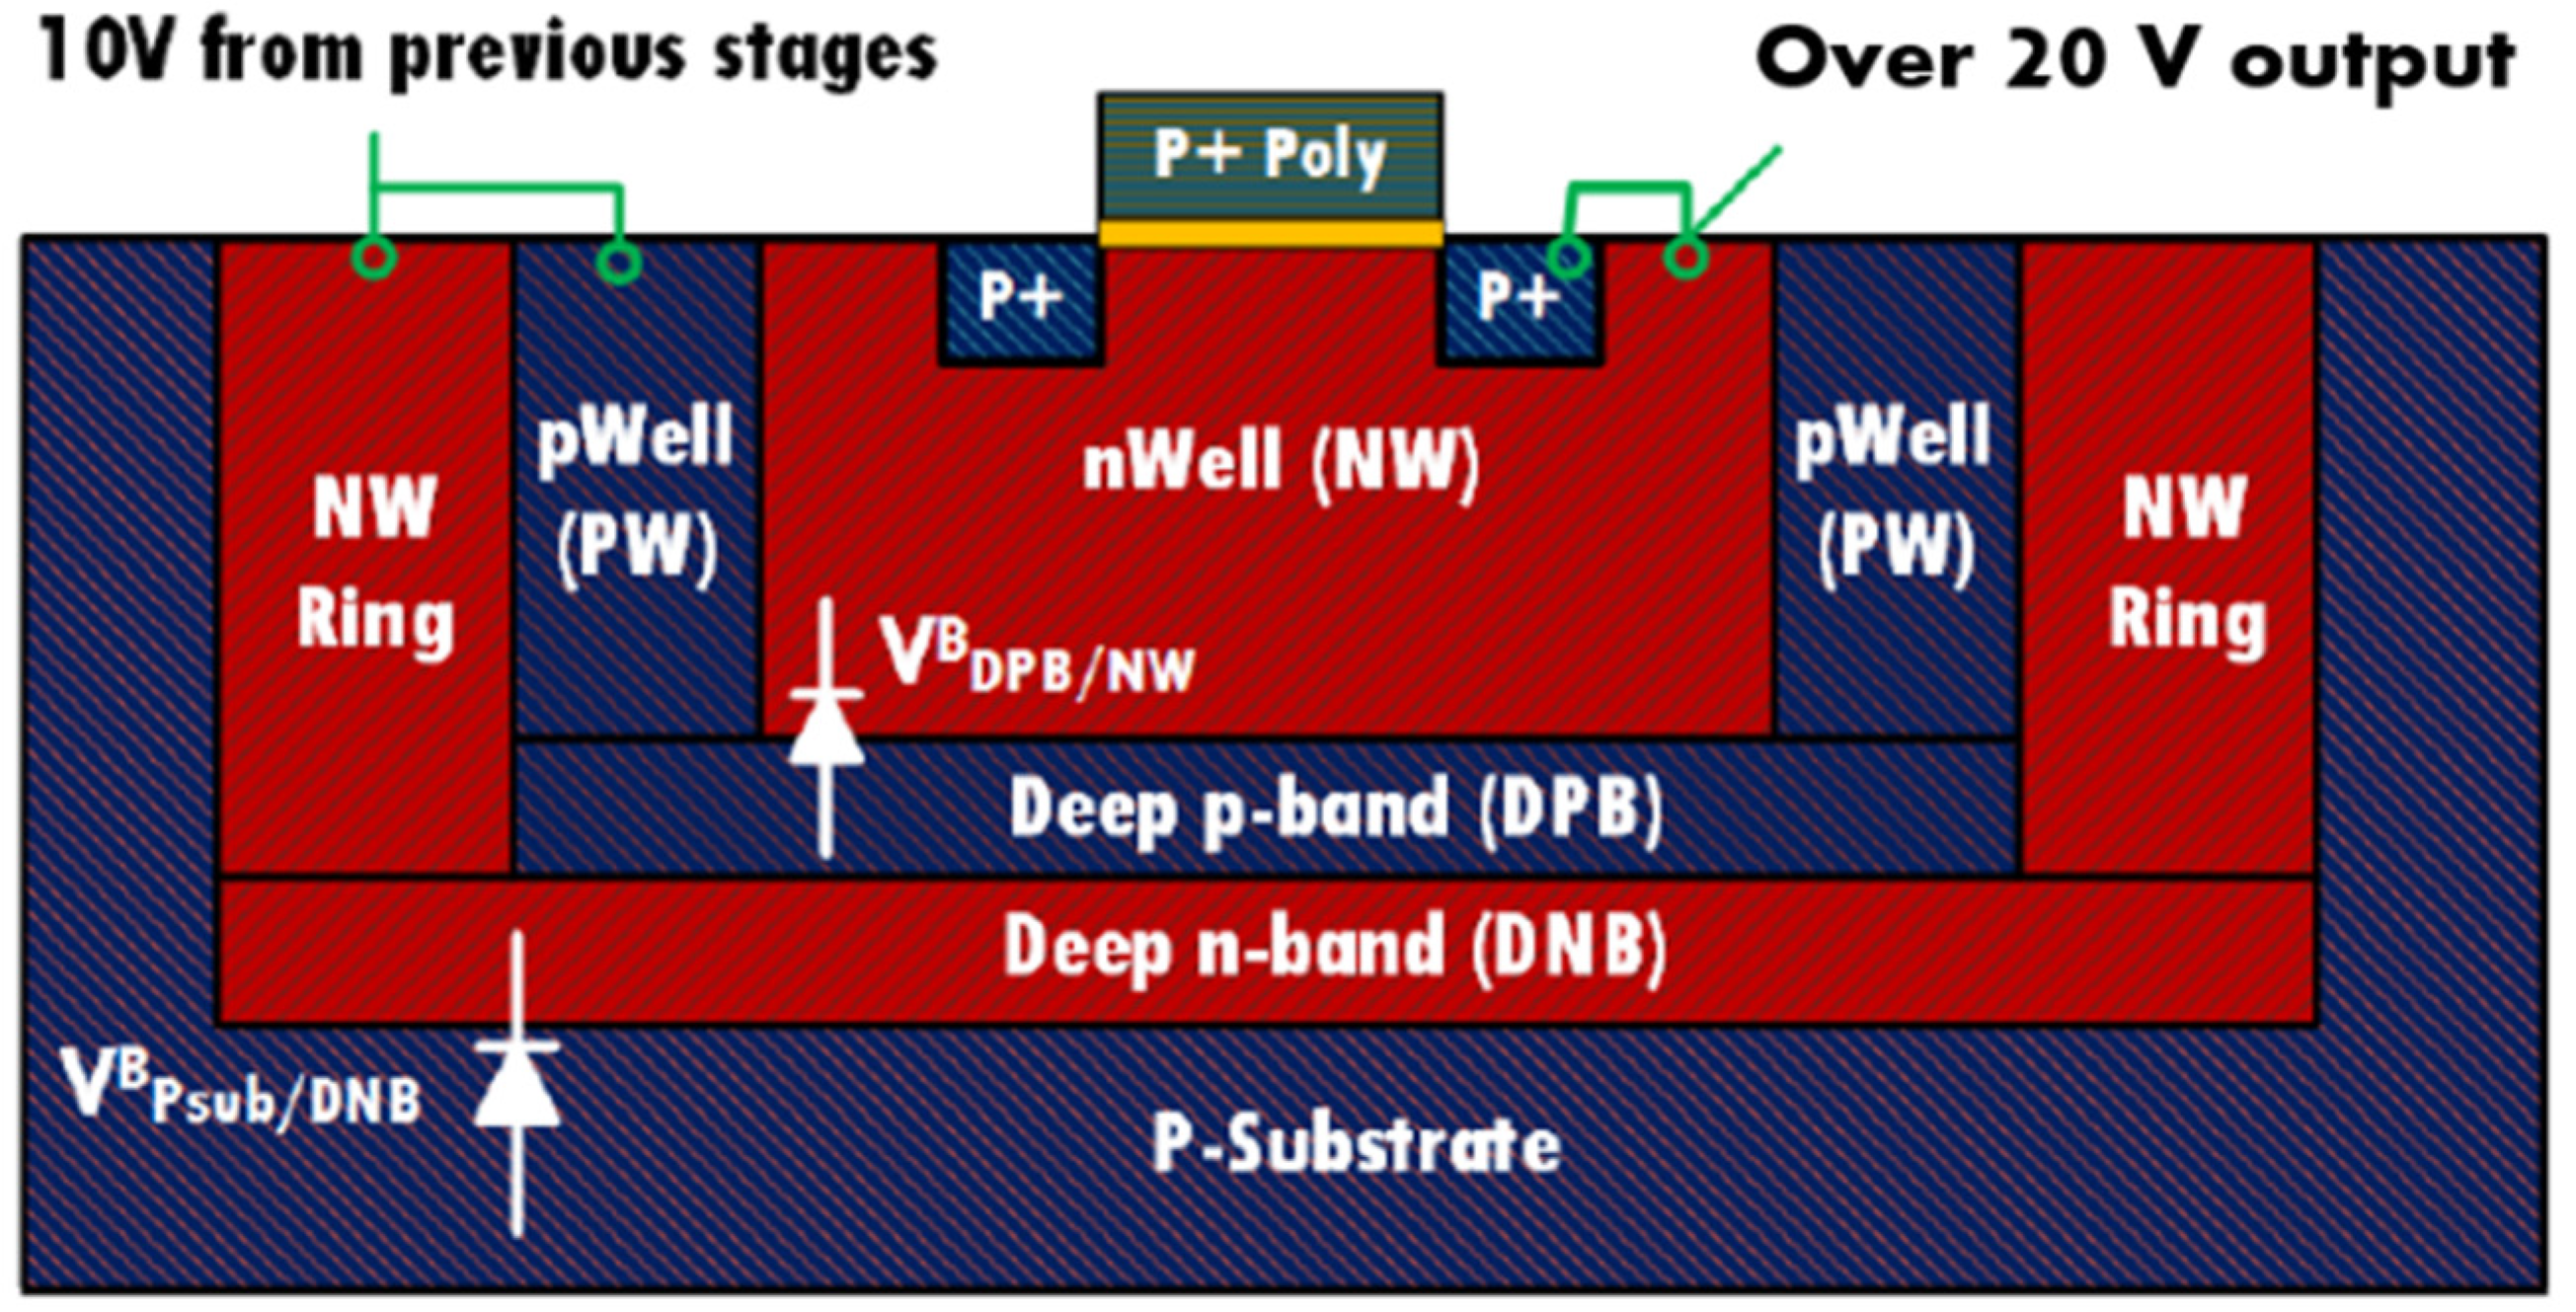
2.3.2. Charge Pump
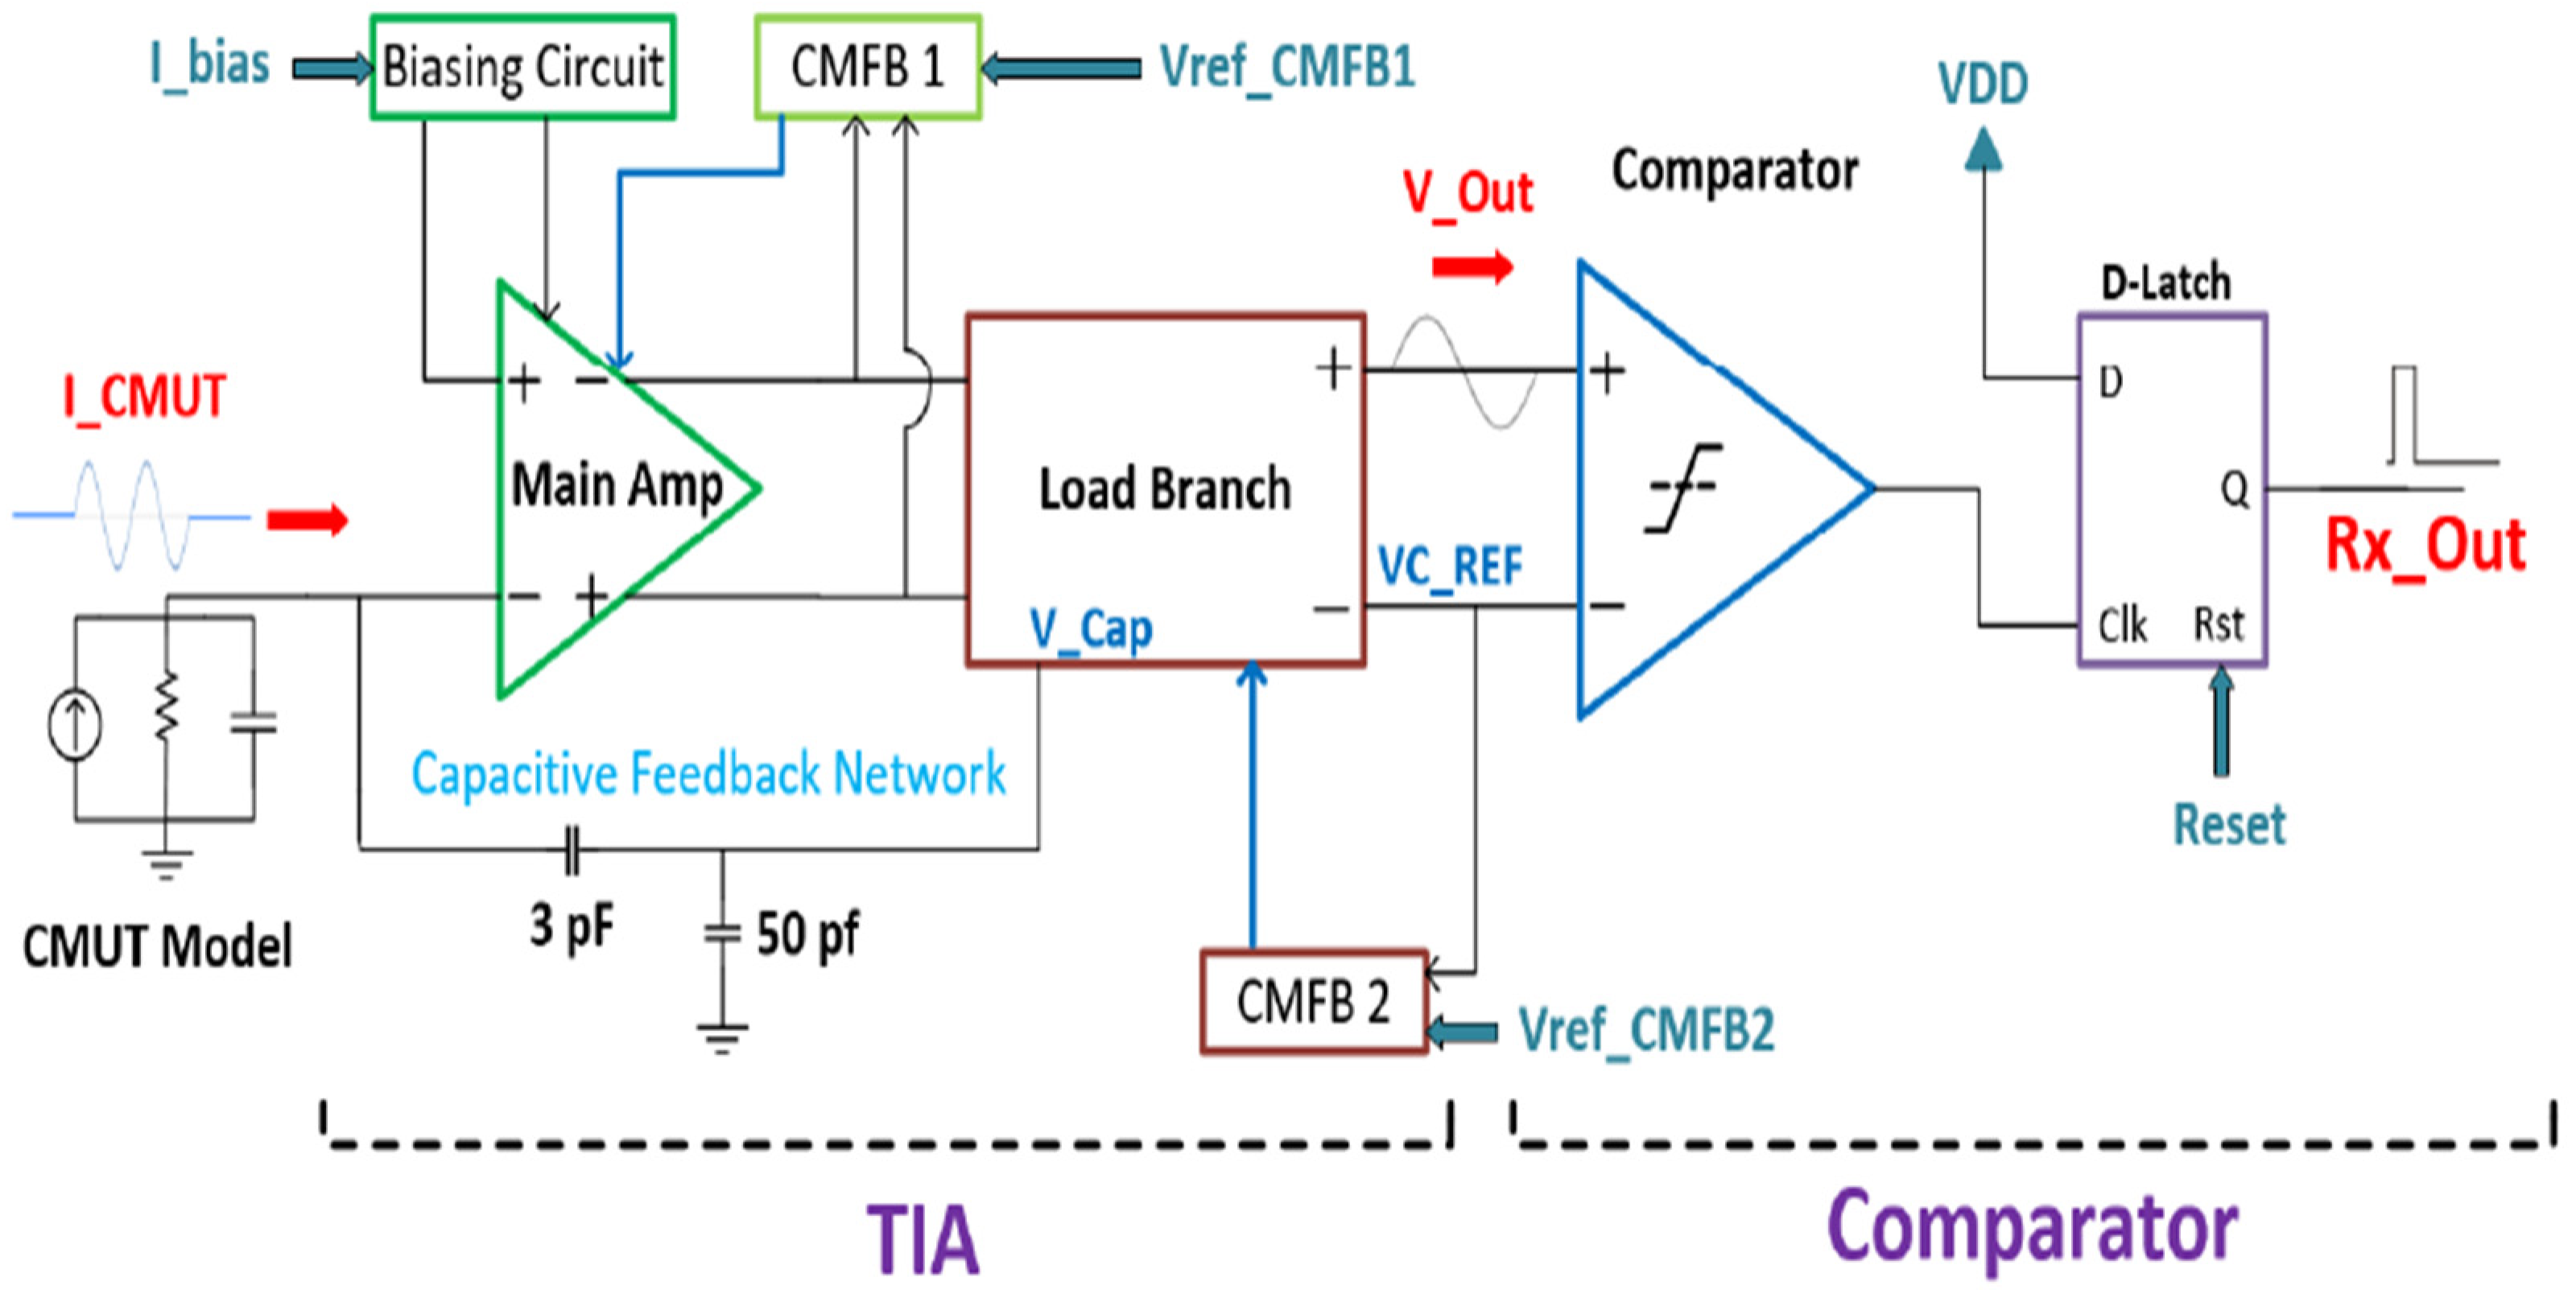
2.3.3. Receiver
3. Results and Discussion
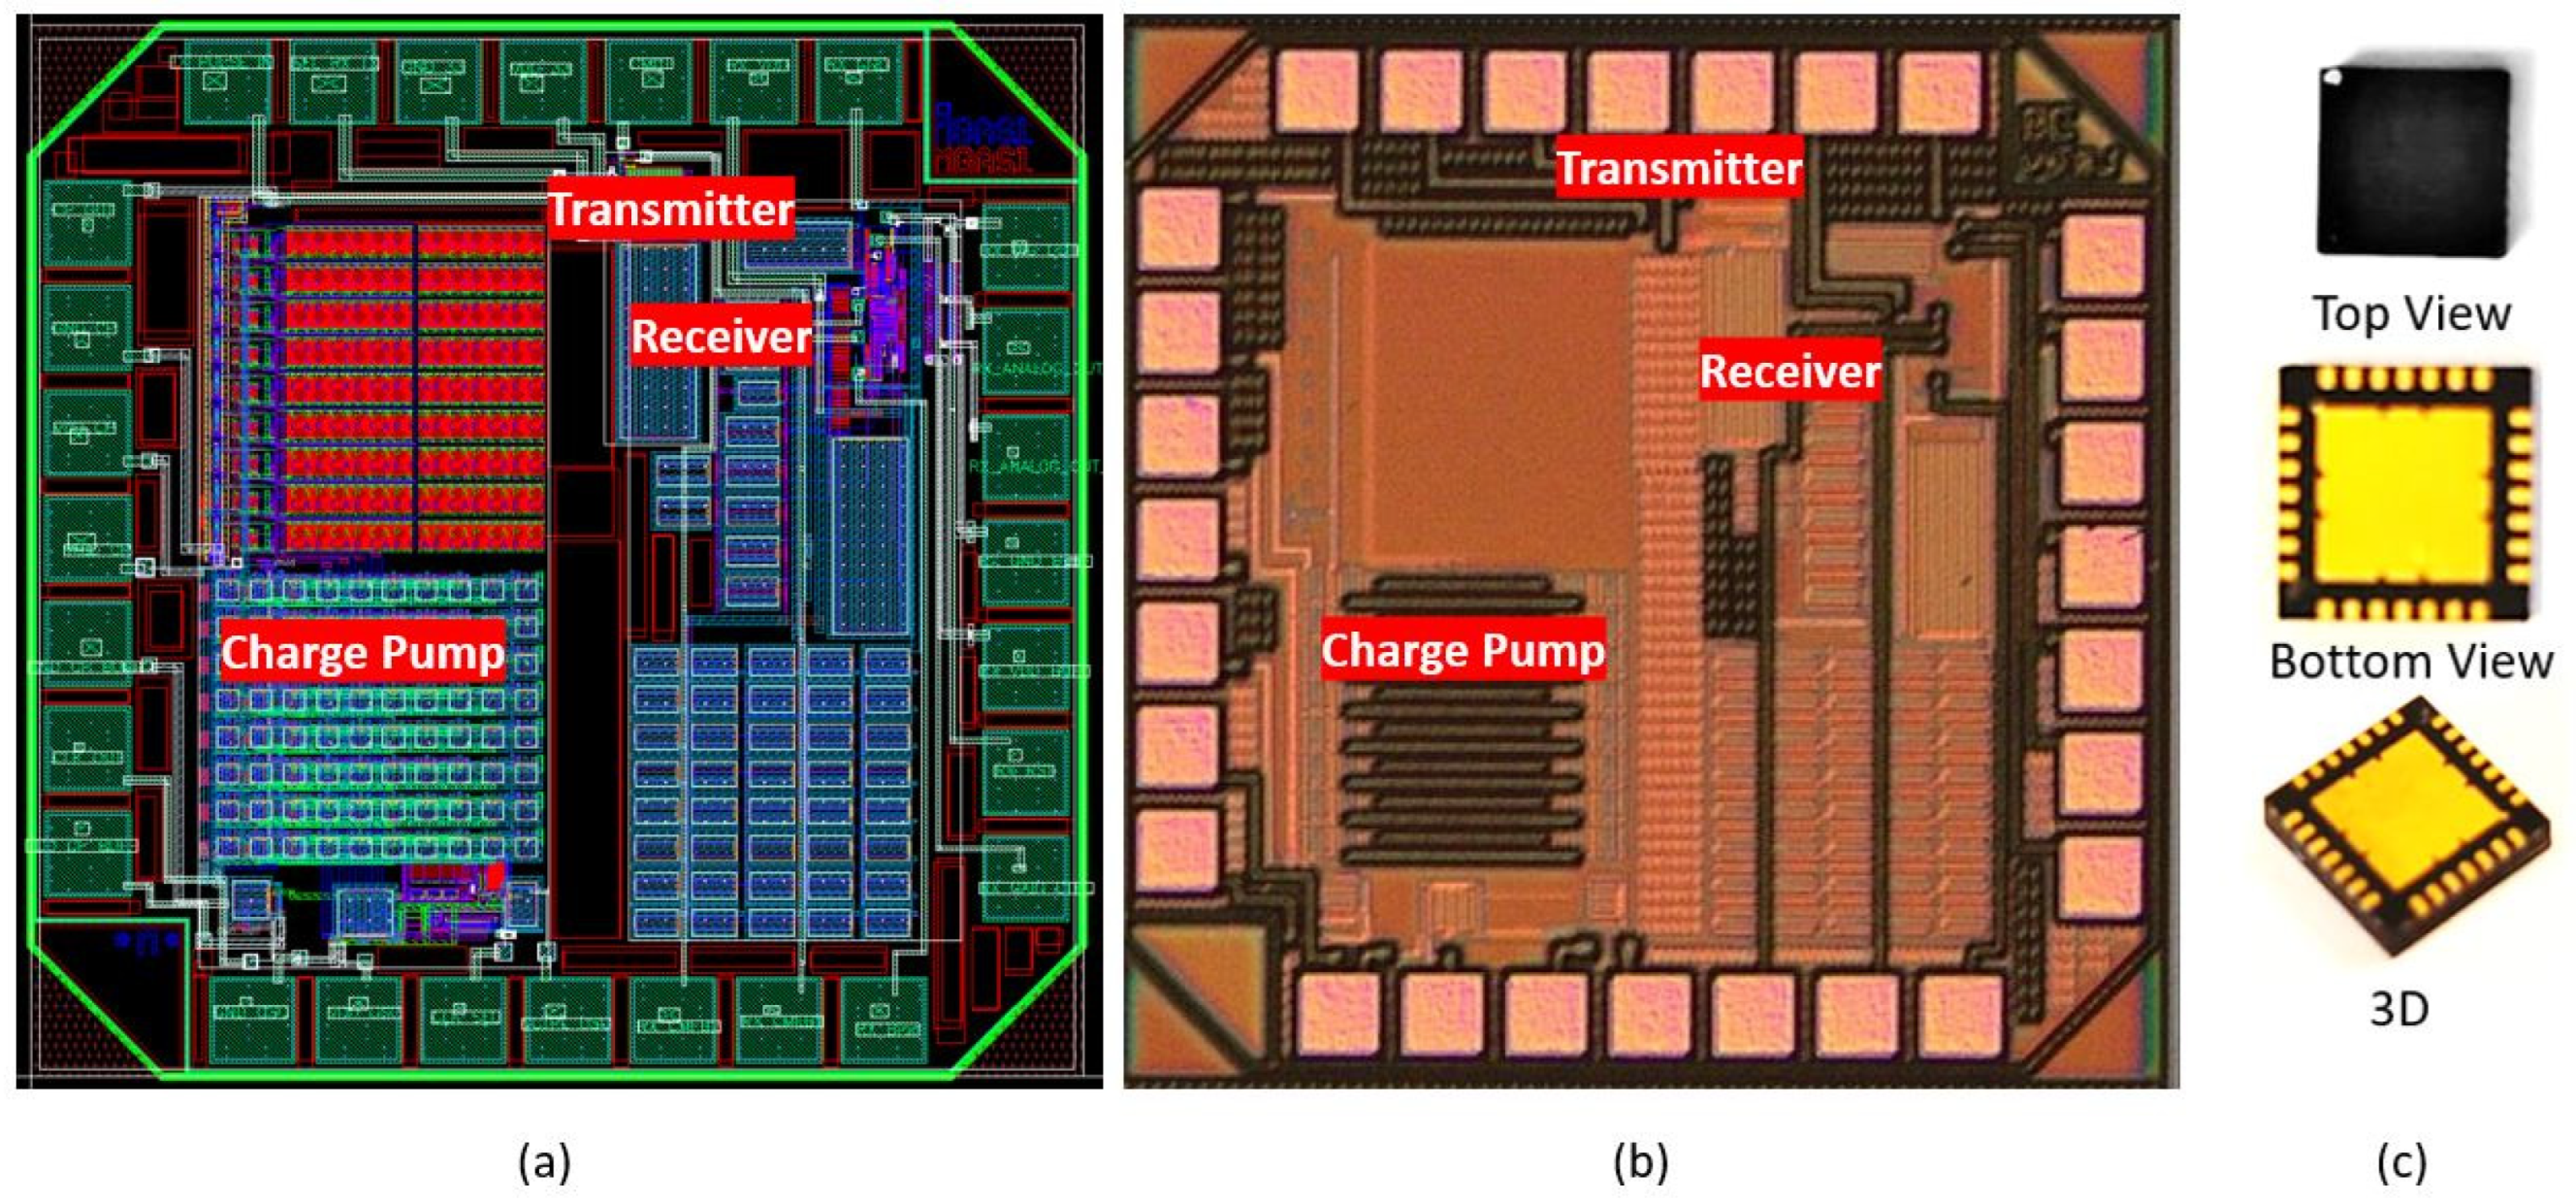
3.1. Analog Front End—Transceiver ASIC
3.2. Micro-Viscometer System
4. Conclusions
Author Contributions
Funding
Institutional Review Board Statement
Informed Consent Statement
Data Availability Statement
Conflicts of Interest
References
- Tatiya, R.R. Elements of Industrial Hazards: Health, Safety, Environment and Loss Prevention; Taylor & Francis Group: Oxford, UK, 2010; Available online: https://ebookcentral.proquest.com/lib/mcgill/detail.action?docID=1449366 (accessed on 13 March 2022).
- Agoston, A.; Tsch, C.O.; Jakoby, B. Viscosity sensors for engine oil condition monitoring—Application and interpretation of results. Sens. Actuators A Phys. 2005, 121, 327–332. [Google Scholar] [CrossRef]
- Jakoby, B.; Scherer, M.; Buskies, M.; Eisenschmid, H. Automotive engine oil viscosity sensor. IEEE Sens. J. 2003, 3, 562–568. [Google Scholar] [CrossRef]
- Halme, J.; Gorritxategi, E.; Bellew, J. Lubricating Oil Sensors. In E-maintenance, 1st ed.; Holmberg, K., Adgar, A., Arnaiz, A., Jantunen, E., Mascolo, J., Mekid, S., Eds.; Springer: London, UK, 2010. [Google Scholar]
- Vozmilov, A.G.; Ilimbetov, R.Y.; Korobkov, D.S.; Faizulloev, N.L.; Astafev, D.V.; Andreev, L.N. Diagnostics of Engine oil of Internal Combustion Engine by Electrophysical Method of Control. In Proceedings of the 2018 Global Smart Industry Conference (GloSIC), Chelyabinsk, Russia, 13–15 November 2018; pp. 1–5. [Google Scholar] [CrossRef]
- Joel, S.; Steve, M. Evaluation of Sensors for On-Board Diesel Oil Condition Monitoring of U.S. Army Ground Equipment, SAE Technical Paper 2005-01-1810. 2005. Available online: https://apps.dtic.mil/sti/pdfs/ADA478089.pdf (accessed on 2 February 2022).
- Huawei, W.; Abdullah, A.A.-R.; Azeez, A.B.; Amin, S.; Ali, K.; Pouyan, T. Curve-fitting on experimental thermal conductivity of engine oil under influence of hybrid nano additives containing multi-walled carbon nanotubes and zinc oxide. Phys. A Stat. Mech. Its Appl. 2019, 535, 22128. [Google Scholar]
- Clara, S.; Antlinger, H.; Jakoby, B. An Electromagnetically Actuated Oscillating Sphere Used as a Viscosity Sensor. IEEE Sens. J. 2014, 14, 1914–1922. [Google Scholar] [CrossRef]
- Han, Z.; Wang, Y.; Qing, X. Characteristics Study of In-Situ Capacitive Sensor for Monitoring Lubrication Oil Debris. Sensors 2017, 17, 2851. [Google Scholar] [CrossRef] [PubMed] [Green Version]
- Lopez, P.; Mabe, J.; Miró, G.; Etxeberria, L. Low-Cost Photonic Sensor for in-Line Oil Quality Monitoring: Methodological Development Process towards Uncertainty Mitigation. Sensors 2018, 18, 2015. [Google Scholar] [CrossRef] [PubMed] [Green Version]
- Anacan, R.M.; Cabautan, A.C.; Cayabyab, J.M.A.; Miguel, S.X.A.; Modrigo, V.D.; Rosites, C.J.V.; Sagun, A.C. Development of Oil Quality Estimator Using Machine Vision System. In Proceedings of the 2018 IEEE 10th International Conference on Humanoid, Nanotechnology, Information Technology, Communication and Control, Environment and Management (HNICEM), Baguio, Philippines, 29 November 2018; pp. 1–6. [Google Scholar] [CrossRef]
- Toledo, J.; Manzaneque, T.; Ruiz-Díez, V.; Kucera, M.; Pfusterschmied, G.; Wistrela, E.; Steindl, W.; Schmid, U.; Sánchez-Rojas, J.L. Piezoelectric MEMS resonators for density and viscosity sensing in engine oil with diesel fuel. In Proceedings of the 2015 Transducers-2015 18th International Conference on Solid-State Sensors, Actuators and Microsystems (TRANSDUCERS), Anchorage, AK, USA, 21–25 June 2015; pp. 436–439. [Google Scholar] [CrossRef]
- Ghommem, M.; Puzyrev, V.; Najar, F. Fluid sensing using microcantilevers: From physics-based modeling to deep learning. Appl. Math. Model. 2020, 88, 224–237. [Google Scholar] [CrossRef]
- Matthew, D.; Brouwer, L.; Gupta, A.; Farshid, S.; Dimitrios, P.; Douglas, A. High temperature dynamic viscosity sensor for engine oil applications. Sens. Actuators A Phys. 2012, 173, 102–107. [Google Scholar]
- Yu, H.; Lou, L.; Alex, G.Y. Capacitive micromachined ultrasonic transducer (CMUT) based micro viscosity sensor. Sens. Actuators B Chem. 2016, 227, 346–351. [Google Scholar]
- Behnamfar, P.; Molavi, R.; Mirabbasi, S. Transceiver Design for CMUT-Based Super-Resolution Ultrasound Imaging. IEEE Trans. Biomed. Circuits Syst. 2016, 10, 383–393. [Google Scholar] [CrossRef] [PubMed]
- Bhuyan, A.; Chang, C.; Choe, J.W.; Lee, B.C.; Nikoozadeh, A.; Oralkan, O.; Khuri-Yakub, B.T. A 32 × 32 integrated CMUT array for volumetric ultrasoundimaging. In Proceedings of the Ultrasonics Symposium (IUS), 2013 IEEE International, Prague, Czech Republic, 21–25 July 2013; pp. 545–548. [Google Scholar]
- Kozlovsky, Y. Vibration of plates in contact with viscous fluid: Extension of Lamb’s model. J. Sound Vib. 2009, 326, 332–339. [Google Scholar] [CrossRef]
- Hani, H.T.; Tariq, A.; Mohannad, Y.E.; Frederic, N.; Mourad, N.E.-G. Reduced-gap CMUT implementation in Poly- MUMPs for air coupled and underwater applications. Sens. Actuators A Phys. 2019, 294, 102–115. [Google Scholar]
- Cowen, A.; Hardy, B.; Mahadevan, R.; Wilcenski, S. PolyMUMPs Design Handbook; MEMSCAP Inc.: Durham, NC, USA, 2011. [Google Scholar]
- Okochi, S.; Koizumi, H. A High Step-Up Single Switch DC-DC Converter with Switched-Inductors and Switched-Capacitors. In Proceedings of the 2019 IEEE 4th International Future Energy Electronics Conference (IFEEC), Singapore, 25–28 November 2019; pp. 1–6. [Google Scholar] [CrossRef]
- Gerosa, A.; Bevilacqua, A.; Spiazzi, G. A Multi-Phase Self-Reconfigurable Switched-Capacitor DC-DC Step-Up Converter Integrated in CMOS Technology. In Proceedings of the 2019 IEEE International Symposium on Circuits and Systems (ISCAS), Sapporo, Japan, 26–29 May 2019; pp. 1–5. [Google Scholar] [CrossRef]
- Suman, S.; Sharma, K.G.; Ghosh, P.K. Analysis and design of current starved ring VCO. In Proceedings of the 2016 International Conference on Electrical, Electronics, and Optimization Techniques (ICEEOT), Chennai, India, 3–5 March 2016; pp. 3222–3227. [Google Scholar] [CrossRef]
- Ferro, E.; Brea, V.M.; López, P.; Cabello, D. Micro-Energy Harvesting System Including a PMU and a Solar Cell on the Same Substrate with Cold Startup From 2.38 nW and Input Power Range up to 10 µW Using Continuous MPPT. IEEE Trans. Power Electron. 2019, 34, 5105–5116. [Google Scholar] [CrossRef]
- Wygant, I.O.; Jamal, N.S.; Lee, H.J.; Nikoozadeh, A.; Oralkan, O.; Karaman, M.; Khuri-yakub, B.T. An integrated circuit with transmit beamforming flip-chip bonded to a 2-D CMUT array for 3-D ultrasound imaging. IEEE Trans. Ultrason. Ferroelectr. Freq. Control 2009, 56, 2145–2156. [Google Scholar] [CrossRef] [PubMed]
- Behnamfar, P.; Mirabbasi, S. Design of a high-voltage analog frontend circuit for integration with CMUT arrays. In Proceedings of the Bi medical Circuits and Systems Conference (BioCAS), Paphos, Cyprus, 3–5 November 2010. [Google Scholar]
- Huang, X.; Cheong, J.H.; Cha, H.; Yu, H.; Je, M.; Yu, H. A highfrequency transimpedance amplifier for CMOS integrated 2D CMUT array towards 3D ultrasound imaging. In Proceedings of the 2013 35th Annual International Conference of the IEEE Engineering in Medicine and Biology Society (EMBC), Osaka, Japan, 3–7 July 2013; pp. 101–104. [Google Scholar]
- Du, Y.; He, C.; Hao, G.; Zhang, W.; Xue, C. Full-Differential Folded-Cascode Front-End Receiver Amplifier Integrated Circuit for Capacitive Micromachined Ultrasonic Transducers. Micromachines 2019, 10, 88. [Google Scholar] [CrossRef] [PubMed] [Green Version]
- Attarzadeh, H.; Xu, Y.; Ytterdal, T. A Low-Power High-Dynamic-Range Receiver System for In-Probe 3-D Ultrasonic Imaging. IEEE Trans. Biomed. Circuits Syst. 2017, 11, 1053–1064. [Google Scholar] [CrossRef] [PubMed]


| Parameter | Value |
|---|---|
| Transmitter’s current consumption | 9 µA (no load) |
| High oscillation frequency | 19.5 MHz |
| Low oscillation frequency | 25.67 kHz |
| Charge pump output voltage | 22 V |
| Charge pump power consumption | 439.2 nW during steady state (LF) |
| 35.09 µW during charge up (HF) | |
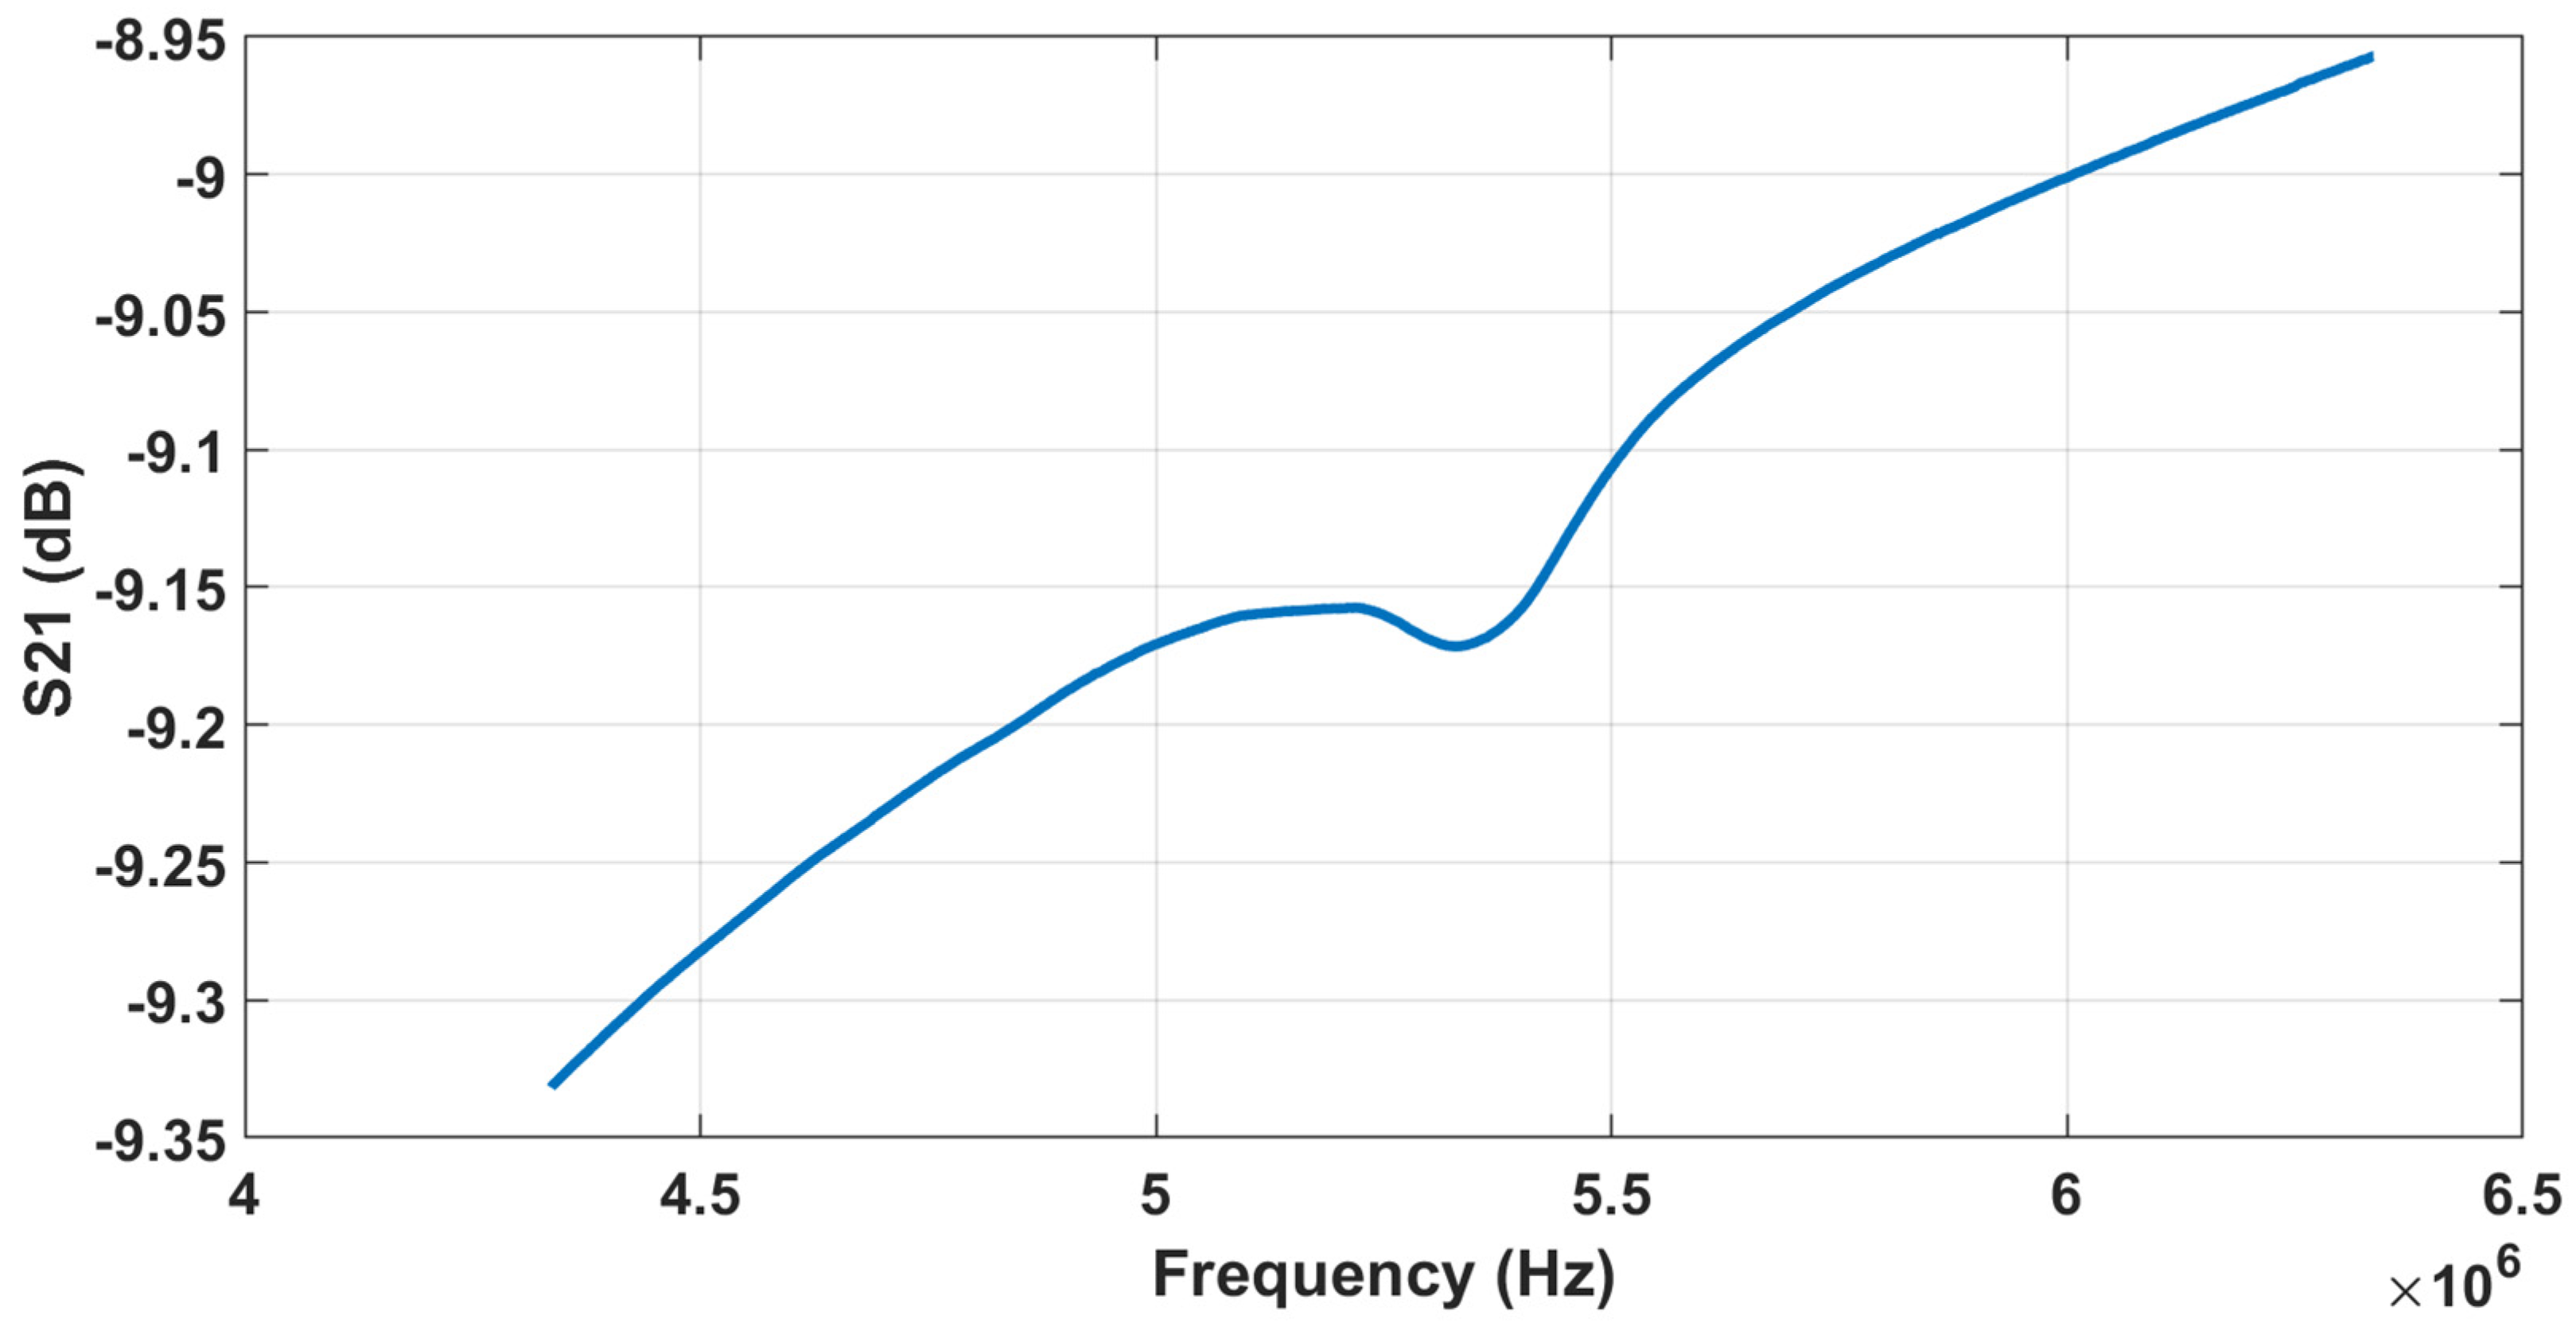
| Receiver’s bandwidth | 7 MHz |
| Receiver’s threshold | 40 mV |
| Receiver’s power consumption | 72 µW |
| Input-referred noise current | |
| Transimpedance gain | 120.2 dBΩ |
| Receiver’s input impedance ‡ | 619.205 Ω |
| Reference | Process (µm) | BW (MHz) | Power Consumption (mW) | Gain (dBΩ) | Input Resistance (kΩ) | Input Referred Noise Current |
|---|---|---|---|---|---|---|
| [25] | 0.065 | 10 | 150 | 107 | 2.15 | 0.28 |
| [26] | 0.8 | 9–11 | 3 | 72–90 | 1 | - |
| [27] | 0.18 | 75 | 0.48 | 61.18 | 310 | 16.8 |
| [28] | 0.18 | 2.76 | 11 | 65 | - | 5.6 × 10⁴ |
| [29] | 0.065 | 7.5 | 0.18 | 79–97 | - | 4.8 |
| This Work | 0.13 | 7 | 0.072 | 120.2 | 0.6192 | 3.2 |
Publisher’s Note: MDPI stays neutral with regard to jurisdictional claims in published maps and institutional affiliations. |
© 2022 by the authors. Licensee MDPI, Basel, Switzerland. This article is an open access article distributed under the terms and conditions of the Creative Commons Attribution (CC BY) license (https://creativecommons.org/licenses/by/4.0/).
Share and Cite
Bensalem, R.; Shovan, A.S.; Trudel, J.M.; Tawfik, H.H.; Allidina, K.; Elsayed, M.Y.; Boukadoum, M.; El-Gamal, M.N. Design of an Integrated Micro-Viscometer for Monitoring Engine Oil. Sensors 2022, 22, 5157. https://doi.org/10.3390/s22145157
Bensalem R, Shovan AS, Trudel JM, Tawfik HH, Allidina K, Elsayed MY, Boukadoum M, El-Gamal MN. Design of an Integrated Micro-Viscometer for Monitoring Engine Oil. Sensors. 2022; 22(14):5157. https://doi.org/10.3390/s22145157
Chicago/Turabian StyleBensalem, Roufaida, Animesh Saha Shovan, Juan Morency Trudel, Hani H. Tawfik, Karim Allidina, Mohannad Y. Elsayed, Mounir Boukadoum, and Mourad N. El-Gamal. 2022. "Design of an Integrated Micro-Viscometer for Monitoring Engine Oil" Sensors 22, no. 14: 5157. https://doi.org/10.3390/s22145157
APA StyleBensalem, R., Shovan, A. S., Trudel, J. M., Tawfik, H. H., Allidina, K., Elsayed, M. Y., Boukadoum, M., & El-Gamal, M. N. (2022). Design of an Integrated Micro-Viscometer for Monitoring Engine Oil. Sensors, 22(14), 5157. https://doi.org/10.3390/s22145157