
Form Factors as Potential Imaging Biomarkers to Differentiate Benign vs. Malignant Lung Lesions on CT Scans

 ,
,  , , ,
, , ,  ,
,  , , , and
Abstract
:1. Introduction
2. Materials and Methods
2.1. Study Population
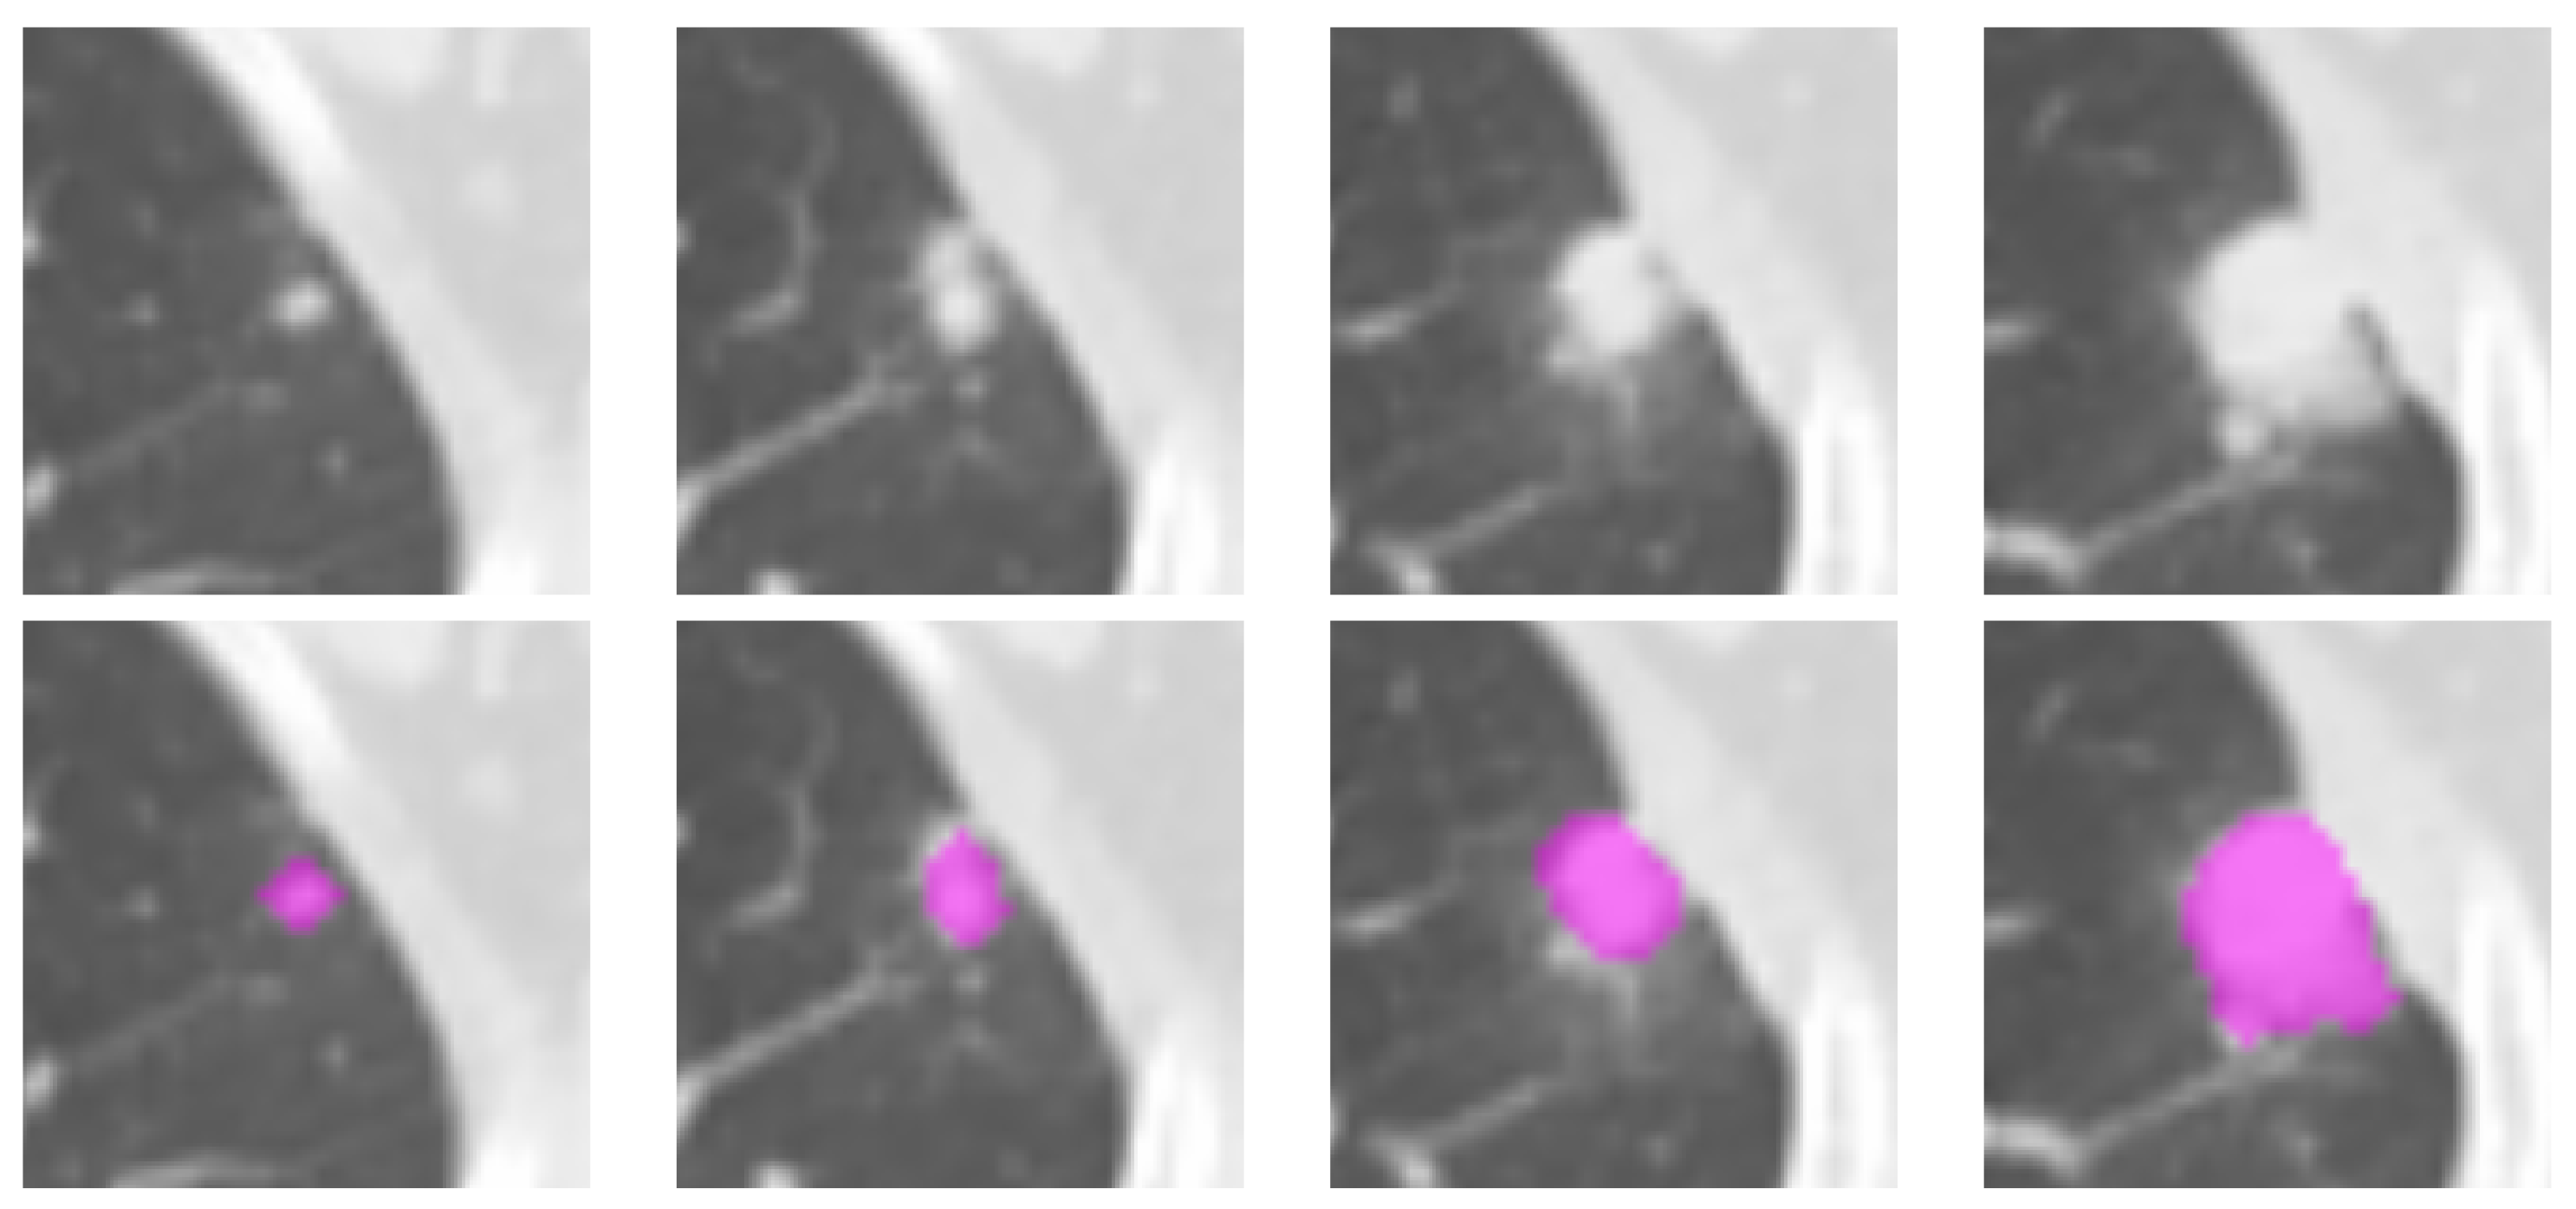
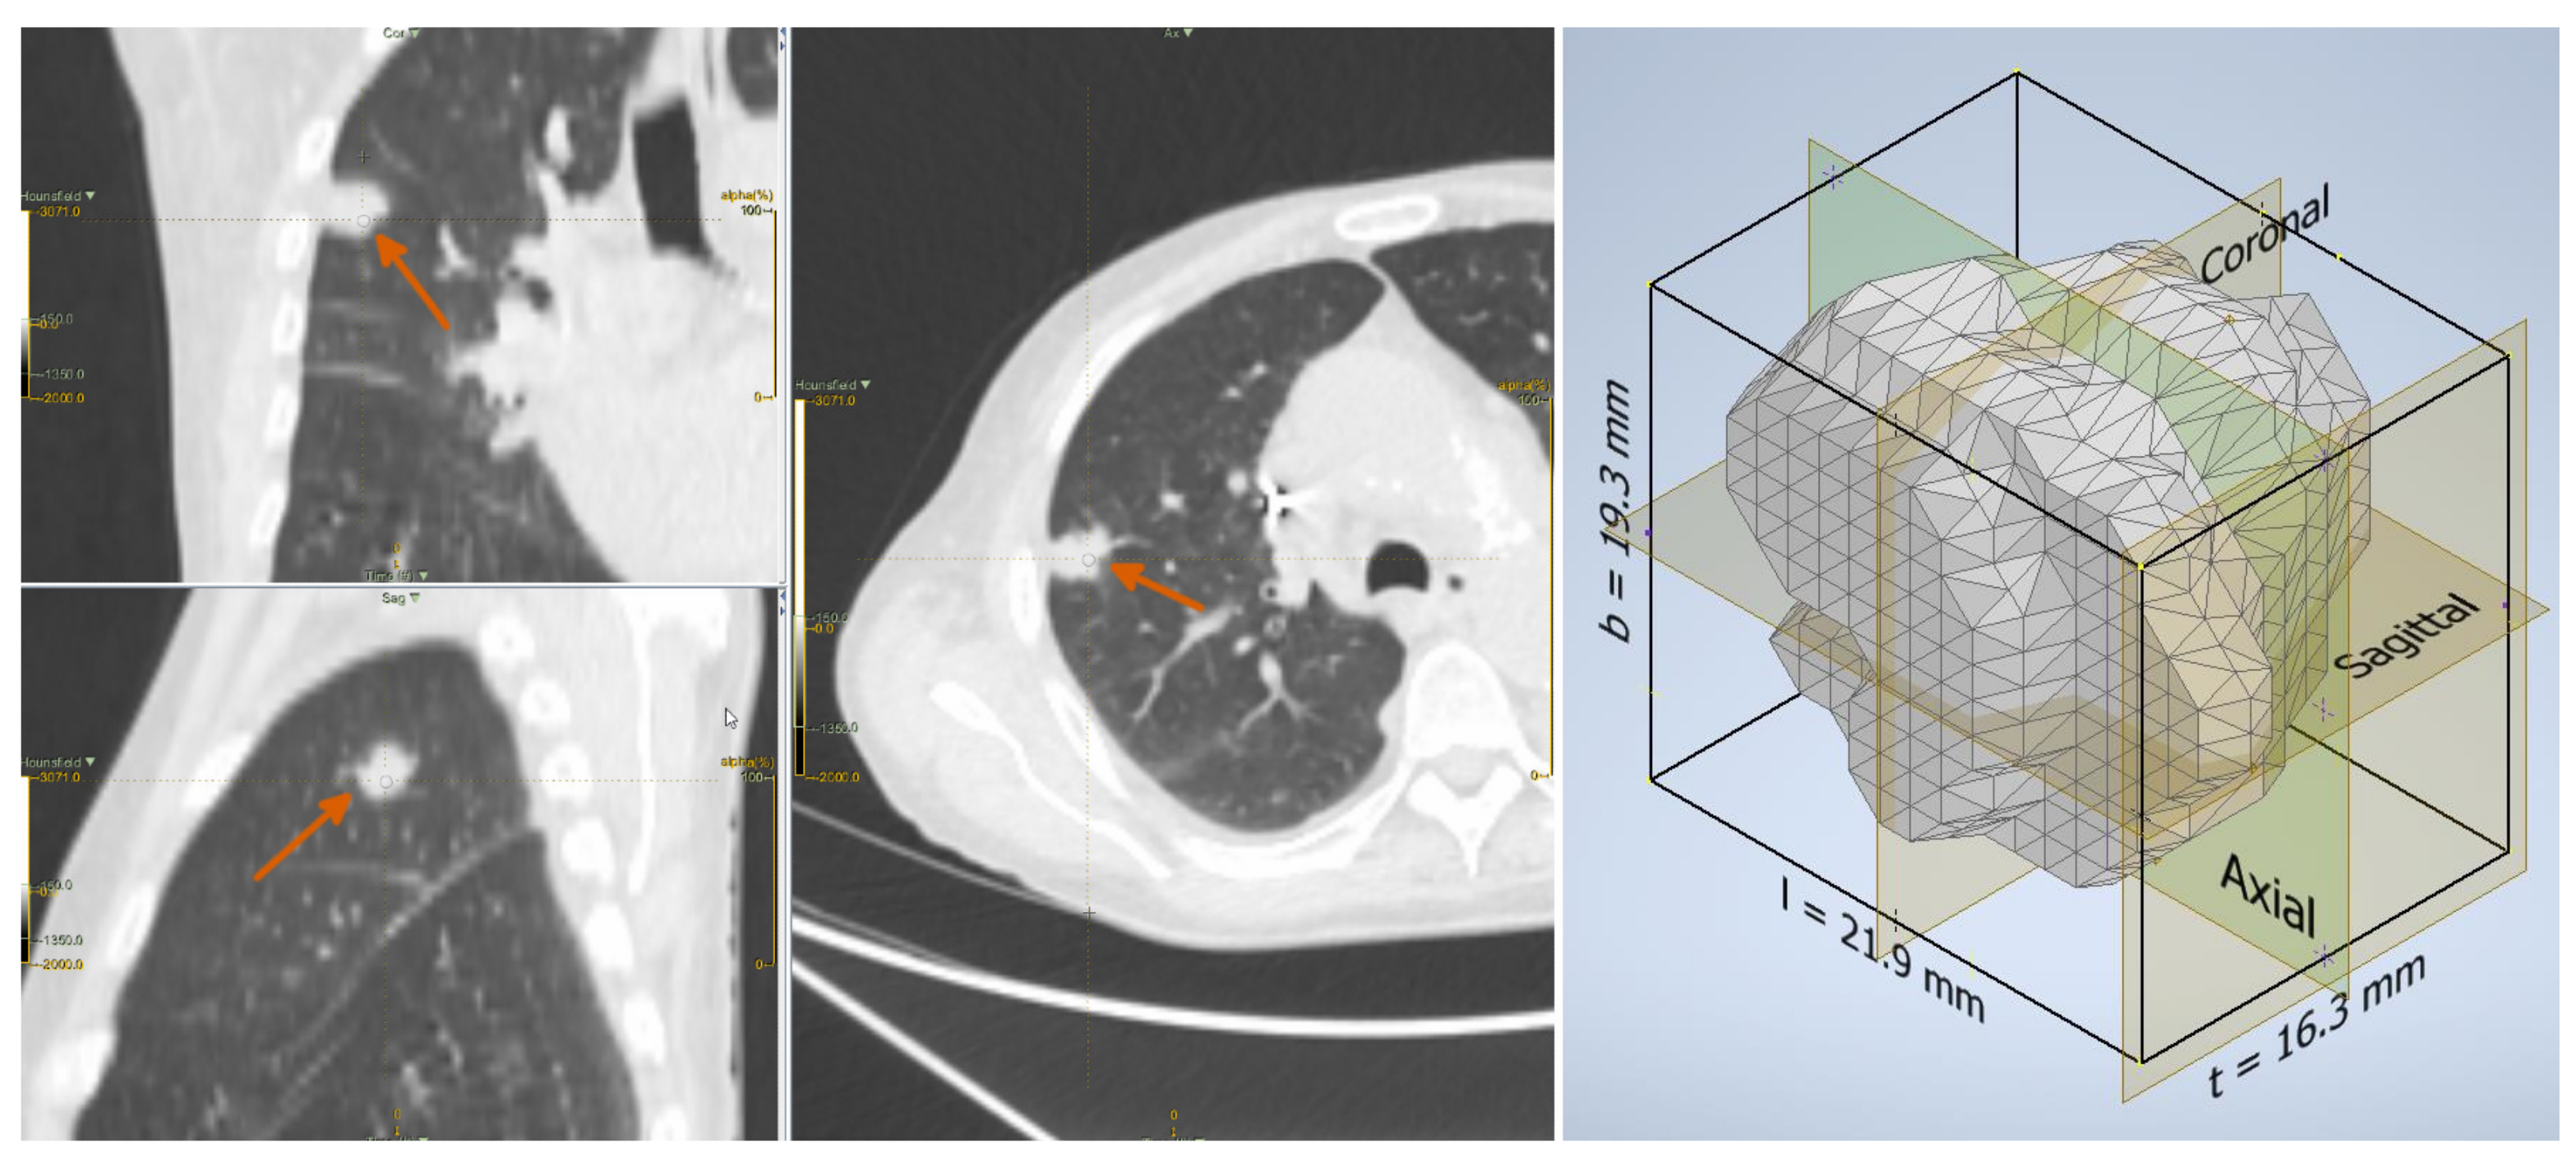
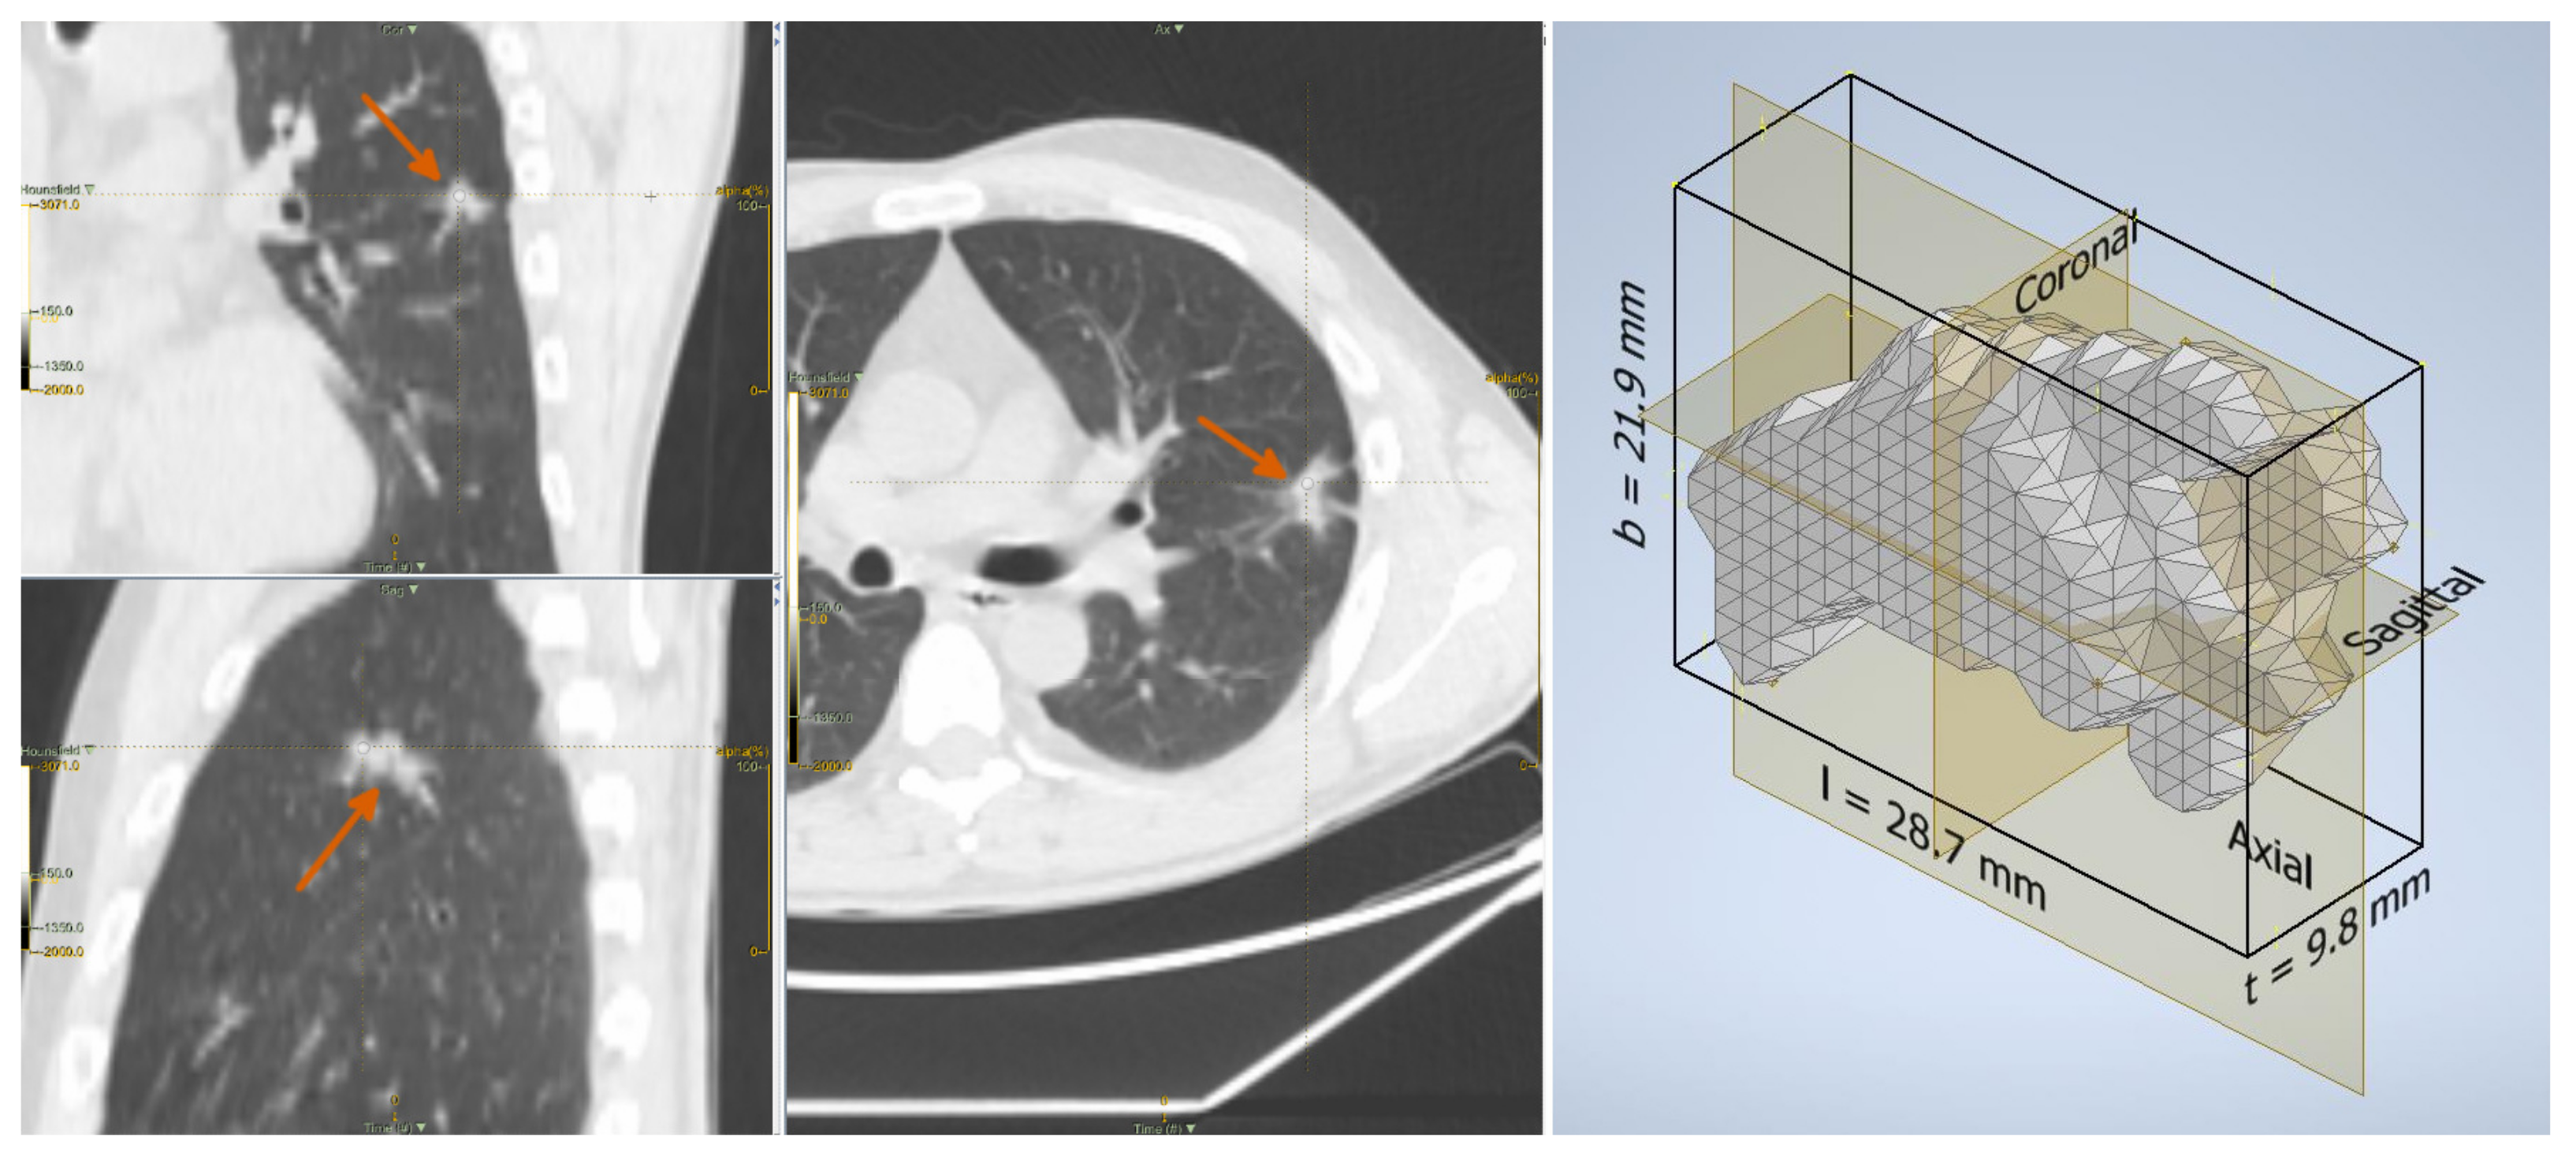
2.2. Lesion Delineation
2.3. Shape Features
2.4. Univariate Analysis
2.5. Multivariate Prediction Models
2.6. Estimation of the Cutoff Thresholds
3. Results
4. Discussion
5. Conclusions
6. Limitations and Future Work
Author Contributions
Funding
Institutional Review Board Statement
Informed Consent Statement
Data Availability Statement
Conflicts of Interest
Abbreviations
| ACO | Angelidakis compactness |
| AEL | Angelidakis elongation |
| AFL | Angelidakis flatness |
| CT | Computed Tomography |
| FDR | False discovery ratio |
| KEL | Kong elongation |
| KFL | Kong flatness |
| MPS | Maximum projection sphericity |
| NSCLC | Non-Small Cell Lung Cancer |
| PET | Positron Emission Tomography |
| ROI | Region(s) of interest |
| SCLC | Small Cell Lung Cancer |
| lSVM | Linear Support Vector Machines |
| TCIA | The Cancer Imaging Archive |
Appendix A. Shape Features
Appendix A.1. Conventional
Appendix A.1.1. Voxel Volume
Appendix A.1.2. Surface Area
Appendix A.1.3. Maximum 3D Diameter
Appendix A.2. Form Factors
Appendix A.3. Others
References
- World Health Organization. Cancer. 2021. Available online: https://www.who.int/news-room/fact-sheets/detail/cancer (accessed on 24 August 2021).
- American Cancer Society. Key Statistics for Lung Cancer. 2022. Available online: https://www.cancer.org/cancer/lung-cancer/about/key-statistics.html (accessed on 24 June 2022).
- Altavilla, G.; Di Maio, M. Polmone. In I Numeri del Cancro in Italia; Intermedia Editore: Brescia, Italy, 2022; Chapter 3.6; pp. 56–57. [Google Scholar]
- McWilliams, A.; Tammemagi, M.C.; Mayo, J.R.; Roberts, H.; Liu, G.; Soghrati, K.; Yasufuku, K.; Martel, S.; Laberge, F.; Gingras, M.; et al. Probability of cancer in pulmonary nodules detected on first screening CT. N. Engl. J. Med. 2013, 369, 910–919. [Google Scholar] [CrossRef] [PubMed] [Green Version]
- Edey, A.; Hansell, D. Incidentally detected small pulmonary nodules on CT. Clin. Radiol. 2009, 64, 872–884. [Google Scholar] [CrossRef] [PubMed]
- Chan, E.Y.; Gaur, P.; Ge, Y.; Kopas, L.; Santacruz, J.F.; Gupta, N.; Munden, R.F.; Cagle, P.T.; Kim, M.P. Management of the solitary pulmonary nodule. Arch. Pathol. Lab. Med. 2017, 141, 927–931. [Google Scholar] [CrossRef] [PubMed] [Green Version]
- MacMahon, H.; Naidich, D.P.; Goo, J.M.; Lee, K.S.; Leung, A.N.C.; Mayo, J.R.; Mehta, A.C.; Ohno, Y.; Powell, C.A.; Prokop, M.; et al. Guidelines for management of incidental pulmonary nodules detected on CT images: From the Fleischner Society 2017. Radiology 2017, 284, 228–243. [Google Scholar] [CrossRef] [PubMed] [Green Version]
- Huang, Y.; Liu, Z.; He, L.; Chen, X.; Pan, D.; Ma, Z.; Liang, C.; Tian, J.; Liang, C. Radiomics signature: A potential biomarker for the prediction of disease-free survival in early-stage (I or II) non-small cell lung cancer. Radiology 2016, 281, 947–957. [Google Scholar] [CrossRef] [PubMed]
- Bianconi, F.; Fravolini, M.; Bello-Cerezo, R.; Minestrini, M.; Scialpi, M.; Palumbo, B. Evaluation of shape and textural features from CT as prognostic biomarkers in non-small cell lung cancer. Anticancer Res. 2018, 38, 2155–2160. [Google Scholar]
- Thawani, R.; McLane, M.; Beig, N.; Ghose, S.; Prasanna, P.; Velcheti, V.; Madabhushi, A. Radiomics and radiogenomics in lung cancer: A review for the clinician. Lung Cancer 2018, 115, 34–41. [Google Scholar] [CrossRef]
- Kaseda, K. Recent and current advances in FDG-PET imaging within the field of Clinical Oncology in NSCLC: A review of the literature. Diagnostics 2020, 10, 561. [Google Scholar] [CrossRef]
- Bianconi, F.; Palumbo, I.; Spanu, A.; Nuvoli, S.; Fravolini, M.L.; Palumbo, B. PET/CT radiomics in lung cancer: An overview. Appl. Sci. 2020, 5, 1718. [Google Scholar] [CrossRef] [Green Version]
- Wu, Y.J.; Wu, F.Z.; Yang, S.C.; Tang, E.K.; Liang, C.H. Radiomics in Early Lung Cancer Diagnosis: From Diagnosis to Clinical Decision Support and Education. Diagnostics 2022, 12, 1064. [Google Scholar] [CrossRef]
- Mayerhoefer, M.; Materka, A.; Langs, G.; Häggström, I.; Szczypiński, P.; Gibbs, P.; Cook, G. Introduction to Radiomics. J. Nucl. Med. 2020, 61, 488–495. [Google Scholar] [CrossRef] [PubMed]
- Rizzo, S.; Botta, F.; Raimondi, S.; Origgi, D.; Fanciullo, C.; Morganti, A.G.; Bellomi, M. Radiomics: The facts and the challenges of image analysis. Eur. Radiol. Exp. 2018, 2, 36. [Google Scholar] [CrossRef] [PubMed]
- Oikonomou, A.; Khalvati, F.; Tyrrell, P.; Haider, M.; Tarique, U.; Jimenez-Juan, L.; Tjong, M.; Poon, I.; Eilaghi, A.; Ehrlich, L.; et al. Radiomics analysis at PET/CT contributes to prognosis of recurrence and survival in lung cancer treated with stereotactic body radiotherapy. Sci. Rep. 2018, 8, 4003. [Google Scholar] [CrossRef] [PubMed]
- Zhu, X.; Dong, D.; Chen, Z.; Fang, M.; Zhang, L.; Song, J.; Yu, D.; Zang, Y.; Liu, Z.; Shi, J.; et al. Radiomic signature as a diagnostic factor for histologic subtype classification of non-small cell lung cancer. Eur. Radiol. 2018, 28, 2772–2778. [Google Scholar] [CrossRef] [PubMed]
- Fornacon-Wood, I.; Faivre-Finn, C.; O’Connor, J.P.B.; Price, G.J. Radiomics as a personalized medicine tool in lung cancer: Separating the hope from the hype. Lung Cancer 2020, 146, 197–208. [Google Scholar] [CrossRef] [PubMed]
- Bianconi, F.; Palumbo, I.; Fravolini, M.; Chiari, R.; Minestrini, M.; Brunese, L.; Palumbo, B. Texture analysis on [18F]FDG PET/CT in non-small-cell lung cancer: Correlations between PET features, CT features, and histological types. Mol. Imaging Biol. 2019, 21, 1200–1209. [Google Scholar] [CrossRef]
- van Timmeren, J.E.; Cester, D.; Tanadini-Lang, S.; Alkadhi, H.; Baessler, B. Radiomics in medical imaging—“How-to” guide and critical reflection. Insights Imaging 2020, 11, 91. [Google Scholar] [CrossRef]
- Papadimitroulas, P.; Brocki, L.; Christopher Chung, N.; Marchadour, W.; Vermet, F.; Gaubert, L.; Eleftheriadis, V.; Plachouris, D.; Visvikis, D.; Kagadis, G.C.; et al. Artificial intelligence: Deep learning in oncological radiomics and challenges of interpretability and data harmonization. Phys. Med. 2021, 83, 108–121. [Google Scholar] [CrossRef]
- Ibrahim, A.; Primakov, S.; Beuque, M.; Woodruff, H.C.; Halilaj, I.; Wu, G.; Refaee, T.; Granzier, R.; Widaatalla, Y.; Hustinx, R.; et al. Radiomics for precision medicine: Current challenges, future prospects, and the proposal of a new framework. Methods 2021, 188, 20–29. [Google Scholar] [CrossRef]
- Chen, B.; Zhang, R.; Gan, Y.; Yang, L.; Li, W. Development and clinical application of radiomics in lung cancer. Radiat. Oncol. 2017, 12, 154. [Google Scholar] [CrossRef]
- Hosny, A.; Aerts, H.J.; Mak, R.H. Handcrafted versus deep learning radiomics for prediction of cancer therapy response. Lancet Digit. Health 2019, 1, e106–e107. [Google Scholar] [CrossRef] [Green Version]
- Riquelme, D.; Akhloufi, M.A. Deep learning for lung cancer nodules detection and classification in CT scans. AI 2020, 1, 28–67. [Google Scholar] [CrossRef] [Green Version]
- Bianconi, F.; Fravolini, M.; Palumbo, I.; Palumbo, B. Shape and texture analysis of radiomic data for Computer-assisted Diagnosis and prognostication: An overview. In Proceedings of the International Conference on Design Tools and Methods in Industrial Engineering (ADM), Modena, Italy, 9–10 September 2019; pp. 3–14. [Google Scholar]
- Bianconi, F.; Kather, J.; Reyes-Aldasoro, C. Evaluation of colour pre-processing on patch-based classification of H&E-stained images. In Proceedings of the 15th European Congress on Digital Pathology, ECDP 2019, Warwick, UK, 10–13 April 2019; Volume 11435, pp. 56–64. [Google Scholar]
- Linning, E.; Lu, L.; Li, L.; Yang, H.; Schwartz, L.H.; Zhao, B. Radiomics for Classifying Histological Subtypes of Lung Cancer Based on Multiphasic Contrast-Enhanced Computed Tomography. J. Comput. Assist. Tomogr. 2019, 43, 300–306. [Google Scholar]
- Kirienko, M.; Cozzi, L.; Rossi, A.; Voulaz, E.; Antunovic, L.; Fogliata, A.; Chiti, A.; Sollini, M. Ability of FDG PET and CT radiomics features to differentiate between primary and metastatic lung lesions. Eur. J. Nucl. Med. Mol. Imaging 2018, 45, 1649–1660. [Google Scholar] [CrossRef] [PubMed]
- Yan, M.; Wang, W. Development of a Radiomics Prediction Model for Histological Type Diagnosis in Solitary Pulmonary Nodules: The Combination of CT and FDG PET. Front. Oncol. 2020, 10, 555514. [Google Scholar] [CrossRef] [PubMed]
- Ferreira-Junior, J.R.; Koenigkam-Santos, M.; Magalhães Tenório, A.P.; Faleiros, M.C.; Garcia Cipriano, F.E.; Fabro, A.T.; Näppi, J.; Yoshida, H.; de Azevedo-Marques, P.M. CT-based radiomics for prediction of histologic subtype and metastatic disease in primary malignant lung neoplasms. Int. J. Comput. Assist. Radiol. Surg. 2020, 15, 163–172. [Google Scholar] [CrossRef]
- Shi, L.; He, Y.; Yuan, Z.; Benedict, S.; Valicenti, R.; Qiu, J.; Rong, Y. Radiomics for response and outcome assessment for non-small cell lung cancer. Technol. Cancer Res. Treat. 2018, 17, 1533033818782788. [Google Scholar] [CrossRef] [PubMed]
- Mu, W.; Qi, J.; Lu, H.; Schabath, M.; Balagurunathan, Y.; Tunali, I.; Gillies, R. Radiomic biomarkers from PET/CT multi-modality fusion images for the prediction of immunotherapy response in advanced non-small cell lung cancer patients. In Proceedings of the Medical Imaging 2018: Computer-Aided Diagnosis, Houston, TX, USA, 10–15 February 2018; Volume 10575, p. 105753S. [Google Scholar]
- Chetan, M.R.; Gleeson, F.V. Radiomics in predicting treatment response in non-small-cell lung cancer: Current status, challenges and future perspectives. Eur. Radiol. 2021, 31, 1049–1058. [Google Scholar] [CrossRef] [PubMed]
- Chang, R.; Qi, S.; Yue, Y.; Zhang, X.; Song, J.; Qian, W. Predictive Radiomic Models for the Chemotherapy Response in Non-Small-Cell Lung Cancer based on Computerized-Tomography Images. Front. Oncol. 2021, 11, 646190. [Google Scholar] [CrossRef]
- Li, R.; Peng, H.; Xue, T.; Li, J.; Ge, Y.; Wang, G.; Feng, F. Prediction and verification of survival in patients with non-small-cell lung cancer based on an integrated radiomics nomogram. Clin. Radiol. 2022, 77, e222–e230. [Google Scholar] [CrossRef]
- Sacconi, B.; Anzidei, M.; Leonardi, A.; Boni, F.; Saba, L.; Scipione, R.; Anile, M.; Rengo, M.; Longo, F.; Bezzi, M.; et al. Analysis of CT features and quantitative texture analysis in patients with lung adenocarcinoma: A correlation with EGFR mutations and survival rates. Clin. Radiol. 2017, 72, 443–450. [Google Scholar] [CrossRef] [PubMed]
- Nguyen Ho, L.; Le, T.V. Model for predicting EGFR mutation status in lung cancer. Breathe 2019, 15, 340–342. [Google Scholar] [CrossRef] [PubMed] [Green Version]
- Han, F.; Wang, H.; Zhang, G.; Han, H.; Song, B.; Li, L.; Moore, W.; Lu, H.; Zhao, H.; Liang, Z. Texture feature analysis for computer-aided diagnosis on pulmonary nodules. J. Digit. Imaging 2014, 28, 99–115. [Google Scholar] [CrossRef]
- Suo, S.; Cheng, J.; Cao, M.; Lu, Q.; Yin, Y.; Xu, J.; Wu, H. Assessment of heterogeneity difference between edge and core by using texture analysis: Differentiation of malignant from inflammatory pulmonary nodules and masses. Acad. Radiol. 2016, 23, 1115–1122. [Google Scholar] [CrossRef]
- Dennie, C.; Thornhill, R.; Sethi-Virmani, V.; Souza, C.A.; Bayanati, H.; Gupta, A.; Maziak, D. Role of quantitative computed tomography texture analysis in the differentiation of primary lung cancer and granulomatous nodules. Quant. Imaging Med. Surg. 2016, 6, 6–15. [Google Scholar]
- Song, Q.Z.; Zhao, L.; Luo, X.K.; Dou, X.C. Using Deep Learning for classification of lung nodules on computed tomography images. J. Healthc. Eng. 2017, 2017, 8314740. [Google Scholar] [CrossRef] [PubMed] [Green Version]
- Wilson, R.; Devaraj, A. Radiomics of pulmonary nodules and lung cancer. Transl. Lung Cancer Res. 2017, 6, 86–91. [Google Scholar] [CrossRef] [Green Version]
- Ferreira, J.R., Jr.; Oliveira, M.C.; de Azevedo-Marques, P.M. Characterization of pulmonary nodules based on features of margin sharpness and texture. J. Digit. Imaging 2018, 31, 451–463. [Google Scholar] [CrossRef] [PubMed]
- Causey, J.L.; Zhang, J.; Ma, S.; Jiang, B.; Qualls, J.A.; Politte, D.G.; Prior, F.; Zhang, S.; Huang, X. Highly accurate model for prediction of lung nodule malignancy with CT scans. Sci. Rep. 2018, 8, 9286. [Google Scholar] [CrossRef]
- Balagurunathan, Y.; Schabath, M.B.; Wang, H.; Liu, Y.; Gillies, R.J. Quantitative imaging features improve discrimination of malignancy in pulmonary nodules. Sci. Rep. 2019, 9, 8528. [Google Scholar] [CrossRef] [Green Version]
- Nasrullah, N.; Sang, J.; Alam, M.S.; Mateen, M.; Cai, B.; Hu, H. Automated lung nodule detection and classification using deep learning combined with multiple strategies. Sensors 2019, 19, 3722. [Google Scholar] [CrossRef] [PubMed] [Green Version]
- Wu, W.; Hu, H.; Gong, J.; Li, X.; Huang, G.; Nie, S. Malignant-benign classification of pulmonary nodules based on random forest aided by clustering analysis. Phys. Med. Biol. 2019, 64, 035017. [Google Scholar] [CrossRef] [PubMed]
- Wu, W.; Pierce, L.; Zhang, Y.; Pipavath, S.; Randolph, T.; Lastwika, K.; Lampe, P.; Houghton, A.; Liu, H.; Xia, L.; et al. Comparison of prediction models with radiological semantic features and radiomics in lung cancer diagnosis of the pulmonary nodules: A case-control study. Eur. Radiol. 2019, 29, 6100–6108. [Google Scholar] [CrossRef] [PubMed]
- Gao, N.; Tian, S.; Li, X.; Huang, J.; Wang, J.; Chen, S.; Ma, Y.; Liu, X.; Guo, X. Three-dimensional texture feature analysis of pulmonary nodules in CT images: Lung cancer predictive models based on support vector machine classifier. J. Digit. Imaging 2019, 33, 414–422. [Google Scholar] [CrossRef] [PubMed]
- Palumbo, B.; Bianconi, F.; Palumbo, I.; Fravolini, M.L.; Minestrini, M.; Nuvoli, S.; Stazza, M.L.; Rondini, M.; Spanu, A. Value of shape and texture features from 18F-FDG PET/CT to discriminate between benign and malignant solitary pulmonary nodules: An experimental evaluation. Diagnostics 2020, 10, 696. [Google Scholar] [CrossRef]
- Astaraki, M.; Zakko, Y.; Toma Dasu, I.; Smedby, O.; Wang, C. Benign-malignant pulmonary nodule classification in low-dose CT with convolutional features. Phys. Med. 2021, 83, 146–153. [Google Scholar] [CrossRef]
- Rundo, L.; Ledda, R.E.; di Noia, C.; Sala, E.; Mauri, G.; Milanese, G.; Sverzellati, N.; Apolone, G.; Gilardi, M.C.; Messa, M.C.; et al. A low-dose CT-based radiomic model to improve characterization and screening recall intervals of indeterminate prevalent pulmonary nodules. Diagnostics 2021, 11, 1610. [Google Scholar] [CrossRef]
- Jing, R.; Wang, J.; Li, J.; Wang, X.; Li, B.; Xue, F.; Shao, G.; Xue, H. A wavelet features derived radiomics nomogram for prediction of malignant and benign early-stage lung nodules. Sci. Rep. 2021, 11, 22330. [Google Scholar] [CrossRef]
- Dhara, A.K.; Mukhopadhyay, S.; Dutta, A.; Garg, M.; Khandelwal, N. A Combination of shape and texture features for classification of pulmonary nodules in lung CT Images. J. Digit. Imaging 2016, 29, 466–475. [Google Scholar] [CrossRef] [Green Version]
- Fornacon-Wood, I.; Mistry, H.; Ackermann, C.J.; Blackhall, F.; McPartlin, A.; Faivre-Finn, C.; Price, G.J.; O’Connor, J.P.B. Reliability and prognostic value of radiomic features are highly dependent on choice of feature extraction platform. Eur. Radiol. 2020, 30, 6241–6250. [Google Scholar] [CrossRef]
- Bianconi, F.; Fravolini, M.; Palumbo, I.; Pascoletti, G.; Nuvoli, S.; Rondini, M.; Spanu, A.; Palumbo, B. Impact of lesion delineation and intensity quantisation on the stability of texture features from lung nodules on CT: A reproducible study. Diagnostics 2021, 11, 1224. [Google Scholar] [CrossRef] [PubMed]
- He, X.; Sahiner, B.; Gallas, B.D.; Chen, W.; Petrick, N. Computerized characterization of lung nodule subtlety using thoracic CT images. Phys. Med. Biol. 2014, 59, 897–910. [Google Scholar] [CrossRef] [PubMed]
- Wang, J.; Liu, X.; Dong, D.; Song, J.; Xu, M.; Zang, Y.; Tian, J. Prediction of malignant and benign of lung tumor using a quantitative radiomic method. In Proceedings of the Annual International Conference of the IEEE Engineering in Medicine and Biology Society (EMBS), Orlando, FL, USA, 16–20 August 2016; pp. 1272–1275. [Google Scholar]
- Limkin, E.J.; Reuzé, S.; Carré, A.; Sun, R.; Schernberg, A.; Alexis, A.; Deutsch, E.; Ferté, C.; Robert, C. The complexity of tumor shape, spiculatedness, correlates with tumor radiomic shape features. Sci. Rep. 2019, 9, 4329. [Google Scholar] [CrossRef] [PubMed] [Green Version]
- Angelidakis, V.; Nadimi, S.; Utili, S. Elongation, flatness and compactness indices to characterise particle form. Powder Technol. 2022, 396, 689–695. [Google Scholar] [CrossRef]
- Armato, S.G., III; Drukker, K.; Li, F.; Hadjiiski, L.; Tourassi, G.D.; Engelmann, R.M.; Giger, M.L.; Redmond, G.; Farahani, K.; Kirby, J.S.; et al. LUNGx Challenge for computerized lung nodule classification. J. Med. Imaging 2016, 3, 044506. [Google Scholar] [CrossRef]
- Clark, K.; Vendt, B.; Smith, K.; Freymann, J.; Kirby, J.; Koppel, P.; Moore, S.; Phillips, S.; Maffitt, D.; Pringle, M.; et al. The cancer imaging archive (TCIA): Maintaining and operating a public information repository. J. Digit. Imaging 2013, 26, 1045–1057. [Google Scholar] [CrossRef] [Green Version]
- The Cancer Imaging Archive (TCIA). Available online: http://www.cancerimagingarchive.net/ (accessed on 30 November 2021).
- Nioche, C.; Orlhac, F.; Boughdad, S.; Reuze, S.; Goya-Outi, J.; Robert, C.; Pellot-Barakat, C.; Soussan, M.; Frouin, F.E.; Buvat, I. LIFEx: A freeware for radiomic feature calculation in multimodality imaging to accelerate advances in the characterization of tumor heterogeneity. Cancer Res. 2018, 78, 4786–4789. [Google Scholar] [CrossRef] [Green Version]
- Mann, H.B.; Whitney, D.R. On a test of whether one of two random variables is stochastically larger than the other. Ann. Math. Stat. 1947, 18, 50–60. [Google Scholar] [CrossRef]
- Lee, S.; Lee, D.K. What is the proper way to apply the multiple comparison test? Korean J. Anesthesiol. 2018, 71, 353–360. [Google Scholar] [CrossRef] [PubMed] [Green Version]
- Zhao, L.; Tong, L.; Lin, J.; Tang, K.; Zheng, S.S.; Li, W.F.; Cheng, D.; Yin, W.W.; Zheng, X.W. Characterization of solitary pulmonary nodules with 18F-FDG PET/CT relative activity distribution analysis. Eur. Radiol. 2015, 25, 1837–1844. [Google Scholar] [CrossRef]
- Larici, A.R.; Farchione, A.; Franchi, P.; Ciliberto, M.; Cicchetti, G.; Calandriello, L.; del Ciello, A.; Bonomo, L. Lung nodules: Size still matters. Eur. Respir. Rev. 2017, 26, 170025. [Google Scholar] [CrossRef] [PubMed]
- Evangelista, L.; Cuocolo, A.; Pace, L.; Mansi, L.; Del Vecchio, S.; Miletto, P.; Sanfilippo, S.; Pellegrino, S.; Guerra, L.; Pepe, G.; et al. Performance of FDG-PET/CT in solitary pulmonary nodule based on pre-test likelihood of malignancy: Results from the ITALIAN retrospective multicenter trial. Eur. J. Nucl. Med. Mol. Imaging 2018, 11, 1898–1907. [Google Scholar] [CrossRef]
- Taralli, S.; Scolozzi, V.; Foti, M.; Ricciardi, S.; Forcione, A.R.; Cardillo, G.; Calcagni, M.L. 18F-FDG PET/CT diagnostic performance in solitary and multiple pulmonary nodules detected in patients with previous cancer history: Reports of 182 nodules. Eur. J. Nucl. Med. Mol. Imaging 2019, 46, 429–436. [Google Scholar] [CrossRef] [PubMed]
- Armato, S.G.; Hadjiiski, L.; Tourassi, G.D.; Drukker, K.; Giger, M.L.; Li, F.; Redmond, G.; Farahani, K.; Kirby, J.S.; Clarke, L.P. Special Section Guest Editorial: LUNGx Challenge for computerized lung nodule classification: Reflections and lessons learned. J. Med. Imaging 2015, 2, 20103. [Google Scholar] [CrossRef] [Green Version]
- Truong, M.T.; Ko, J.P.; Rossi, S.E.; Rossi, I.; Viswanathan, C.; Bruzzi, J.F.; Marom, E.M.; Erasmus, J.J. Update in the evaluation of the solitary pulmonary nodule. Radiographics 2014, 34, 1658–1679. [Google Scholar] [CrossRef] [Green Version]
- Takashima, S.; Sone, S.; Li, F.; Maruyama, Y.; Hasegawa, M.; Matsushita, T.; Takayama, F.; Kadoya, M. Small solitary pulmonary nodules (<1 cm) detected at population-based CT screening for lung cancer: Reliable high-resolution CT features of benign lesions. Am. J. Roentgenol. 2003, 180, 955–964. [Google Scholar]
- Peikert, T.; Duan, F.; Rajagopalan, S.; Karwoski, R.A.; Clay, R.; Robb, R.; Qin, Z.; Sicks, J.; Bartholmai, B.J.; Maldonado, F. Novel high-resolution computed tomography-based radiomic classifier for screen-identified pulmonary nodules in the National Lung Screening Trial. PLoS ONE 2018, 13, e0196910. [Google Scholar] [CrossRef] [PubMed]
- Kong, D.; Fonseca, J. Quantification of the morphology of shelly carbonate sands using 3D images. Geotechnique 2018, 68, 249–261. [Google Scholar] [CrossRef] [Green Version]
- Blott, S.J.; Pye, K. Particle shape: A review and new methods of characterization and classification. Sedimentology 2008, 55, 31–63. [Google Scholar] [CrossRef]
- Benn, D.I.; Ballantyne, C.K. The description and representation of particle shape. Earth Surf. Process. Landf. 1993, 18, 665–672. [Google Scholar] [CrossRef]


| Attribute [Data Format] | Value |
|---|---|
| Demographics | |
| Age [Mean ± SD] | 68.3 ± 8.9 year |
| Female [N (%)] | 45 (41.3) |
| Male [N (%)] | 64 (58.7) |
| Histology | |
| Benign [N (%)] | 38 (34.9) |
| Malignant [N (%)] | 71 (65.1) |
| Adenocarcinoma [N (%)] | 45 (41.3) |
| Atypical carcinoid (NSCLC) [N (%)] | 1 (0.9) |
| Metastasis [N (%)] | 1 (0.9) |
| Neuroendocrine tumour [N (%)] | 1 (0.9) |
| Small-cell lung cancer [N (%)] | 2 (1.8) |
| Spinocellular carcinoma [N (%)] | 4 (3.7) |
| Squamous cell carcinoma [N (%)] | 9 (8.3) |
| Unspecified [N (%)] | 8 (7.3) |
| Attribute [Data Format] | Value |
|---|---|
| Demographics | |
| Age [Mean ± SD] | 60.2 ± 13.4 year |
| Female [N (%)] | 42 |
| Male [N (%)] | 28 |
| Histology | |
| Benign [N (%)] | 42 (50.6) |
| Malignant [N (%)] | 41 (49.4) |
| Adenocarcinoma [N (%)] | 17 (20.5) |
| Carcinoid tumour [N (%)] | 2 (2.4) |
| Small-cell lung cancer [N (%)] | 9 (10.8) |
| Squamous cell carcinoma [N (%)] | 1 (1.2) |
| Suspicious lung cancer [N (%)] | 2 (2.4) |
| Unspecified NSCLC [N (%)] | 10 (12.0) |
| Group | Name | Acronym/Abbreviation |
|---|---|---|
| Conventional | Maximum 3D diameter | Max3Ddiam |
| Surface area | SurfArea | |
| Voxel volume | Volume | |
| Form factors | Angelidakis elongation | AEL |
| Angelidakis flatness | AFL | |
| Angelidakis compactness | ACO | |
| Kong elongation | KEL | |
| Kong flatness | KFL | |
| Maximum projection sphericity | MPS | |
| Other | Sphericity | - |
| Volume density | VDN |
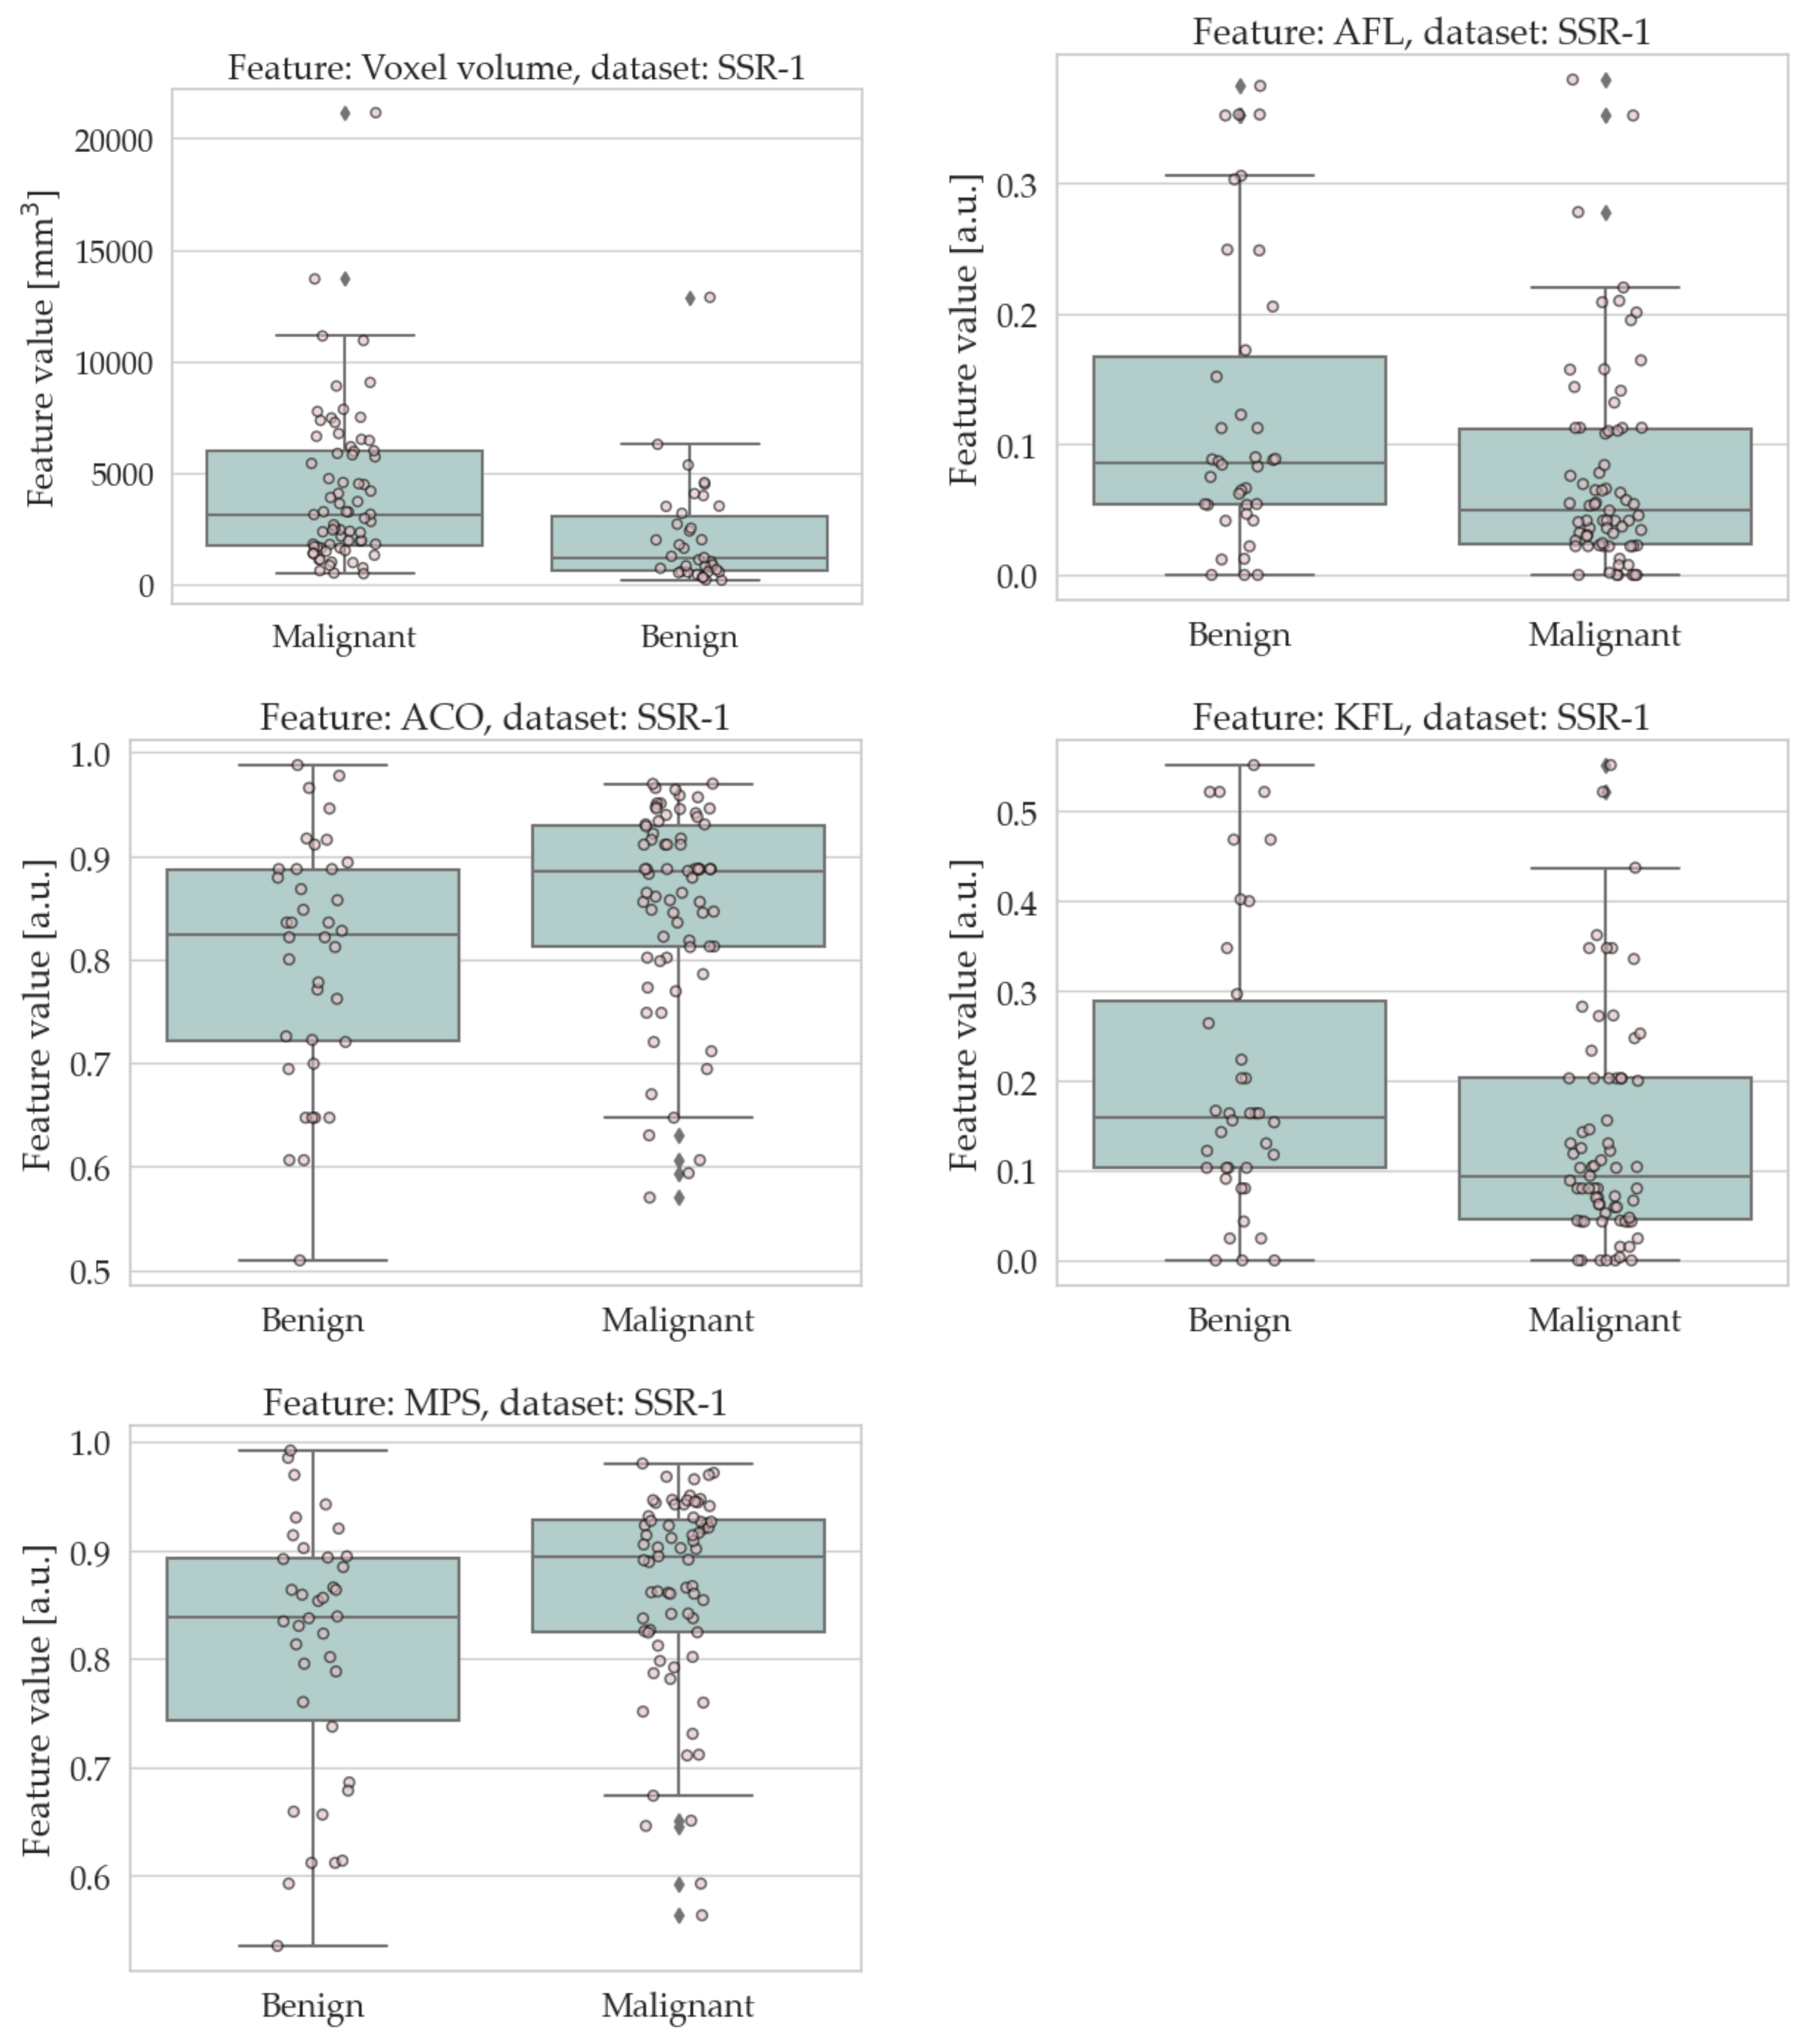
| Feature | Benign | Malignant | p-Value | Significant |
|---|---|---|---|---|
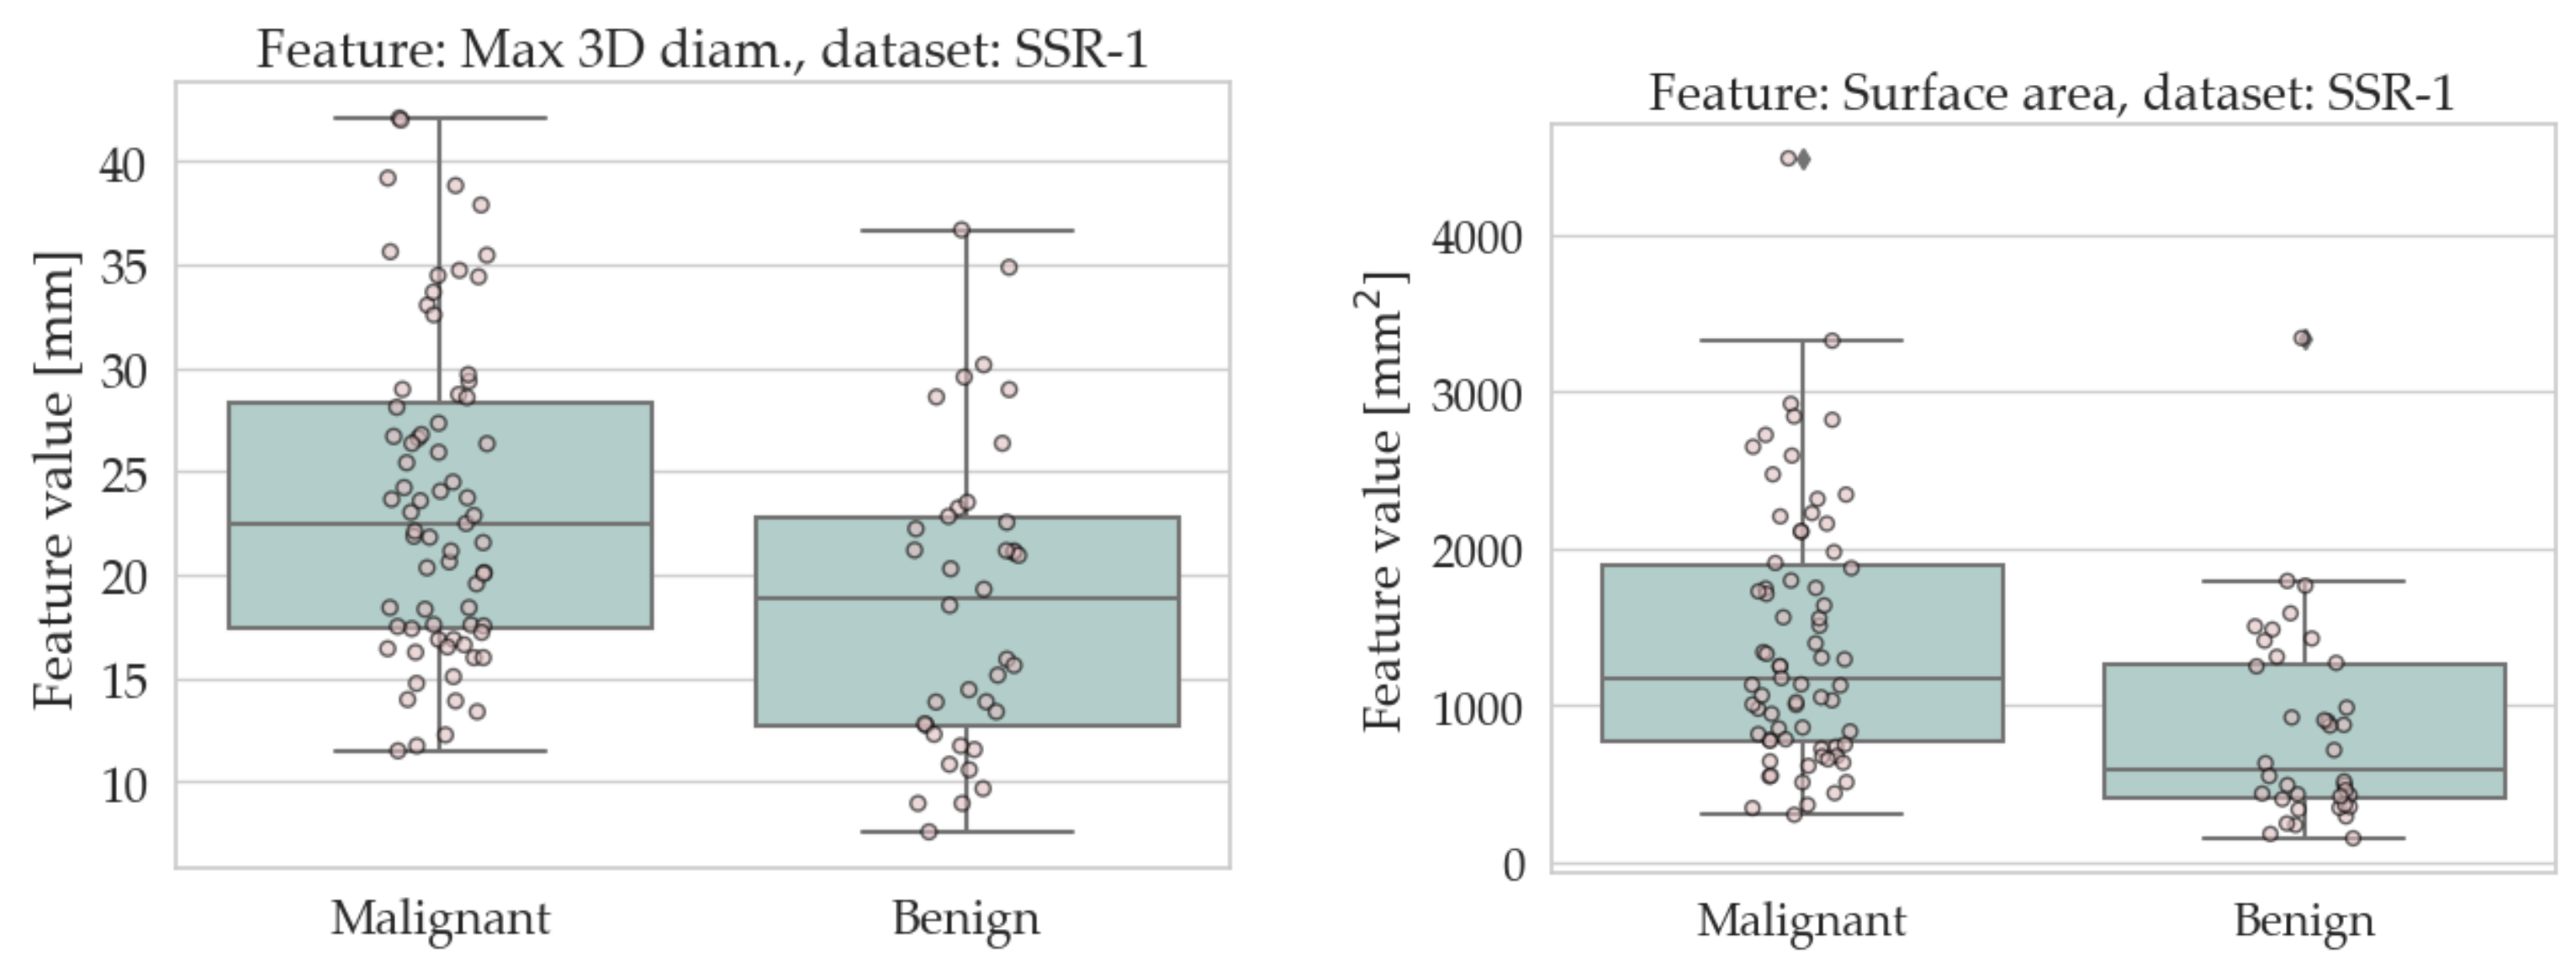
| Max 3D diameter | 18.8 ± 7.4 | 23.6 ± 7.7 | 0.001 | Yes |
| Surface area | 846.7 ± 630.3 | 1414.4 ± 819.6 | <0.001 | Yes |
| Voxel volume | 2138.1 ± 2369.2 | 4209.2 ± 3481.3 | <0.001 | Yes |
| Angelidakis elongation | 0.077 ± 0.056 | 0.070 ± 0.059 | 0.193 | No |
| Angelidakis flatness | 0.123 ± 0.111 | 0.077 ± 0.079 | 0.009 | Yes |
| Angelidakis compactness | 0.800 ± 0.115 | 0.853 ± 0.097 | 0.008 | Yes |
| Kong elongation | 0.140 ± 0.096 | 0.126 ± 0.099 | 0.200 | No |
| Kong flatness | 0.205 ± 0.163 | 0.136 ± 0.124 | 0.010 | Yes |
| Maximum projection sphericity | 0.810 ± 0.117 | 0.864 ± 0.092 | 0.005 | Yes |
| Sphericity | 0.774 ± 0.067 | 0.769 ± 0.061 | 0.280 | No |
| Volume density | 0.435 ± 0.112 | 0.431 ± 0.097 | 0.274 | No |
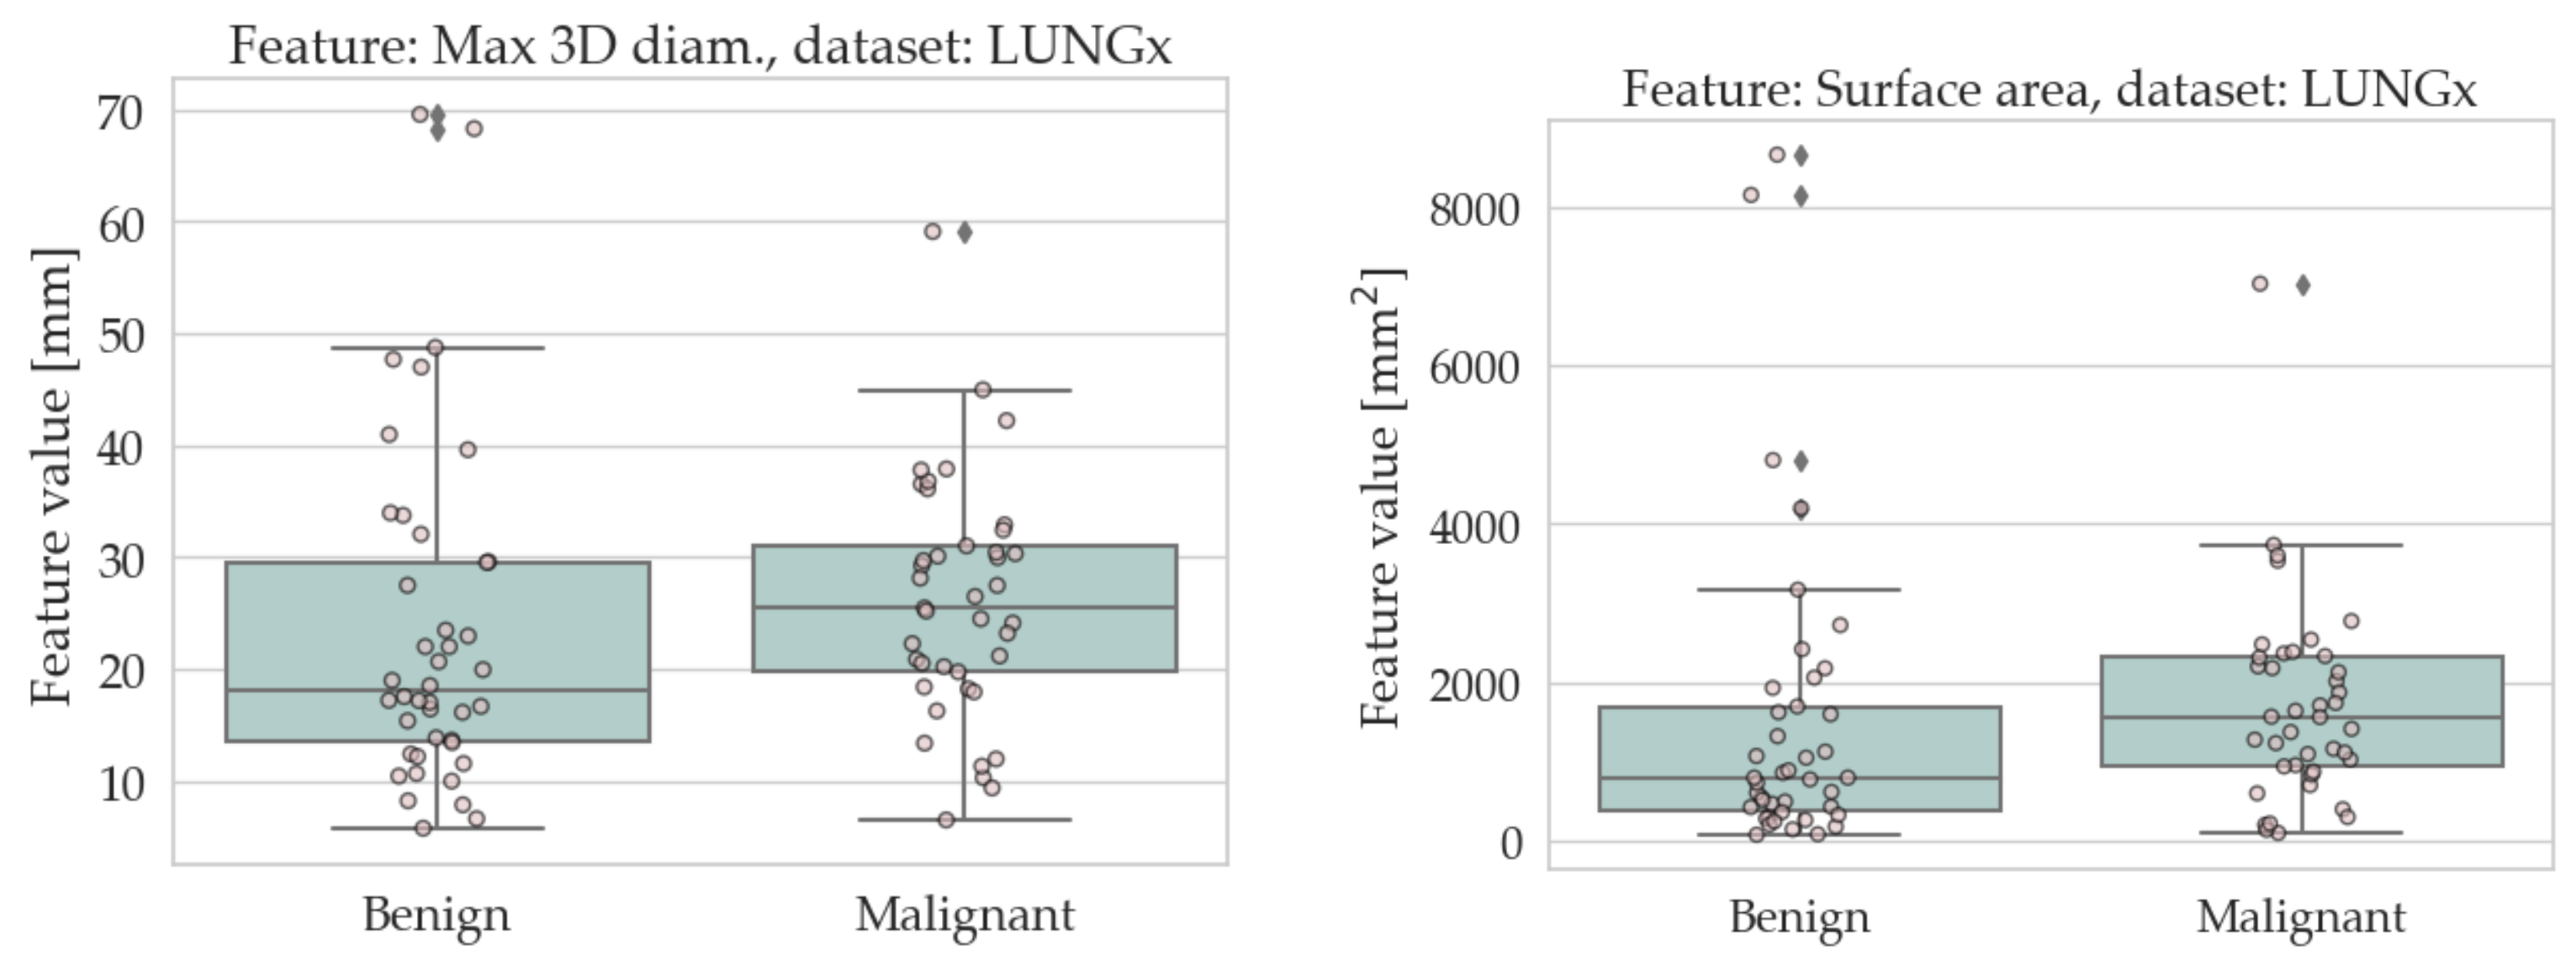
| Feature | Benign | Malignant | p-Value | Significant |
|---|---|---|---|---|
| Max 3D diameter | 23.5 ± 15.1 | 26.1 ± 10.4 | 0.029 | No |
| Surface area | 1457.2 ± 1882.1 | 1698.9 ± 1252.6 | 0.012 | Yes |
| Voxel volume | 2782.5 ± 4550.9 | 3436.0 ± 3432.3 | 0.011 | Yes |
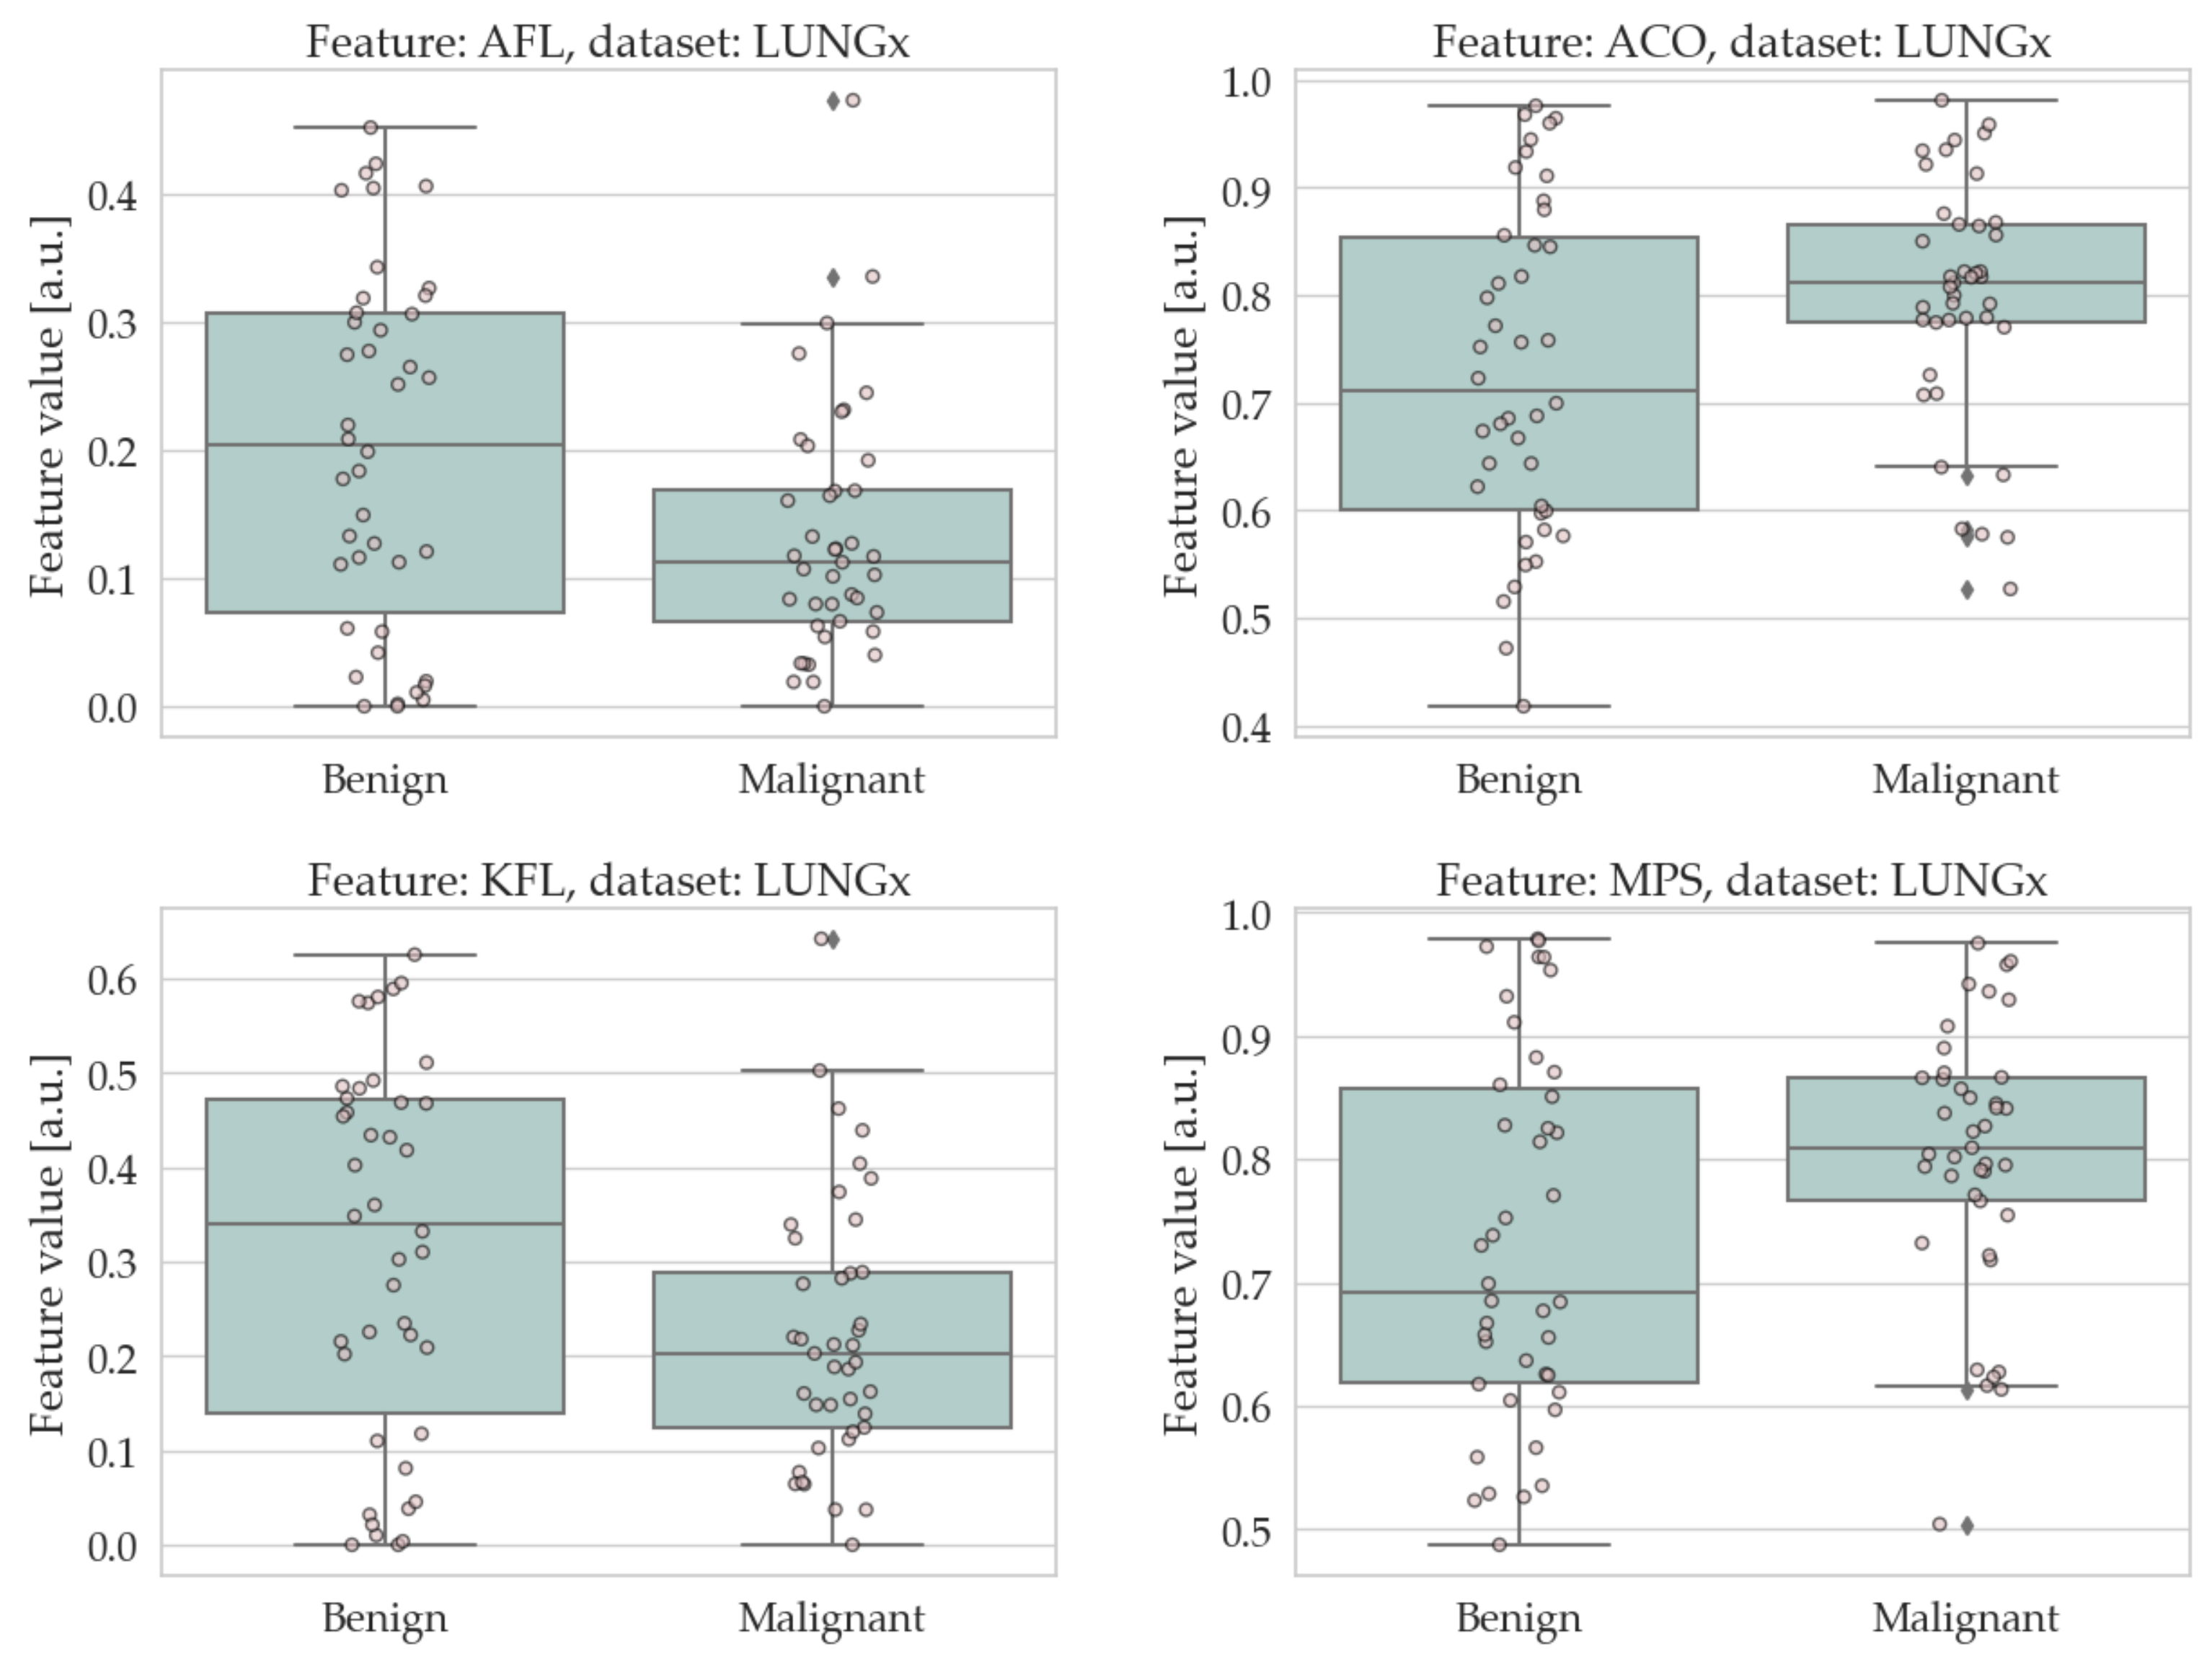
| Angelidakis elongation | 0.070 ± 0.078 | 0.069 ± 0.059 | 0.334 | No |
| Angelidakis flatness | 0.201 ± 0.139 | 0.132 ± 0.096 | 0.015 | Yes |
| Angelidakis compactness | 0.730 ± 0.152 | 0.799 ± 0.110 | 0.017 | Yes |
| Kong elongation | 0.127 ± 0.126 | 0.126 ± 0.103 | 0.382 | No |
| Kong flatness | 0.315 ± 0.198 | 0.224 ± 0.139 | 0.014 | Yes |
| Maximum projection sphericity | 0.734 ± 0.148 | 0.803 ± 0.105 | 0.019 | Yes |
| Sphericity | 0.662 ± 0.129 | 0.625 ± 0.087 | 0.036 | No |
| Volume density | 0.359 ± 0.096 | 0.339 ± 0.071 | 0.047 | No |
| Training Set | Test Set | Accuracy (Base) [% (Fraction)] | Accuracy (Extended) [% (Fraction)] | Gain [pp (Fraction)] |
|---|---|---|---|---|
| SSR-1 | SSR-1 | 65.1 (71/109) | 66.1 (72/109) | 0.9 (1/109) |
| LUNGx | LUNGx | 54.2 (45/83) | 62.7 (52/83) | 8.4 (7/83) |
| SSR-1 | LUNGx | 49.4 (41/83) | 63.8 (53/83) | 14.5 (12/83) |
| LUNGx | SSR-1 | 57.8 (63/109) | 63.9 (71/109) | 7.3 (8/109) |
| Feature | Dataset | Avg. over Datasets | ||
|---|---|---|---|---|
| SSR-1 | LUNGx | SSR-1 + LUNGx | ||
| ACO | >0.746 | >0.765 | >0.769 | >0.760 |
| AFL | <0.245 | <0.248 | <0.248 | <0.246 |
| KFL | <0.368 | <0.415 | <0.396 | <0.393 |
| MPS | >0.697 | >0.701 | >0.706 | >0.701 |
Publisher’s Note: MDPI stays neutral with regard to jurisdictional claims in published maps and institutional affiliations. |
© 2022 by the authors. Licensee MDPI, Basel, Switzerland. This article is an open access article distributed under the terms and conditions of the Creative Commons Attribution (CC BY) license (https://creativecommons.org/licenses/by/4.0/).
Share and Cite
Bianconi, F.; Palumbo, I.; Fravolini, M.L.; Rondini, M.; Minestrini, M.; Pascoletti, G.; Nuvoli, S.; Spanu, A.; Scialpi, M.; Aristei, C.; et al. Form Factors as Potential Imaging Biomarkers to Differentiate Benign vs. Malignant Lung Lesions on CT Scans. Sensors 2022, 22, 5044. https://doi.org/10.3390/s22135044
Bianconi F, Palumbo I, Fravolini ML, Rondini M, Minestrini M, Pascoletti G, Nuvoli S, Spanu A, Scialpi M, Aristei C, et al. Form Factors as Potential Imaging Biomarkers to Differentiate Benign vs. Malignant Lung Lesions on CT Scans. Sensors. 2022; 22(13):5044. https://doi.org/10.3390/s22135044
Chicago/Turabian StyleBianconi, Francesco, Isabella Palumbo, Mario Luca Fravolini, Maria Rondini, Matteo Minestrini, Giulia Pascoletti, Susanna Nuvoli, Angela Spanu, Michele Scialpi, Cynthia Aristei, and et al. 2022. "Form Factors as Potential Imaging Biomarkers to Differentiate Benign vs. Malignant Lung Lesions on CT Scans" Sensors 22, no. 13: 5044. https://doi.org/10.3390/s22135044
APA StyleBianconi, F., Palumbo, I., Fravolini, M. L., Rondini, M., Minestrini, M., Pascoletti, G., Nuvoli, S., Spanu, A., Scialpi, M., Aristei, C., & Palumbo, B. (2022). Form Factors as Potential Imaging Biomarkers to Differentiate Benign vs. Malignant Lung Lesions on CT Scans. Sensors, 22(13), 5044. https://doi.org/10.3390/s22135044