
Preliminary Evaluation of a Blast Sprayer Controlled by Pulse-Width-Modulated Nozzles

 , and
, and
Abstract
:1. Introduction
2. Materials and Methods
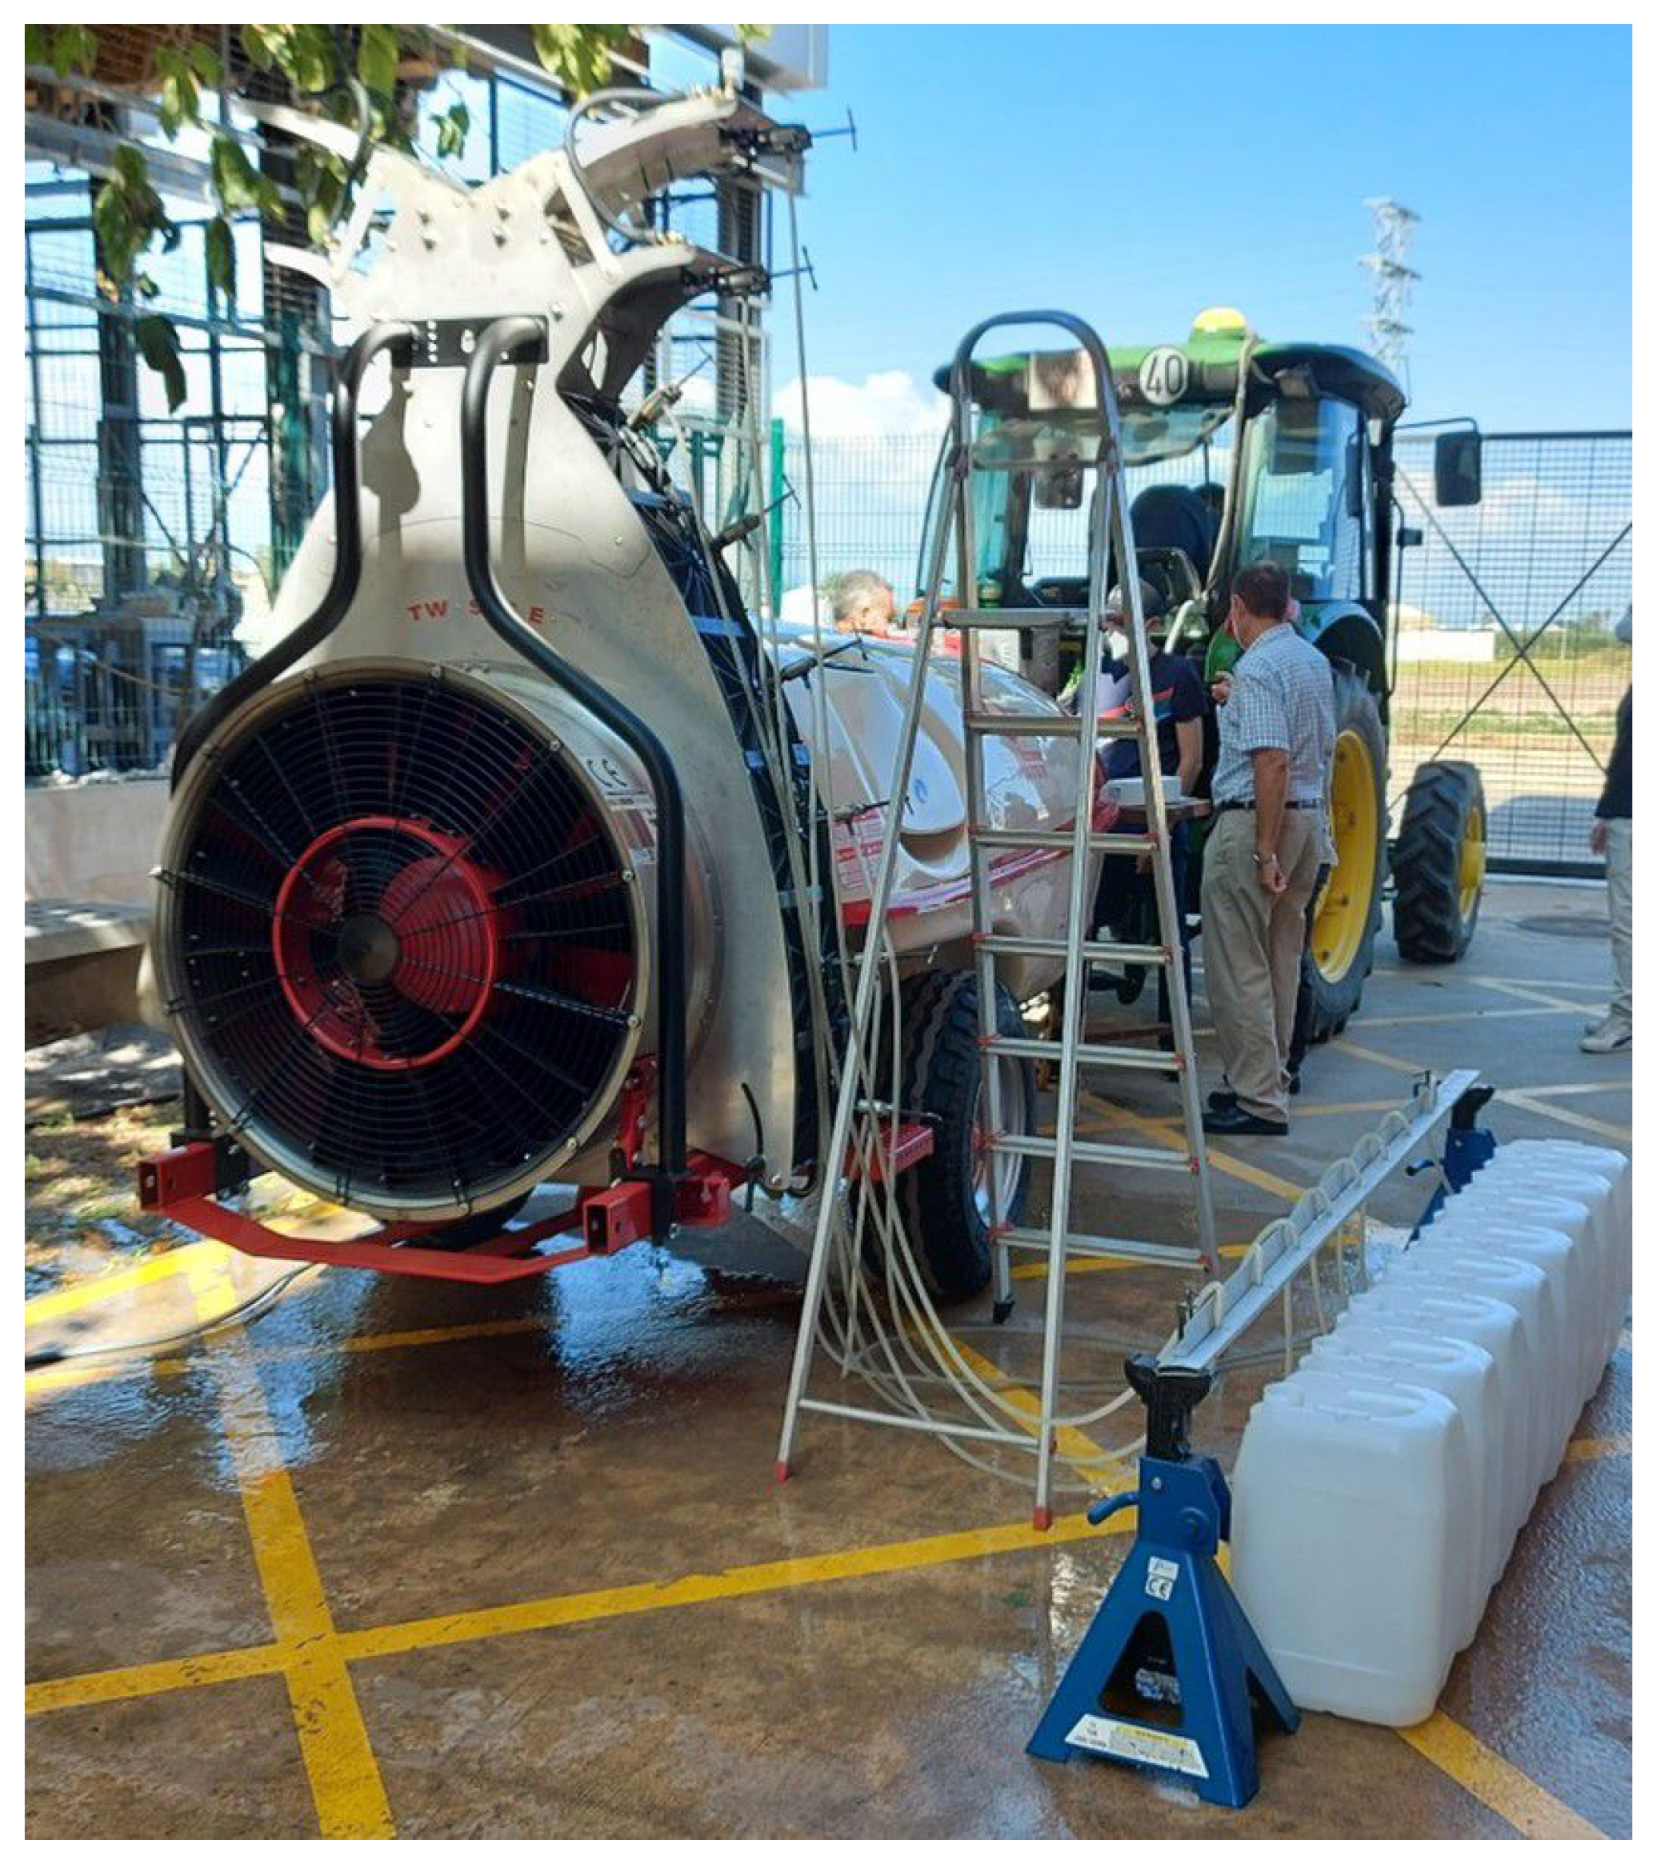
2.1. Materials
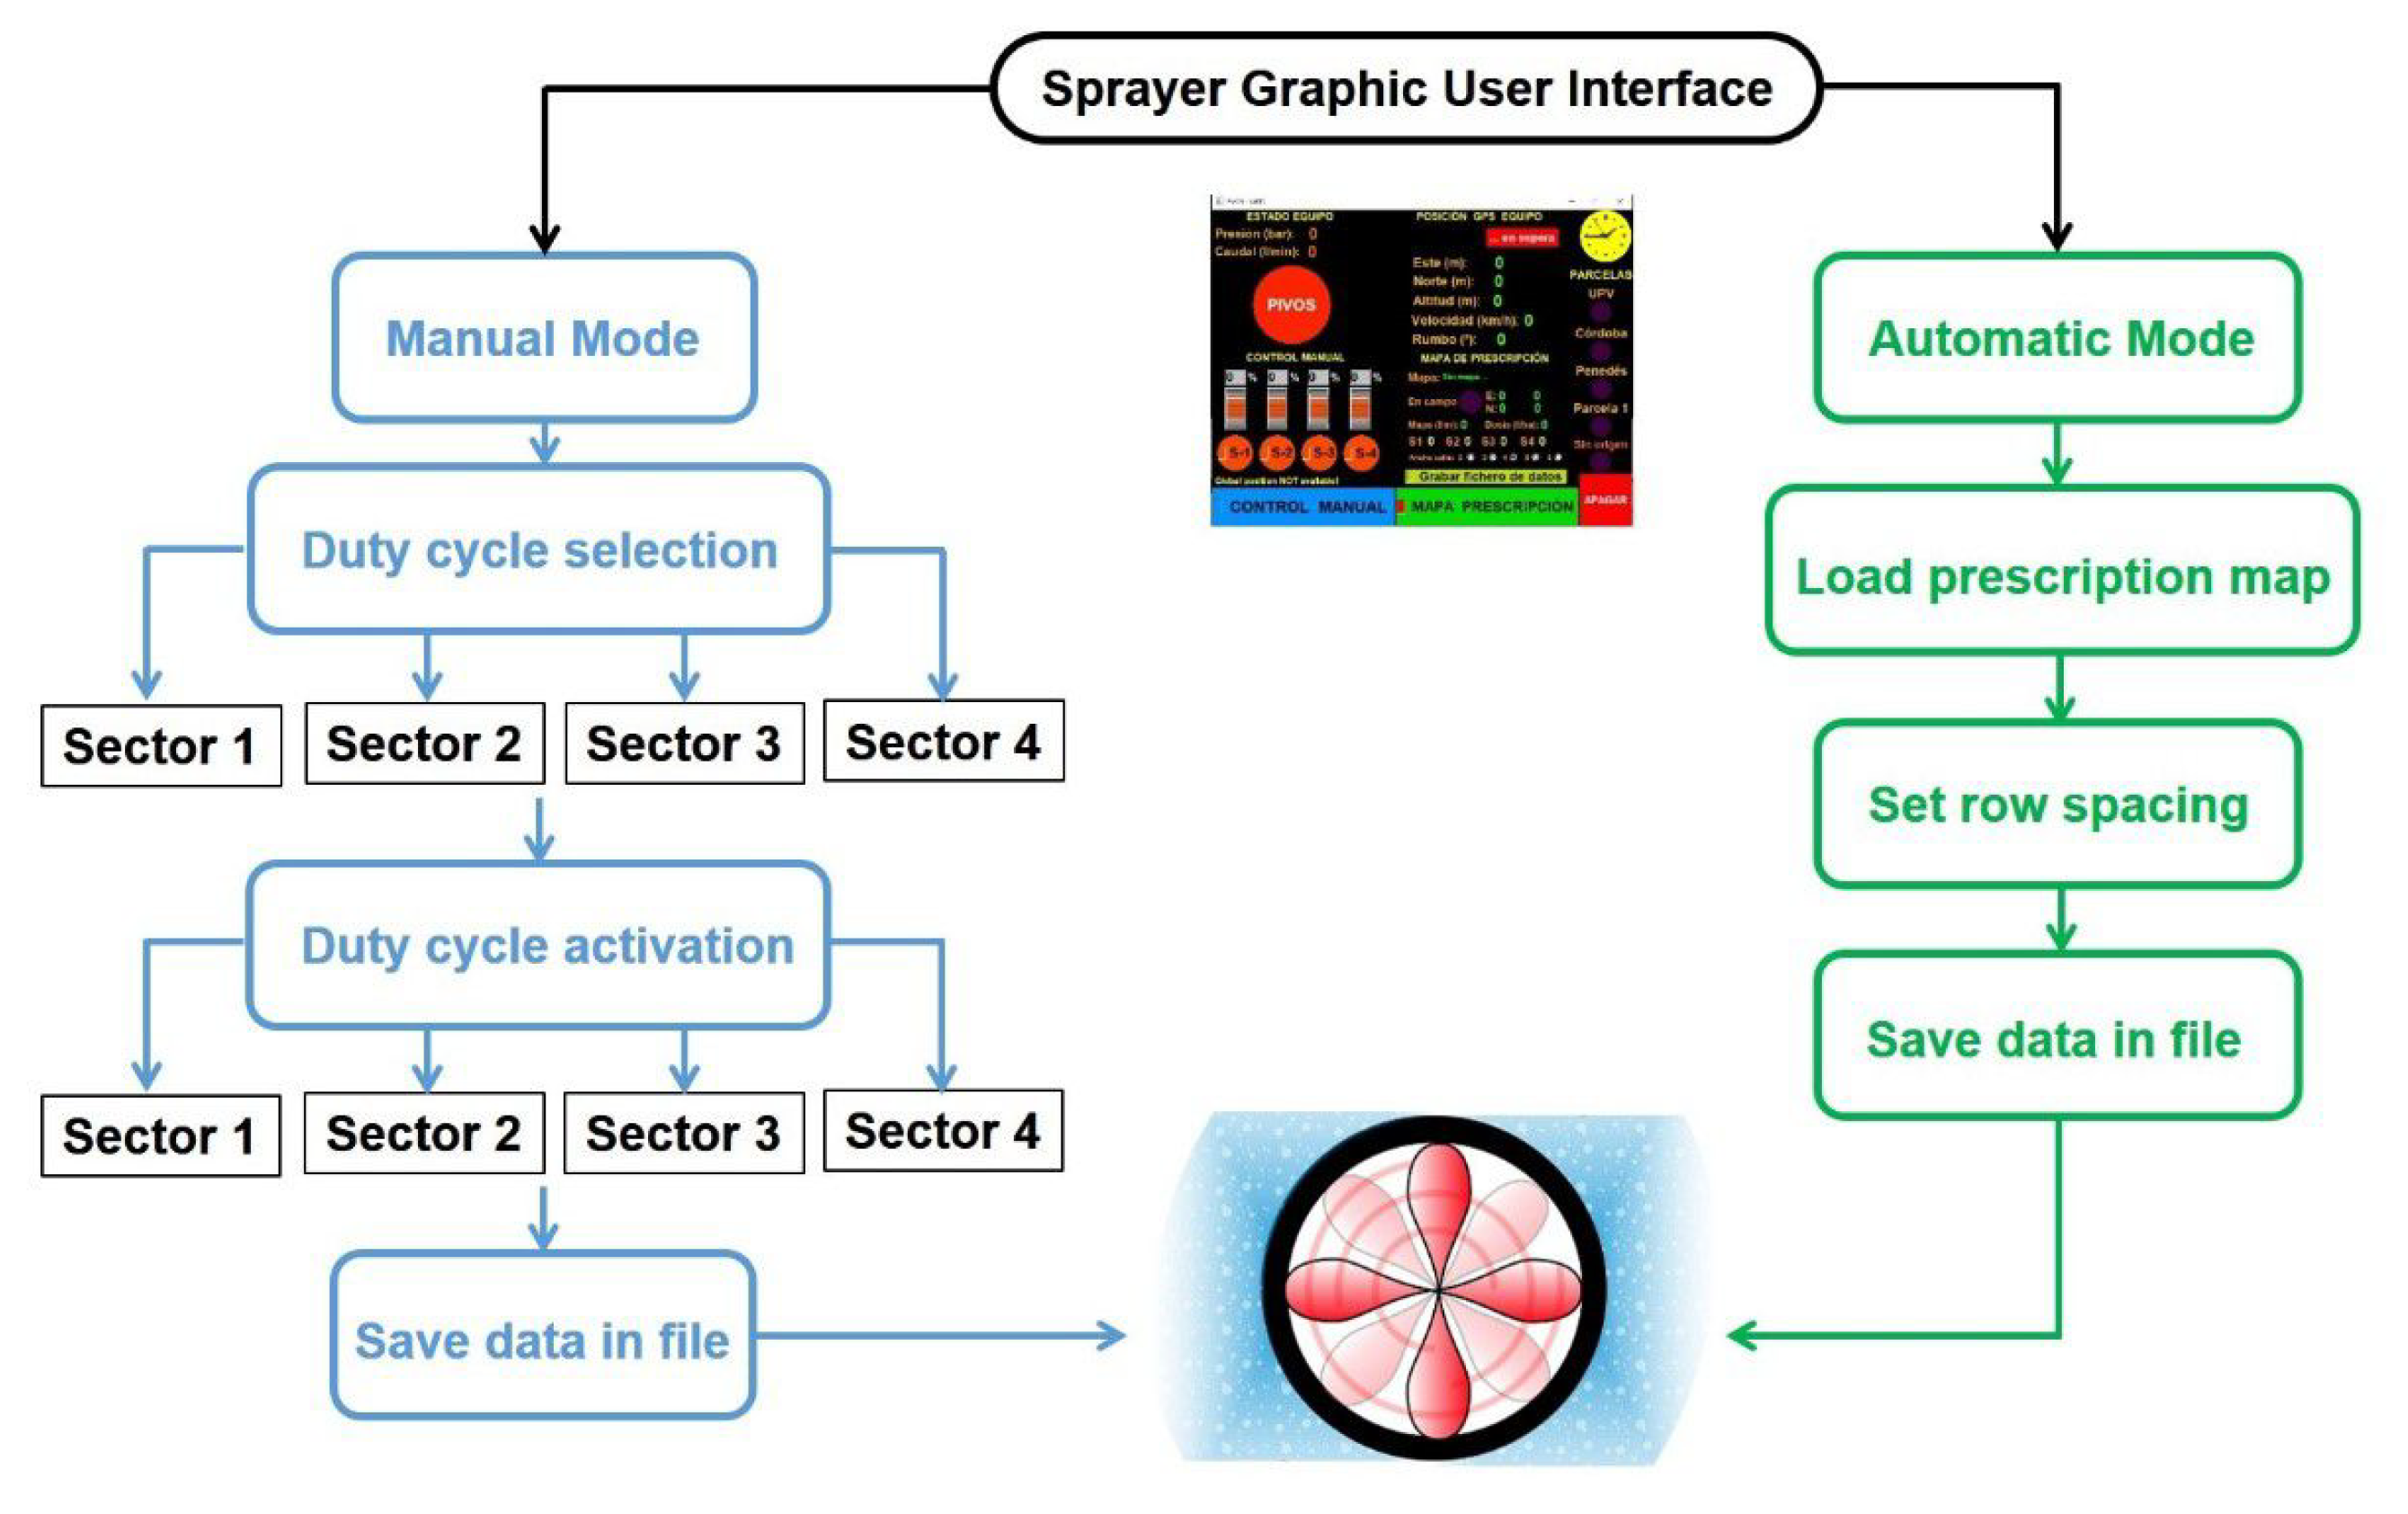
2.2. Methods
3. Results
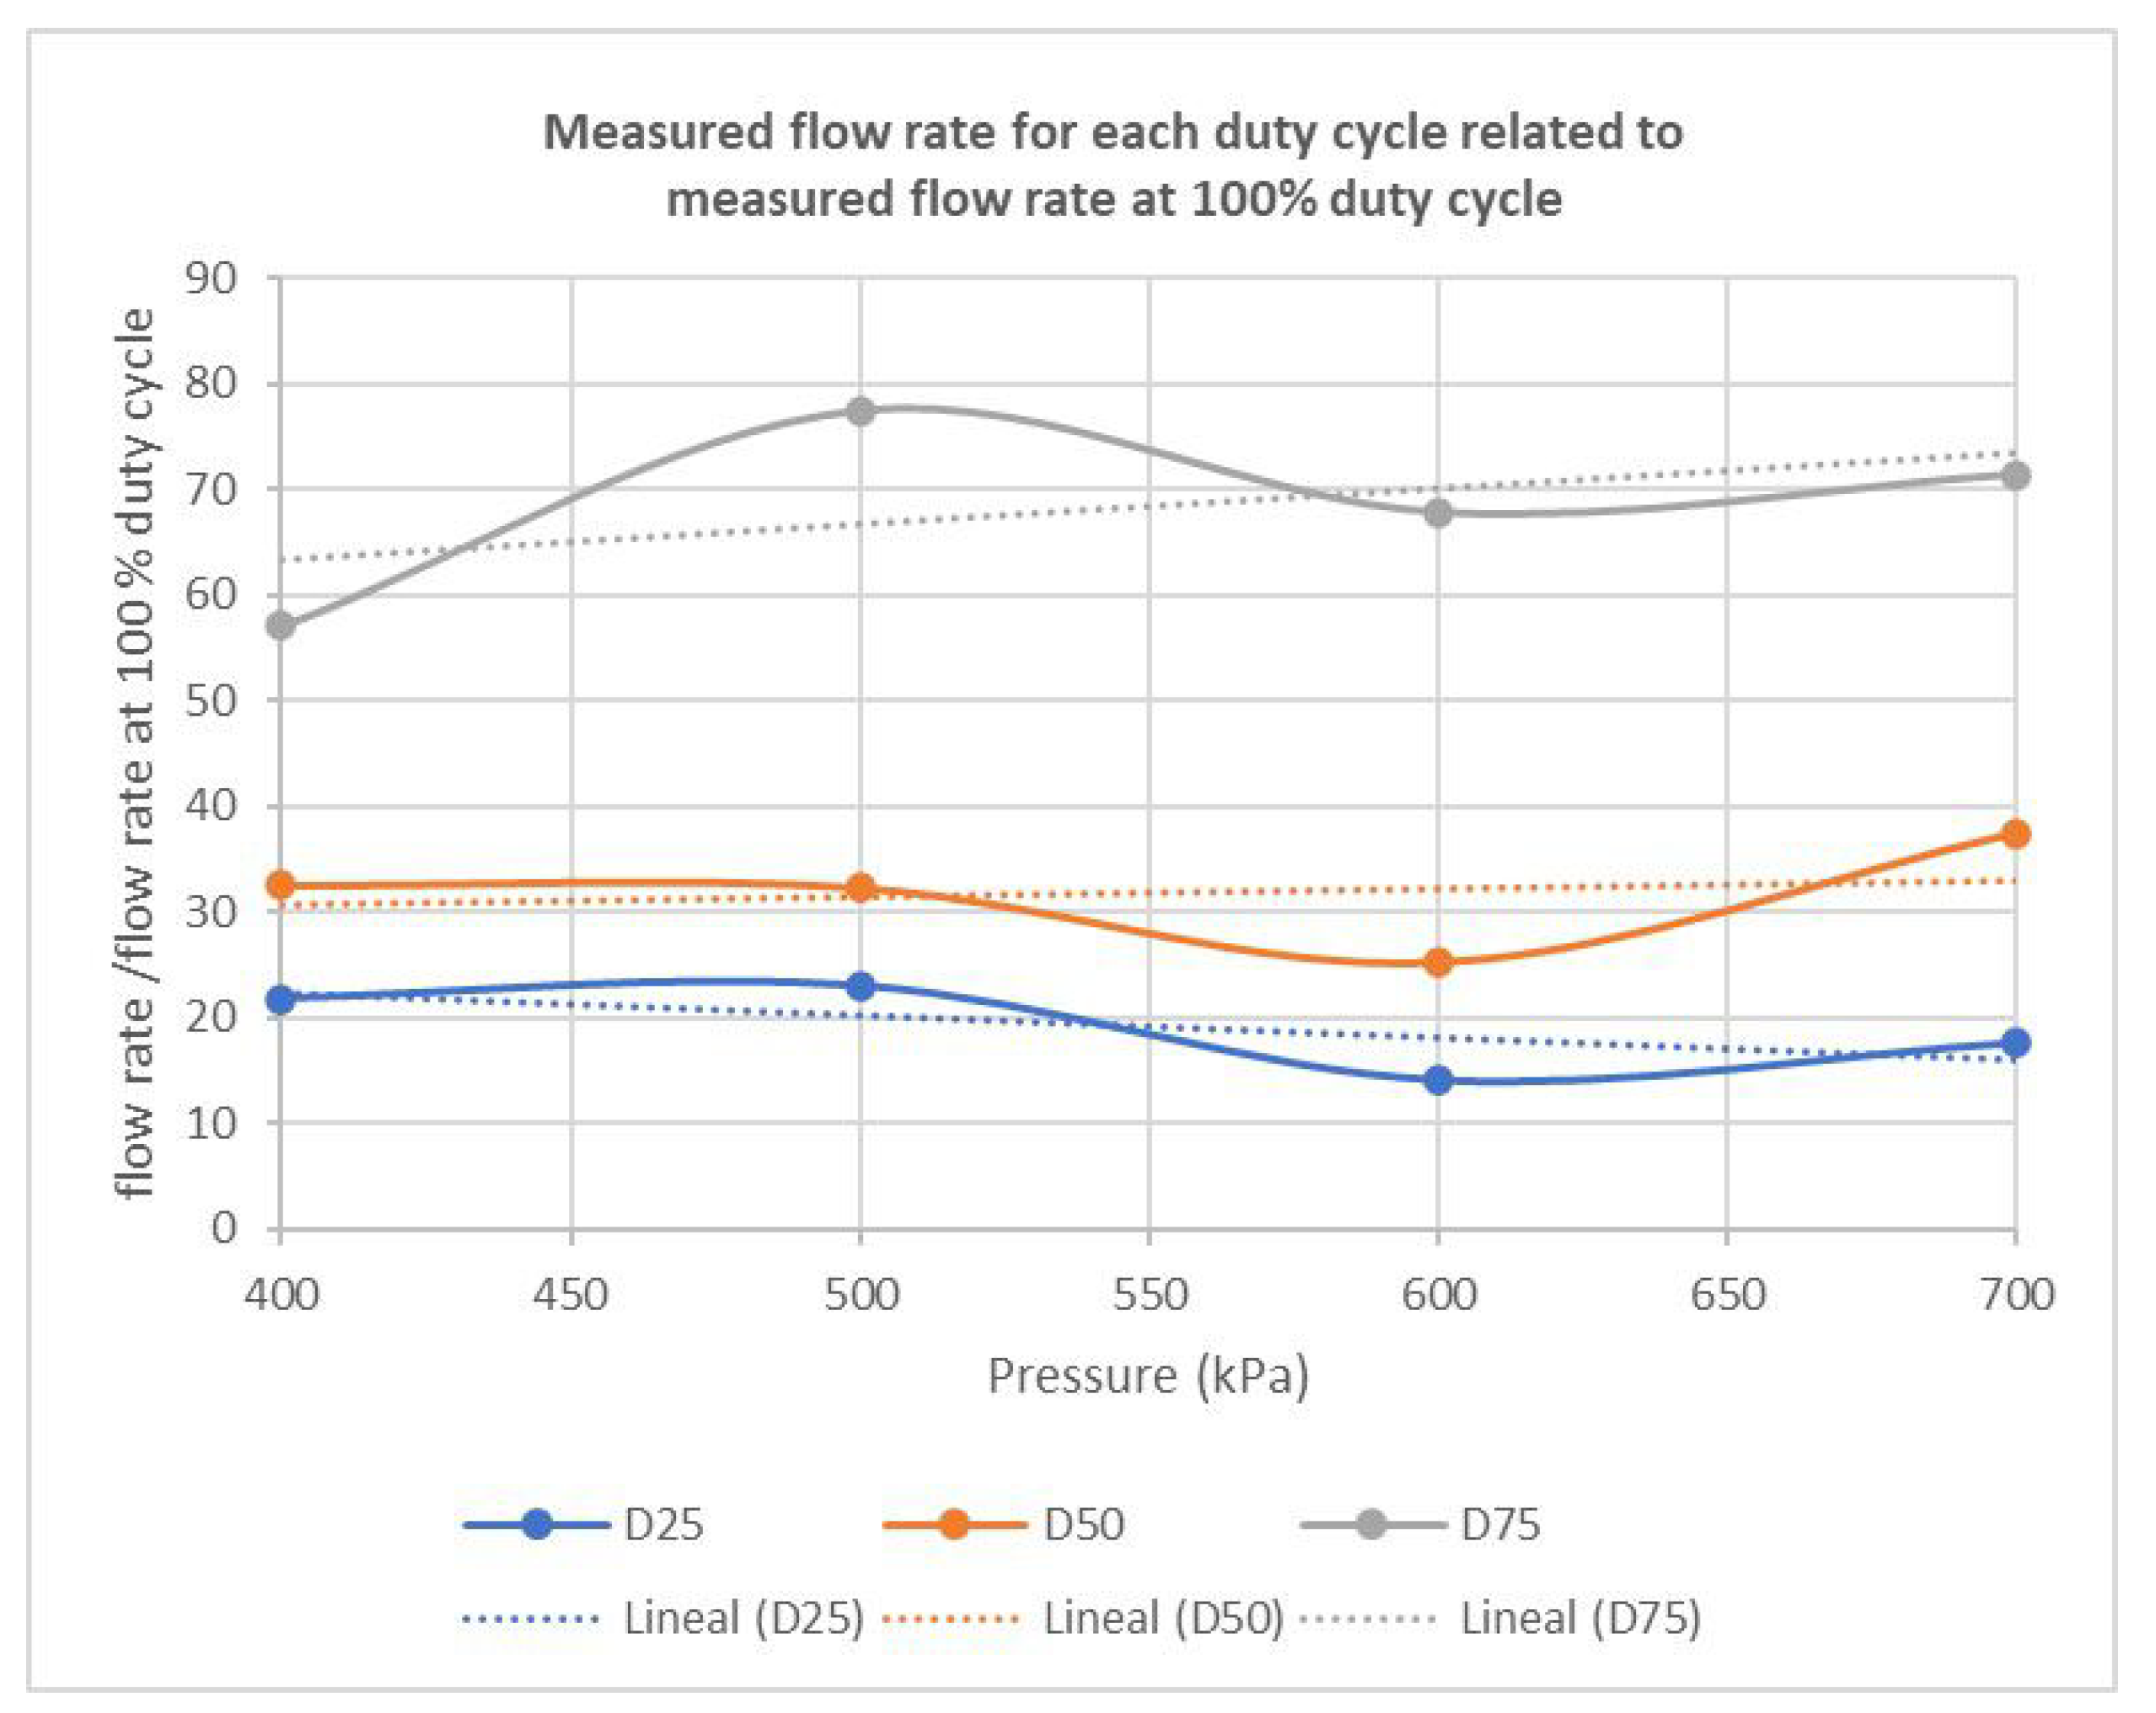
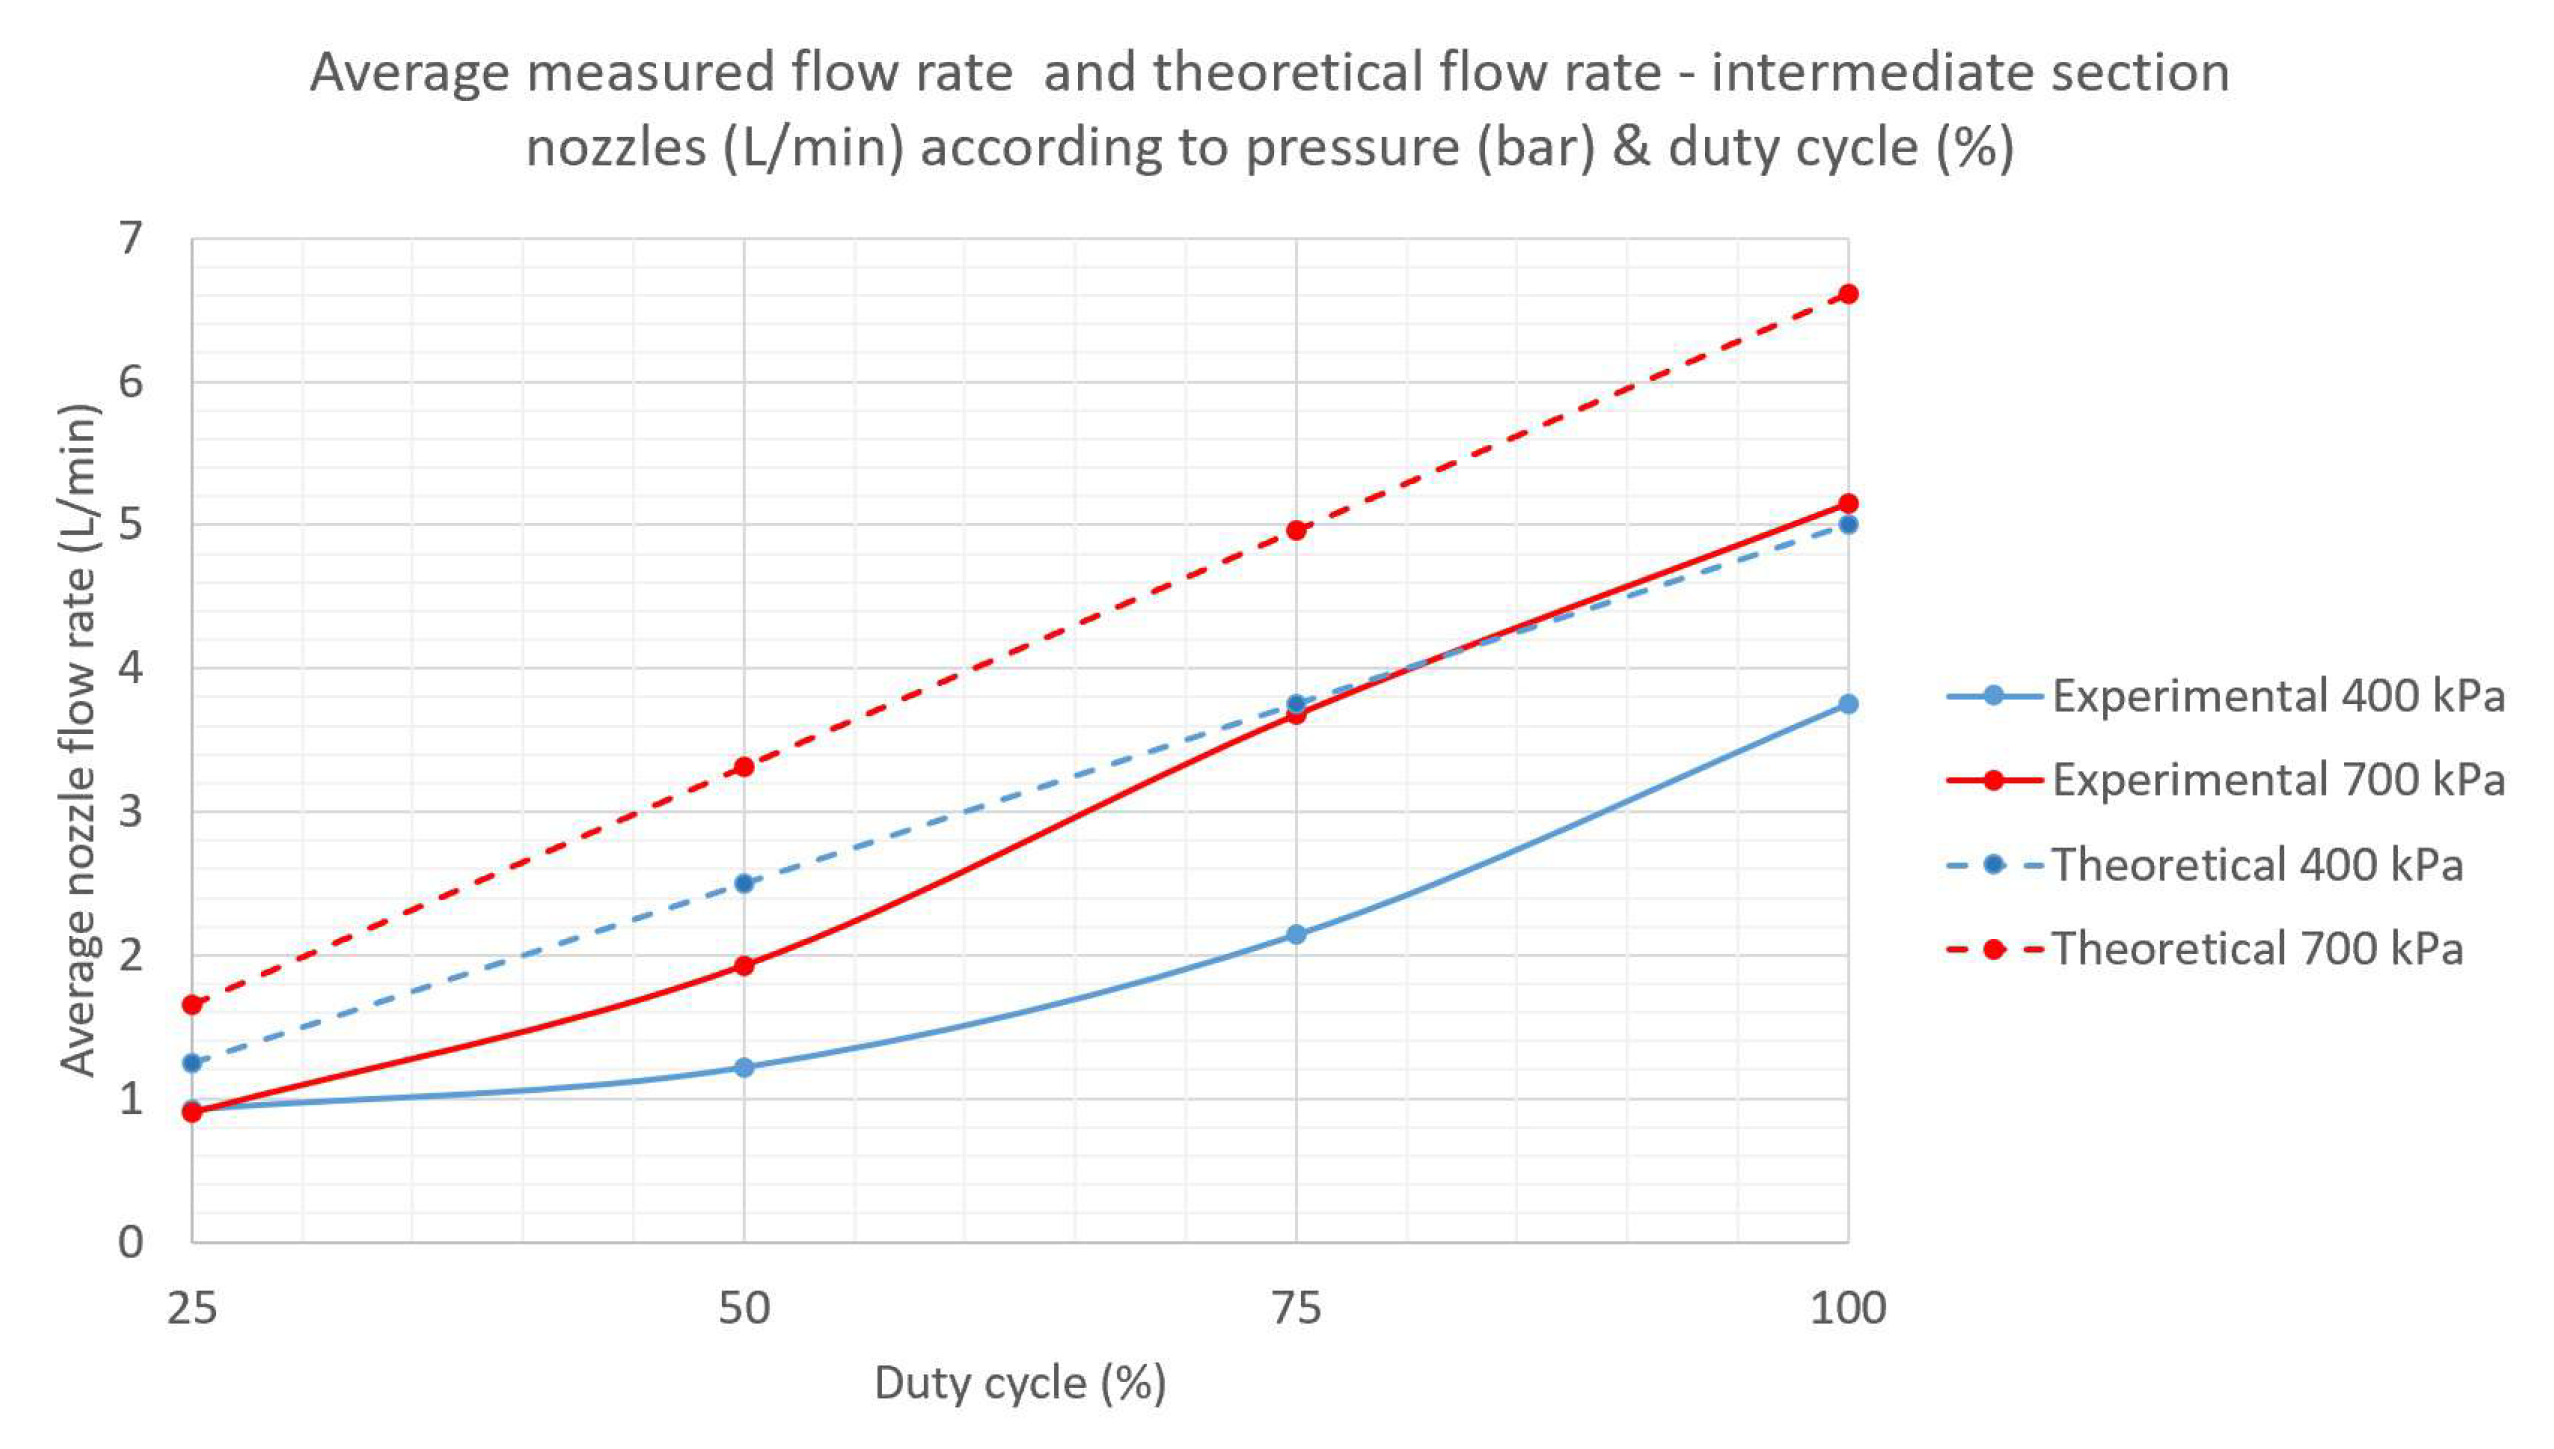
3.1. Effect of Duty Cycle and System Pressure on Flow Rate
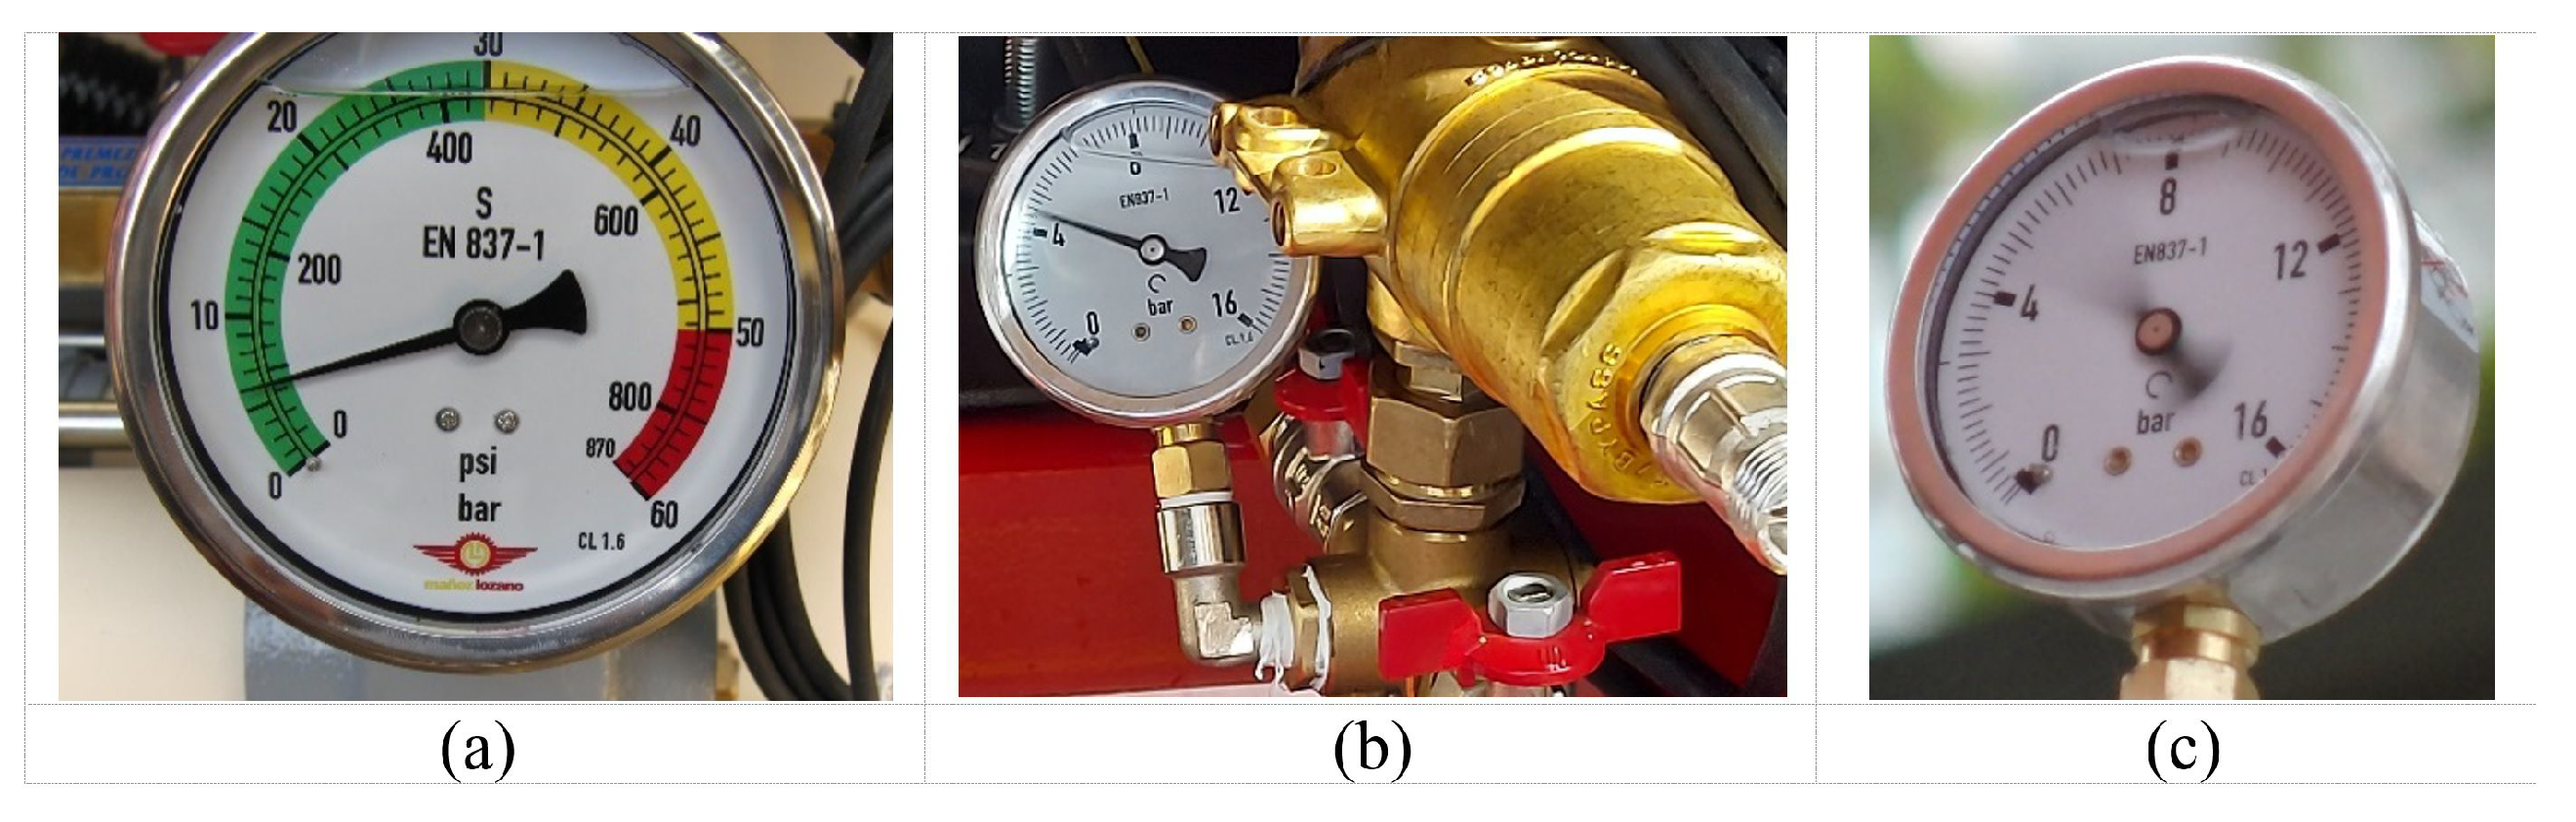
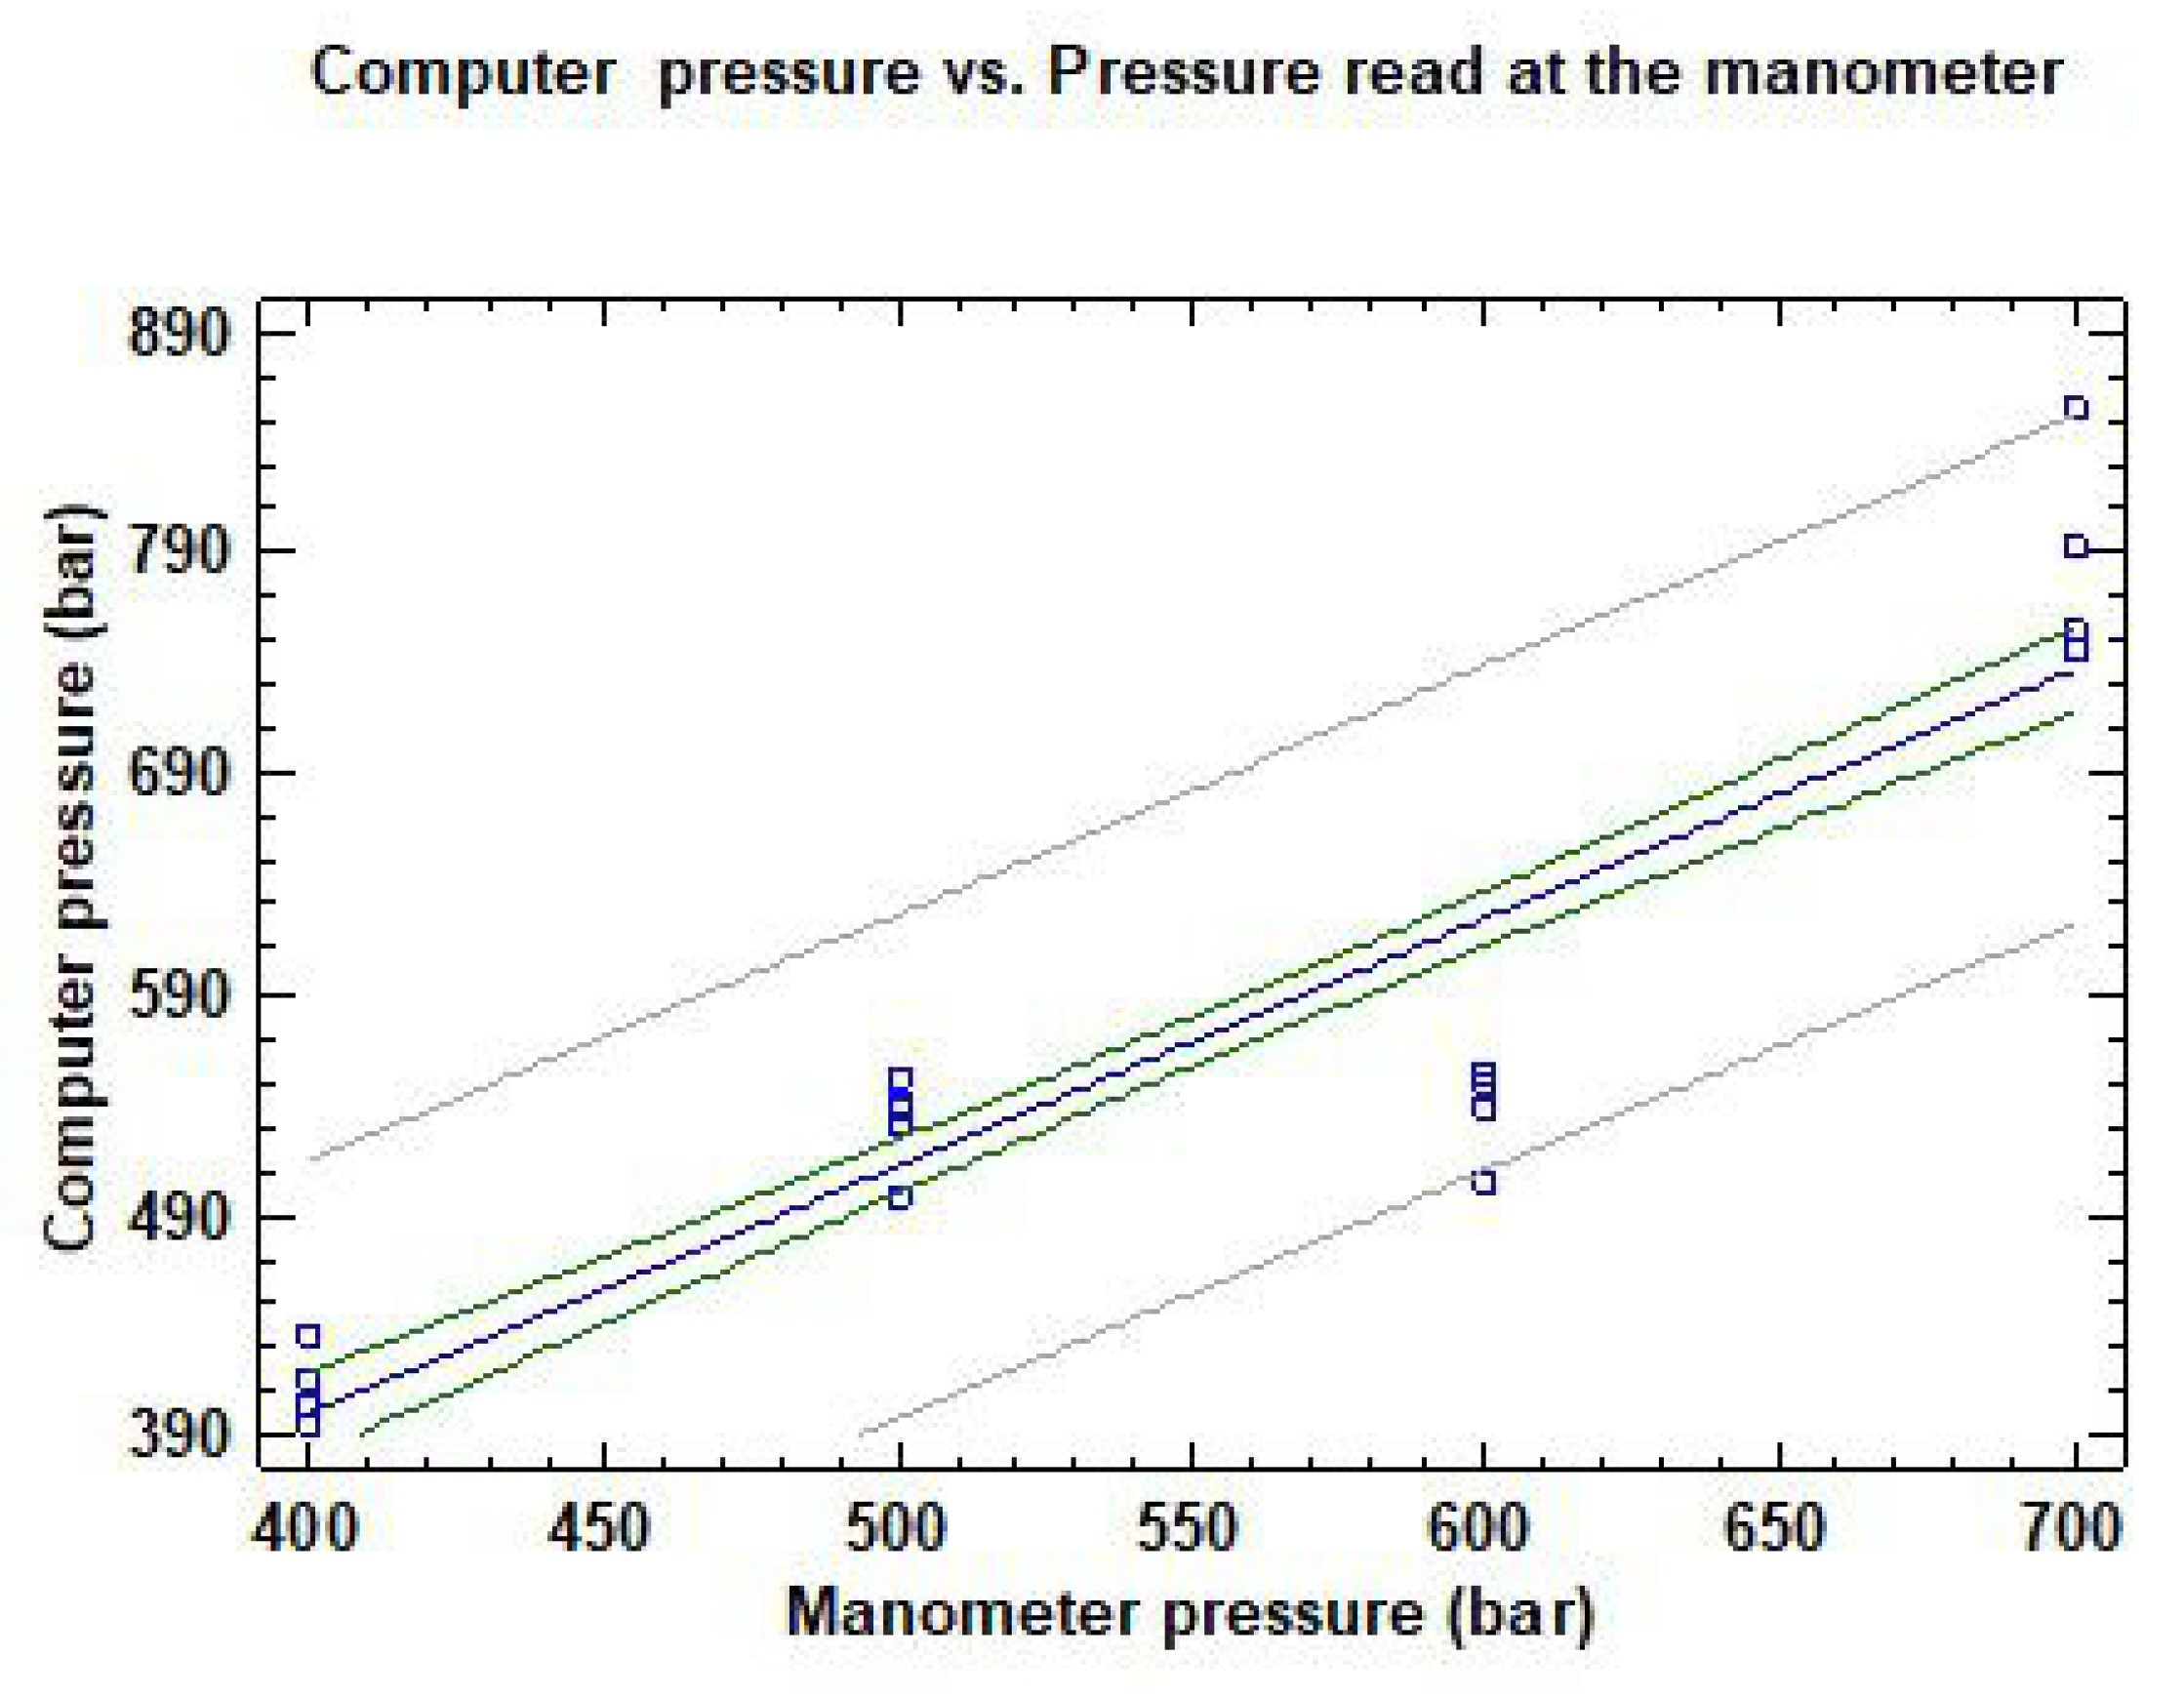
3.2. System Pressure Recorded by the Control System
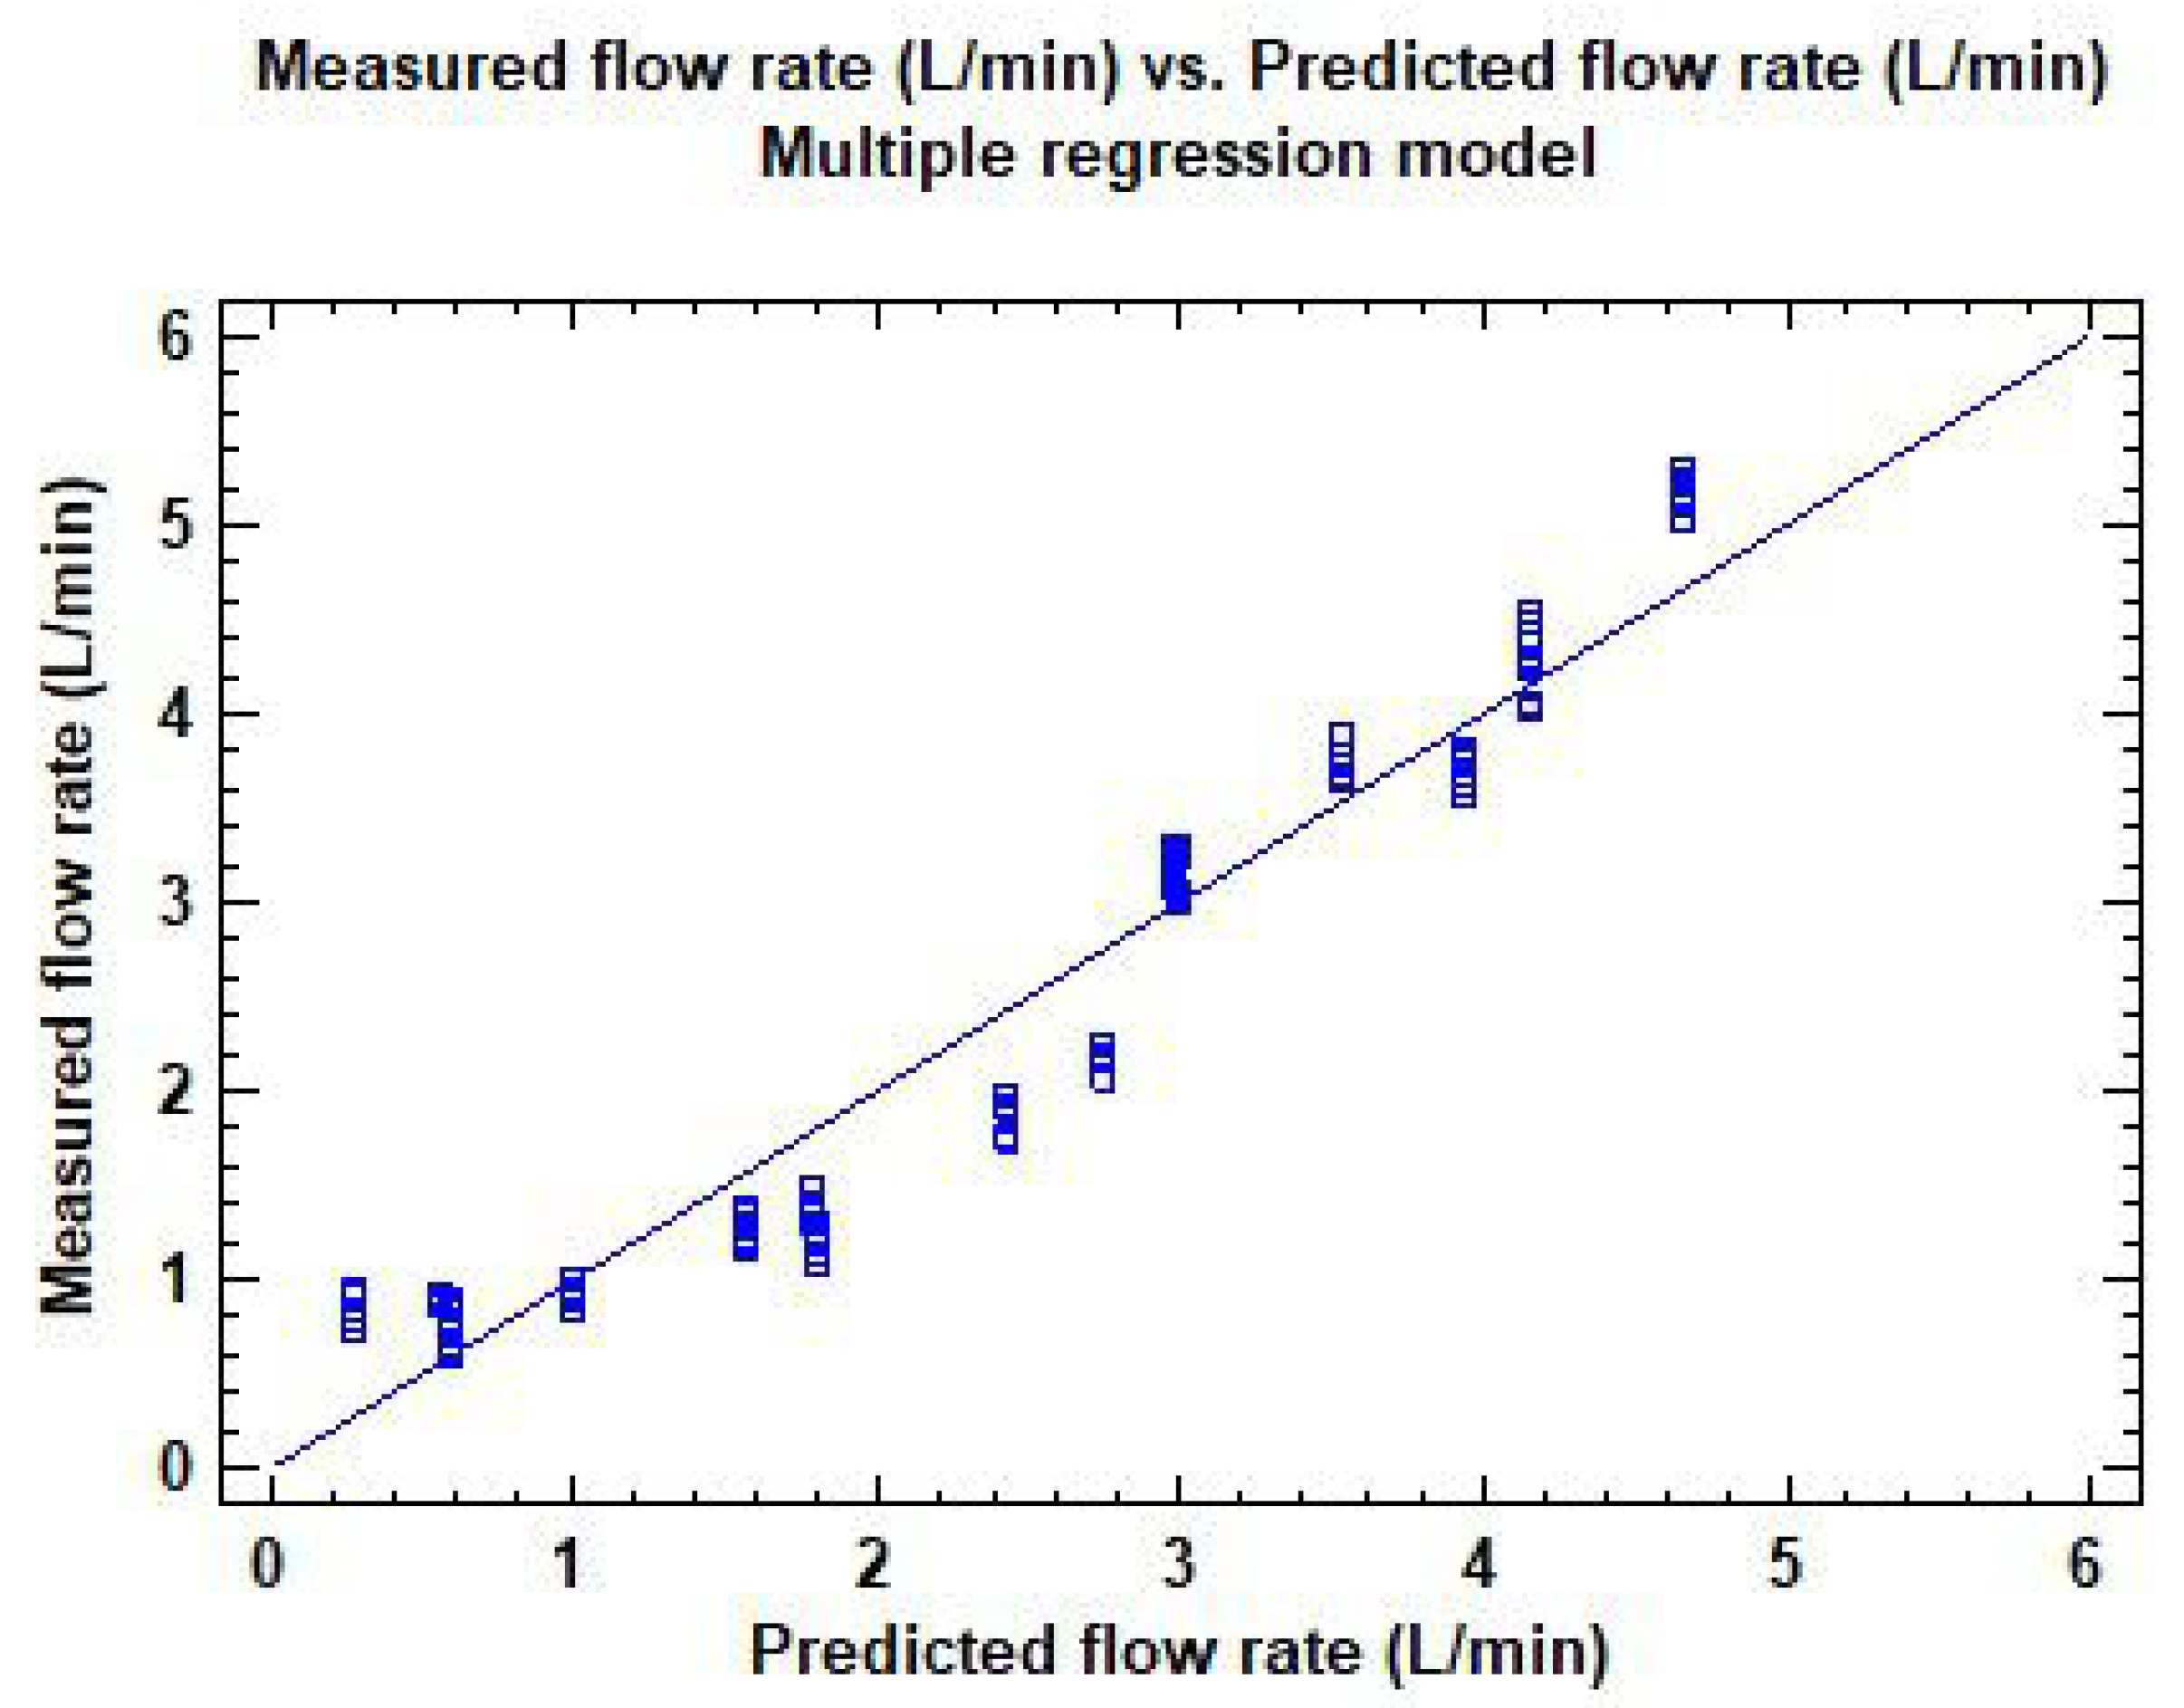
3.3. Flow Rate Recorded by the Sprayer Computer with an Electronic Flowmeter
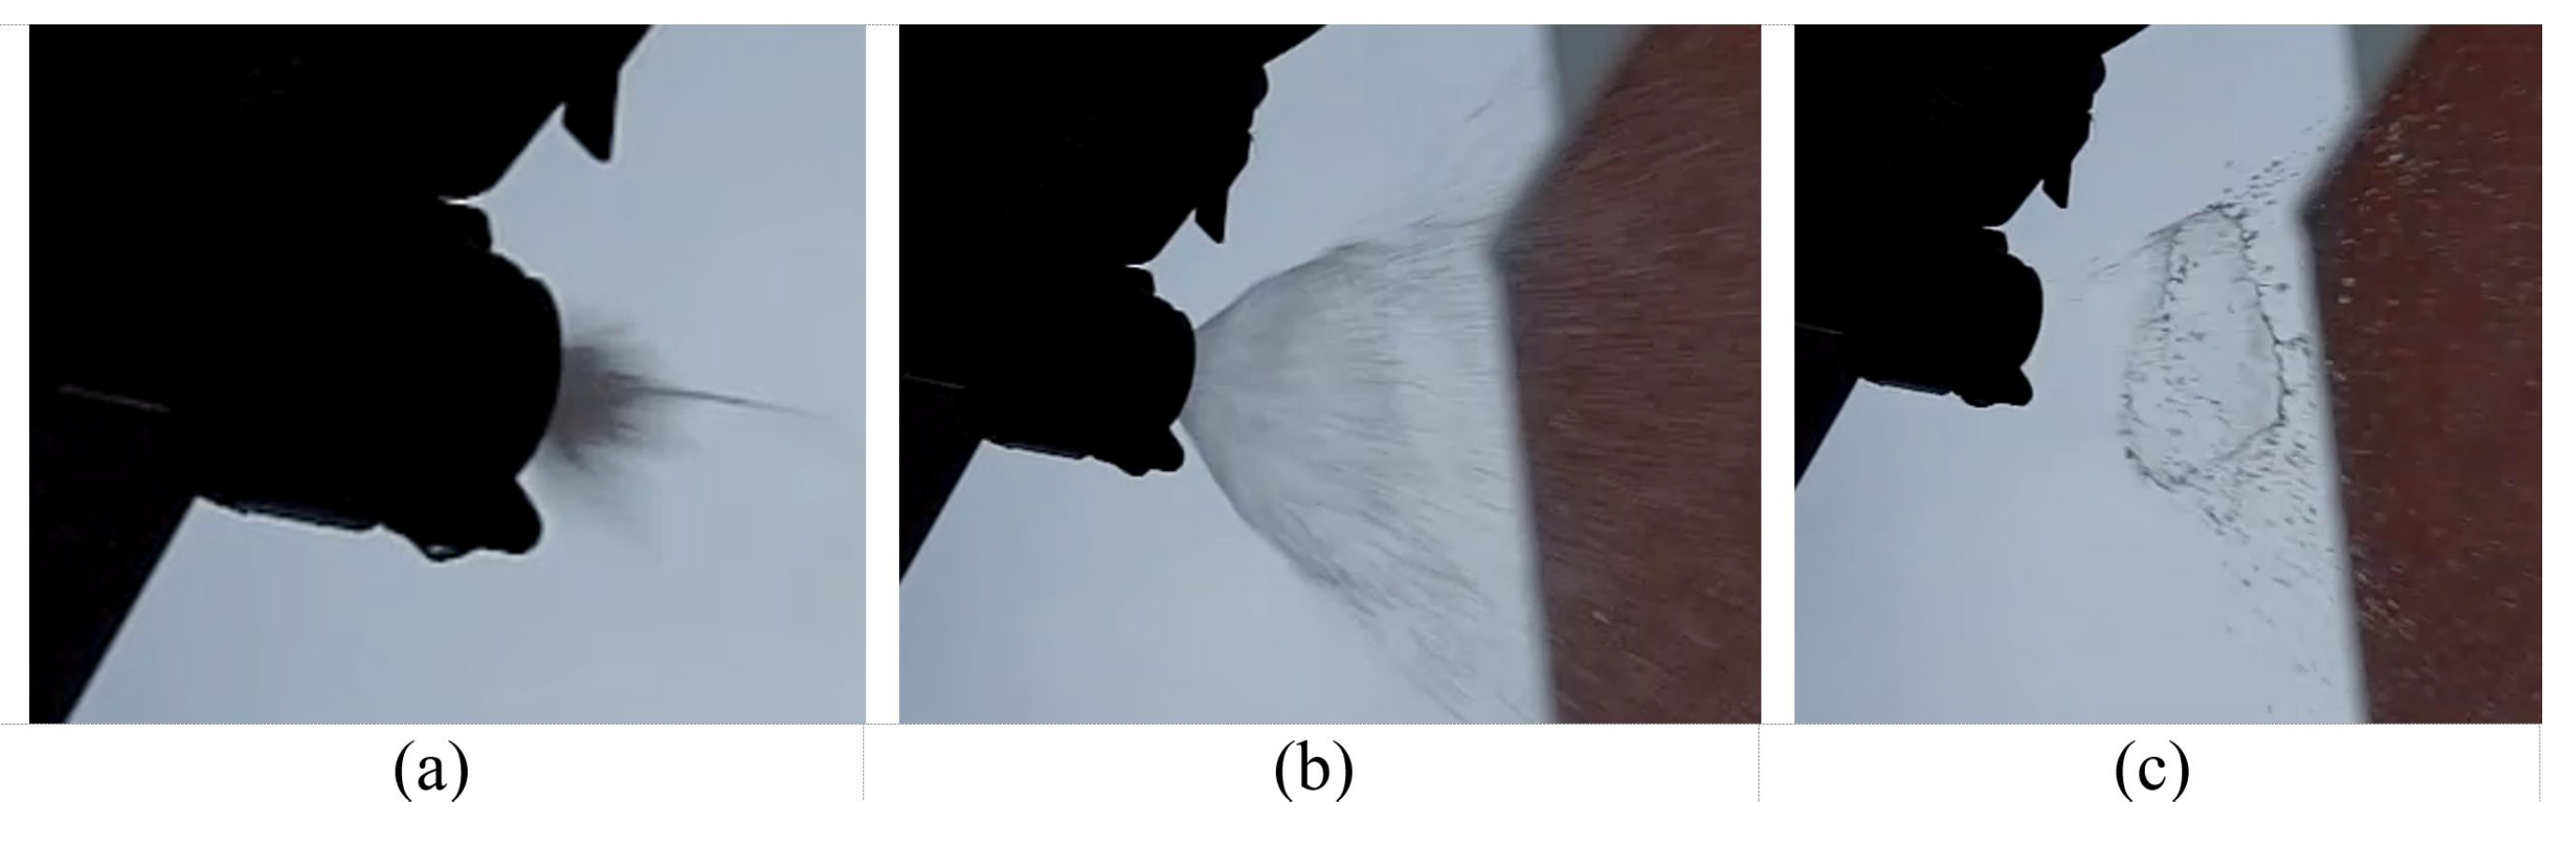
3.4. Evaluation of PWM Nozzles
4. Conclusions
Author Contributions
Funding
Institutional Review Board Statement
Informed Consent Statement
Data Availability Statement
Conflicts of Interest
References
- Verycruysse, F.; Steurbaut, W. POCER, the pesticide occupational and environmental risk indicator. Crop Prot. 2002, 21, 307–315. [Google Scholar] [CrossRef]
- Tamaro, C.M.; Smith, M.N.; Workman, T.; Grieth, W.C. Characterization of organophosphate pesticides in urine and home environment dust in an agricultural community. Biomarkers 2018, 23, 174–187. [Google Scholar] [CrossRef]
- Lan, J.; Jia, J.; Liu, A.; Yu, Z.; Zhao, Z. Pollution levels of banned and non-banned pesticides in surface sediments from the East China Sea. Mar. Pollut. Bull. 2019, 139, 332–338. [Google Scholar] [CrossRef]
- Reichenberger, S.; Bach, B.; Skitschak, A.; Frede, H.G. Mitigation strategies to reduce pesticide inputs into ground- and surface water and their effectiveness; A review. Sci. Total Environ. 2006, 384, 1–35. [Google Scholar] [CrossRef] [PubMed]
- Huizhu, Y.; Xionkui, H. Herbicides deposit distribution with knapsacksprayer spraying. Plant Prot. 1998, 24, 41–42. [Google Scholar]
- Salyani, M.; Cromwell, R. Spray drift from ground and aerial applications. Trans. ASAE 1992, 35, 1113–1120. [Google Scholar] [CrossRef]
- Felsot, A.S.; Unsworth, J.B.; Linders, H.J.; Roberts, G.; Rautman, D.; Harris, C.; Carazo, E. Agrochemical spray drift; assessment and mitigation—A review. J. Environ. Sci. Health Part B 2011, 46, 1–23. [Google Scholar] [CrossRef] [PubMed]
- Holterman, H.J.; Zande, J.C.; van de Huijmans, J.F.M.; Wenneker, M. An empirical model based on phenological growth stage for predicting pesticide spray drift in pome fruit orchards. Biosyst. Eng. 2017, 154, 46–61. [Google Scholar] [CrossRef]
- Rathnayake, A.P.; Khot, L.R.; Hoheisel, G.A.; Thistle, H.W.; Teske, M.E.; Willett, M.J. Downwind spray drift assessment for airblast sprayer applications in a modern apple orchard system. Trans. ASABE 2021, 64, 601–613. [Google Scholar] [CrossRef]
- Hong, S.W.; Park, J.; Jeong, H.; Lee, S.; Choi, L.; Zhao, L.; Zhu, H. Fluid Dynamic Approaches for Prediction of Spray Drift from Ground pesticide Applications: A Review. Agronomy 2021, 11, 1182. [Google Scholar] [CrossRef]
- Walklate, P.J.; Cross, J.V. Regulated dose adjustment of commercial orchard spraying products. Crop Prot. 2013, 54, 65–73. [Google Scholar] [CrossRef]
- Miranda-Fuentes, A.; Cuenca, A.; Godoy-Nieto, A.; Gonzalez-Sánchez, E.J.; Gil, E.; Llorens, J.; Gil-Ribes, J. Reducing spray drift by adapting the spraying equipment to the canopy shape in olive orchards with isolated trees. In International Advances in Pesticide Application; Universitat Politècnica de Catalunya: Barcelona, Spain, 2018; Volume 137, pp. 325–332. [Google Scholar]
- Song, L.; Huang, J.; Liang, X.; Yang, S.X.; Hu, W.; Tang, D. An Intelligent Multi-Sensor Variable Spray System with Chaotic Optimization and Adaptive Fuzzy Control. Sensors 2020, 20, 2954. [Google Scholar] [CrossRef]
- Mahmud, M.S.; Zahid, A.; He, L.; Martin, P. Opportunities and Possibilities of Developing an Advanced Precision Spraying System for Tree Fruits. Sensors 2021, 21, 3262. [Google Scholar] [CrossRef] [PubMed]
- Gu, C.; Wang, X.; Wang, X.; Yang, F.; Zhai, C. Research progress on variable-rate spraying technology orchards. Appl. Eng. Agric. 2020, 36, 927–942. [Google Scholar] [CrossRef]
- Duga, A.T.; Ruysen, K.; Dekeyser, D.; Nuyttens, D.; Bylemas, D.; Nicolai, B.M.; Verboven, P. Spray deposition profiles in pome fruit trees: Effects of sprayer design, training system and tree canopy characteristics. Crop Prot. 2015, 67, 200–213. [Google Scholar] [CrossRef]
- Holownicki, R.; Doruchowski, G.; Swiechowski, W.; Godyn, A.; Konopacki, P.J. Variable air assistance system for orchard sprayers; concept, design and preliminary testing. Biosyst. Eng. 2017, 163, 134–149. [Google Scholar] [CrossRef]
- Fabula, J.V.; Sharda, A.; Flippo, D.; Ciampiti, I.; Kang, Q. Boom pressure and droplet size uniformity of a pulse width modulation (PWM) spray technology. In Proceedings of the 2020 ASABE Annual International Meeting, Omaha, NE, USA, 12–15 July 2020; Volume 2001041. [Google Scholar]
- Silva, J.A.; Zhu, H.; Rodrigues da Cunha, J.P.A. Spray outputs from a variable-rate sprayer manipulated with PWM solenoid valves. Appl. Eng. Agric. 2018, 34, 527–534. [Google Scholar] [CrossRef]
- Fabula, J.; Sharda, A.; Kang, Q.; Flippo, D. Nozzle flow rate, pressure drop, and response time of pulse width modulation (PWM) nozzle control systems. Trans. ASABE 2021, 64, 1519–1532. [Google Scholar] [CrossRef]
- Yan, T.; Zhu, H.; Sun, L.; Wang, X.; Ling, P. Investigation of an experimental laser sensor-guided spray control system for greenhouse variable-rate applications. Trans. ASABE 2019, 62, 916–920. [Google Scholar] [CrossRef]
- Salcedo, R.; Zhu, H.; Zhang, Z.; Wei, Z.; Chen, L.; Ozkan, E. Evaluation of PWM technologies for pesticide spray applications in a two-year old apple orchard. In Proceedings of the 2020 ASABE Annual International Meeting, Omaha, NE, USA, 12–15 July 2020; Volume 2000079. [Google Scholar]
- Wei, Z.; Zhu, H.; Salcedo, R.; Zhang, Z.; Duan, D.; Liu, Q. Investigation of droplet sizes and active discharging pressures for different pulse width modulated nozzles. In Proceedings of the 2020 ASABE Annual International Meeting, Omaha, NE, USA, 12–15 July 2020; Volume 200124. [Google Scholar]
- Salcedo, R.; Zhu, H.; Jeon, H.; Wei, Z.; Ozkan, E.; Gil, E. Characterization of volumetric droplet size distributions from PWM-controlled hollow-cone nozzles designed for variable-rate air-assisted sprayers. In Proceedings of the 2020 ASABE Annual International Virtual Meeting, Virtual, 12–18 July 2021; Volume 2100038. [Google Scholar]
- Grella, M.; Gioelli, F.; Marucco, P.; Zwertvaegher, I.; Mozzanini, E.; Mylkonas, N.; Nuyttens, D.; Balsari, P. Field assessment of a pulse width modulation (PWM) spray system applying different spray volumes: Duty cycle and forward speed effects on vines spray coverage. Precis. Agric. 2021, 23, 219–252. [Google Scholar] [CrossRef]


| Source | Sum of Squares | df | Mean Square | F-Ratio | p-Value |
|---|---|---|---|---|---|
| Duty cycle | 35.85 | 3 | 11.95 | 418.31 | 0.0000 |
| System pressure | 1.94 | 3 | 0.65 | 22.60 | 0.0057 |
| Duty cycle × System pressure | 1.17 | 9 | 0.13 | 4.55 | 0.0794 |
| Residuals | 0.11 | 4 | 0.03 | ||
| Total | 52.45 | 19 |
| Duty Cycle | Q vs. P1 | Q vs. Psensor | Q = k.P1 | Q = k.Psensor |
|---|---|---|---|---|
| R2 Best Model | R2 Best Model | R2 Linear Model | R2 Linear Model | |
| All duty cycles | 8 | 2 | 5 | 2 |
| 100 | 91 | 91 | 89 | 90 |
| 75 | 84 | 91 | 78 | 74 |
| 50 | 34 | 59 | 21 | 43 |
| 25 | 1 | 9 | 0 | 6 |
| R2 = 93.10 Percent | Error | Statistic | ||
|---|---|---|---|---|
| Parameter | Estimation | Standard | T | p-value |
| CONSTANT | −1.7880 | 0.1874 | −9.5394 | 0.0000 |
| PSensor (kPa) | 0.2072 | 0.0282 | 7.3586 | 0.0000 |
| Duty cycle | 0.0490 | 0.0013 | 36.6017 | 0.0000 |
| Duty Cycle | R2 | Model |
|---|---|---|
| 100 | 97 | Flow rate (L/min) = −0.1712 + 1.1111 × Sensor flow rate |
| 75 | 84 | Flow rate (L/min) = −0.6370 + 1.1105 × Sensor flow rate |
| 50 | 46 | Flow rate (L/min) = 0.3992 + 0.3625 × Sensor flow rate |
| 50´ | 87 | Flow rate (L/min) = 0.3452 + 0.4186 × Sensor flow rate |
| 25 | 65 | Flow rate (L/min) = 1.0436 − 0.1424 × Sensor flow rate |
| Frame 0 | Frame f | Duration (s) | Period (s) | Duty Cycle |
|---|---|---|---|---|
| 127 | 144 | 0.057 | - | 57 |
| 157 | 173 | 0.053 | 0.1 | 53 |
| 127 | 187 | 0.057 | 0.1 | 57 |
| 127 | 217 | 0.057 | 0.1 | 57 |
| 127 | 247 | 0.053 | 0.1 | 53 |
| 127 | 277 | 0.057 | 0.1 | 57 |
| Mean | - | - | 0.1 | 55 |
| DC | P1 | P2 | P3 | |||||||
|---|---|---|---|---|---|---|---|---|---|---|
| Max | Min | Range | Max Min | Range | Max Min | Range | ||||
| 100 | 6.0 | - | - | 5.4 | 5.0 | 173 | 0.4 | 4.2 | 4.0 | 0.2 |
| 75 | 6.2 | 6.0 | 0.2 | 5.6 | 4.2 | 173 | 1.4 | 6.5 | 2.1 | 4.4 |
| 50 | 6.0 | 5.8 | 0.2 | 8.6 | 3.6 | 173 | 5.0 | 11.4 | 0.0 | 11.4 |
| 25 | 6.0 | - | - | 7.8 | 3.6 | 173 | 4.2 | 10.5 | 0.5 | 10.0 |
Publisher’s Note: MDPI stays neutral with regard to jurisdictional claims in published maps and institutional affiliations. |
© 2022 by the authors. Licensee MDPI, Basel, Switzerland. This article is an open access article distributed under the terms and conditions of the Creative Commons Attribution (CC BY) license (https://creativecommons.org/licenses/by/4.0/).
Share and Cite
Ortí, E.; Cuenca, A.; Pérez, M.; Torregrosa, A.; Ortiz, C.; Rovira-Más, F. Preliminary Evaluation of a Blast Sprayer Controlled by Pulse-Width-Modulated Nozzles. Sensors 2022, 22, 4924. https://doi.org/10.3390/s22134924
Ortí E, Cuenca A, Pérez M, Torregrosa A, Ortiz C, Rovira-Más F. Preliminary Evaluation of a Blast Sprayer Controlled by Pulse-Width-Modulated Nozzles. Sensors. 2022; 22(13):4924. https://doi.org/10.3390/s22134924
Chicago/Turabian StyleOrtí, Enrique, Andrés Cuenca, Montano Pérez, Antonio Torregrosa, Coral Ortiz, and Francisco Rovira-Más. 2022. "Preliminary Evaluation of a Blast Sprayer Controlled by Pulse-Width-Modulated Nozzles" Sensors 22, no. 13: 4924. https://doi.org/10.3390/s22134924
APA StyleOrtí, E., Cuenca, A., Pérez, M., Torregrosa, A., Ortiz, C., & Rovira-Más, F. (2022). Preliminary Evaluation of a Blast Sprayer Controlled by Pulse-Width-Modulated Nozzles. Sensors, 22(13), 4924. https://doi.org/10.3390/s22134924