1. Introduction
The PIN is a numeric password commonly used to provide user authentication together with novel alternatives such as pattern lock and fingerprints. Typical uses of the PIN include screen unlocking on mobile devices, user authentication on computers, and secure access to specific services, such as banking systems. However, this authentication method can be subject to three types of cyber attacks. Firstly, an attacker could learn the PIN through traditional attacks such as phishing and shoulder surfing [
1]. Secondly, smudge attacks are possible when the PIN is inserted on the touchscreen of a mobile device [
2]. This kind of attack relies on the smudge left behind by the user’s fingers on the touchscreen to infer information on the typed digits. Finally, a variety of side-channel attacks have been investigated for mobile devices [
3,
4,
5,
6,
7]. Here, the side-channel information is given by the movements done by the user while inserting the PIN. These movements can be acquired by the built-in motion sensors and used to infer the secret digit combination. For example, in [
7] it has been shown that a 4-digit PIN can be correctly recovered with an 84% success within 20 tries.
Several solutions have been proposed to make a PIN, or an alphanumeric password, more robust against these kinds of attacks. In some works, the PIN is entered using touch gestures substituting the keystrokes, making it more secure against shoulder surfer and side-channel attacks [
1,
8]. In [
3], the effectiveness of side-channel attacks is reduced by adding Gaussian noise to the motion sensor data. However, this data perturbation also affects the accuracy of the sensors and their utility. In [
9], the actual PIN digits are inserted alternated with misleading values, on the basis of the screen brightness. Since the screen brightness value is not visible to screen recording techniques, this authentication method is resilient against side-channel and spyware-based attacks. In [
10], the user is requested to draw the digits of the PIN on the touchscreen. In this way, the user’s drawing traits are used as a further authentication measure, beyond the secrecy of the PIN. Finally, keystroke dynamics information, describing the person’s typing rhythm, can be used to enhance the security of alphanumeric passwords [
11,
12], or to provide free-text authentication [
13].
Other studies proposed authentication methods completely based on behavioral biometrics, which are recurrent patterns typical of each user behavior [
14,
15,
16]. Most solutions utilize wrist-worn devices, such as smartwatches. In [
17,
18,
19], these devices are used to collect wrist movements while the user performs a specific gesture. Thus, the identity of the person wearing the device is verified from these motion data. In [
20,
21] wrist movements are analyzed jointly with mouse and keystroke activities. The correlation between these activities is used to provide Continuous Authentication (CA). CA can be provided also on the basis of the behavioral traits contained in the movements recorded by smartphones [
22,
23]. Here, the user is authenticated while performing daily life activities such as sitting, walking, and running. In [
24], CA on mobile devices is achieved by exploiting app-usage information. However, authentication methods solely based on behavioral biometrics might be not enough accurate due to the irregular nature of the movements [
25].
In practical authentication, we can identify two main requirements that need to be met. Firstly, a very high level of security is required, i.e., only the smartphone owner should be able to access the service. Because of this requirement, authentication methods purely based on behavioral biometrics are not reliable enough to be suitable in practical applications. Secondly, the smartphone owner should take little effort to access the service. This is a crucial requirement since many authentication systems are accessed multiple times every day, such as screen unlocking. For this reason, related work aiming at strengthening the PIN security with additional user actions, e.g., gestures or drawings, may fail to satisfy this requirement [
9,
10]. In this work, we aim at providing a highly secure authentication method that satisfies both these two challenges. This is realized by including the traditional PIN in the authentication and capturing sensor data while the user is inserting it. Thanks to this methodology, for an attacker it becomes harder to access the system since it needs to both steal the PIN and be allowed by the anomaly detector. At the same time, the process does not require additional effort from the user except entering the usual PIN.
In this work, we propose a novel authentication method that uses behavioral biometrics to increase the PIN security. Assuming that a correct PIN is inserted in a smartphone, our method verifies whether the user who typed the PIN was the actual smartphone owner or an attacker. To this end, the smartphone movements are recorded during the PIN insertion through built-in motion sensors, present in every smartphone. Then, an anomaly detection-based system evaluates whether these movements represent an inlier (i.e., the smartphone owner typed the PIN), or an anomaly (i.e., an attacker typed the PIN). We implement and test our authentication method using four common anomaly detection algorithms: Principal Component Analysis (PCA), Kernel Principal Component Analysis (K-PCA), One-Class Support Vector Machine (OC-SVM), and Local Outlier Factor (LOF). Finally, their performances are assessed and compared on the basis of real data. More precisely, we exploit the fact that a user needs to type
N times in the case of an
N-digit PIN. This offers
N samples of the motion sensors that can be combined to increase the performance of the anomaly detectors as
N increases. At the same time, this process does not require further actions from the users, differently from related works on behavioral biometrics. Furthermore, since the movements are recorded by the smartphone, we do not assume the presence of a smart bracelet to acquire behavioral biometrics (to promote reproducible research, the simulation code is available at:
https://github.com/matteonerini/augmented-pin-authentication, accessed on 27 May 2022).
The rest of the paper is organized as follows. In
Section 2, we present our anomaly detection-based authentication method and the sensor features that are involved. In
Section 3, we briefly describe the four anomaly detection algorithms considered in this paper. In
Section 4, we describe the real-world data acquisition process and assess the obtained accuracy through real experiments. In
Section 5, we highlight the reasons behind the obtained results and possible applications of our research. Finally,
Section 6 contains the concluding remarks.
Throughout the paper, vectors and matrices are denoted with bold lower and bold upper letters, respectively. Scalars are represented with letters not in bold font. stands for transposition and is the -norm of a vector.
2. Methodology
Let us assume that an N-digit PIN is used as an authentication method on a smartphone device. This PIN can guarantee authentication to access any service of practical interest, i.e., screen unlocking or mobile banking. The idea behind this authentication method is that only the smartphone owner knows the PIN. Thus, if an attacker could steal such a combination, he would be able to break the authentication. In this paper, we strengthen the security of this authentication method by verifying whether the correct PIN has been inserted by the actual smartphone owner. This is realized assuming that users hold their smartphone and type the PIN in a personal manner. As a result, different users can be distinguished on the basis of the smartphone movements they produce while inserting the PIN.
2.1. Feature Selection
To improve the authentication security, we assume that the smartphone movements are captured for each digit composing the PIN, i.e., for each keystroke. Movements are sampled from built-in sensors and represented by a total of
D features. Three categories of sensors are supported by Android OS: motion sensors, environmental sensors, and position sensors [
26]. For our purposes, we consider only motion sensors, whose values are provided according to a coordinate system defined with respect to the device screen [
26]. More precisely, the
axis is horizontal and points to the right, the
axis is vertical and points upward and the
axis is perpendicular to the screen of the device, as shown in
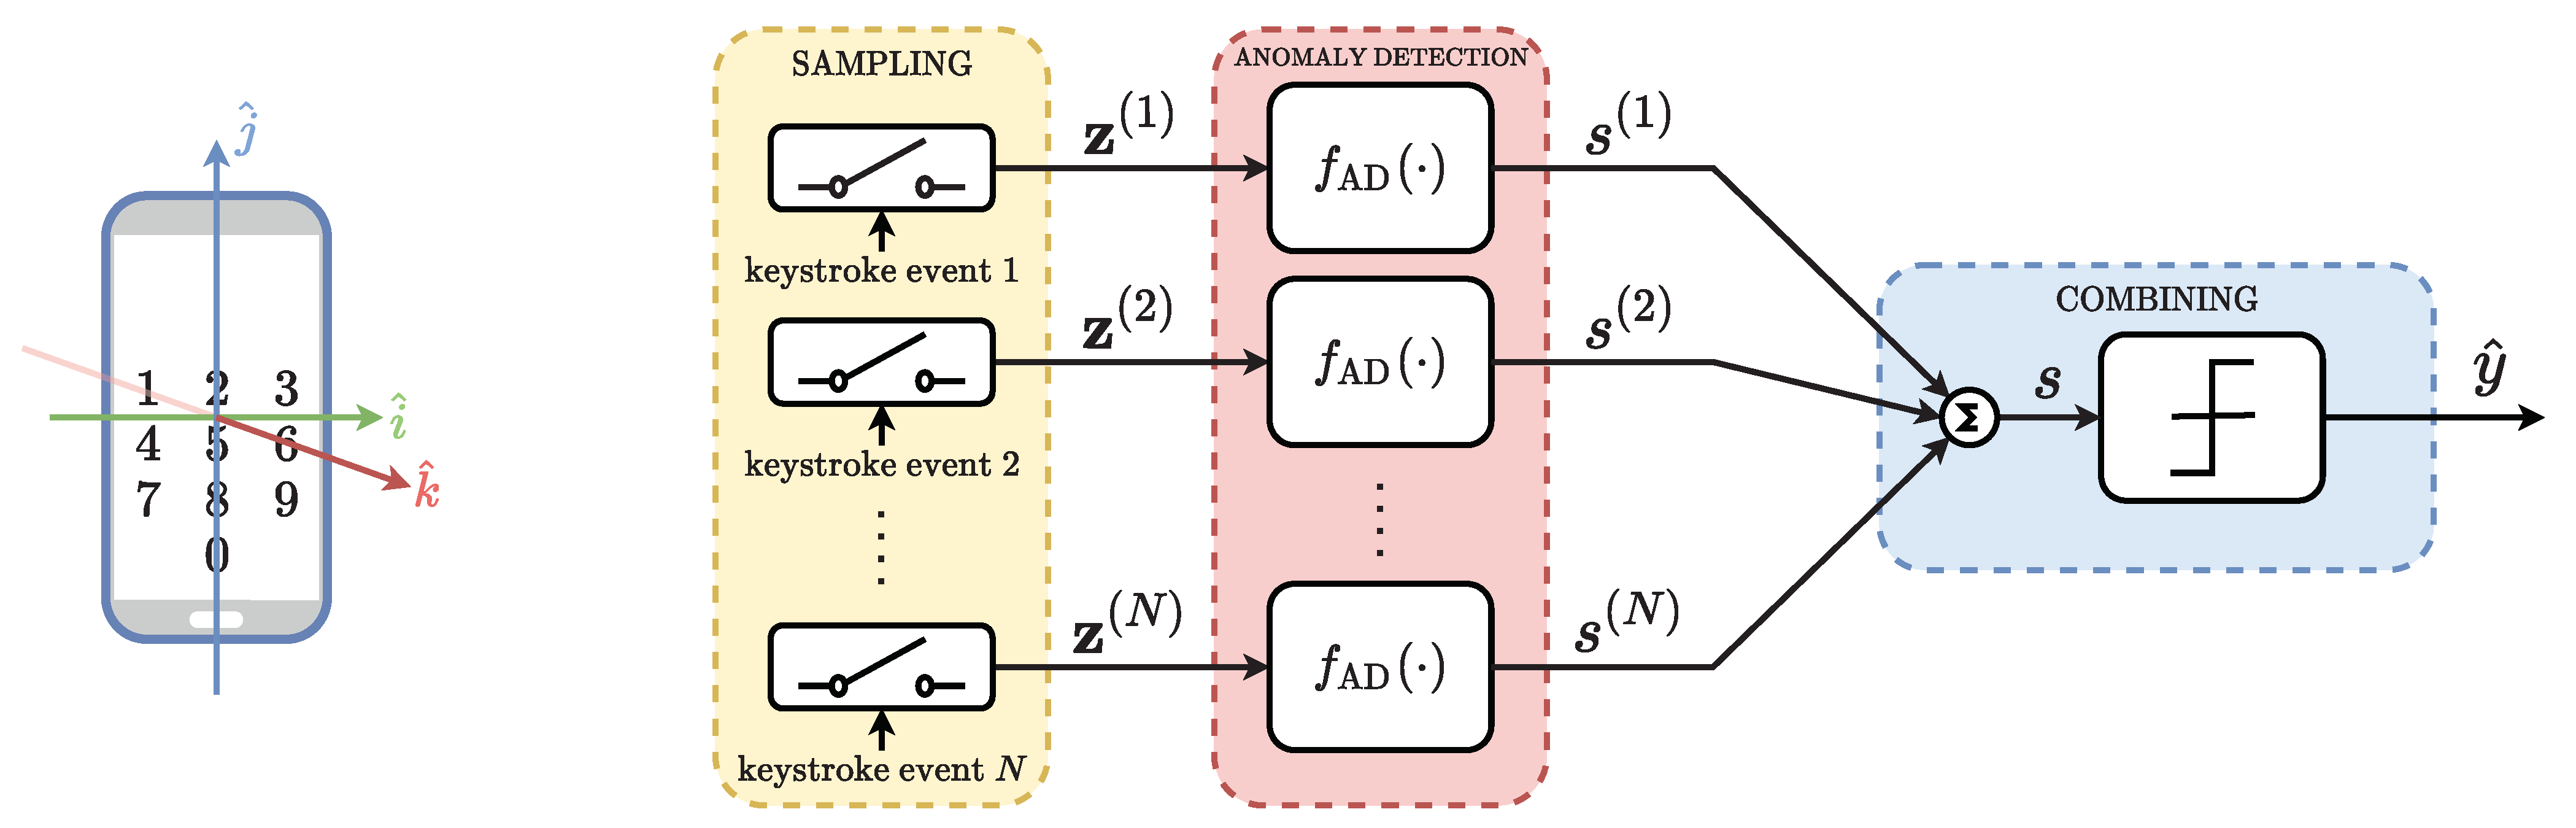
Figure 1. We select six relevant sensors to fully characterize the smartphone movements, which are described below:
The Accelerometer measures the total acceleration, given in , experienced on the three axes .
The Gravity sensor gives the components of the gravitational acceleration g in along each direction .
The Gyroscope measures the angular speed, in , around the three device axes . The rotation is positive in the counter-clockwise direction.
The Linear Acceleration indicates the acceleration experienced along each device axis , without the gravity contribution.
The Rotation Vector is composed of three dimensionless components and it represents the rotations of the device axes with respect to the east, the geomagnetic north, and the zenith, respectively.
The Orientation sensor returns an array of three angles: the azimut, i.e., is the angle between the geomagnetic north direction and the device axis; the pitch, i.e., is the angle of rotation around the axis; and the roll, which is the angle of rotation around the axis.
Each of these six sensors returns three values, providing a total of 18 values. Among them, the ones referring to the cardinal directions are discarded because they are not relevant to our scope. In particular, we do not consider the components of the Rotation Vector taken with reference to the north and east directions, and the azimut value of the Orientation sensor. In addition, we append to the features set the value of the pressed digit, and a further value M, defined as . In conclusion, a total of features have been used to represent the smartphone movement associated with each keystroke.
2.2. Anomaly Detection-Based Authentication
Our ultimate goal is to verify whether a correct
N-digit PIN has been inserted by the actual smartphone owner or by an attacker. To this end, we propose an anomaly detection-based method composed of three stages, as represented in
Figure 1.
Firstly, in the sampling stage, the N-digit PIN is inserted through N keystrokes by the user, who can be the smartphone owner or an attacker. At each keystroke, the considered motion sensors are sampled and the D features are collected. We denote with the vector containing the D features corresponding to the n-th PIN digit, with .
After that, in the anomaly detection stage, N anomaly detectors are independently computed. The n-th anomaly detector evaluates whether the n-th digit has been inserted by the actual smartphone owner on the basis of the feature vector . The function represents, in general, any anomaly detector. In this study, we consider four different anomaly detection algorithms and we compare their performance: PCA, K-PCA, OC-SVM, and LOF. We denote with the scalar the output of the n-th , representing the anomaly score of . A low suggests that the n-th digit has been inserted by an attacker, i.e., it is an anomaly. On the contrary, a high suggests that the n-th digit has been inserted by the actual smartphone owner, i.e., it is an inlier.
Finally, the
N anomaly scores are combined in the
combining stage to obtain a more reliable anomaly score
s. The combining operation consists in averaging the
N scores; thus,
s is obtained as
Based on the value of s, the final decision is taken, with . If s is below a certain threshold , the whole PIN is considered inserted by an attacker, i.e., . In this case, the authentication system could ask the user to reinsert the PIN in practical developments. Otherwise, the smartphone owner’s identity is verified, i.e., , and the user is allowed to access the requested service. Intuitively speaking, in this third stage, we exploit the diversity offered by the digits composing the PIN to enhance the performance of our authentication method. Thus, longer PINs offer greater authentication accuracy.
3. The Adopted Anomaly Detection Algorithms
In this study, we explore the performance of four ML techniques commonly used for unsupervised anomaly detection tasks [
27,
28,
29], implemented in Python with the Scikit-learn library [
30]. In this section, we briefly recall the algorithms and the chosen hyperparameters, which have been tuned through 5-fold cross validation [
31].
In the following, denotes the training set matrix, whose rows are the inliers training points, contains the inliers test points, and contains the anomalies test points. Let us define the offset as the row vector containing the column-wise mean of the matrix , and the scaling factor as the row vector containing the column-wise standard deviation of the matrix . Before proceeding with the anomaly detection, the features in the matrices , , and are centered and normalized by subtracting to each row the offset and dividing each row element-wise by the scaling factor . The resulting data matrices are denoted by , , and .
3.1. Principal Component Analysis
PCA is a technique that realizes linear dimensionality reduction by mapping the training data from the
D-dimensional feature space
into a subspace
, where
in our problem, and
is the number of principal components selected. The subspace is determined such that it minimizes the error (defined as Euclidean distance) between the data in the feature space and their projection in the selected subspace [
32]. In more detail, to find the best subspace to project the training data, we need to evaluate the
sample covariance matrix
By eigenvalue decomposition, can be factorized as , where is an orthonormal matrix whose columns are the eigenvectors, while is a diagonal matrix containing the D eigenvalues. The eigenvalues’ magnitude represents the importance of the direction pointed by the relative eigenvector. Let us assume that the eigenvalues in are ordered in descending order and that the eigenvectors in are ordered accordingly. To select the first P components of the subspace, the matrix containing the first P columns of needs to be considered. Hence, the projection into the subspace is obtained by multiplying the data by , i.e., , , and . To evaluate the error between the projected points and the original ones it is necessary to reconstruct the data in the original feature space, i.e., , , and .
After the reconstruction, it is possible to evaluate the anomaly score as the opposite of the Euclidean distance between the original data and reconstructed data. Thus, given a generic point
, its anomaly score is given by
where
is the reconstructed version of
. Since the PCA has been trained on inlier samples, a
with a high
s (i.e., close to zero) is likely to be an inlier. Conversely, a low
s indicates the presence of an anomaly. The value of
P is a hyperparameter that needs to be optimized. A too high
P would yield a good reconstruction quality for all the samples (both inliers and anomalies), while a too low
P would significantly compress the feature space lowering the reconstruction quality. In both these extreme cases, the task of differentiating inliers and anomalies would become hard. In our PCA implementation, through 5-fold cross validation, we verified that the subspace dimensionality
ensures the optimal trade-off between reconstruction quality and compression.
3.2. Kernel Principal Component Analysis
Differently from PCA, K-PCA firstly maps the data with a non-linear function, named kernel, then applies the standard PCA to perform a linear dimensionality reduction in the new feature space. As a result, such dimensionality reduction becomes non-linear in the original feature space. A crucial point in K-PCA is the selection of the kernel that leads to linearly separable data in the new feature space. In [
33], when the data distribution is unknown, the Radial Basis Function (RBF) kernel is proposed as a good candidate to accomplish this task. With this kernel, a generic point
is mapped in the vector
. Specifically, given the vector
, we can apply the RBF as
with
. In this transformation,
is the kernel coefficient controlling the width of the Gaussian function,
is the
i-th row of
, and
is the
i-th component of the point
in the kernel space. Remapping all the data in the kernel space, we obtain the following matrices:
for training,
for testing on inliers, and
for testing on anomalies.
Applying now the PCA to the new data sets, it is possible to perform non-linear dimensionality reduction from the original feature space to a subspace
. Finally, the anomaly score can be again calculated as in (
1). In our K-PCA implementation, the hyperparameters set through 5-fold cross validation are
and
. The kernel coefficient
influences the sensitivity to differences in feature vectors. A too large
would cause overfitting, meaning that only points extremely close to the training set would be classified as inliers. Conversely, a too small
would make it impossible to distinguish between inliers and anomalies. The meaning of
Q is similar to the meaning of the parameter
P, previously introduced for PCA.
3.3. One-Class Support Vector Machine
The OC-SVM algorithm has the objective of learning a close frontier delimiting a given training set
, as introduced by Schölkopf et al. in [
34]. In this way, a new point is classified as an inlier if lying within this frontier, or as an anomaly otherwise. The main idea is to map the training data into a different feature space with a fixed transformation and to separate them from the origin with a maximum margin. We denote with
this fixed feature space transformation. Thus, the goal is to learn the weights
and the maximum margin
by minimizing the objective function as follows
where
is the margin violation for the training point
. In the objective function to be minimized, the hyperparameter
controls the strength of the regularization term
. Furthermore, it can be proven that
is an upper bound on the fraction of training points outside the estimated frontier, and a lower bound on the fraction of support vectors [
34,
35]. Assuming that
and
solve the problem, the anomaly score is defined for a generic point
as
which can be referred to as the signed distance between
and the separating hyperplane. Since the variables
penalize the objective function,
s is likely to be positive for most training samples.
The aforementioned optimization problem can be solved through its dual [
34], defined as
where
are defined such that
and
is the kernel [
36]. In this way, the anomaly score (
2) of a sample
can be rewritten as
In our OC-SVM implementation, we use an RBF kernel defined by
where
and
are two generic points [
37]. Furthermore, the hyperparameters
and
have been chosen on the basis of 5-fold cross validation. As anticipated,
is the hyperparameter controlling the strength of the regularization term
in the objective function. With a very low
, the contribution of the regularization term would be negligible, and the weights
would be learned with no restriction. In this case, overfitting would be likely to occur. Conversely, with a too high
, it would be harder to learn a meaningful frontier since
would tend to zero.
3.4. Local Outlier Factor
The LOF algorithm identifies anomalies based on the local density of points within the dataset [
38]. This unsupervised learning technique receives in input a set of points composed by the training set
, containing examples of inliers, and a new point
, which has to be classified as an inlier or anomaly. The main intuition is that the density of the samples around an anomaly, also called an outlier, should be significantly lower than the density around its neighbors. To formalize this concept, the
k-distance of
, denoted as
has been introduced as the Euclidean distance between the point
and its
k-th nearest neighbor [
38]. The
k-distance is used to define the reachability distance of
from
as
where
denotes the Euclidean distance between
and
. Thus, the formal notion of density around
used in the LOF algorithm is given by the local reachability density of
, defined as
where
denotes the set of the
k-nearest neighbors of
. In other words, the local reachability density can be interpreted as the inverse of the average reachability distance of
from its
k neighbors. Finally, the local reachability density of
is compared with those of the neighbors in the local outlier factor metric, defined as
According to this definition, is the average local reachability density of the k neighbors divided by the local reachability density of .
A
value close to 1, or less than 1, is an indicator that the observation is an inlier. On the other hand, a
much greater than 1 indicates the presence of an anomaly, since the density of points around
is much less than the densities around its
k-nearest neighbors. In our LOF implementation, the threshold which discriminates between inliers and anomalies is set to
, as in the original paper [
38], and we select
with 5-fold cross validation. Note that the higher the threshold
, the more samples are accepted as inliers. Moreover, the effect of the neighborhood size
k is to determine the amount of local information to capture. Finally, the anomaly score of a sample
in the output of the LOF anomaly detector is
In this way, negative scores represent anomalies, while positive scores represent inliers.
The four considered anomaly detectors are summarized in
Table 1. To summarize, the four considered anomaly detectors are characterized by different anomaly scores, as defined in (
1), (
3) and (
4). These scores have all been designed such that high values correspond to inliers, while low values correspond to anomalies.
5. Discussion
The fundamental assumption behind this paper, and in general behind all the studies on behavioral biometrics, is that each user has a personal way to interact with their devices. In our case, we assume that the users hold their smartphone and type the PIN in a personal manner. To validate this assumption, we carried out extensive experiments with real-world data collected on volunteers. The numerical results corroborate the validity of the assumption that each user has a personal way to interact with their devices. To observe the personal traits of the users, we asked our recruited students to naturally hold their smartphones with one hand. This was needed in order to capture significant movement variations with the build-in sensors. For instance, if the smartphone is lying on a table while the PIN is inserted, no behavioral biometric could be observed from the motion sensors and the PIN security could not be improved. In the case of practical development, this limitation could be overcome by asking the user to always insert the PIN in their natural way taking care that the smartphone is not in contact with external objects.
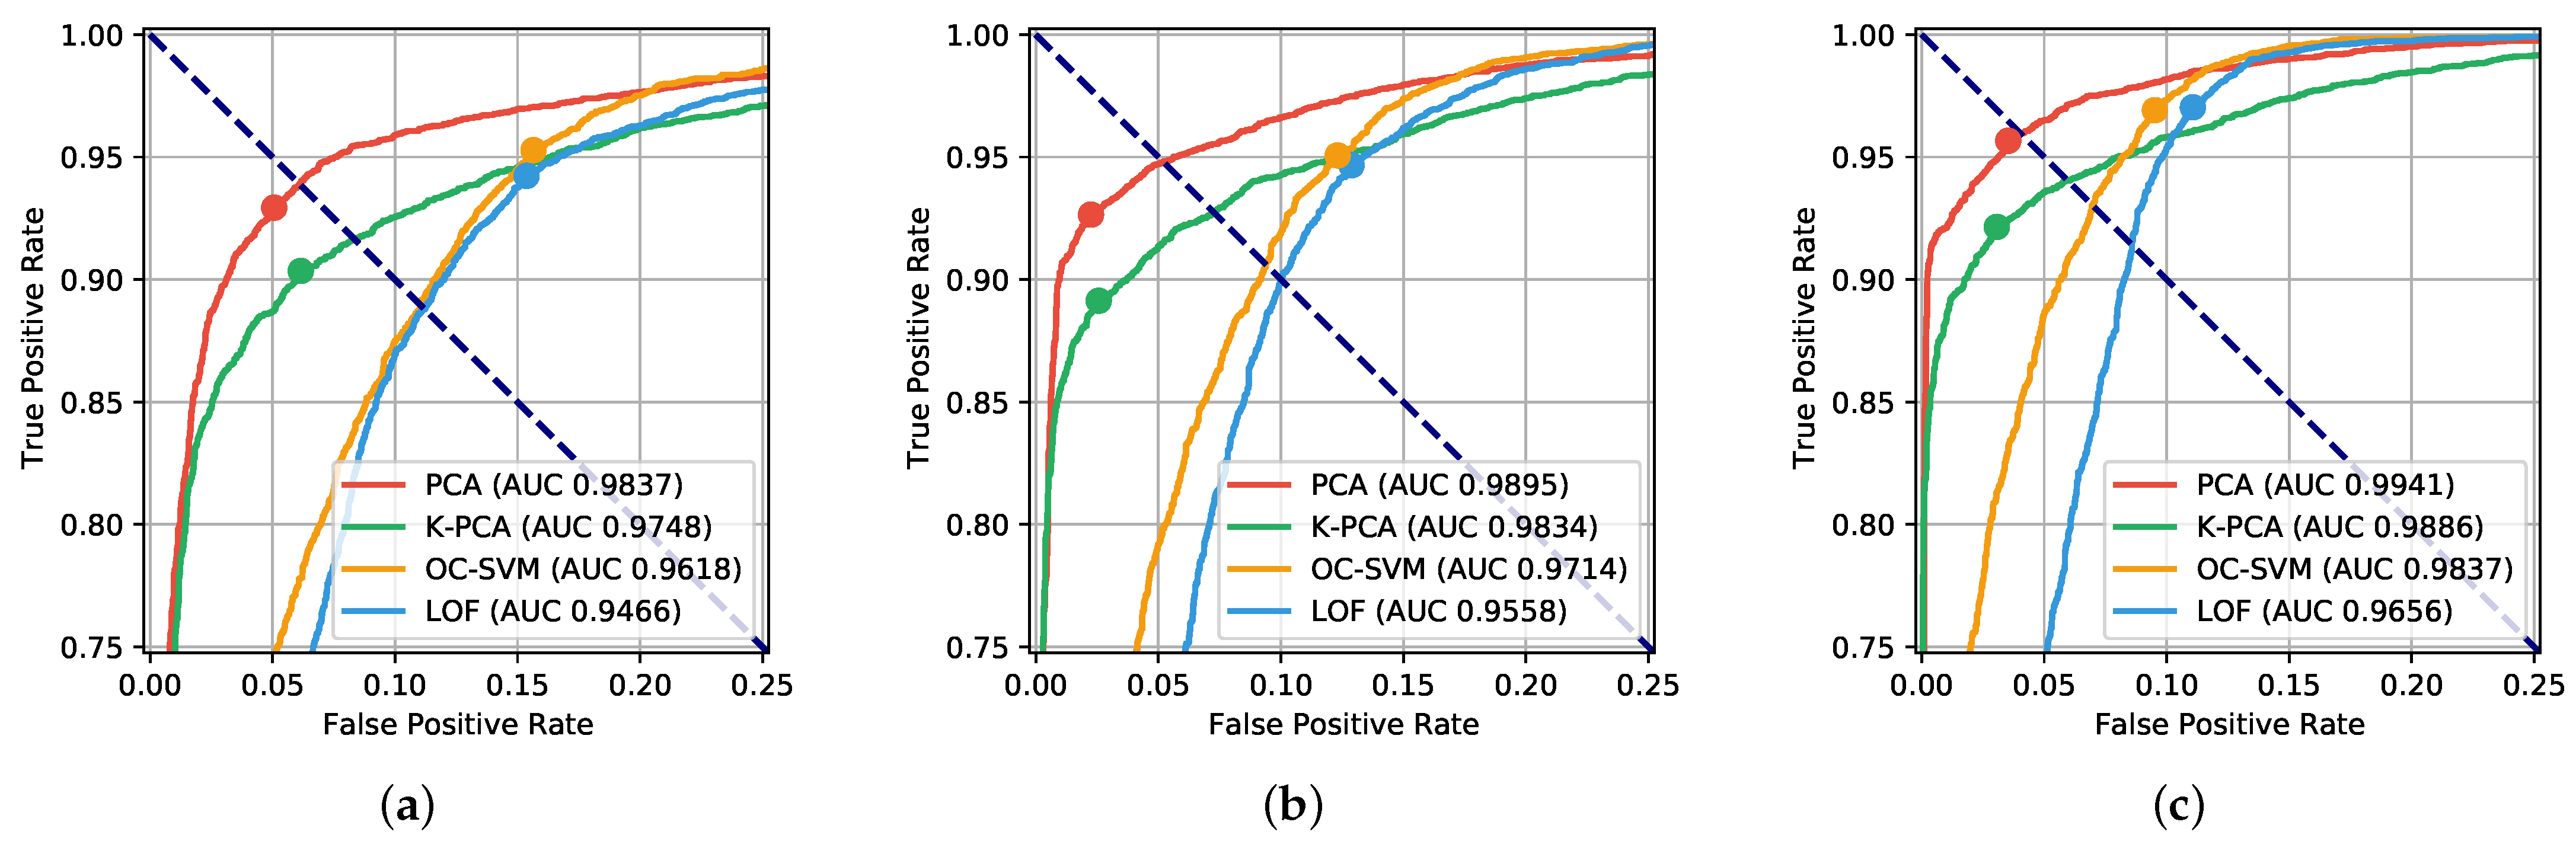
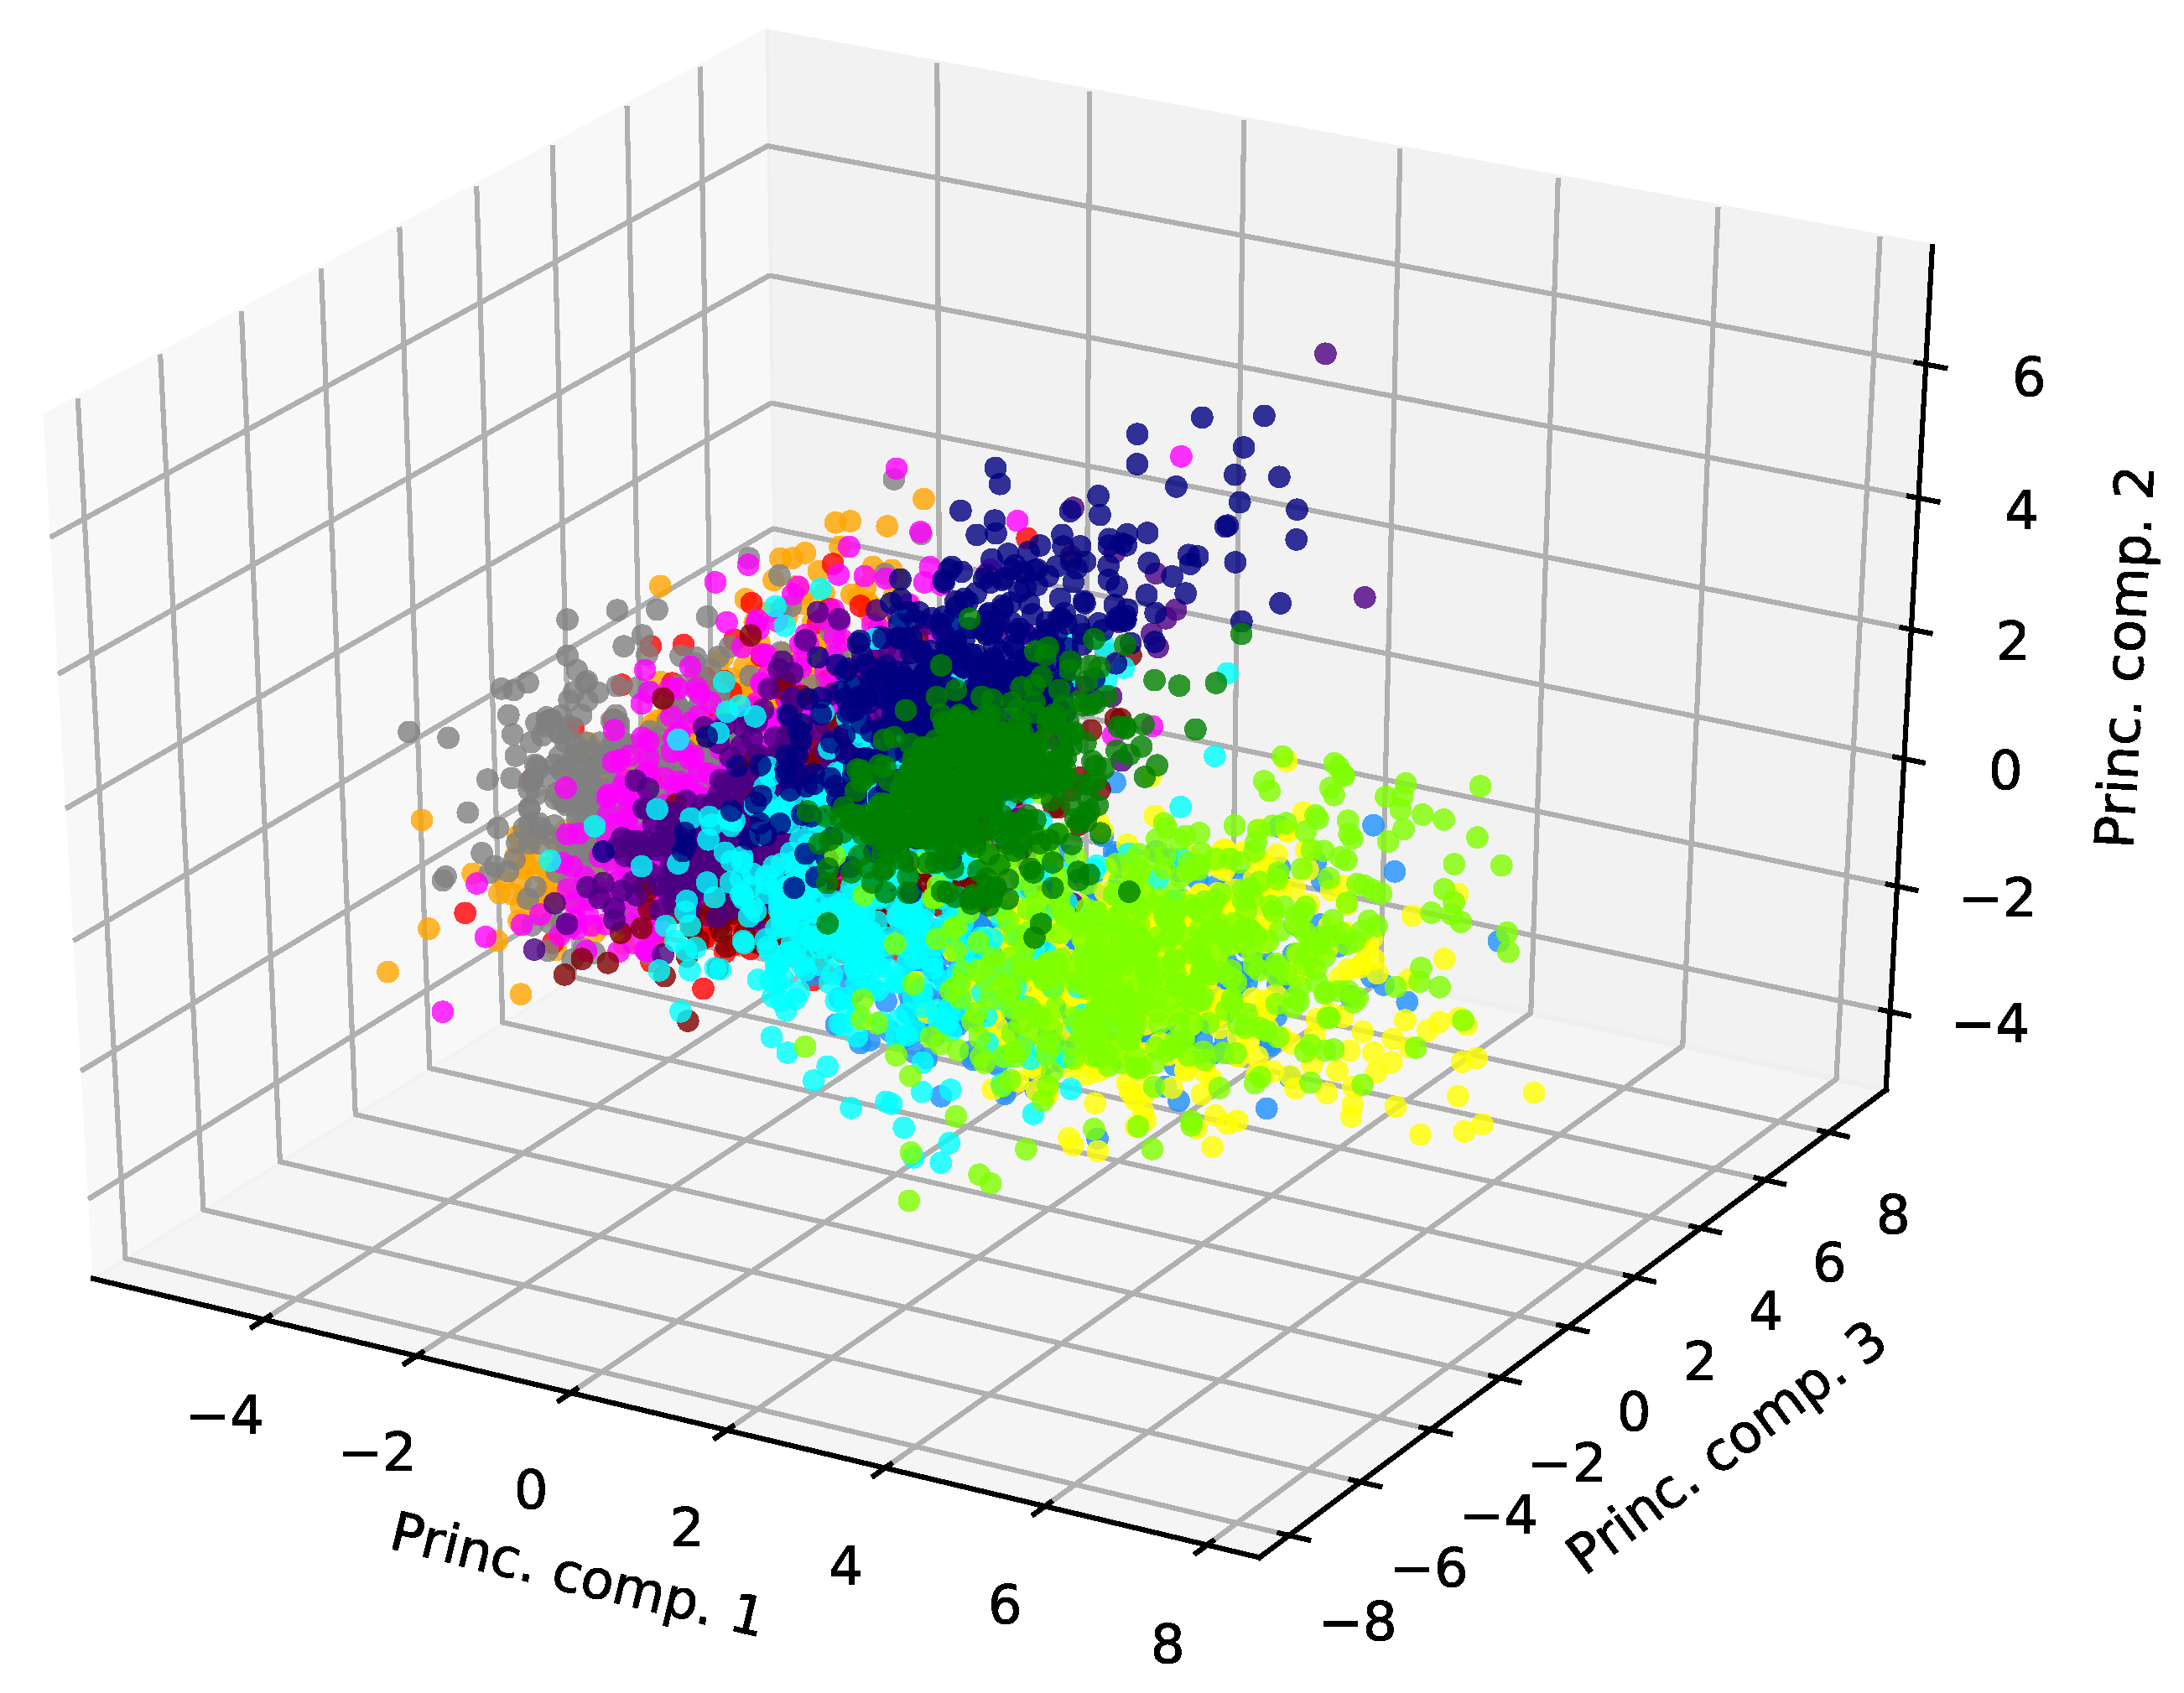
To explain this high performance obtained by our authentication method employing PCA, we inspect the dataset after applying dimensionality reduction through PCA. In
Figure 5, we report the entire dataset, composed of 470 samples per student, projected along its first three principal components. Here, the samples corresponding to each user, identified by a unique color, are distributed in well-defined clusters, even when observed with a very limited dimensionality, i.e.,
. Because of this property, PCA can distinguish the samples entered by the different students, obtaining a high authentication accuracy. In fact, we calculated that the total percentage of variance explained by the first
principal components is
The reason behind the high performance of the PCA detector is that sample points of the same user are clustered in clouds. However, failure cases for the method are given by those points that are far from the center of their cluster. These points are easily misdetected by the method and may represent false positives or false negatives. The underlying cause of these failure cases is that the behavior of a user is not necessarily repetitive. In fact, a user may assume an unusual pose for only a few samples, which are represented by points far from the center of the user cluster.
With the widespread use of smartphone applications, there is an increasing need to protect the user’s privacy and security. The main applications that could benefit from our authentication system can be classified into four categories. First of all, screen unlocking is the most common security method adopted in smartphones. It is realized through the insertion of a PIN on a numeric keypad or a pattern on a grid of points. Thus, our authentication method can greatly contribute to strengthening the security of the PIN when used for screen unlocking purposes. Second, social network applications are a popular target of attackers willing to impersonate the device owner. In mobile devices, this risk is particularly high since users tend to be constantly logged in to the application, to avoid inserting the login credential at every access. A fast authentication method for these applications could be implemented through a short PIN strengthen by our anomaly detection-based method. Third, multimedia data such as photos and videos can be protected by creating secure folders on modern smartphones. To access such secure folders a PIN is commonly employed. However, given the paramount importance of preserving users’ privacy, the authentication method proposed in this paper could increase the PIN security to access these secure folders in smartphones. Lastly, transaction applications such as credit card and bank applications are ubiquitous nowadays. In recent years, virtual banks and home banking services increased their popularity, giving the user the possibility to perform transactions by solely using the smartphone. Before each transaction, our method could be employed to provide stronger user authentication, on top of the widely utilized numeric PINs.
6. Conclusions
In this study, we strengthen the security of N-digit PIN authentication on mobile devices by using behavioral biometrics. To this end, we propose a novel method to verify whether the correct PIN has been inserted by the actual smartphone owner or by an attacker. This method is based on 17 features extracted from the built-in smartphone motion sensors, and on the assumption that each user enters the PIN in a personal manner, learnable with anomaly detection algorithms. We implement our authentication method by comparing the performance of four different anomaly detectors: PCA, K-PCA, OC-SVM, and LOF.
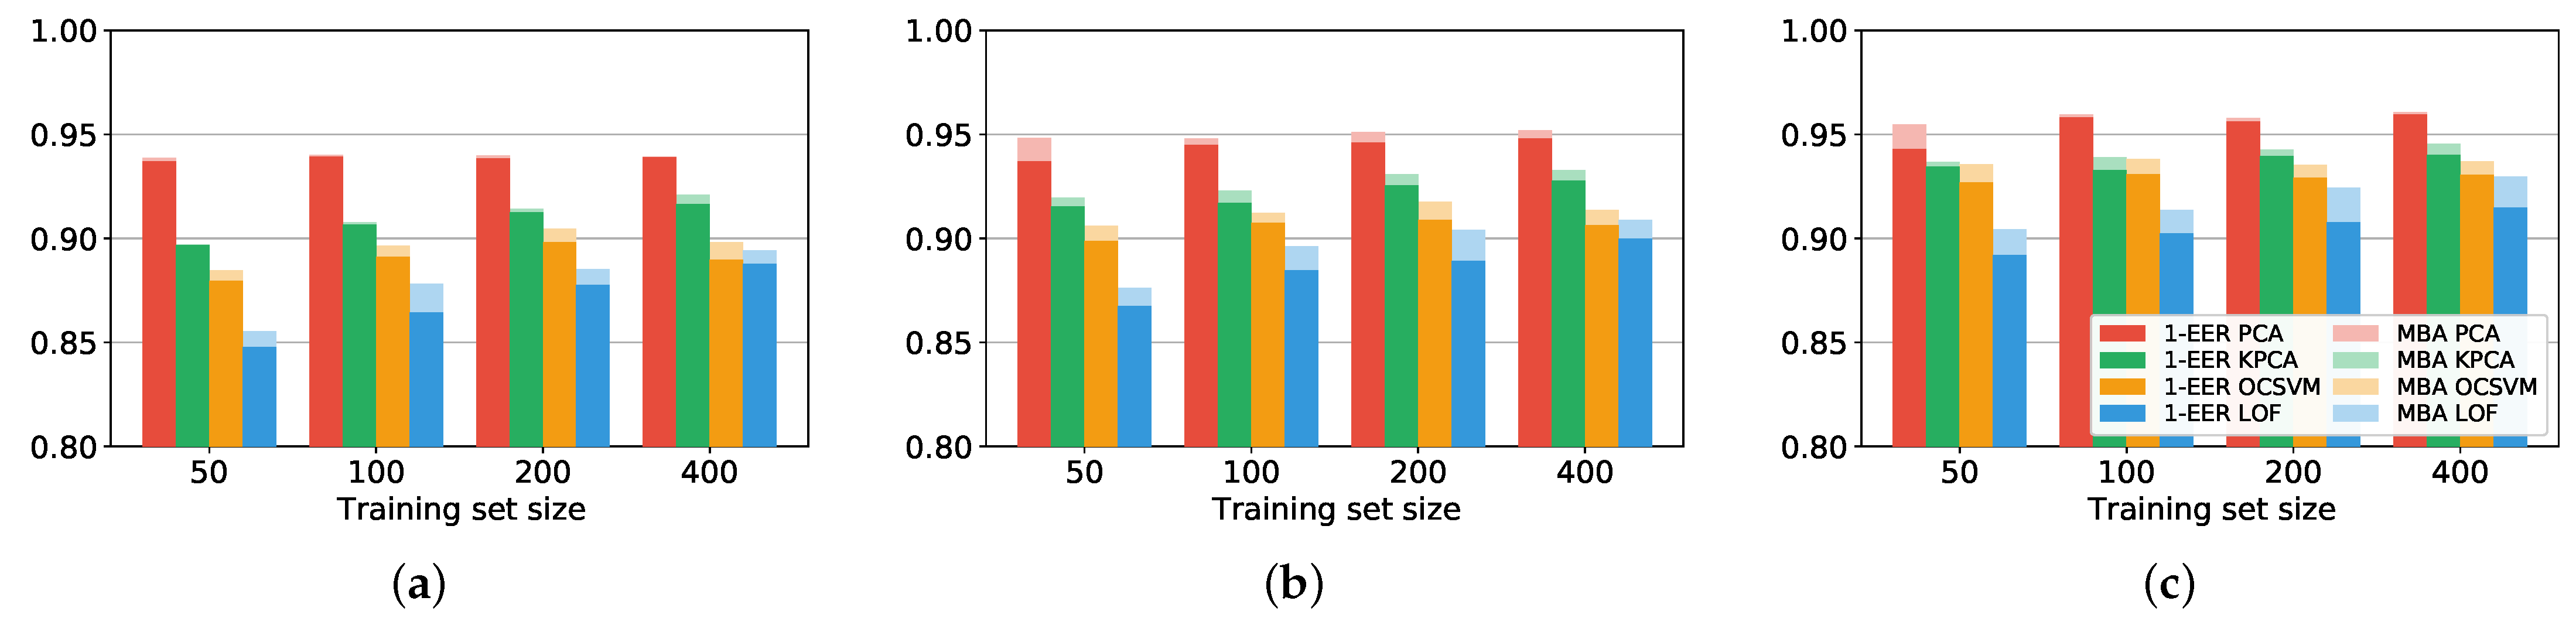
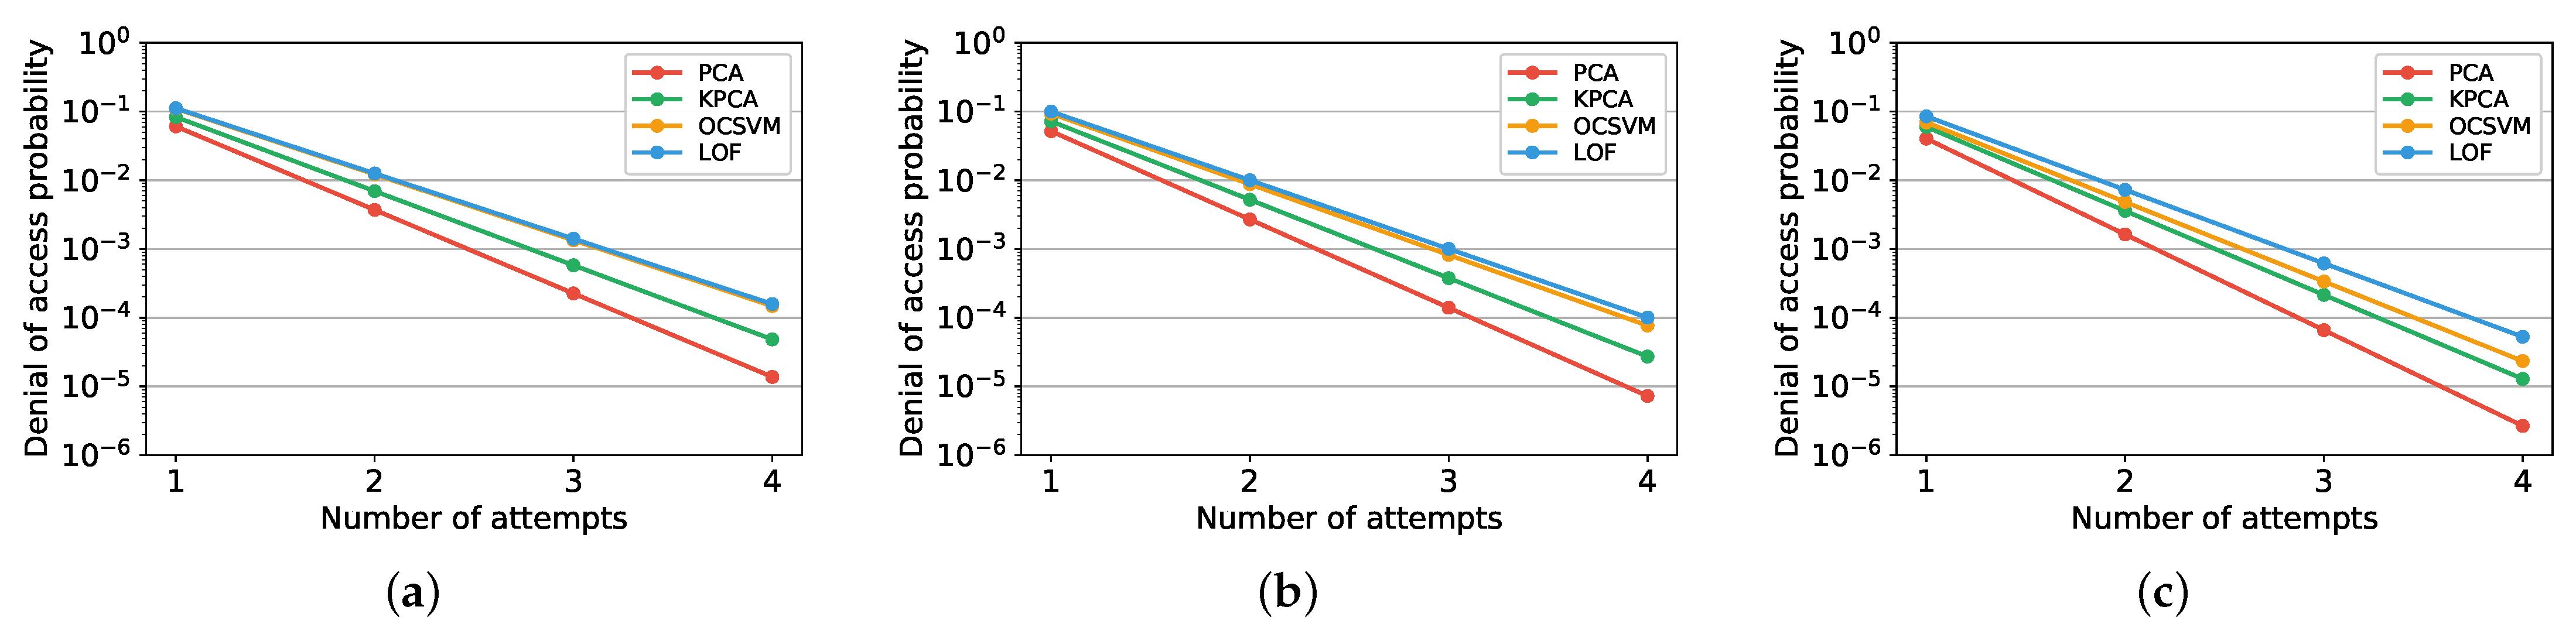
Numerical results show that with PCA it is possible to achieve an EER as low as in the case of 4-digit PINs, and in the case of 6-digit PINs. Thus, in comparison to solely using the PIN as a security measure, the contribution brought by our authentication method can be summarized as follows. If only the PIN is used as an authentication method, an attacker who successfully stole the PIN is rejected by the system in the of the cases. Conversely, when our method is employed, an attacker who successfully stole the PIN is rejected in the of the cases considering a 6-digit PIN. Furthermore, the performance only slightly decreases when the training set size is reduced from 400 to 50 samples. The practicality of our approach is confirmed by the low processing time required, in the order of fractions of milliseconds for PCA. Compared to a purely PIN-based authentication, the improvement brought by our approach can be summarized as follows. An attacker, that would successfully authenticate by knowing the PIN, is not authenticated in the of cases with our approach.


