
GridAttackAnalyzer: A Cyber Attack Analysis Framework for Smart Grids

 ,
,  ,
,  ,
,
Abstract
:1. Introduction
- We applied graphical security modeling techniques and designed and implemented GridAttackAnalyzer, one of the first smart grid attack analysis frameworks, to enable researchers to easily create, modify the attack experimentation content, and facilitate their interaction with the system.
- We conducted several case studies using various network models, power grid test feeders, and attack types to validate the proposed framework.
- We performed a comprehensive comparison among the existing research on smart grid attack analysis and conducted an user evaluation for the GridAttackAnalyzer to demonstrate the usability of the framework.
2. Background and Related Work
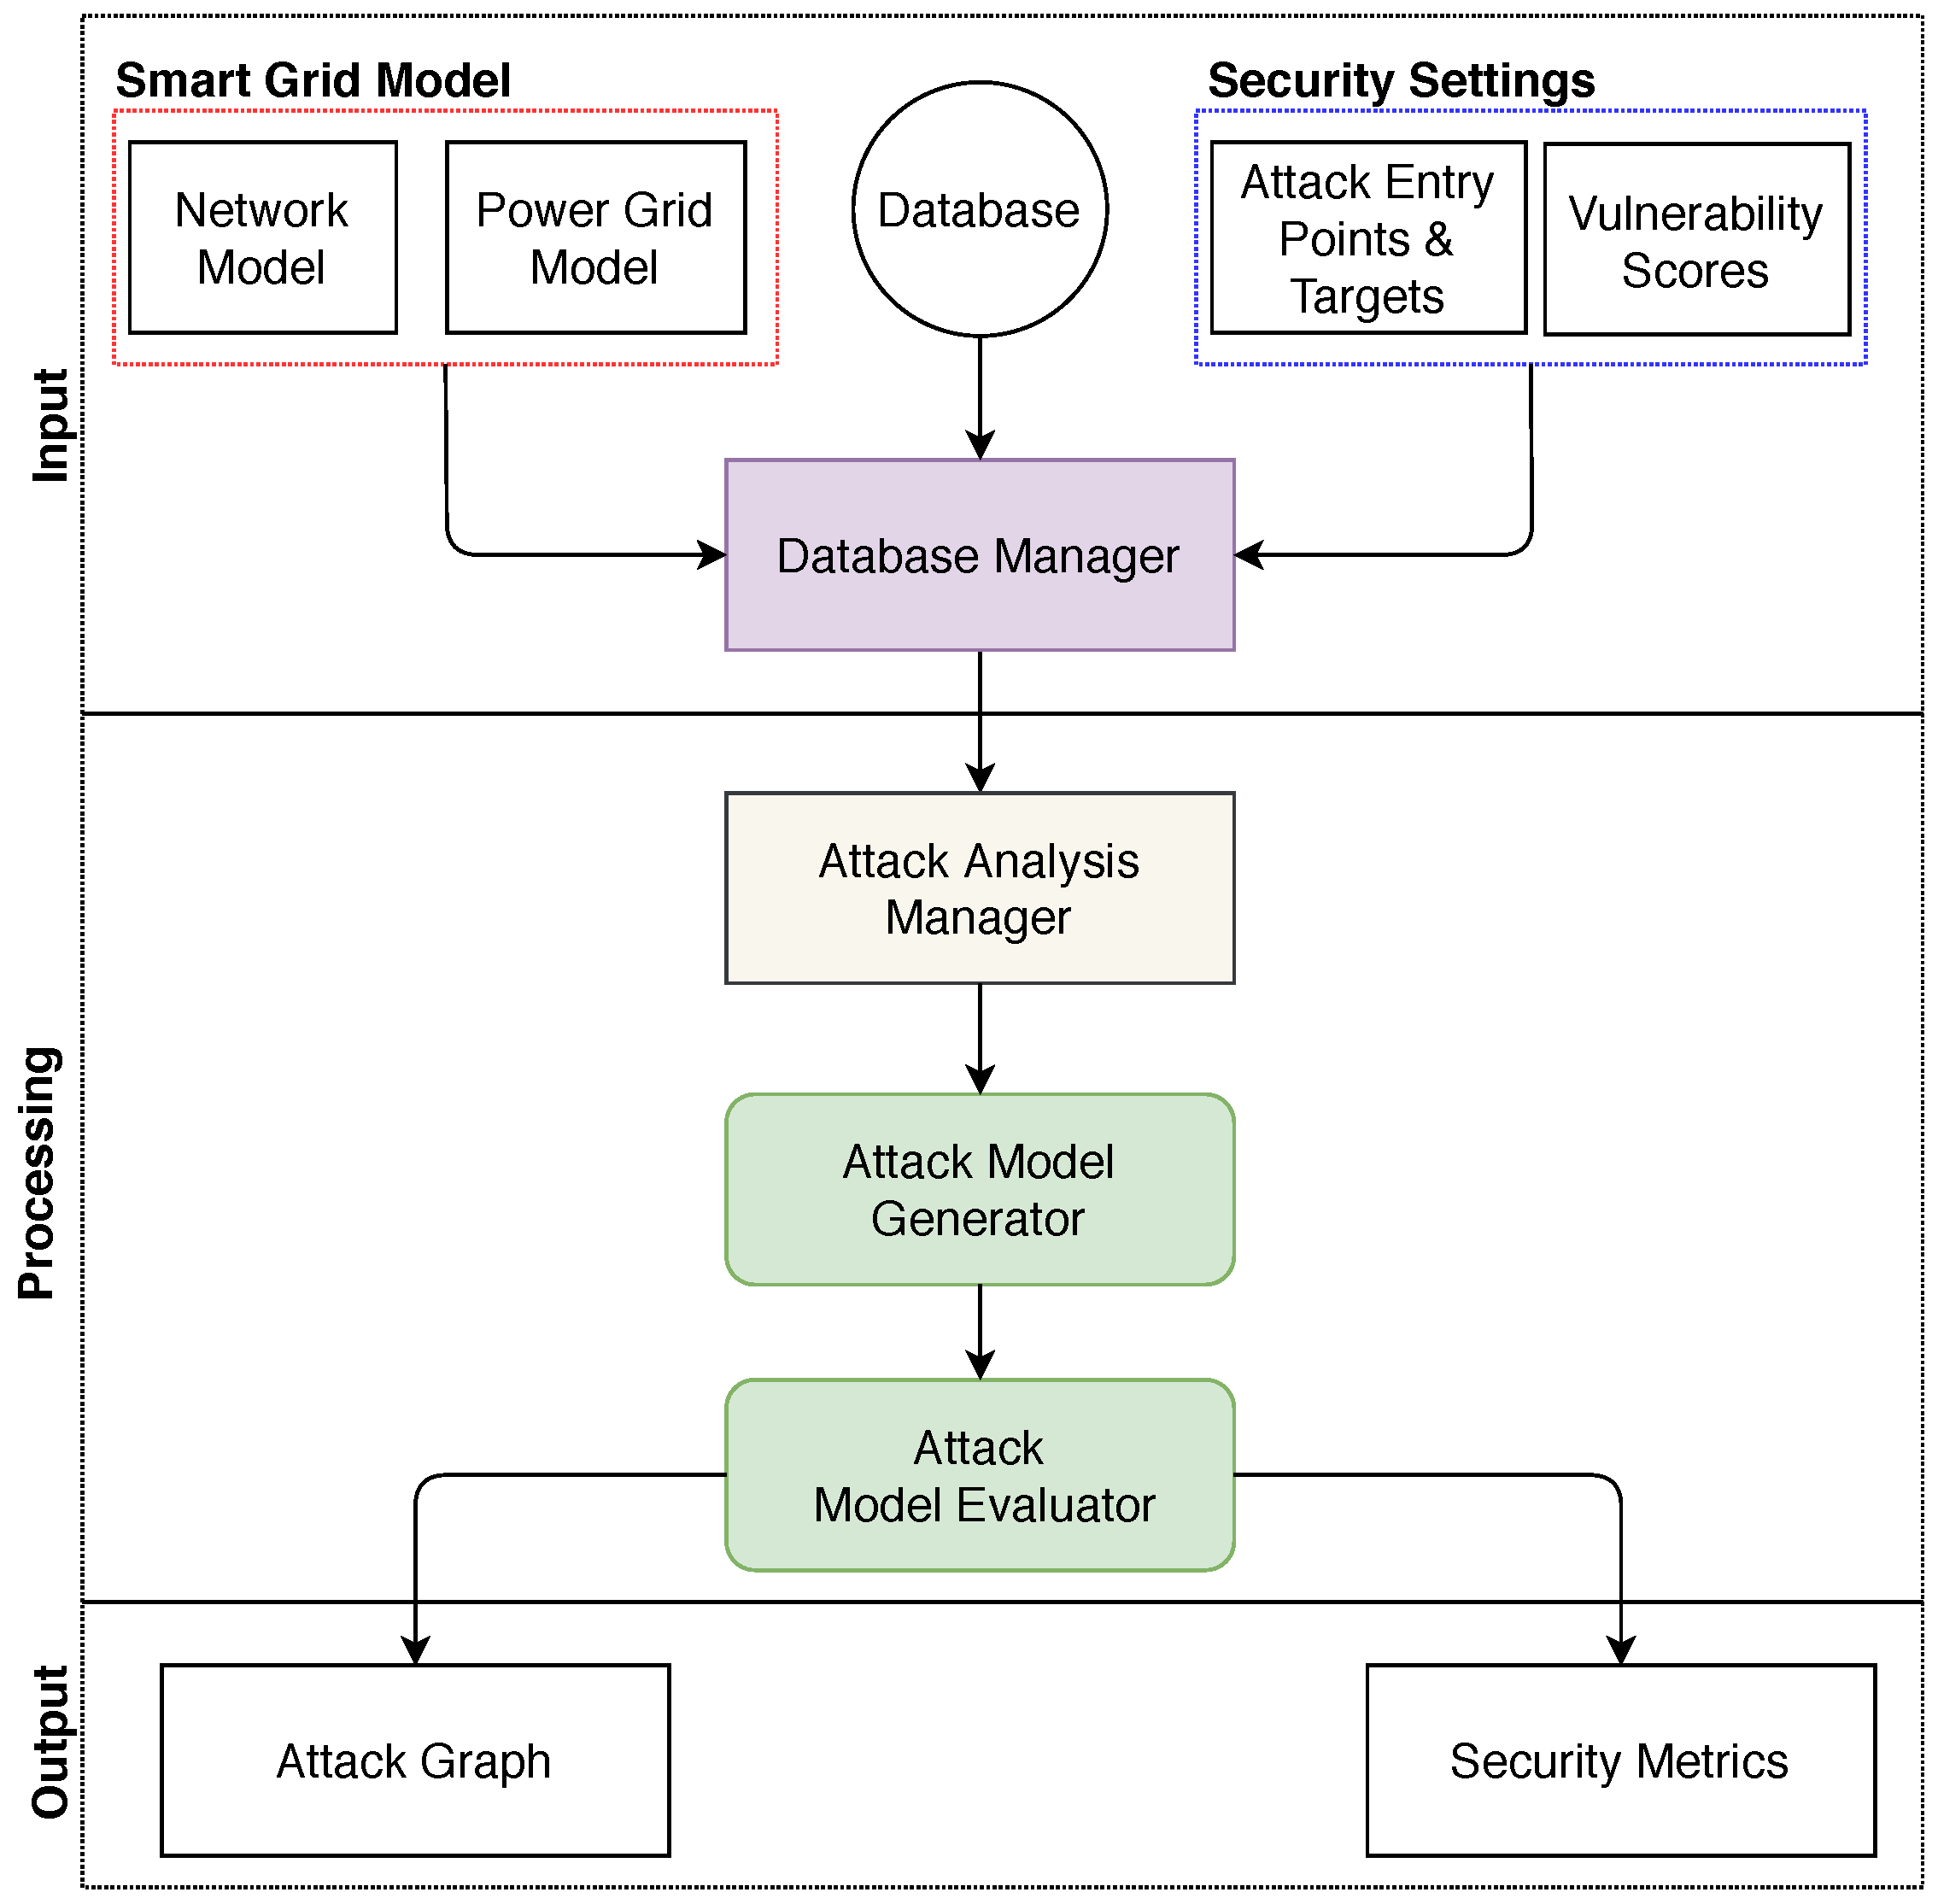
3. GridAttackAnalyzer: Cyber Attack Analysis Framework for Smart Grids
3.1. Input
3.2. Processing
3.2.1. Attack Analysis Manager
3.2.2. Calculation of Security Metrics
3.3. Output
4. Implementation and Analysis Results of GridAttackAnalyzer
4.1. Smart Grid Model
4.1.1. Power Grid Model
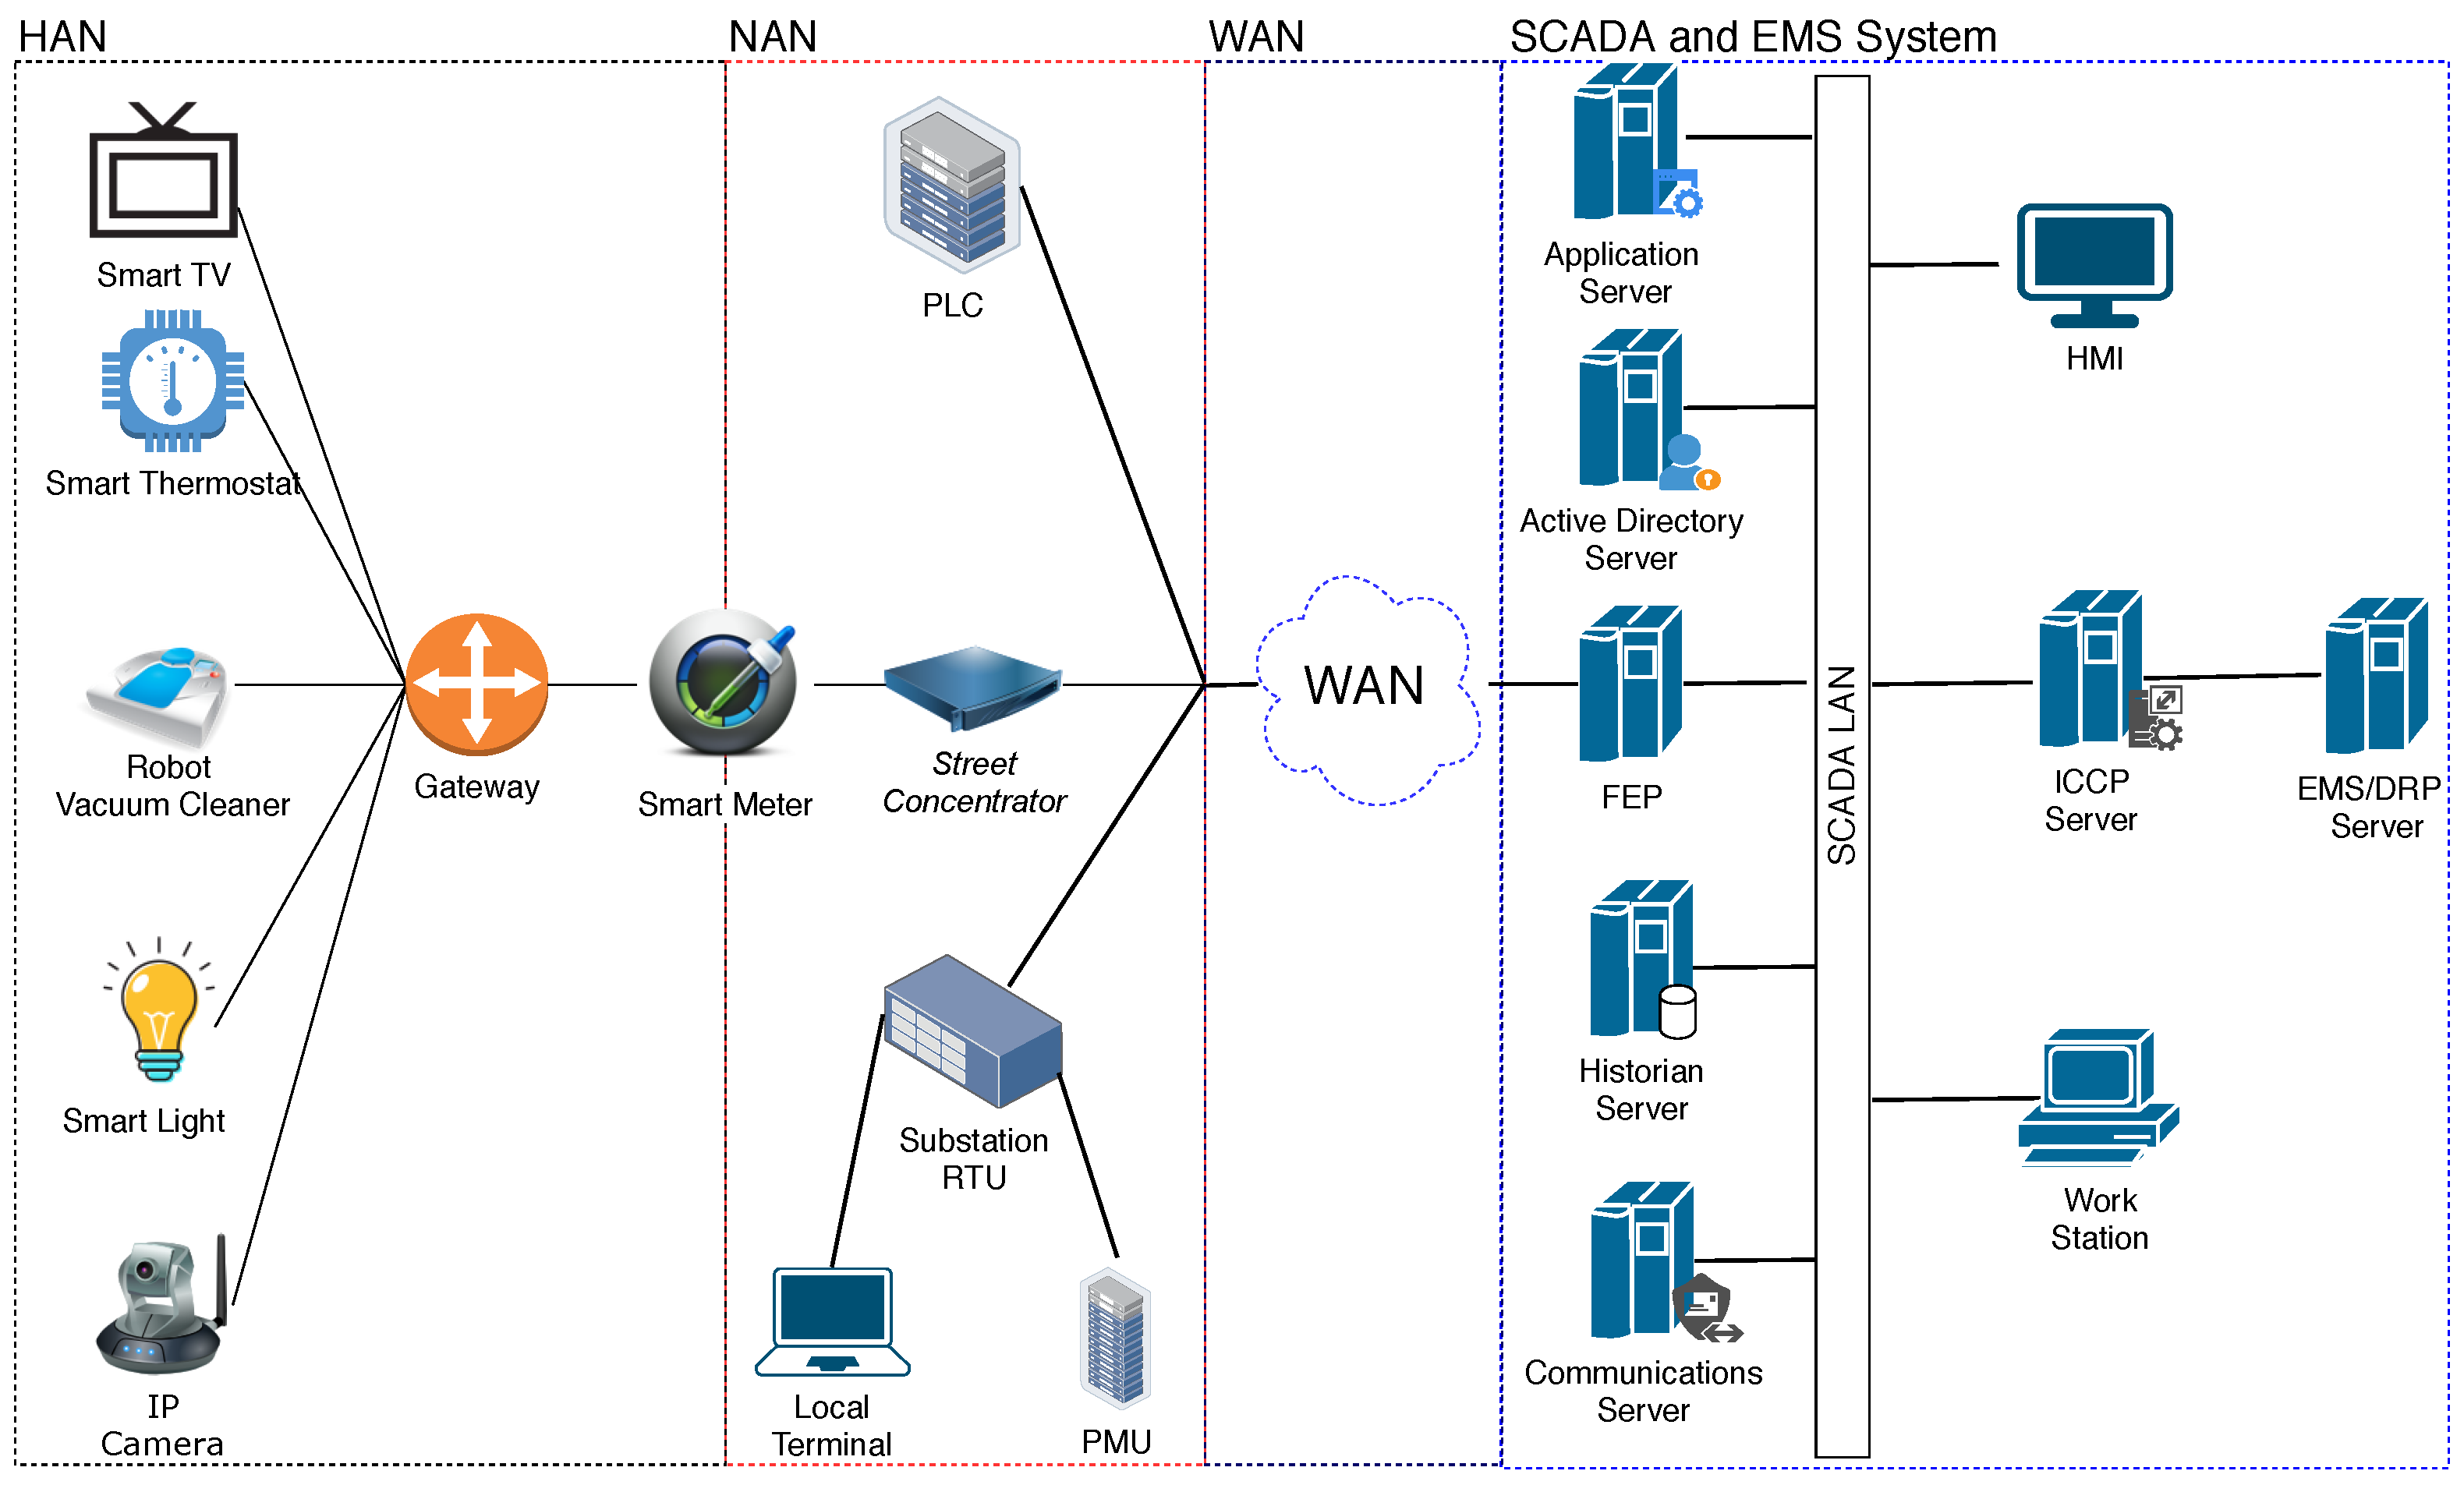
4.1.2. Network Model
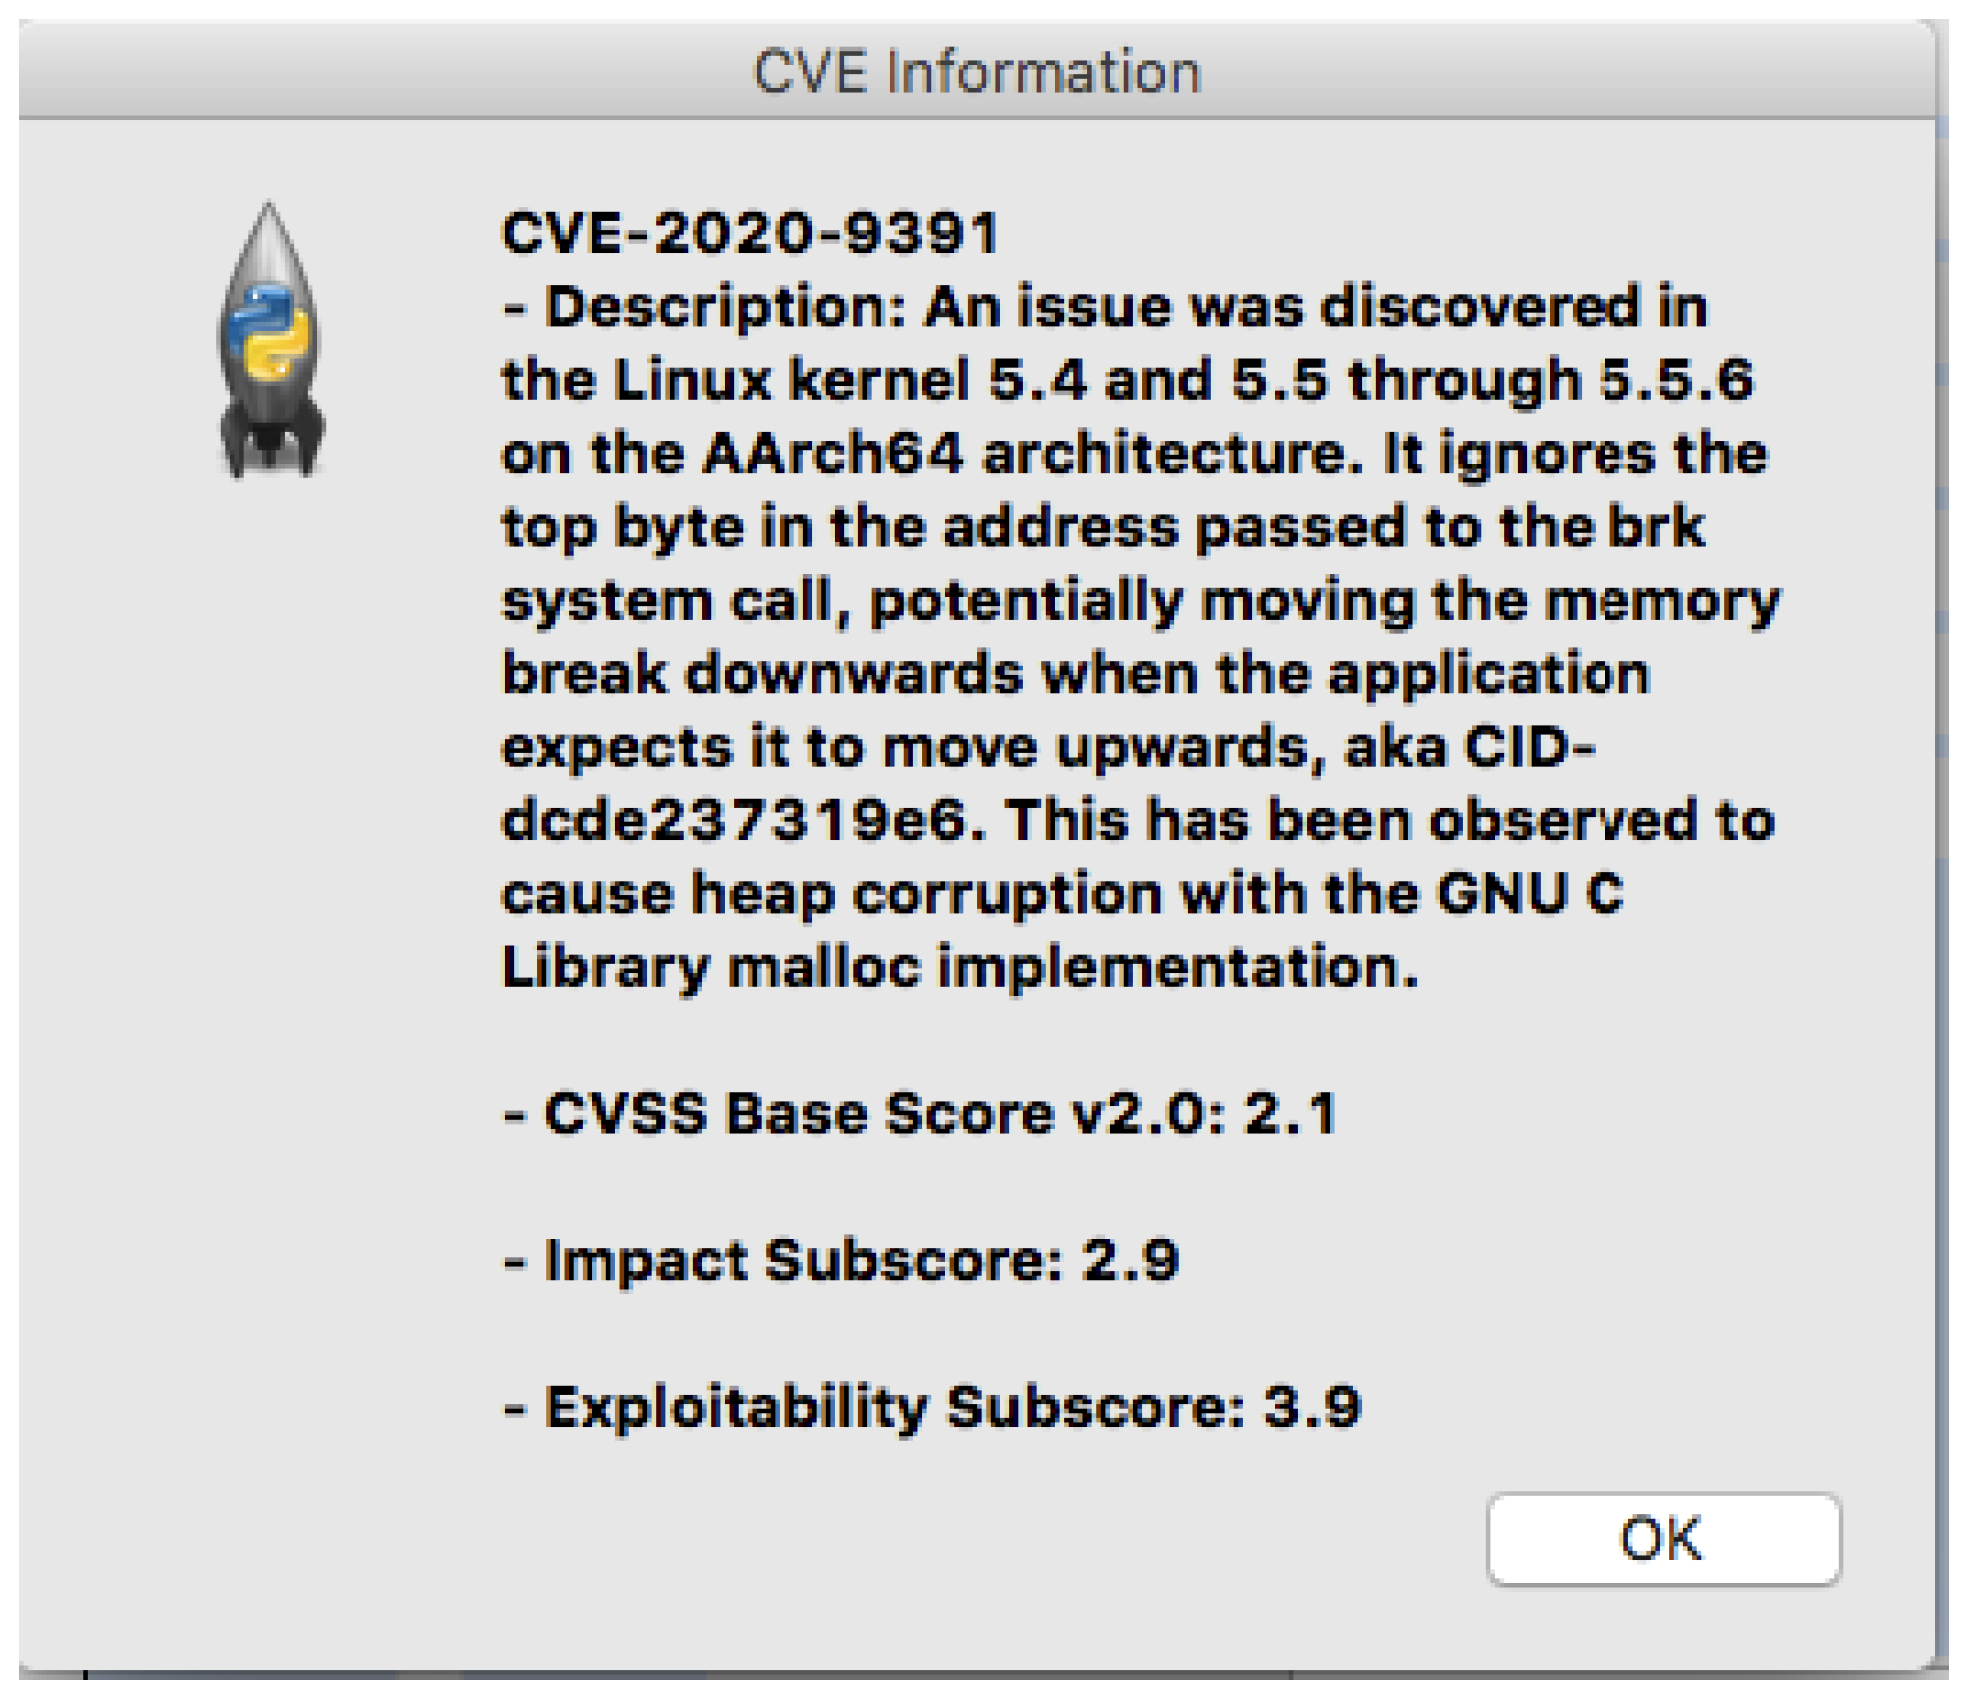
4.2. Devices and Vulnerabilities
4.3. Attack Scenarios
- Multiple-entry single-target attack model (entry devices of single type): we assume one type of device has vulnerabilities in this case study. Consequently, in order to launch an attack, attackers can only manipulate this type of device within the infected houses. For example, all IP cameras in the seven selected residential houses contain different types of vulnerabilities. Therefore, these infected IP cameras can be exploited as attack entry points. This basic scenario is used to introduce the trainees to the system’s functions.
- Multiple-entry single-target attack model (entry devices of multiple types): vulnerabilities exist in all types of devices in the seven selected houses. Therefore, attackers would probably manipulate any of the equipment in order to execute an attack. This circumstance aims to equip the users with attack analysis ability.
- Multiple-entry single-target attack model with patch: patching refers to the process by which the vulnerabilities in a specific device is repaired. The case study extends the multiple-entry single-target attack model under multiple device types scenario to incorporate patches’ deployment as a defense strategy. For instance, all smart TVs’ security vulnerabilities have been resolved. Since the issues are fixed, they are not appropriate entry points for the attacker to start an attack. This training scenario is applied to introduce the trainees to the patching functions and evaluate the effectiveness of a given defense strategy.
- Multiple-entry multiple-target attack model: this case is the extension of the multiple-entry single-target attacker model under multiple device types by expanding the attack target to the SCADA system’s core. This scenario aims to demonstrate the massive attack analysis ability of the training system. The users can learn how a large-scale attack happens and what the consequences are.
- Attack model with local terminals for substations as entry points: all local terminals of the substations have vulnerabilities. Hence, attackers would probably manipulate any of these local terminals as the entry points to conduct an attack. This case study aims to show how a physical device controlled by the SCADA system might be hacked and leads to the compromise of the SCADA system.
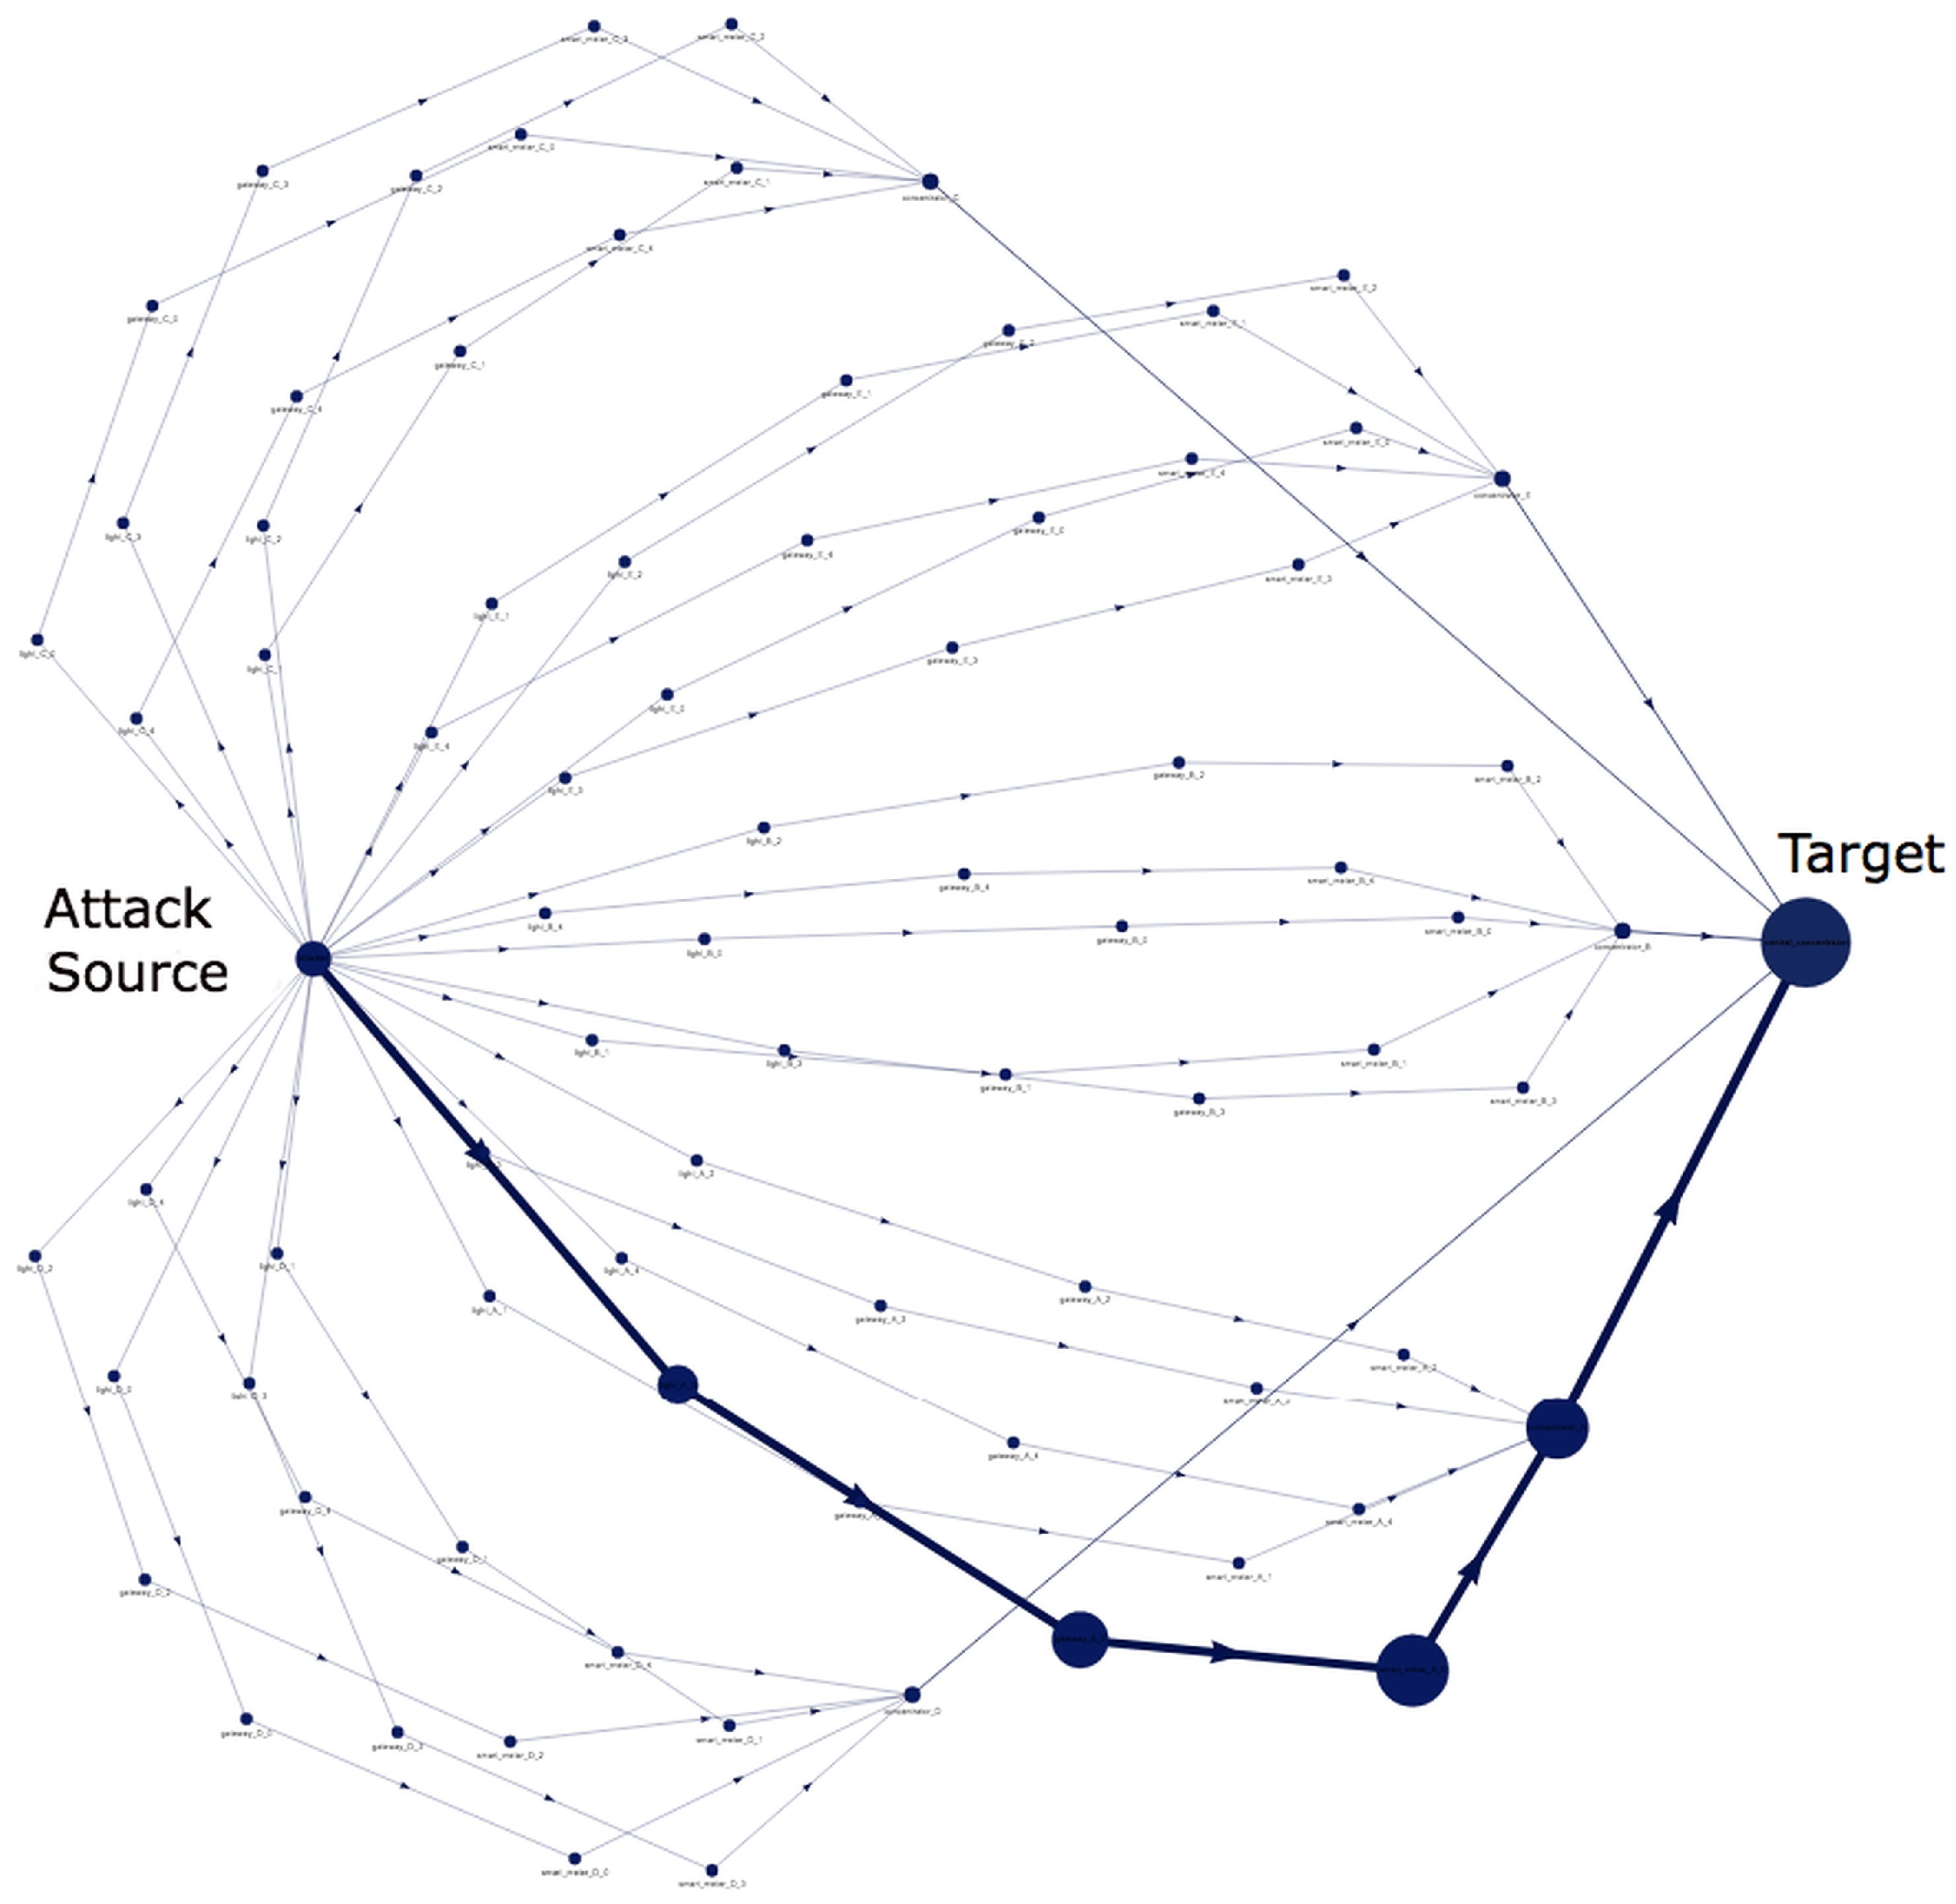
4.4. Attack Analysis Execution and Result Visualization
4.5. Analysis Results
4.5.1. Multiple-Entry Single-Target Attack Model under One Device Type
- Attackers →→→→→
- Attackers →→→→→
4.5.2. Multiple-Entry Single-Target Attack Model under Multiple Device Types
4.5.3. Multiple-Entry Single-Target Attack Model with Patch
4.5.4. Multiple-Entry Multiple-Target Attack Model
- Attackers →→→→→→→
4.5.5. Attack Model with Local Terminals for Substations as Entry Points
- Attackers →→→→→
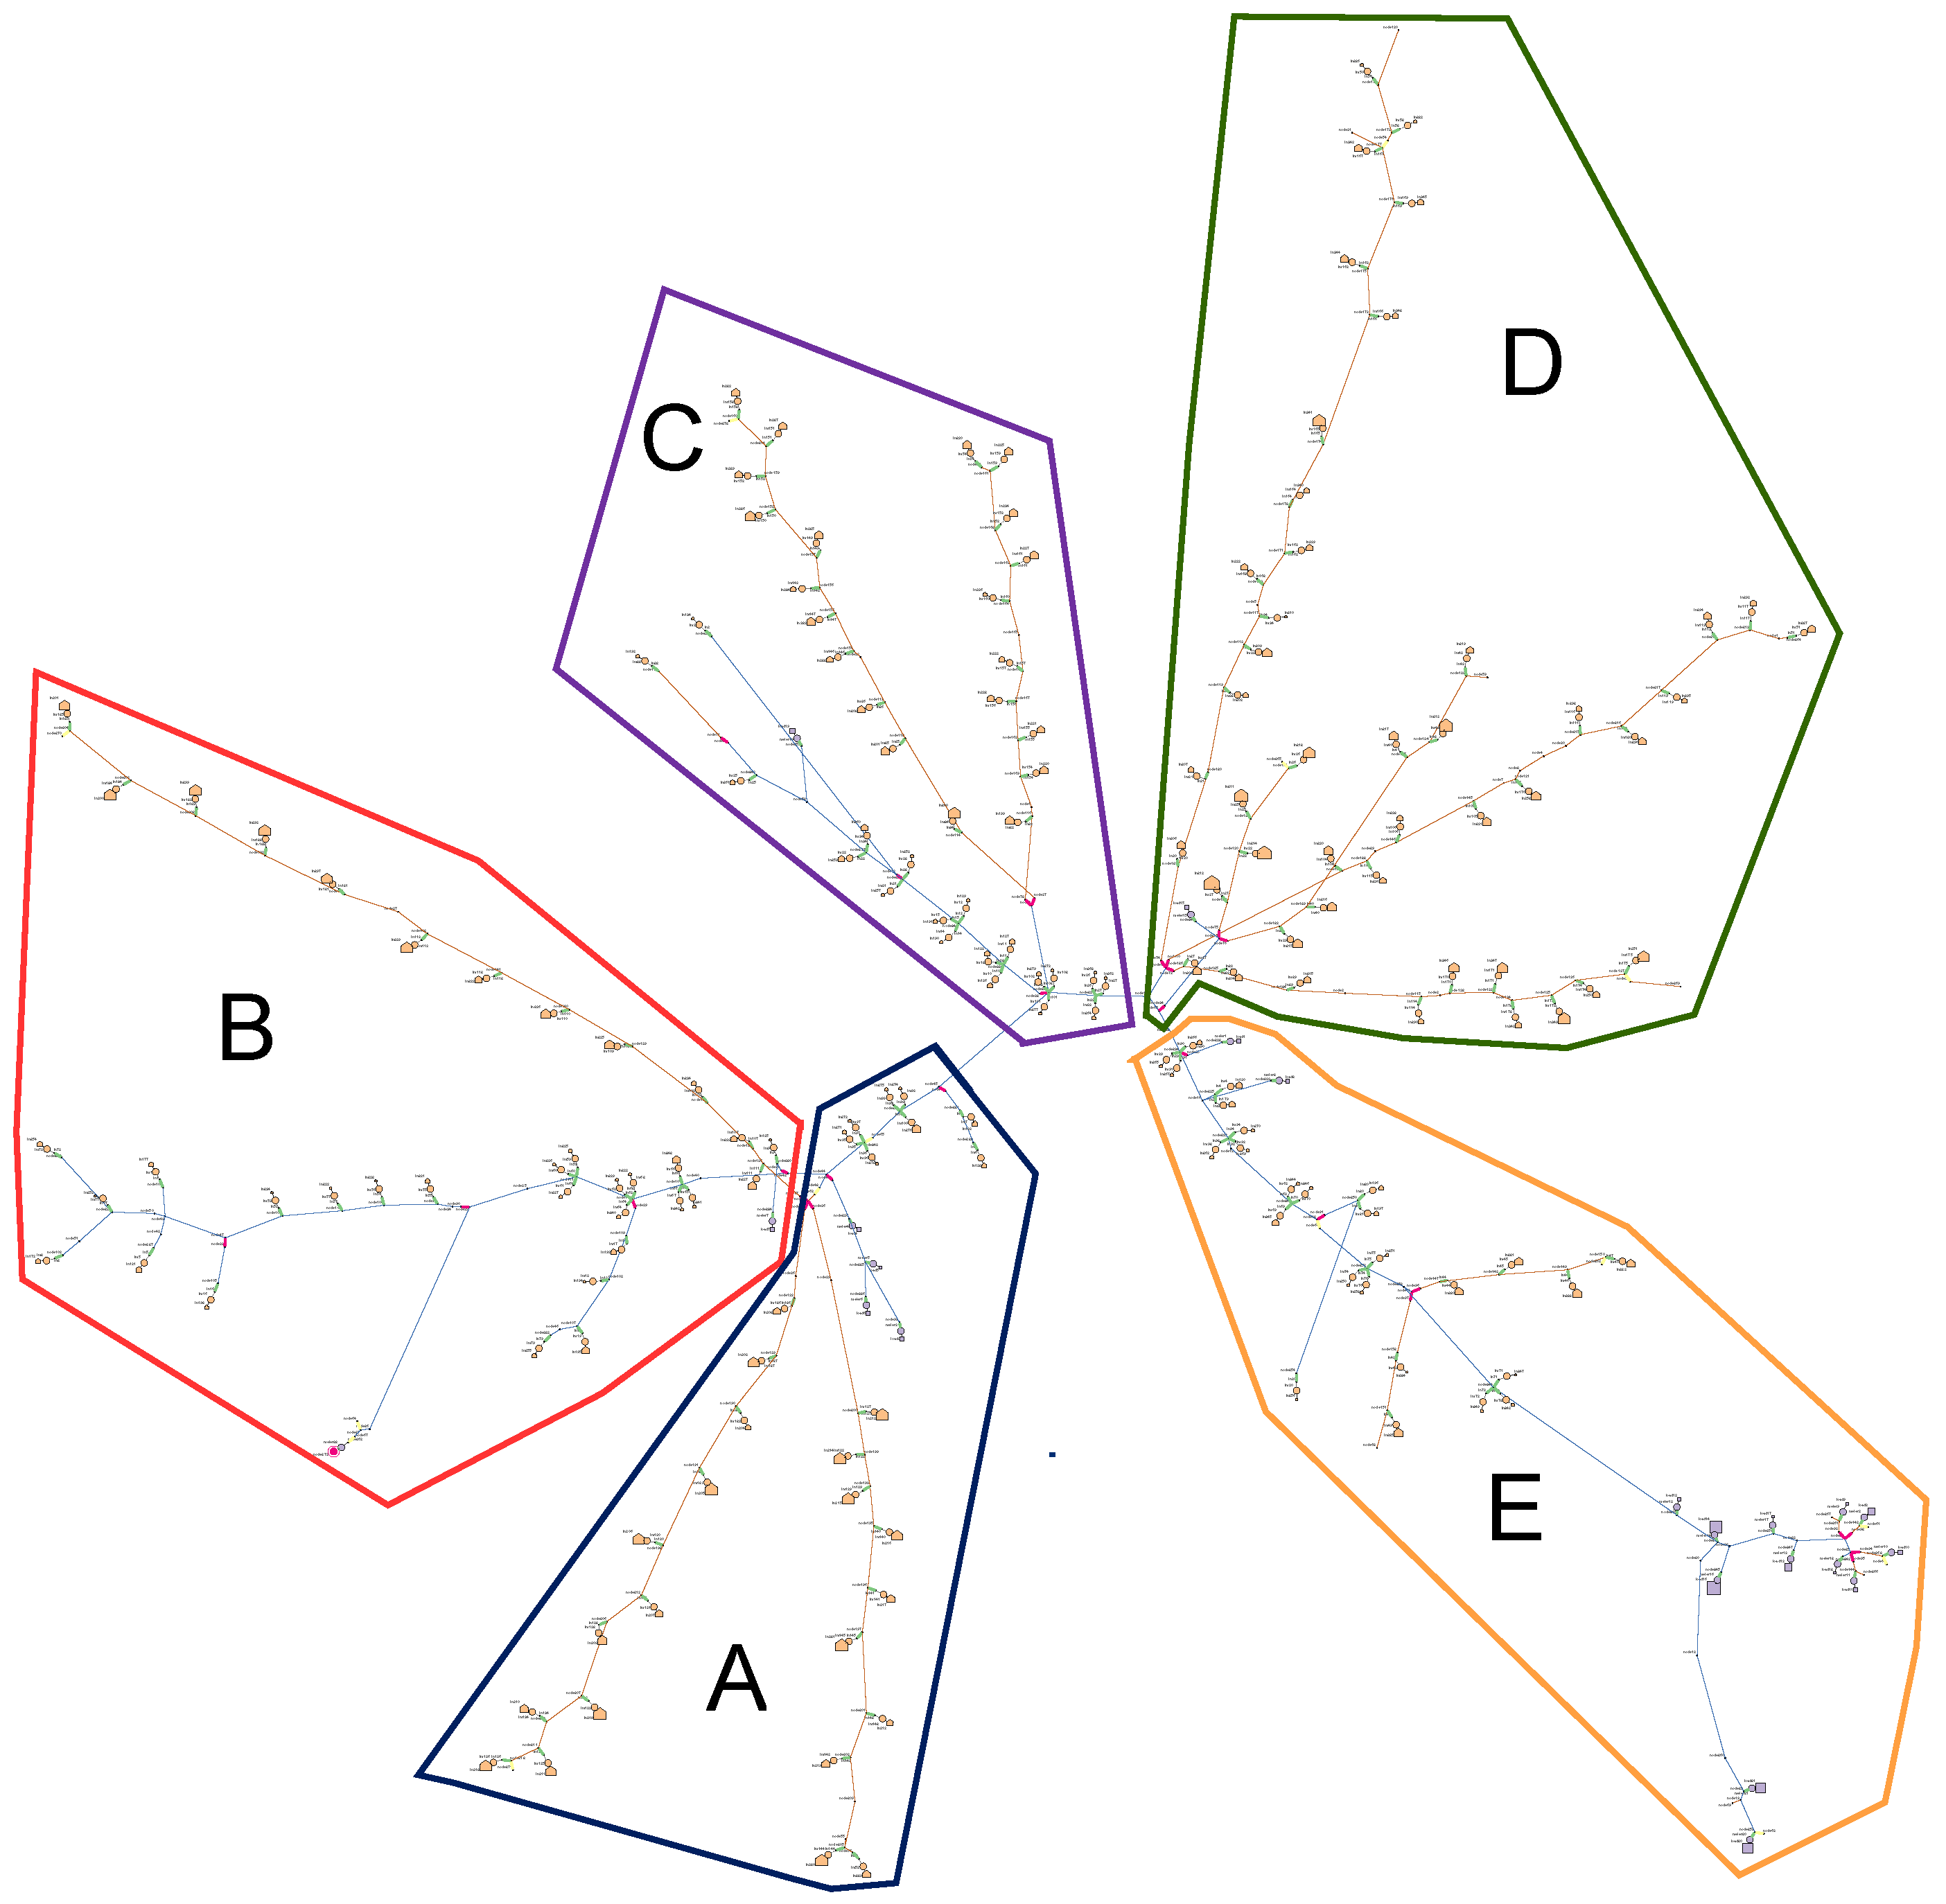
4.5.6. Example of Result Visualization
- Attackers →→→→→
5. Evaluation
5.1. Functionality Comparison
5.1.1. Evaluation Method
5.1.2. Evaluation Results
5.2. User Evaluation
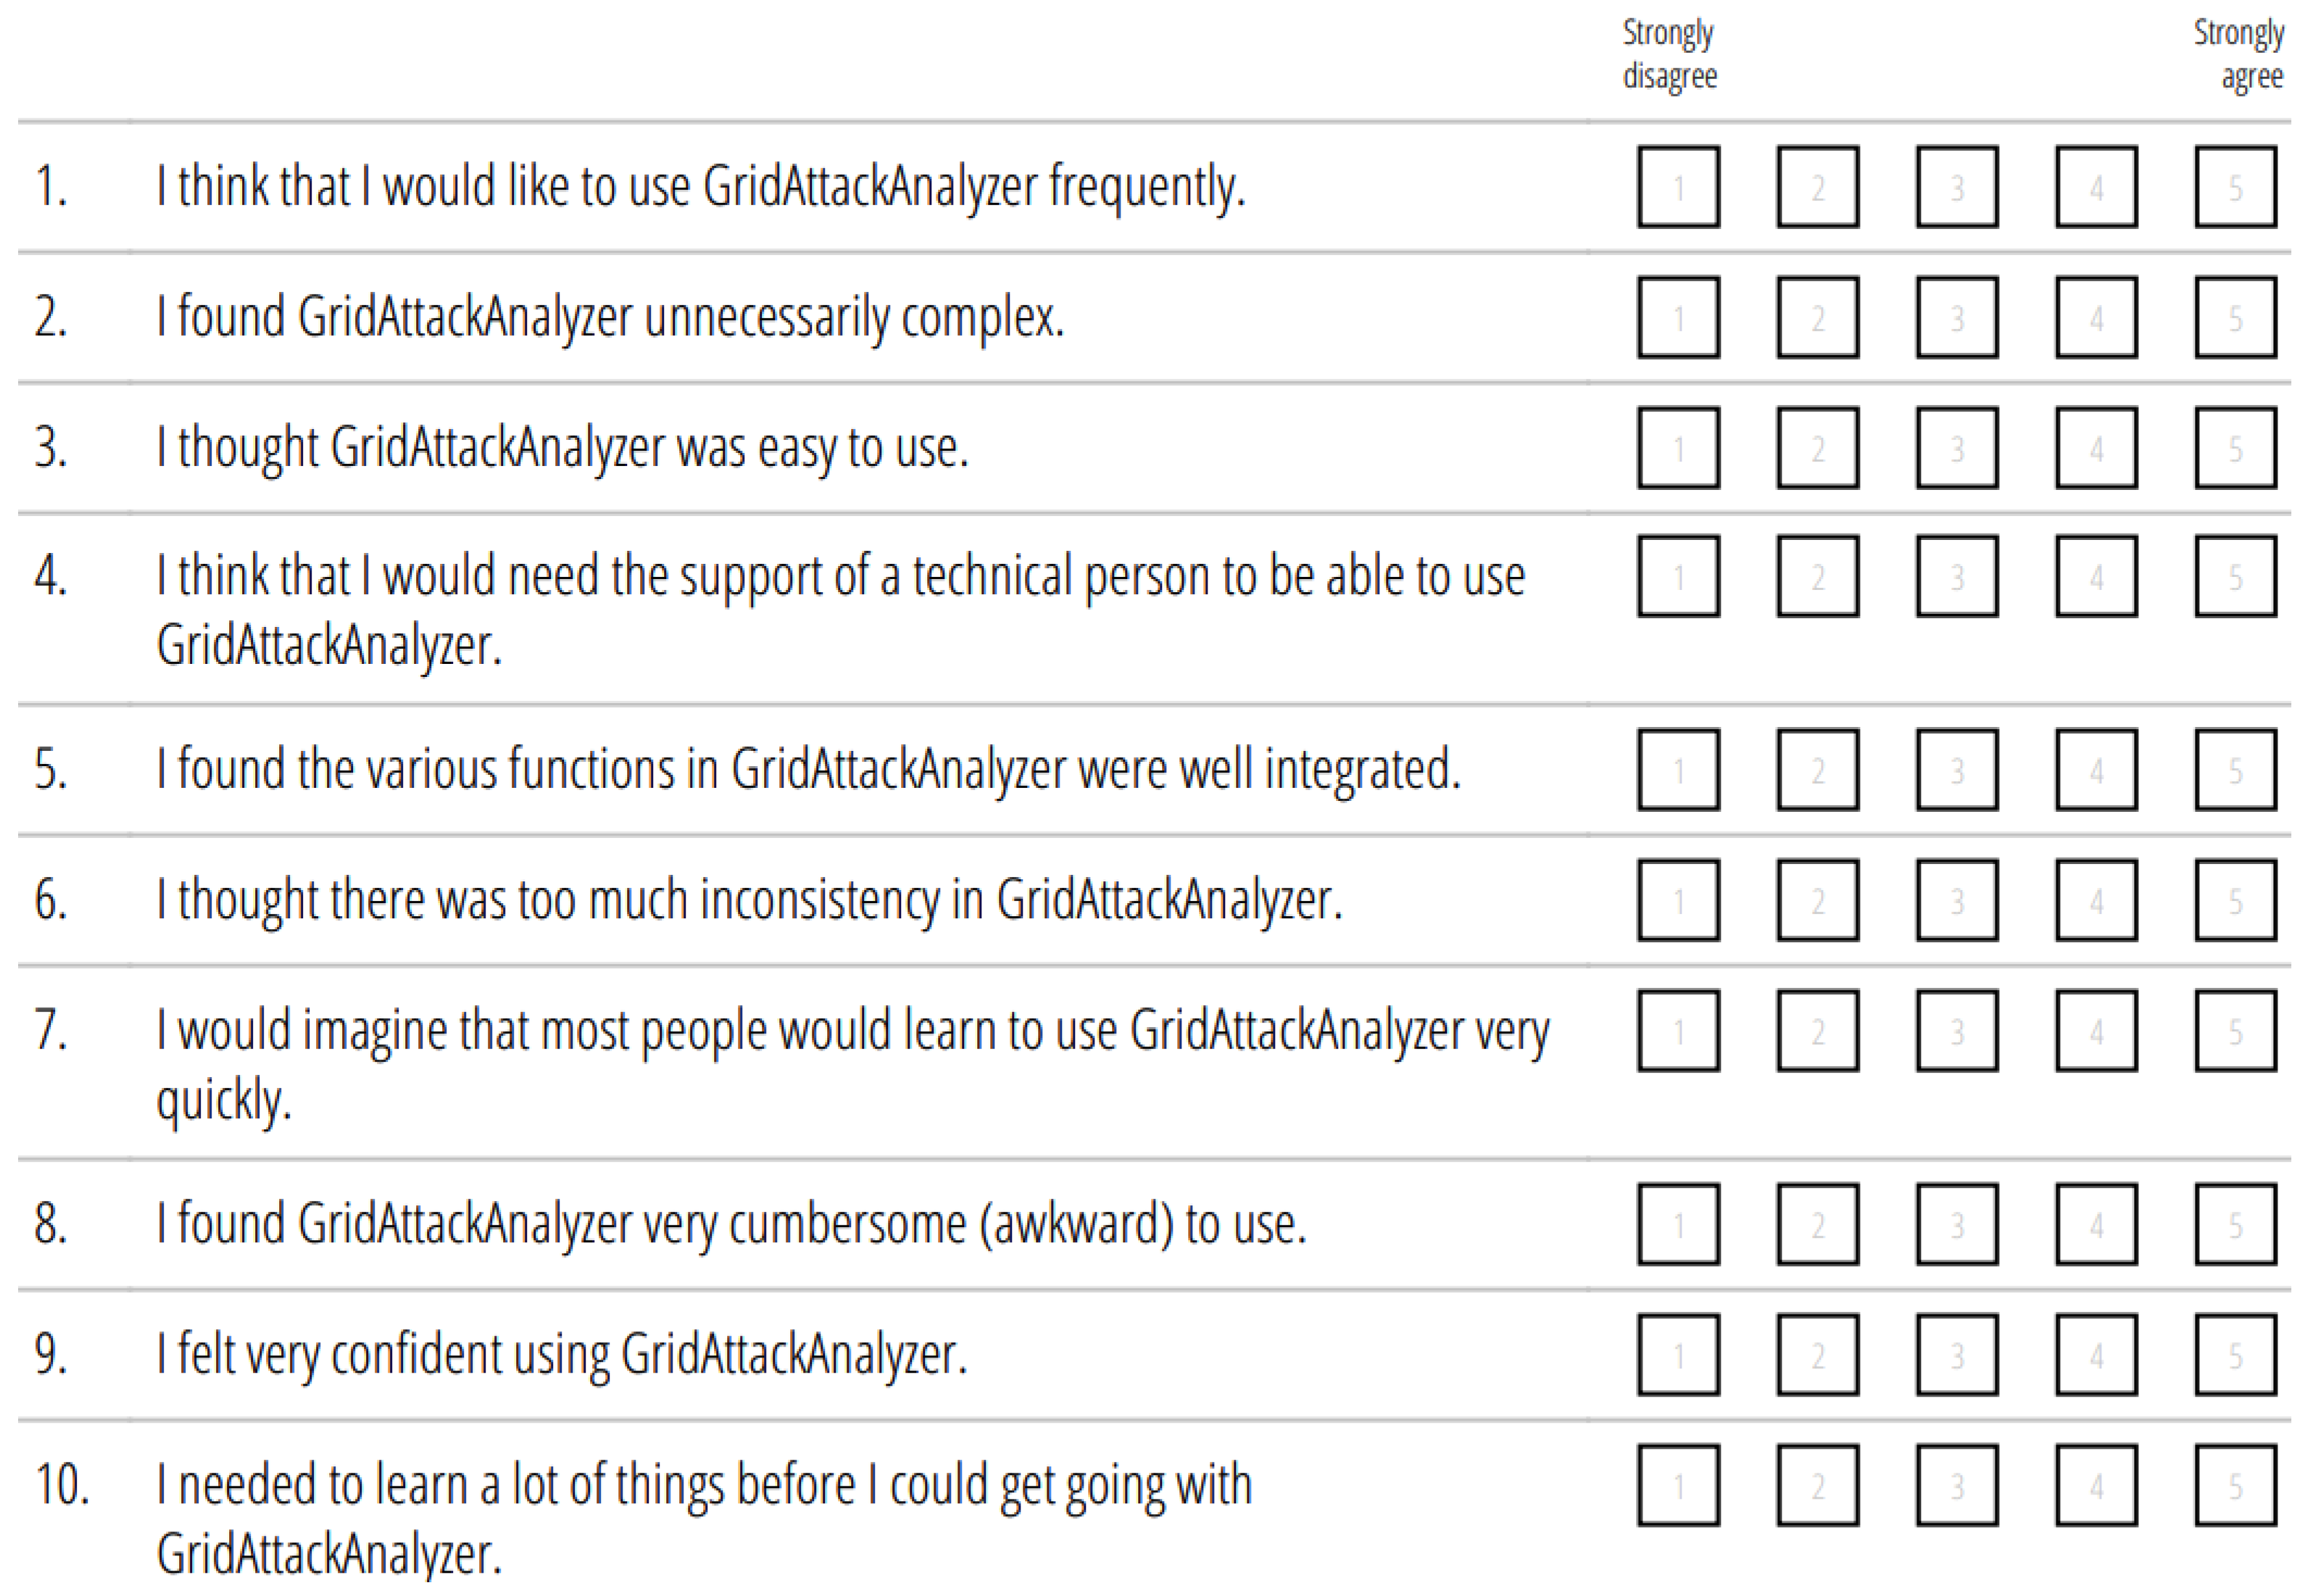
5.2.1. Evaluation Method
- 0 ≤ SUS Score < 36: Poor
- 36 ≤ SUS Score < 51: OK
- 51 ≤ SUS Score < 72: Acceptable
- 72 ≤ SUS Score < 85: Good
- SUS Score ≥ 85: Excellent
- The score contributions from the odd items: the scale position minus 1.
- The score contributions from the even items: 5 minus the scale position.
- The overall SUS value in the range of 0 to 100: the 10 question’s total score is multiplied by 2.5.
- The mean SUS score is the average SUS scores of n participants.
5.2.2. Evaluation Results
6. Conclusions
Author Contributions
Funding
Institutional Review Board Statement
Informed Consent Statement
Data Availability Statement
Conflicts of Interest
Abbreviations
| AG | Attack Graph |
| AGG | Attack Graph Generation |
| AT | Attack Tree |
| CSV | Comma-Separated Values |
| CVE | Common Vulnerability Exposure |
| CVSS | Common Vulnerability Score System |
| DHS | U.S. Department of Homeland Security |
| DRP | Demand Response |
| EMS | Energy Management Systems |
| ENISA | European Union Agency for Cybersecurity |
| FEP | Front End Processor |
| GrSM | Graphical Security Model |
| HAN | Home Area Network |
| HARM | Hierarchical Attack Representation Model |
| ICS-CERT | U.S. Industrial Control Systems Cyber Emergency Response Team |
| IoT | Internet of Things |
| NAN | Neighbor Area Network |
| NVD | National Vulnerability Database |
| PNNL | Pacific Northwest National Laboratory |
| SCADA | Supervisory Control and Data Acquisition |
| SUS | System Usability Scale |
| WAN | Wide Area Network |
References
- Fukuyama, M. Society 5.0: Aiming for a new human-centered society. Jpn. Spotlight 2018, 27, 47–50. [Google Scholar]
- Ghansah, I. Smart Grid Cyber Security Potential Threats, Vulnerabilities and Risks: Interim Project Report; California Energy Commission: Sacramento, CA, USA, 2012. [Google Scholar]
- ICS-CERT. Incident Response/Vulnerability Coordination in 2014. Available online: https://www.cisa.gov/uscert/sites/default/files/Monitors/ICS-CERT_Monitor_Sep2014-Feb2015.pdf (accessed on 8 May 2022).
- Le, T.D.; Anwar, A.; Loke, S.W.; Beuran, R.; Tan, Y. GridAttackSim: A Cyber Attack Simulation Framework for Smart Grids. Electronics 2020, 9, 1218. [Google Scholar] [CrossRef]
- Le, T.D.; Anwar, A.; Beuran, R.; Loke, S.W. Smart Grid Co-Simulation Tools: Review and Cybersecurity Case Study. In Proceedings of the 2019 7th International Conference on Smart Grid (icSmartGrid), Newcastle, NSW, Australia, 9–11 December 2019; pp. 39–45. [Google Scholar]
- Cintuglu, M.H.; Mohammed, O.A.; Akkaya, K.; Uluagac, A.S. A survey on smart grid cyber-physical system testbeds. IEEE Commun. Surv. Tutor. 2016, 19, 446–464. [Google Scholar] [CrossRef]
- Eliasson Lilja, C. Smart Manufacturing Systems—A Testbed for Decision Support Tool Requirements. Master’s Thesis, Chalmers University of Technology, Gothenburg, Sweden, 2018. [Google Scholar]
- Le, T.D.; Mengmeng, G.; Phan, T.D.; Hien, D.H.; Adnan, A.; Beuran, R.; Seng, W.L.; Yasuo, T. CVSS Based Attack Analysis using a Graphical Security Model: Review and Smart Grid Case Study. In Proceedings of the International Conference on Smart Grid and Internet of Things, TaiChung, Taiwan, 5–6 December 2020; Springer: Cham, Switzerland, 2020. [Google Scholar]
- Islam, S.N.; Baig, Z.; Zeadally, S. Physical layer security for the smart grid: Vulnerabilities, threats, and countermeasures. IEEE Trans. Ind. Inform. 2019, 15, 6522–6530. [Google Scholar] [CrossRef]
- Gunduz, M.Z.; Das, R. Analysis of cyber-attacks on smart grid applications. In Proceedings of the 2018 International Conference on Artificial Intelligence and Data Processing (IDAP), Malatya, Turkey, 28–30 September 2018; pp. 1–5. [Google Scholar]
- Liu, L.; Yu, E.; Mylopoulos, J. Security and privacy requirements analysis within a social setting. In Proceedings of the 11th IEEE International Requirements Engineering Conference, Monterey Bay, CA, USA, 12 September 2003; pp. 151–161. [Google Scholar]
- Yu, E.S. Towards modelling and reasoning support for early-phase requirements engineering. In Proceedings of the ISRE’97: 3rd IEEE International Symposium on Requirements Engineering, Annapolis, MD, USA, 6–10 January 1997; pp. 226–235. [Google Scholar]
- Mouratidis, H.; Giorgini, P.; Manson, G. Using security attack scenarios to analyse security during information systems design. In Proceedings of the International Conference on Enterprise Information Systems, Porto, Portugal, 14–17 April 2004; pp. 10–17. [Google Scholar]
- Van Lamsweerde, A. Elaborating security requirements by construction of intentional anti-models. In Proceedings of the 26th International Conference on Software Engineering, Edinburgh, UK, 28 May 2004; pp. 148–157. [Google Scholar]
- Asnar, Y.; Massacci, F. A method for security governance, risk, and compliance (GRC): A goal-process approach. In International School on Foundations of Security Analysis and Design; Springer: Berlin/Heidelberg, Germany, 2011; pp. 152–184. [Google Scholar]
- Beckers, K.; Heisel, M.; Krautsevich, L.; Martinelli, F.; Meis, R.; Yautsiukhin, A. Determining the probability of smart grid attacks by combining attack tree and attack graph analysis. In Proceedings of the International Workshop on Smart Grid Security, Munich, Germany, 26 February 2014; Springer: Berlin/Heidelberg, Germany, 2014; pp. 30–47. [Google Scholar]
- Ge, M.; Hong, J.B.; SeongKim, W.G.D. A framework for automating security analysis of the internet of things. J. Netw. Comput. Appl. 2017, 83, 12–27. [Google Scholar] [CrossRef]
- Hong, J.; Kim, D.S. Harms: Hierarchical Attack Representation Models for Network Security Analysis; SRI Security Research Institute, Edith Cowan University: Perth, Australia, 2012. [Google Scholar]
- Mell, P.; Scarfone, K.; Romanosky, S. Common vulnerability scoring system. IEEE Secur. Priv. 2006, 4, 85–89. [Google Scholar] [CrossRef]
- Wang, W.; Xu, Y.; Khanna, M. A survey on the communication architectures in smart grid. Comput. Netw. 2011, 55, 3604–3629. [Google Scholar] [CrossRef]
- Postigo Marcos, F.E.; Mateo Domingo, C.; Gomez San Roman, T.; Palmintier, B.; Hodge, B.M.; Krishnan, V.; de Cuadra García, F.; Mather, B. A review of power distribution test feeders in the United States and the need for synthetic representative networks. Energies 2017, 10, 1896. [Google Scholar] [CrossRef] [Green Version]
- National Vulnerability Database (NVD). Available online: https://nvd.nist.gov/ (accessed on 30 May 2022).
- Scarfone, K.; Mell, P. An analysis of CVSS version 2 vulnerability scoring. In Proceedings of the 2009 3rd International Symposium on Empirical Software Engineering and Measurement, Lake Buena Vista, FL, USA, 15–16 October 2009; pp. 516–525. [Google Scholar]
- Hong, J.B.; Kim, D.S.; Chung, C.J.; Huang, D. A survey on the usability and practical applications of graphical security models. Comput. Sci. Rev. 2017, 26, 1–16. [Google Scholar] [CrossRef]
- Sheyner, O.; Haines, J.; Jha, S.; Lippmann, R.; Wing, J.M. Automated generation and analysis of attack graphs. In Proceedings of the 2002 IEEE Symposium on Security and Privacy, Berkeley, CA, USA, 12–15 May 2002; pp. 273–284. [Google Scholar]
- Schneier, B. Secrets and Lies: Digital Security in a Networked World; John Wiley & Sons: Hoboken, NJ, USA, 2015. [Google Scholar]
- Shipman, J.W. Tkinter 8.4 Reference: A GUI for Python; New Mexico Tech Computer Center: Socorro, NM, USA, 2013. [Google Scholar]
- Schneider, K.P.; Chen, Y.; Chassin, D.P.; Pratt, R.G.; Engel, D.W.; Thompson, S.E. Modern Grid Initiative Distribution Taxonomy Final Report; Technical report; Pacific Northwest National Lab. (PNNL): Richland, WA, USA, 2008. [Google Scholar]
- Schneider, K.; Mather, B.; Pal, B.; Ten, C.W.; Shirek, G.; Zhu, H.; Fuller, J.; Pereira, J.L.R.; Ochoa, L.F.; de Araujo, L.R.; et al. Analytic considerations and design basis for the IEEE distribution test feeders. IEEE Trans. Power Syst. 2017, 33, 3181–3188. [Google Scholar] [CrossRef]
- Saputro, N.; Akkaya, K.; Uludag, S. A survey of routing protocols for smart grid communications. Comput. Netw. 2012, 56, 2742–2771. [Google Scholar] [CrossRef]
- Colak, I.; Sagiroglu, S.; Fulli, G.; Yesilbudak, M.; Covrig, C.F. A survey on the critical issues in smart grid technologies. Renew. Sustain. Energy Rev. 2016, 54, 396–405. [Google Scholar] [CrossRef]
- Cohen, M.A. GridLAB-D Taxonomy Feeder Graphs. 2013. Available online: http://emac.berkeley.edu/gridlabd/taxonomy_graphs/ (accessed on 8 May 2022).
- Raza, N.; Akbar, M.Q.; Soofi, A.A.; Akbar, S. Study of smart grid communication network architectures and technologies. J. Comput. Commun. 2019, 7, 19–29. [Google Scholar] [CrossRef] [Green Version]
- Clements, S.L.; Carroll, T.E.; Hadley, M.D. Home Area Networks and the Smart Grid; Technical report; Pacific Northwest National Lab. (PNNL): Richland, WA, USA, 2011. [Google Scholar]
- Mattioli, R.; Moulinos, K. Communication Network Interdependencies in Smart Grids; EUA FNAI Security, Ed.; ENISA: Athens, Greece, 2015. [Google Scholar]
- Wadhawan, Y.; Anas AlMajali, C.N. A Comprehensive Analysis of Smart Grid Systems against Cyber-Physical Attacks. Electronics 2018, 7, 249. [Google Scholar] [CrossRef] [Green Version]
- Blank, R.M. Guide for Conducting Risk Assessments. 2011. Available online: https://nvlpubs.nist.gov/nistpubs/legacy/sp/nistspecialpublication800-30r1.pdf (accessed on 8 May 2022).
- Le, D.T. Smart Grid Cybersecurity Experimentation: Architecture and Methodology. Ph.D. Thesis, Japan Advanced Institute of Science and Technology, Nomi, Japan, 2021. [Google Scholar]
- Brooke, J. SUS: A retrospective. J. Usability Stud. 2013, 8, 29–40. [Google Scholar]
- Sauro, J.; Lewis, J.R. Correlations among prototypical usability metrics: Evidence for the construct of usability. In Proceedings of the SIGCHI Conference on Human Factors in Computing Systems, Boston, MA, USA, 4–9 April 2009; pp. 1609–1618. [Google Scholar]
- Tullis, T.S.; Stetson, J.N. A comparison of questionnaires for assessing website usability. In Proceedings of the Usability Professional Association Conference, Minneapolis, MN, USA, 7–11 June 2004; Volume 1. [Google Scholar]
- Bangor, A.; Kortum, P.T.; Miller, J.T. An empirical evaluation of the system usability scale. Intl. J. Hum.-Comput. Interact. 2008, 24, 574–594. [Google Scholar] [CrossRef]
- Le, T.D.; Beuran, R.; Ge, M.; Hong, J.B. GridAttackAnalyzer: Smart Grid Attack Analysis Framework. 2021. Available online: https://github.com/crond-jaist/GridAttackAnalyzer (accessed on 8 May 2022).
- Sarajlić, D.; Rehtanz, C. Overview of distribution grid test systems for benchmarking of power system analyses. In Proceedings of the 2020 AEIT International Annual Conference (AEIT), Catania, Italy, 23–25 September 2020; pp. 1–6. [Google Scholar]
- PG&E. Pacific Gas and Electric Prototypical Feeder Models; PG&E: San Francisco, CA, USA.
- Jahangiri, P.; Wu, D.; Li, W.; Aliprantis, D.C.; Tesfatsion, L. Development of an agent-based distribution test feeder with smart-grid functionality. In Proceedings of the 2012 IEEE Power and Energy Society General Meeting, San Diego, CA, USA, 22–26 July 2012; pp. 1–7. [Google Scholar]
- McDermott, T. A test feeder for DG protection analysis. In Proceedings of the 2011 IEEE/PES Power Systems Conference and Exposition, Phoenix, AZ, USA, 20–23 March 2011; pp. 1–7. [Google Scholar]


| Sub-Module | Object | Description |
|---|---|---|
| Smart Grid Model | ID | ID of the Smart Grid Model |
| list_name | Name of the Smart Grid Model | |
| streets_and_houses | List of the streets and the corresponding houses | |
| description | Smart Grid Model description | |
| Smart Grid Devices | ID | ID of the Smart Grid device |
| device_name | Name of the Smart Grid device | |
| CVE_list | The CVE list of the Smart Grid device | |
| group | Group of the device (HAN, NAN, SCADA) | |
| description | Smart Grid device description | |
| CVE List | ID | ID of the CVE |
| description | CVE description | |
| CVSS_Base_Score_2.0 | CVSS Base Score 2.0 | |
| Impact_Subscore | Impact Subscore | |
| Exploitability_Subscore | Exploitability Subscore |
| Symbol | Description |
|---|---|
| attack cost of an attack path | |
| attack cost of an inner node | |
| attack impact of an attack path | |
| attack impact of an inner node | |
| attack tree t | |
| attack success probability for each inner node g in | |
| the root value in | |
| attack success probability value of a vulnerability | |
| attack risk of an attack path | |
| attack risk of an inner node | |
| the set of vulnerabilities under gate g | |
| attack cost | |
| AC | the attack cost of the network |
| attack impact | |
| AIM | the attack impact of the network |
| g | inner node (gate) |
| p | attack success probability |
| P | the attack success probability of the network |
| r | attack risk |
| R | the attack risk of the network |
| No. | Smart Devices | CVE Lists |
|---|---|---|
| 1 | IP Camera | CVE-2020-11623, CVE-2020-11949, CVE-2020-3110 |
| 2 | Smart TV | CVE-2020-9264, CVE-2019-12477, CVE-2019-11336, CVE-2019-9871, CVE-2018-13989 |
| 3 | Smart Vacuum Cleaner | CVE-2019-12820, CVE-2019-12821, CVE-2018-20785, CVE-2018-17177, CVE-2018-10987 |
| 4 | Smart Thermostat | CVE-2013-4860, CVE-2018-11315 |
| 5 | Smart Light | CVE-2020-6007, CVE-2019-18980, CVE-2017-14797 |
| 6 | Smart Meter | CVE-2017-9944 |
| 7 | Gateway | CVE-2018-3880, CVE-2018-3879, CVE-2018-3902, CVE-2018-3909, CVE-2018-3907, CVE-2018-3911 |
| 8 | Concentrator | CVE-2020-1638 |
| 9 | FEP | CVE-2019-6810, CVE-2018-4838, CVE-2019-14813 |
| 10 | ICCP Server | CVE-2015-6574, CVE-2006-0059 |
| 11 | Communication Server | CVE-2021-20501, CVE-2020-7247, CVE-2020-27777 |
| 12 | Local Terminal | CVE-2021-33200, CVE-2019-19816, CVE-2019-19814 |
| 13 | Substation RTU | CVE-2019-14931, CVE-2020-7801, CVE-2019-16879, CVE-2019-20045 |
| 14 | EMS/DRP Server | CVE-2020-9391, CVE-2019-6454, CVE-2019-14813 |
| Likelihood | Probability Ranges (p) |
|---|---|
| Almost Certain | 0.8–1.0 |
| Likely | 0.6–0.79 |
| Possible | 0.4–0.59 |
| Unlikely | 0.2–0.39 |
| Rare | 0.0–0.19 |
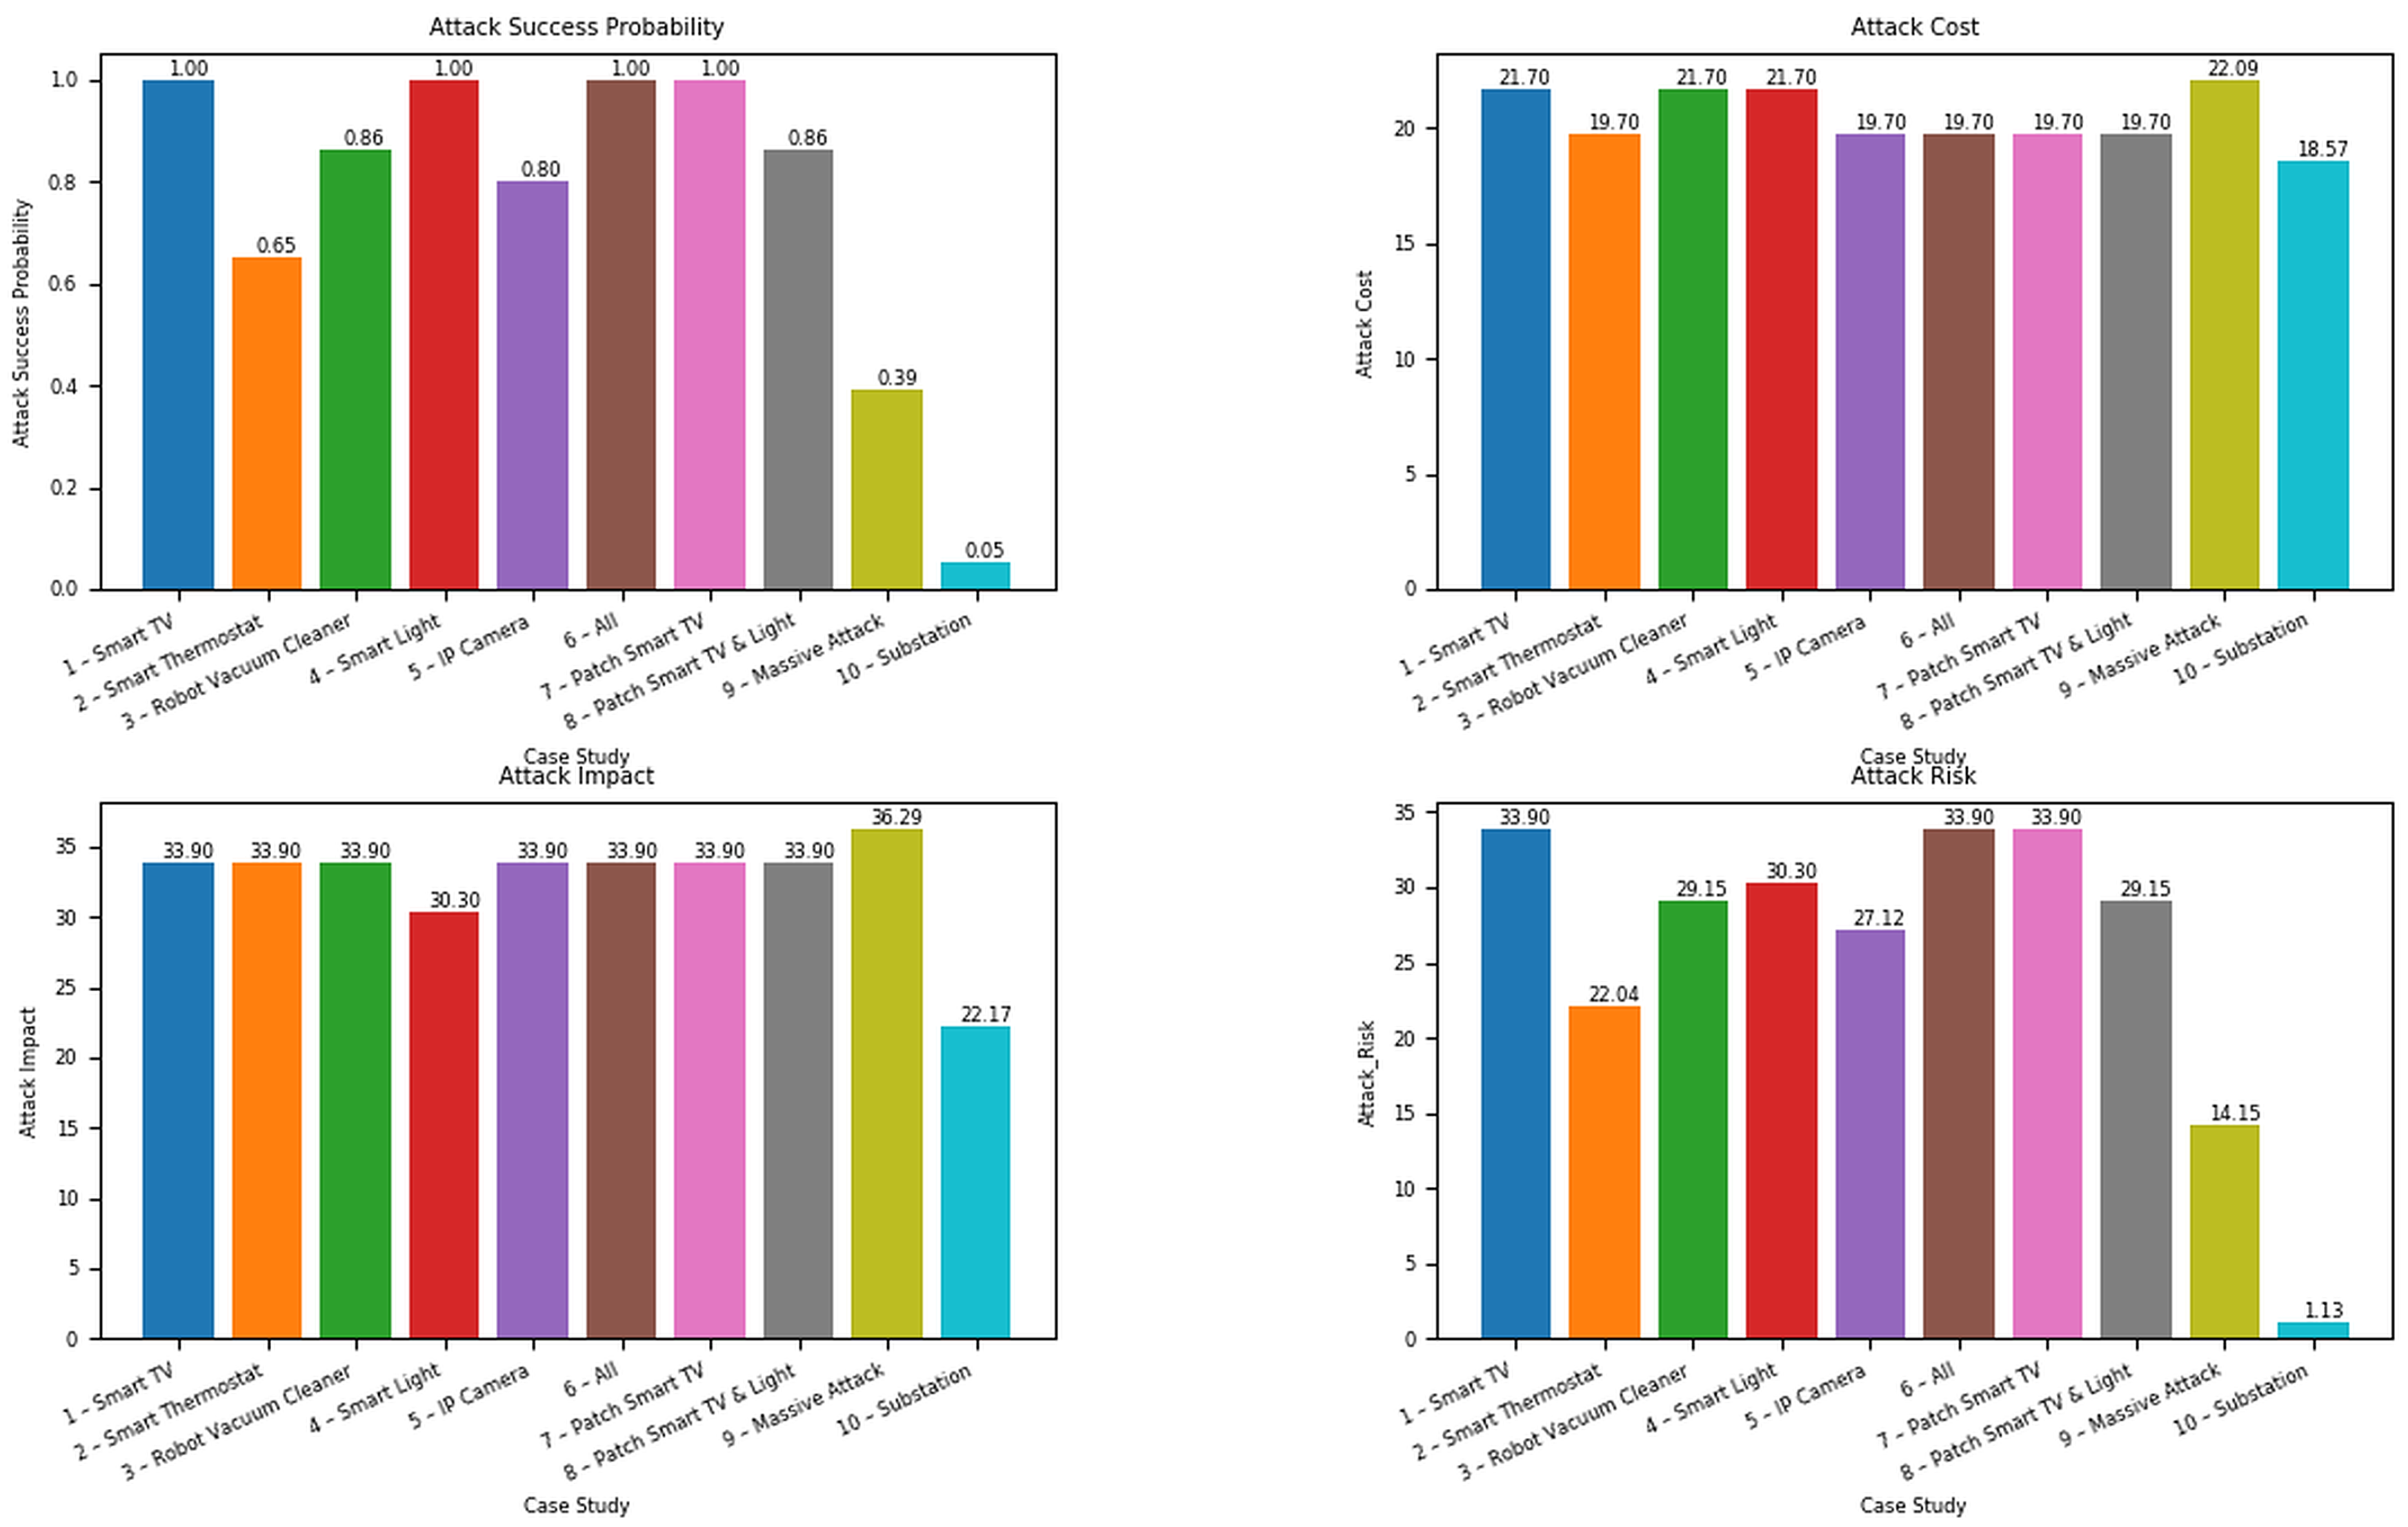
| Scenario | Entry Point | Patch | Security Metrics | Number of Paths | ||||||||
|---|---|---|---|---|---|---|---|---|---|---|---|---|
| p | c | aim | r | Total | Rare | Unlikely | Possible | Likely | Almost Certain | |||
| 1 | Smart TV | No | 1 | 21.7 | 33.9 | 33.9 | 16 | 0 | 3 | 0 | 5 | 8 |
| 2 | Smart Thermostat | No | 0.65 | 19.7 | 33.9 | 22.04 | 16 | 0 | 2 | 8 | 6 | 0 |
| 3 | Robot Vacuum Cleaner | No | 0.86 | 21.7 | 33.9 | 29.15 | 16 | 1 | 6 | 2 | 4 | 3 |
| 4 | Smart Light | No | 1 | 21.7 | 30.3 | 30.3 | 16 | 1 | 9 | 2 | 0 | 4 |
| 5 | IP Camera | No | 0.8 | 19.7 | 33.9 | 27.12 | 16 | 0 | 7 | 2 | 5 | 2 |
| 6 | All | No | 1 | 19.7 | 33.9 | 33.9 | 80 | 2 | 27 | 14 | 20 | 17 |
| 7 | All | Smart TV | 1 | 19.7 | 33.9 | 33.9 | 64 | 2 | 24 | 14 | 15 | 9 |
| 8 | All | Smart TV and Smart Light | 0.86 | 19.7 | 33.9 | 29.15 | 48 | 1 | 15 | 12 | 15 | 5 |
| 9 * | All | No | 0.39 | 22.09 | 36.29 | 14.15 | 125 | 66 | 59 | 0 | 0 | 0 |
| 10 | Substation (Local Terminal) | No | 0.05 | 18.57 | 22.17 | 1.131 | 12 | 12 | 0 | 0 | 0 | 0 |
| No. | Year | Research | Attack Tree | Attack Graph | Security Metrics Calculation | Likelihood | ||||
|---|---|---|---|---|---|---|---|---|---|---|
| Attack Graph Generation | Attack Graph Visualization | Attack Success Probability | Attack Cost | Attack Impact | Attack Risk | |||||
| 1 | 2011 | Security Risk Analysis of Enterprise Networks Using Probabilistic Attack Graphs | Y | Y | Y | Y | ||||
| 2 | 2011 | Defining and Assessing Quantitative Security Risk Measures Using Vulnerability Lifecycle and CVSS Metrics | Y | Y | Y | |||||
| 3 | 2012 | Aggregating CVSS Base Scores for Semantics-Rich Network Security Metrics | Y | Y | ||||||
| 4 | 2012 | Dynamic Security Risk Management Using Bayesian Attack Graphs | Y | Y | Y | Y | Y | |||
| 5 | 2014 | Determining the Probability of Smart Grid Attacks by Combining Attack Tree and Attack Graph Analysis | Y | Y | Y | |||||
| 6 | 2014 | Attack Graph-Based Risk Assessment and Optimisation Approach | Y | Y | Y | Y | ||||
| 7 | 2015 | A Framework for Modeling and Assessing Security of the Internet of Things | Y | Y | Y | Y | Y | Y | ||
| 8 | 2016 | Security Modelling and Analysis of Dynamic Enterprise Networks | Y | Y | Y | Y | ||||
| 9 | 2017 | A Quantitative CVSS-Based Cyber Security Risk Assessment Methodology For IT Systems | Y | Y | Y | Y | ||||
| 10 | 2017 | A framework for automating security analysis of the internet of things | Y | Y | Y | Y | Y | Y | ||
| 11 | 2018 | A Comprehensive Analysis of Smart Grid Systems against Cyber-Physical Attacks | Y | Y | Y | Y | Y | Y | ||
| 12 | 2019 | CloudSafe: A Tool for an Automated Security Analysis for Cloud Computing | Y | Y | ||||||
| 13 | 2019 | Quantitative Model of Attacks on Distribution Automation Systems Based on CVSS and Attack Trees | Y | Y | Y | |||||
| 14 | 2020 | A Bayesian Attack Tree Based Approach to Assess Cyber-Physical Security of Power System | Y | Y | Y | Y | Y | |||
| 15 | 2020 | A Framework for Real-Time Intrusion Response in Software Defined Networking Using Precomputed Graphical Security Models | Y | Y | Y | Y | Y | |||
| 16 | 2021 | Monitoring Cyber-Physical Layer of Smart Grid Using Graph Theory Approach | Y | Y | ||||||
| 17 | 2022 | GridAttackAnalyzer | Y | Y | Y | Y | Y | Y | Y | Y |
| Framework | Maximum Value | Minimum Value | Mean | Standard Deviation |
|---|---|---|---|---|
| GridAttack-Analyzer | 90 | 60 | 72.2 | 10.2 |
Publisher’s Note: MDPI stays neutral with regard to jurisdictional claims in published maps and institutional affiliations. |
© 2022 by the authors. Licensee MDPI, Basel, Switzerland. This article is an open access article distributed under the terms and conditions of the Creative Commons Attribution (CC BY) license (https://creativecommons.org/licenses/by/4.0/).
Share and Cite
Le, T.D.; Ge, M.; Anwar, A.; Loke, S.W.; Beuran, R.; Doss, R.; Tan, Y. GridAttackAnalyzer: A Cyber Attack Analysis Framework for Smart Grids. Sensors 2022, 22, 4795. https://doi.org/10.3390/s22134795
Le TD, Ge M, Anwar A, Loke SW, Beuran R, Doss R, Tan Y. GridAttackAnalyzer: A Cyber Attack Analysis Framework for Smart Grids. Sensors. 2022; 22(13):4795. https://doi.org/10.3390/s22134795
Chicago/Turabian StyleLe, Tan Duy, Mengmeng Ge, Adnan Anwar, Seng W. Loke, Razvan Beuran, Robin Doss, and Yasuo Tan. 2022. "GridAttackAnalyzer: A Cyber Attack Analysis Framework for Smart Grids" Sensors 22, no. 13: 4795. https://doi.org/10.3390/s22134795
APA StyleLe, T. D., Ge, M., Anwar, A., Loke, S. W., Beuran, R., Doss, R., & Tan, Y. (2022). GridAttackAnalyzer: A Cyber Attack Analysis Framework for Smart Grids. Sensors, 22(13), 4795. https://doi.org/10.3390/s22134795