1. Introduction
Fabric anomalies (i.e., defects) have a strong economic impact, making their detection an essential aspect of fabric production [
1]. However, anomaly detection AD in fabrics is still largely performed by human operators, and the outcome depends on the training, skill level, and fatigue of the personnel [
2]. Even at peak performance, human operators are only capable of detecting 60–80% of defects [
3,
4], while simultaneously accounting for at least 10% of total labor costs [
5]. Together, this calls for machine vision solutions that are capable of automated defect detection.
In context of automated fabric defect detection, semi-supervised methods (methods that require normal/defect-free data only [
6,
7]) are most commonly employed. The reason for this is that anomalies such as fabric defects are rare events and expensive to sample, whereas normal data are typically readily available. However, semi-supervised methods are currently limited to fabrics of low complexity (i.e., unimodal appearance) [
8,
9,
10,
11].
For fabrics of high complexity (i.e., multimodal appearance), supervised approaches that require both normal and anomalous data [
6,
7] are predominantly used. For example, classification, segmentation and object detection approaches have been successfully adapted to the fabric inspection task [
12,
13,
14,
15,
16,
17]. Moreover, supervised algorithms generally outperform their semi-supervised counterparts [
18,
19]. However, supervised methods suffer from a major drawback: They generalize poorly to fabrics unseen during model training [
20,
21] and therefore do not meet the industrial requirement for low changeover costs. Instead, defective and defect-free data must be collected and annotated for every new fabric, which is a tedious, time-consuming, and expensive process.
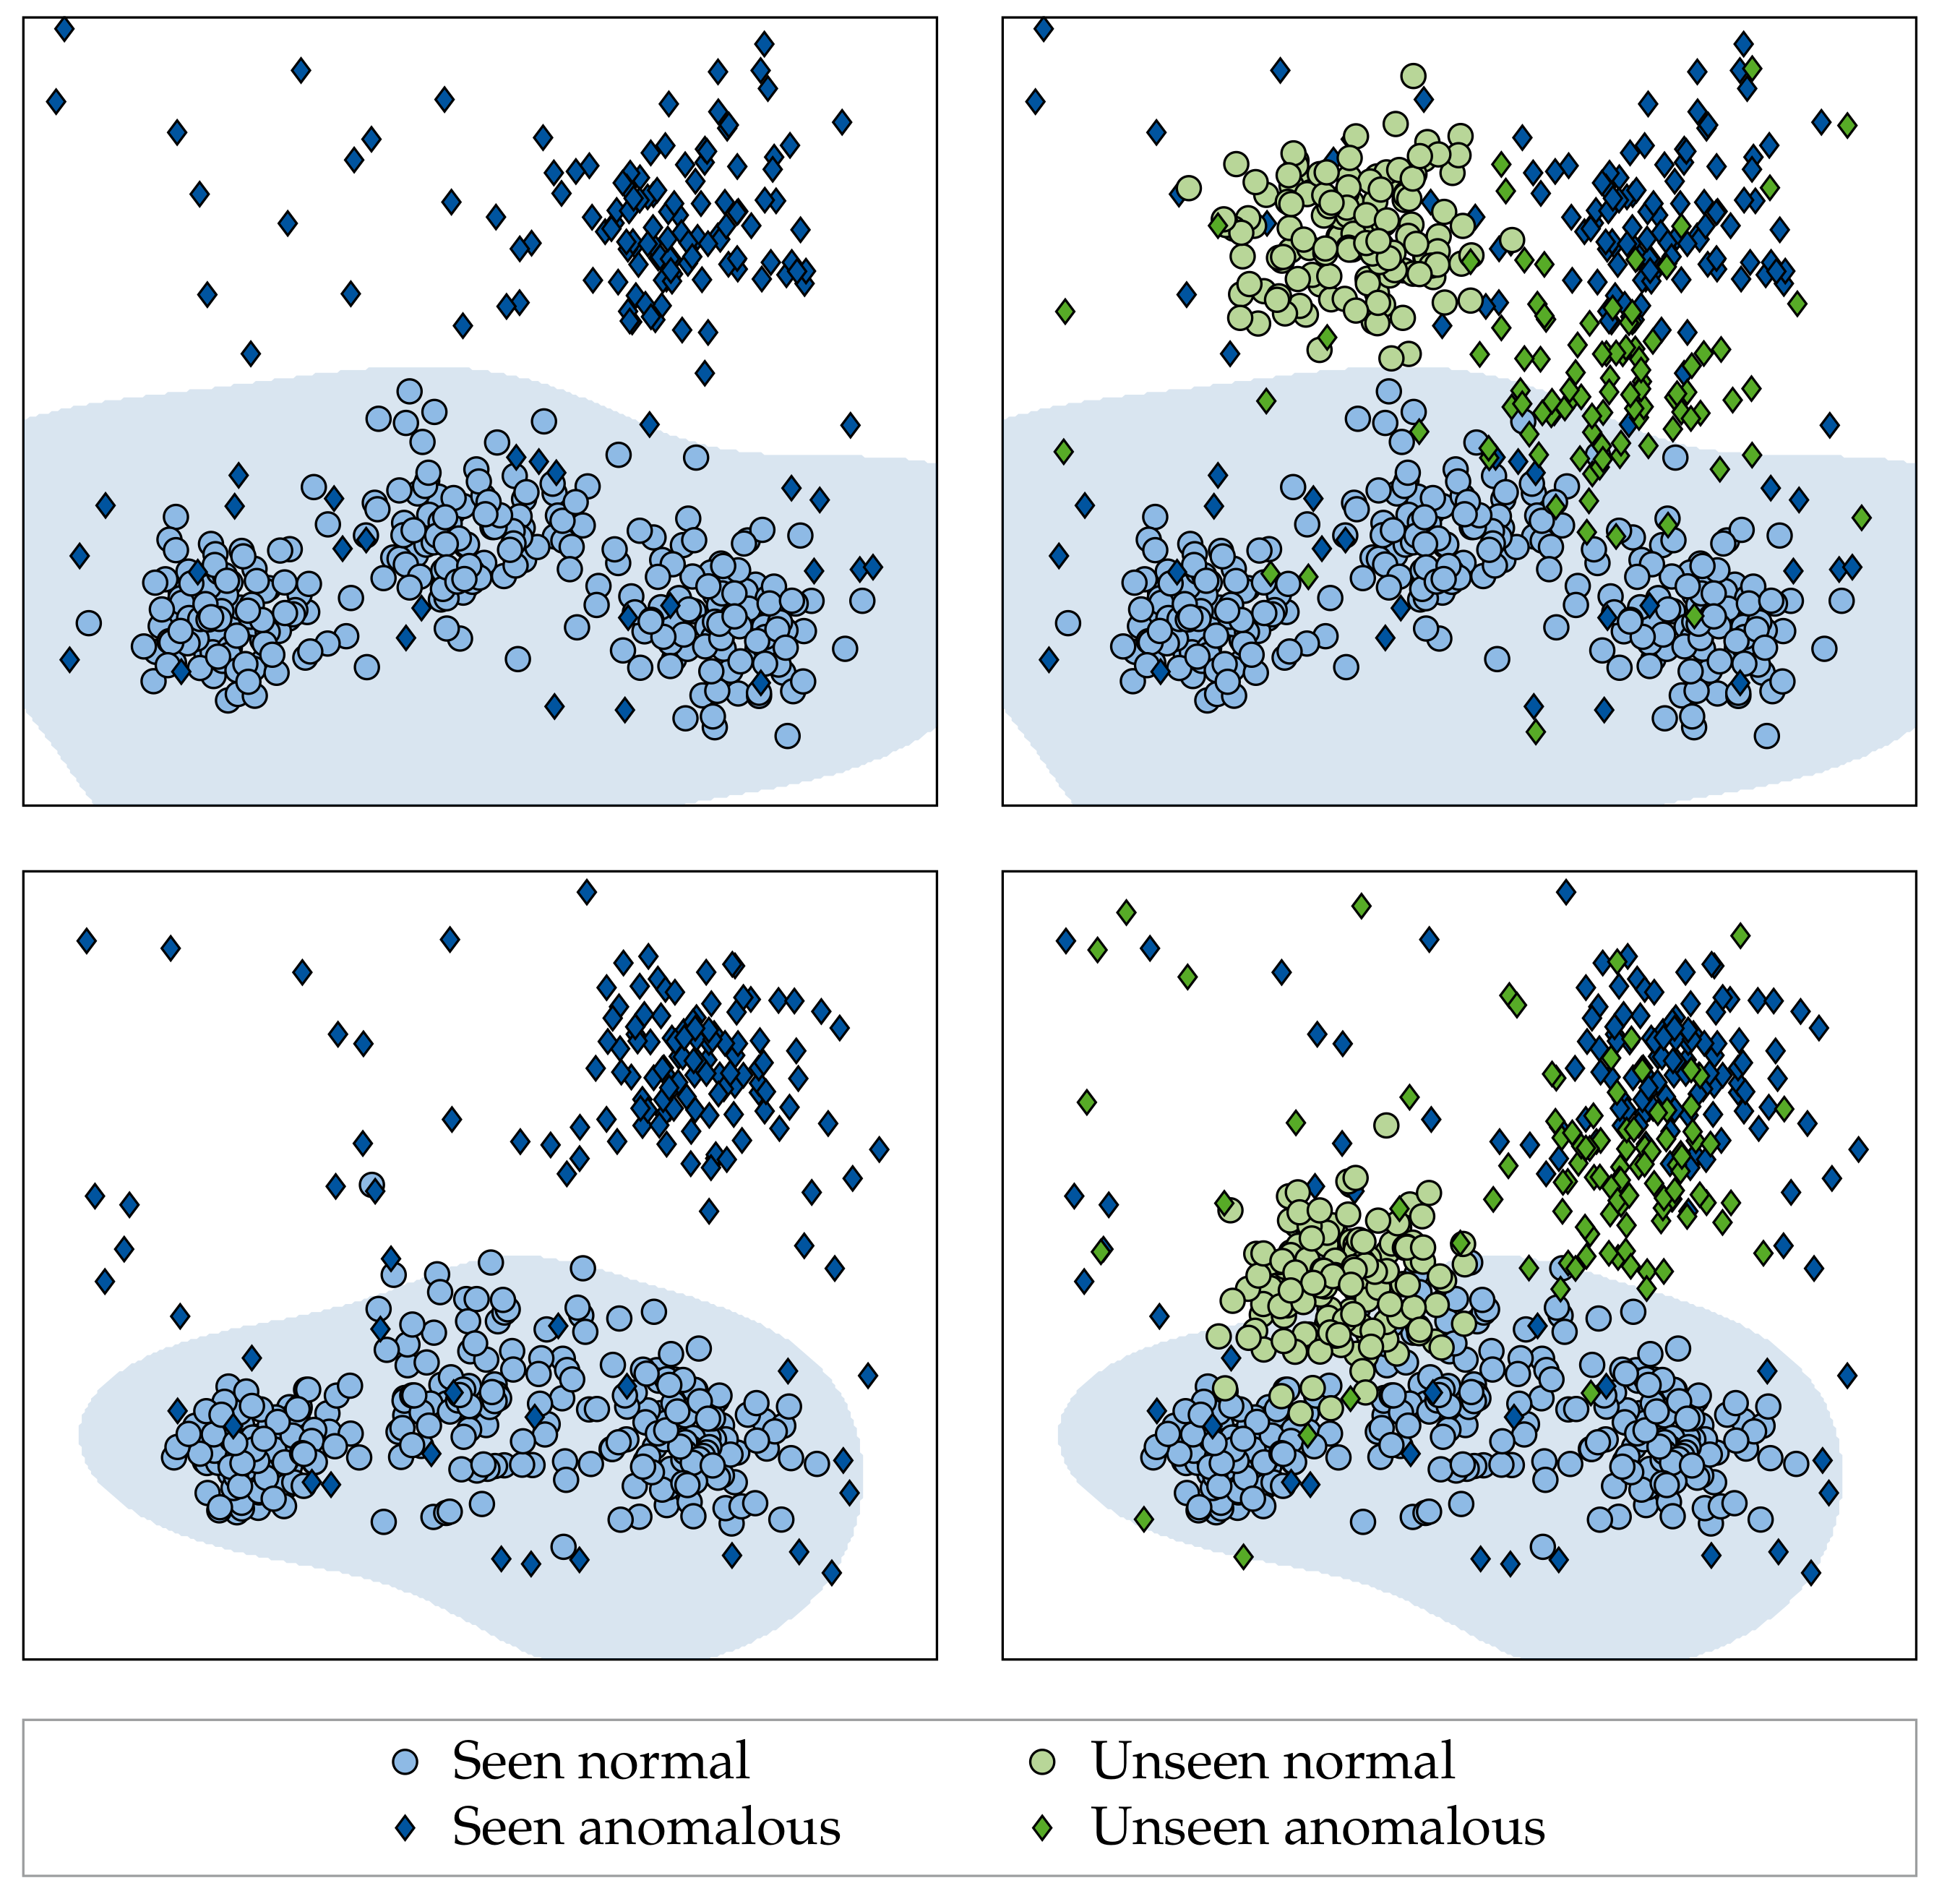
While algorithms have been proposed to tackle this limitation, current research focuses on adapting converged models to new fabrics in a post hoc manner [
20,
21]. It thereby disregards the potential of training models that generalize better to unseen fabrics in the first place (see
Figure 1). In our work, we explore this potential for the first time in the context of supervised fabric AD/inspection, but note that related articles cover generalization for computer vision in natural images [
22,
23,
24]. However, a clear academic consensus has not yet been established, and many research questions remain unanswered. Moreover, it has been shown recently that no proposed hypothesis/method consistently improves performance across different kinds of distribution shifts [
22]. Together, this strongly demonstrates the necessity of our work, as we propose to view previously unseen fabrics as shifts in the underlying data distribution. Specifically, our contributions are as follows:
We set up an exhaustive dataset containing 38 complex fabrics and more than 6400 images in total. The dataset is used to thoroughly validate all the findings of our work and is made publicly available at
https://github.com/ORippler/OLP-dataset.
We propose to view previously unseen fabrics as shifts in the underlying data distribution. We therefore argue that factors which reportedly improve a model’s resistance to distribution shifts [
22,
23,
24,
25] should also improve the generalization of supervised fabric AD methods to unseen fabrics and evaluate the potential benefits of: (I) VRM techniques adapted to the fabric AD use-case, (II) different loss functions, (III) ImageNet [
26] pre-training, (IV) dataset diversity, and (V) model architecture as well as model complexity.
We furthermore investigate whether better generalizing models are synergetic to post hoc adaptation methods such as [
21], i.e., whether the performance on unseen fabrics can be further increased by applying post hoc adaptation methods.
3. OLP Dataset
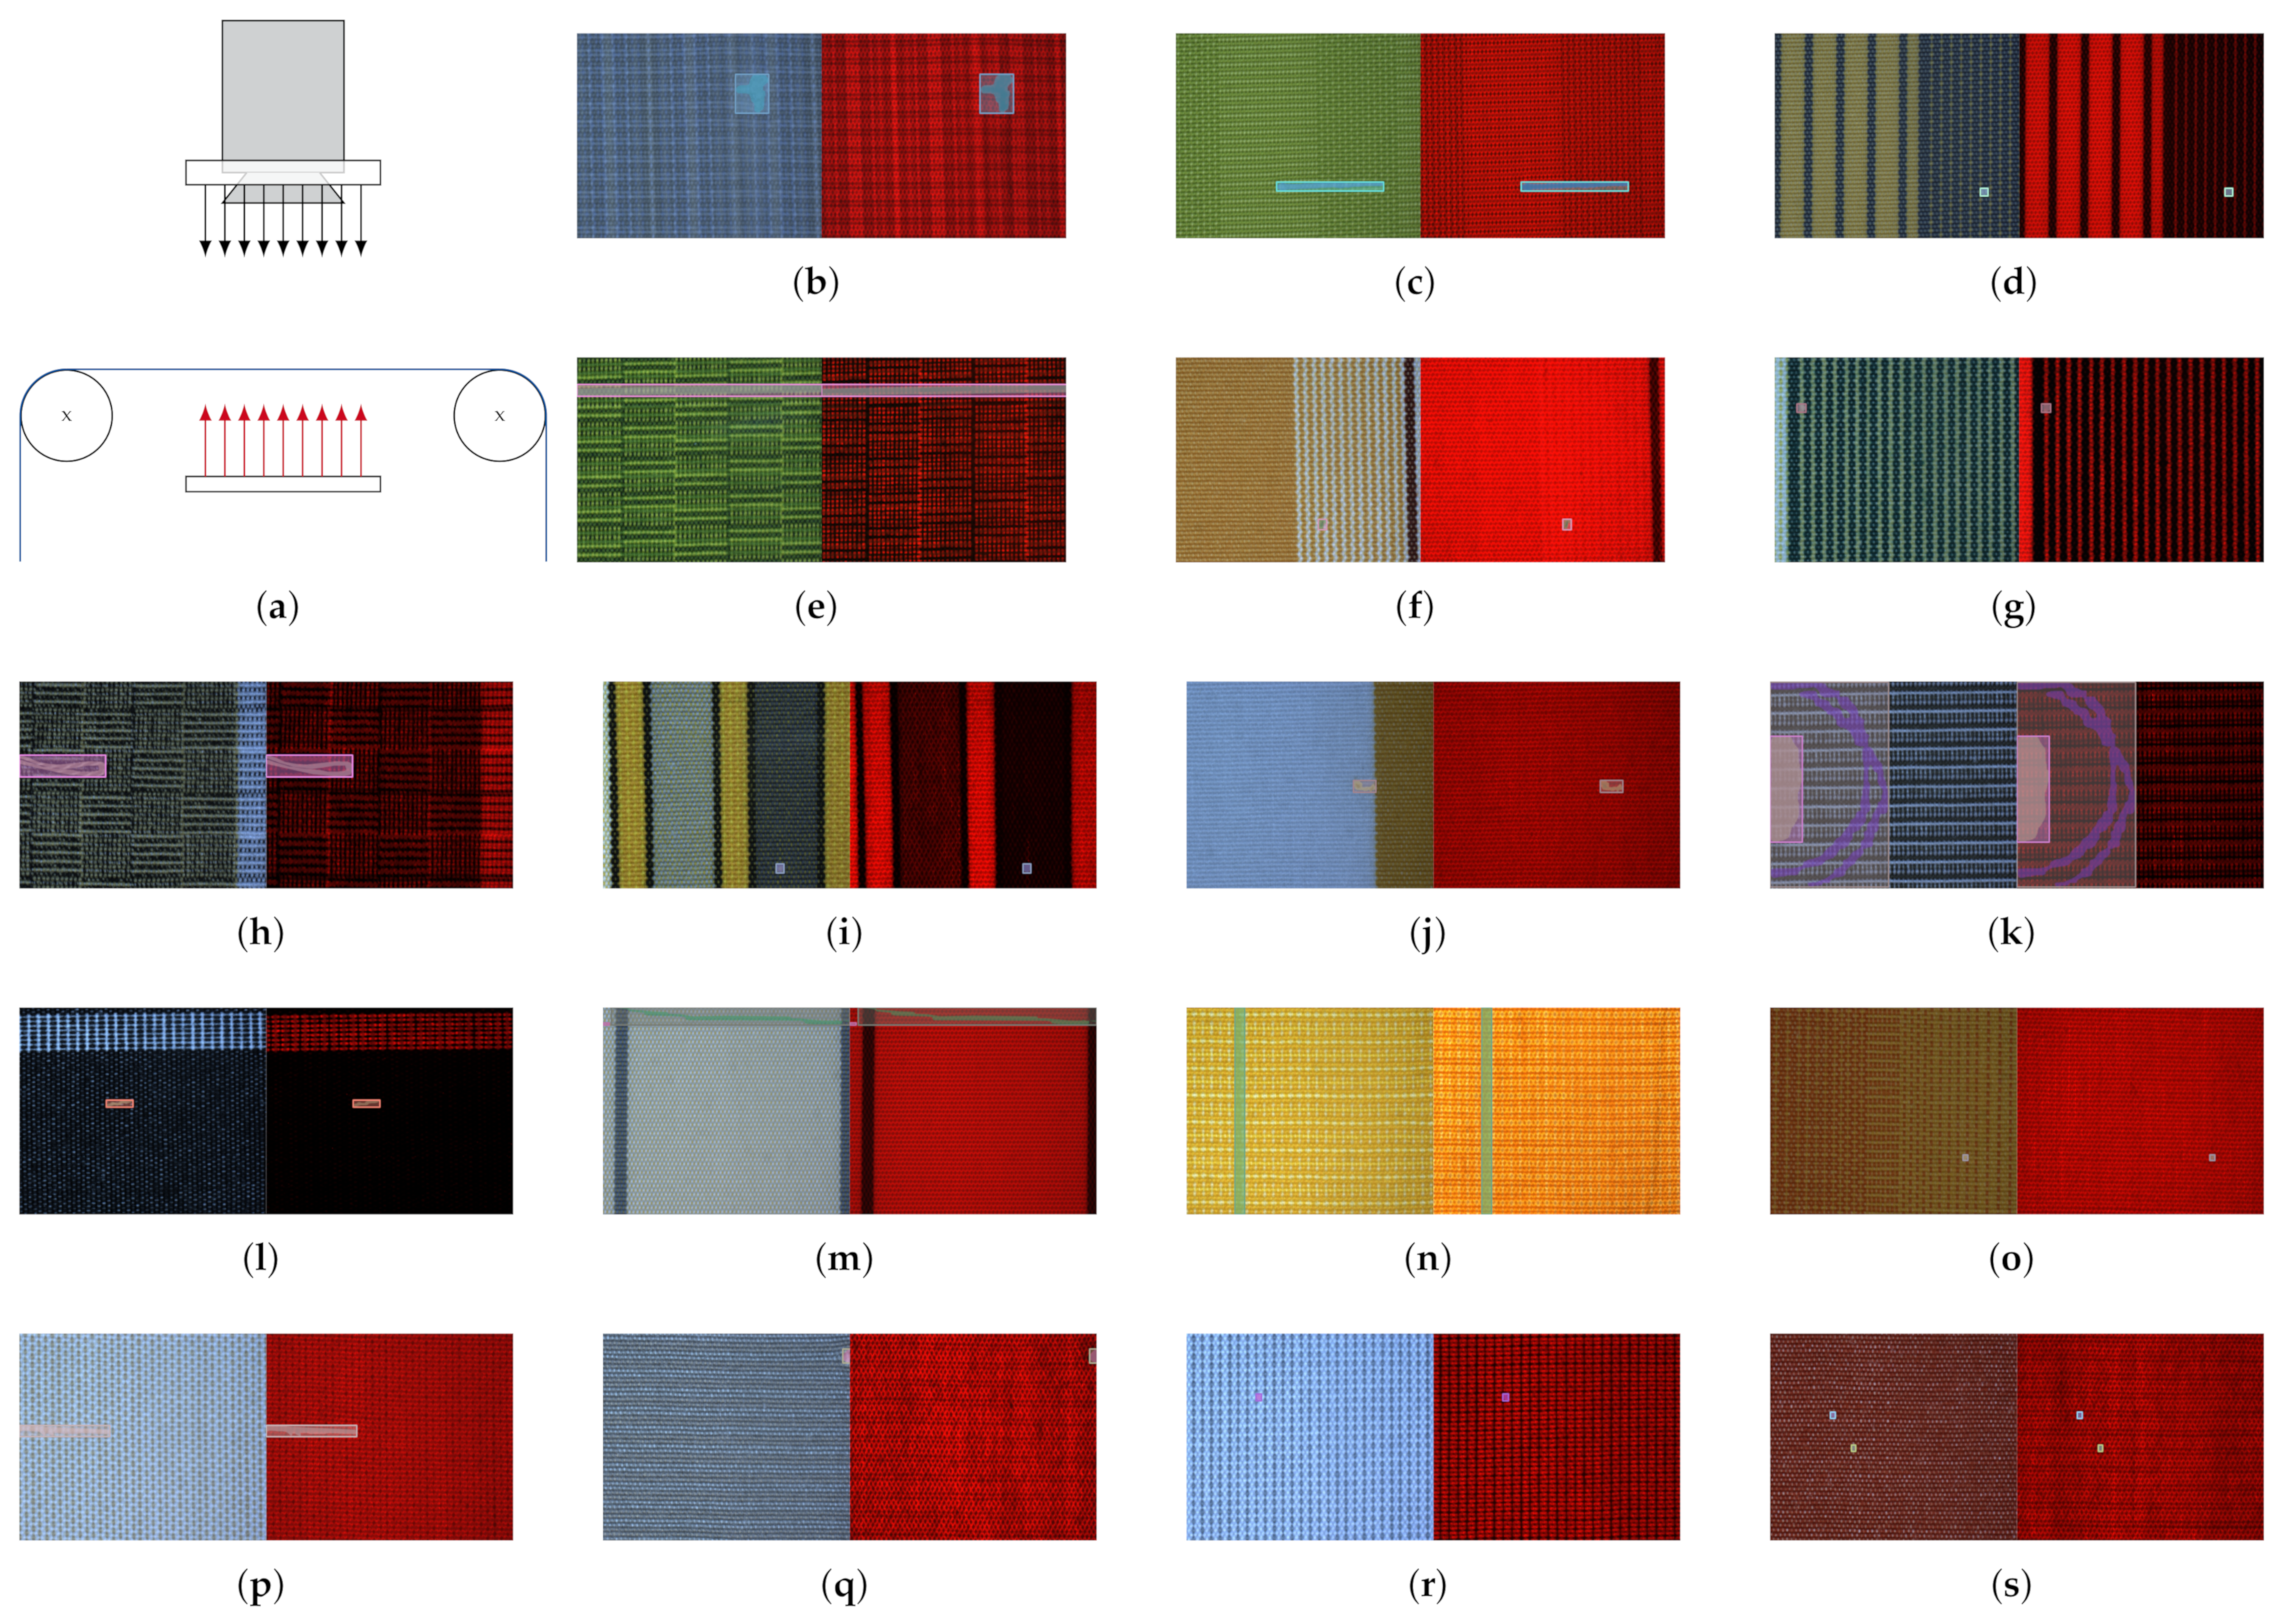
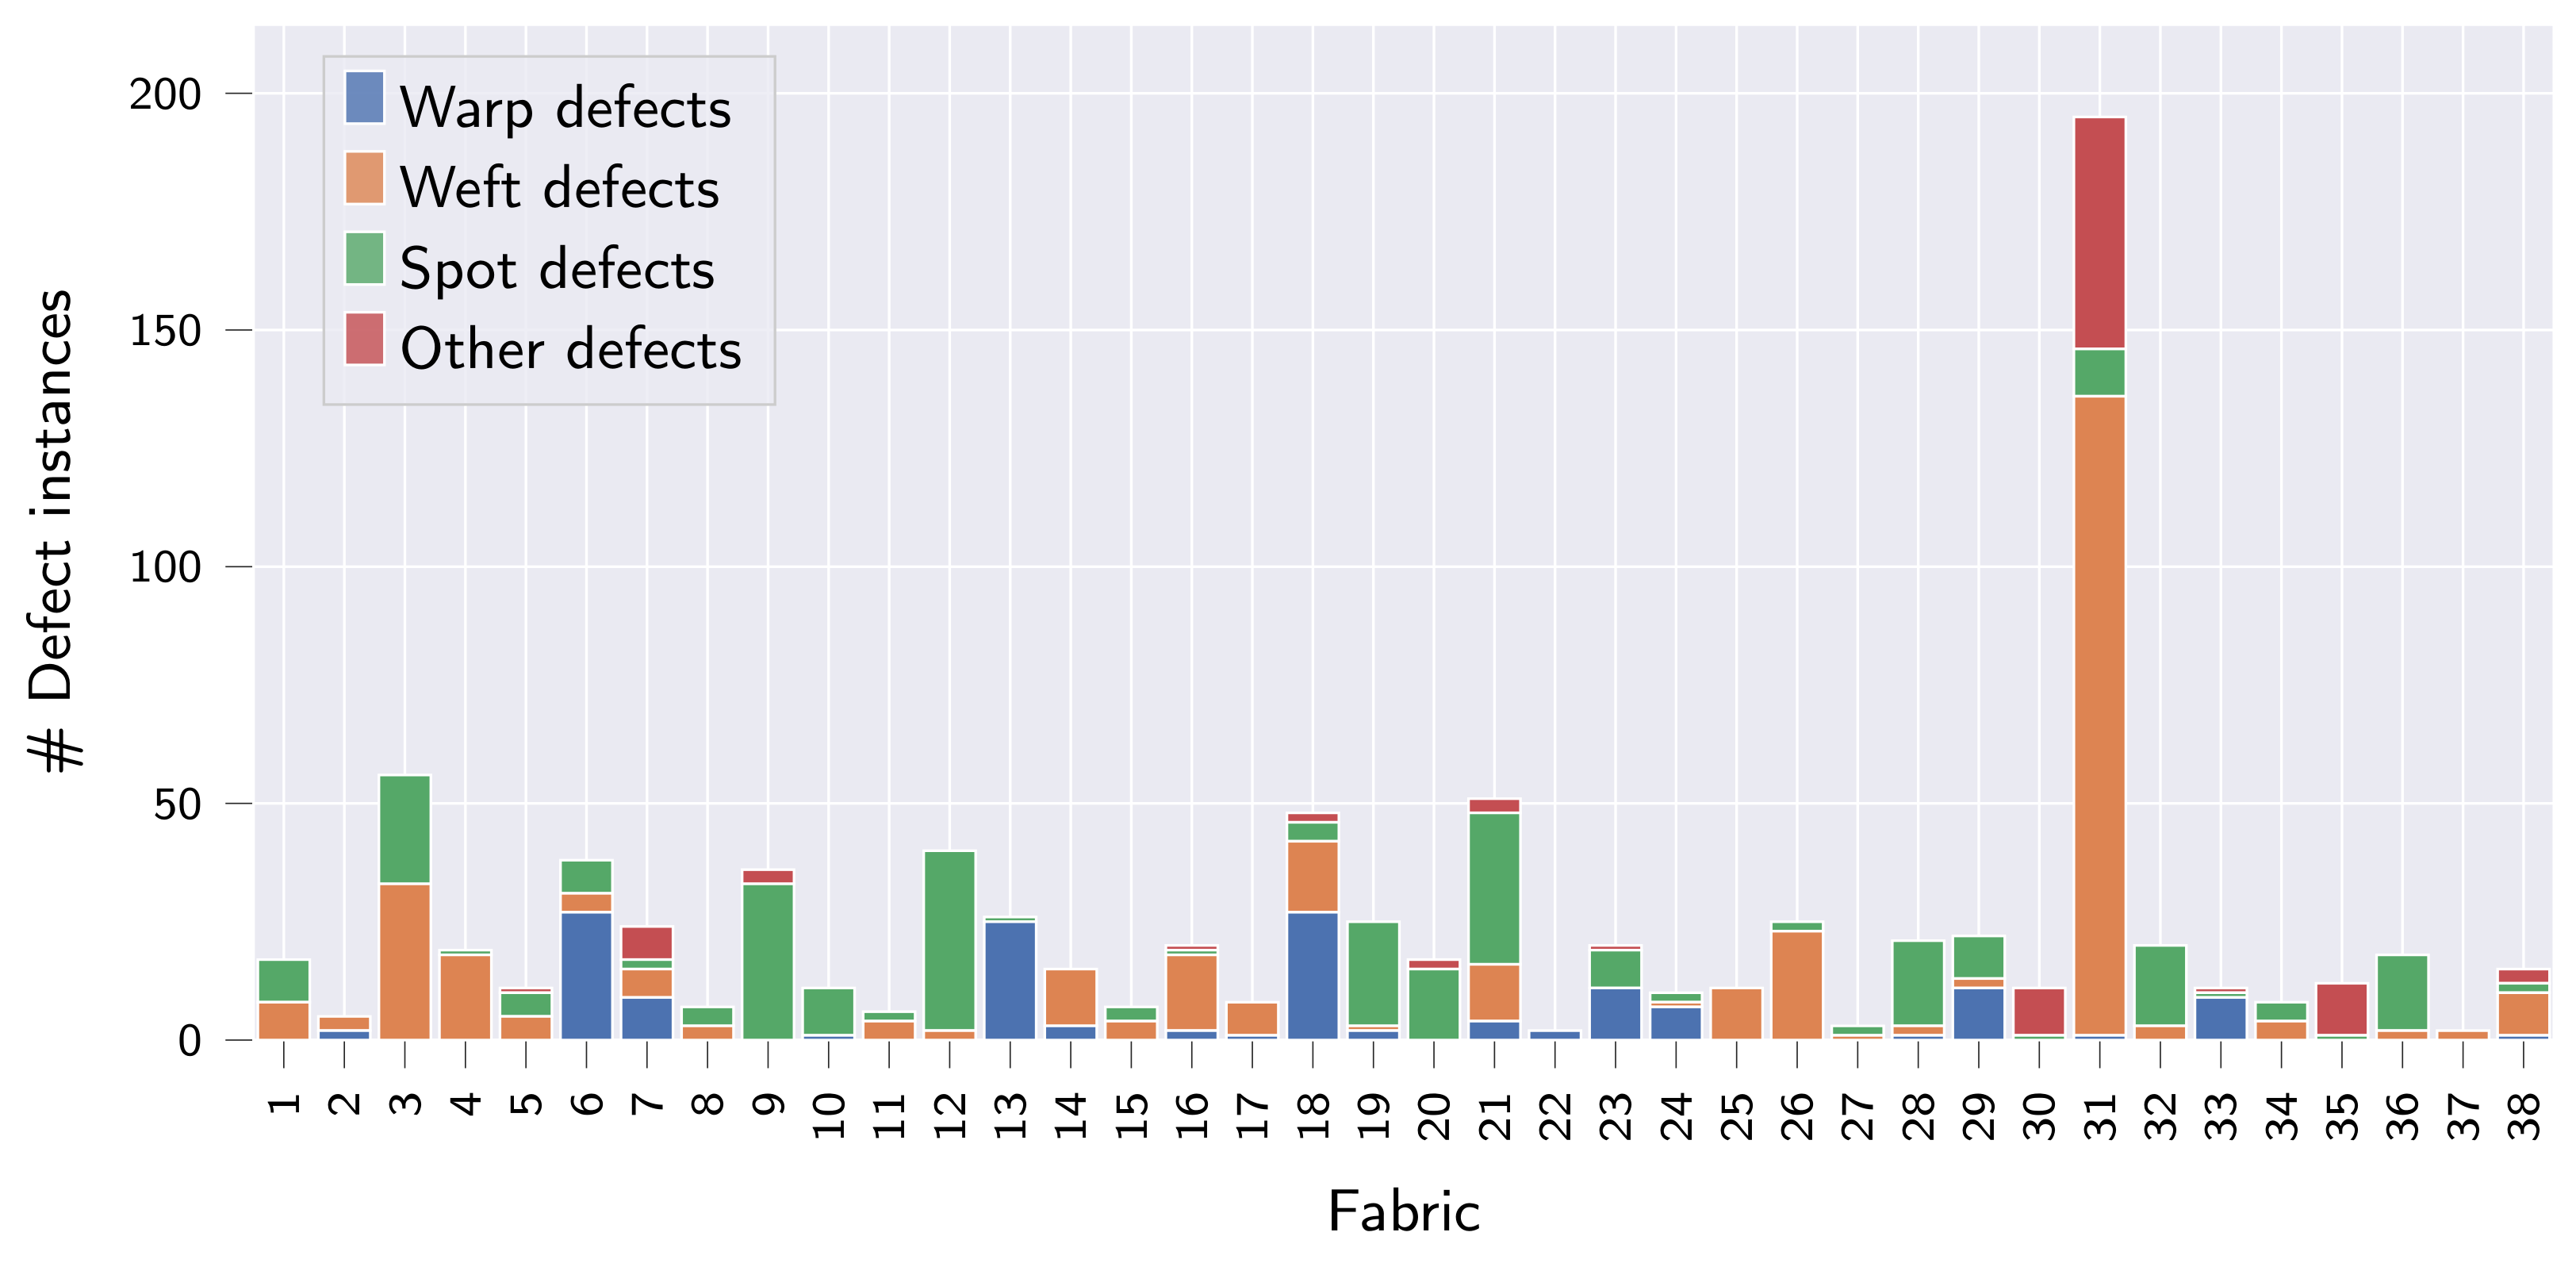
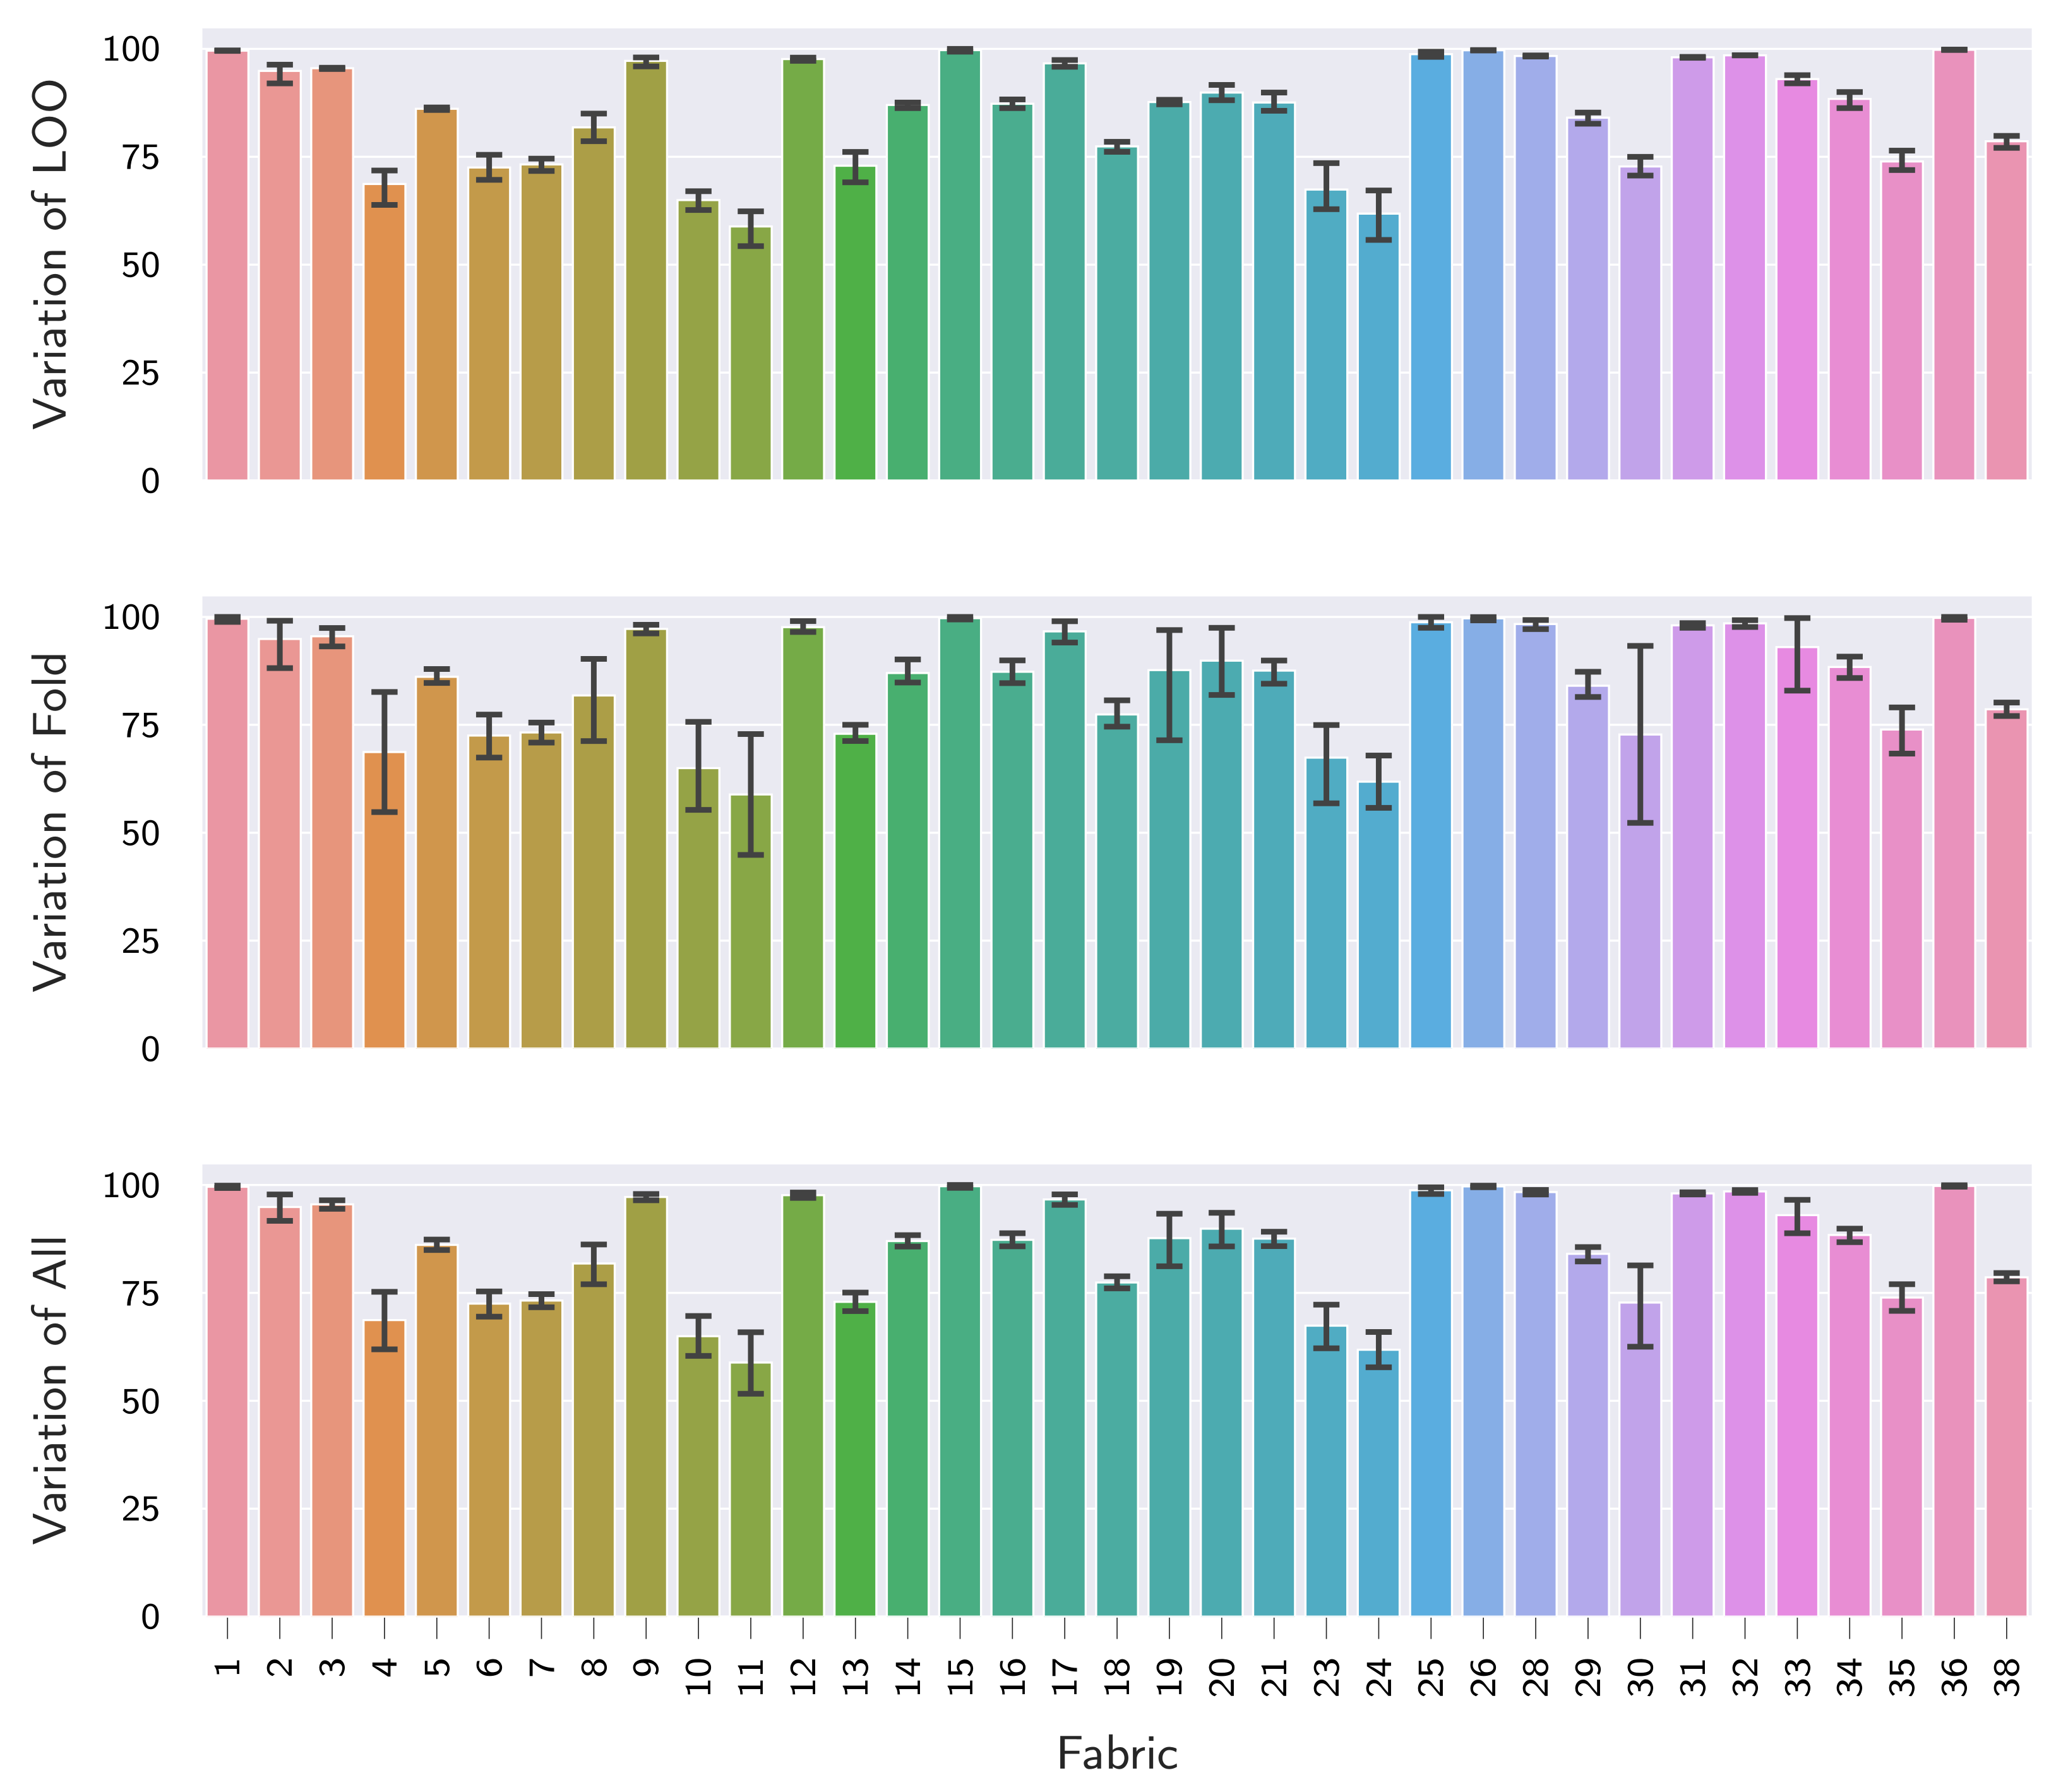
While collecting the fabric dataset, focus was put on sampling as many individual fabrics as possible. The final fabric dataset thus comprises a total of 38 woven, patterned fabrics and is named OLP (short for OnLoomPattern, the research grant that funded the dataset acquisition). For each fabric, front-light and back-light RGB image pairs were captured at 2000 dots per inch (DPI) resolution, giving complementary information on light reflectance vs. light transmission of the inspected fabric specimen (refer also to
Figure 2a). While a white ring-LED was used for front-light illumination, both red and white LEDs were used for the acquisition of back-light images. In total, the dataset contains 6469 image pairs across all fabrics, of which 627 are labeled as anomalous (see
Table 2 and
Figure 3 for detailed statistics). For each anomalous image pair, all defect instances were subsequently annotated manually by a single operator, providing both bounding box, segmentation mask and defect type per defect instance. For the classification of defect instances into different defect types, we follow the hierarchical approach from [
1], and provide the classification into the following four first-order defect classes: (I) warp defects, (II) weft defects, (III) spot defects and (IV) other defects. A more fine-grained classification of defects as proposed in [
42,
43] and used in [
35,
37] is certainly possible but infeasible for the OLP dataset given the limited number of anomalous samples available. Due to the provided defect classification, the dataset is also suited to study the generalization of segmentation and object detection algorithms in the multi-class setting, which the ZJU-Leaper and LFLP datasets cannot be used for. A representative anomalous sample with bounding box and segmentation mask is shown for fabrics 1–18 in
Figure 2 to provide a better overview of the dataset.
4. Methods
Out of the mechanisms used to explain a model’s failure to generalize, we believe that fabric AD models are affected the most by the “distribution gap” [
44], i.e., when training and test data do not originate from the same data distribution. This becomes apparent when considering changes in background fabric appearance as shifts in the underlying data distribution (refer to
Figure 1 and
Figure 2). Therefore, we argue that factors and techniques which have been shown to improve the robustness of models to data distribution shifts should also increase the generalization of supervised fabric AD methods to unseen fabrics. It should be noted that developing such techniques is in itself an active avenue of research [
22]. Moreover, it has been shown recently that the effects of identified factors/techniques are not consistent across different kinds of distribution shifts [
22], further increasing the need for our work.
For simplicity, we focus on tried-and-true methods in our evaluations, which we adapt to the supervised fabric AD use-case. Specifically, we (I) make use of VRM, where the vicinity of the training data is sampled, e.g., by means of data augmentation. In addition to VRM, we also assess the following four components that have been reported to influence the resistance of models to distribution shifts [
22,
23,
24,
25]: (II) ImageNet pre-training, (III) loss functions, (IV) dataset diversity, as well as (V) model architecture and complexity. We will give the details of each component in the following sections.
4.1. Vicinal Risk Minimization
For VRM, we employ rule-based augmentation schemes [
13,
45,
46,
47], which require less computation than approaches where the optimal augmentations are learned, e.g., by means of reinforcement learning or adversarial training [
22,
48,
49]. Simultaneously, rule-based augmentation schemes achieve comparable performance if configured properly [
22]. Specifically, we adapt AugMix [
45], CutOut [
47] and MixUp [
13] to the supervised fabric AD task and compare their respective influences in
Section 5.2.2.
4.1.1. AugMix
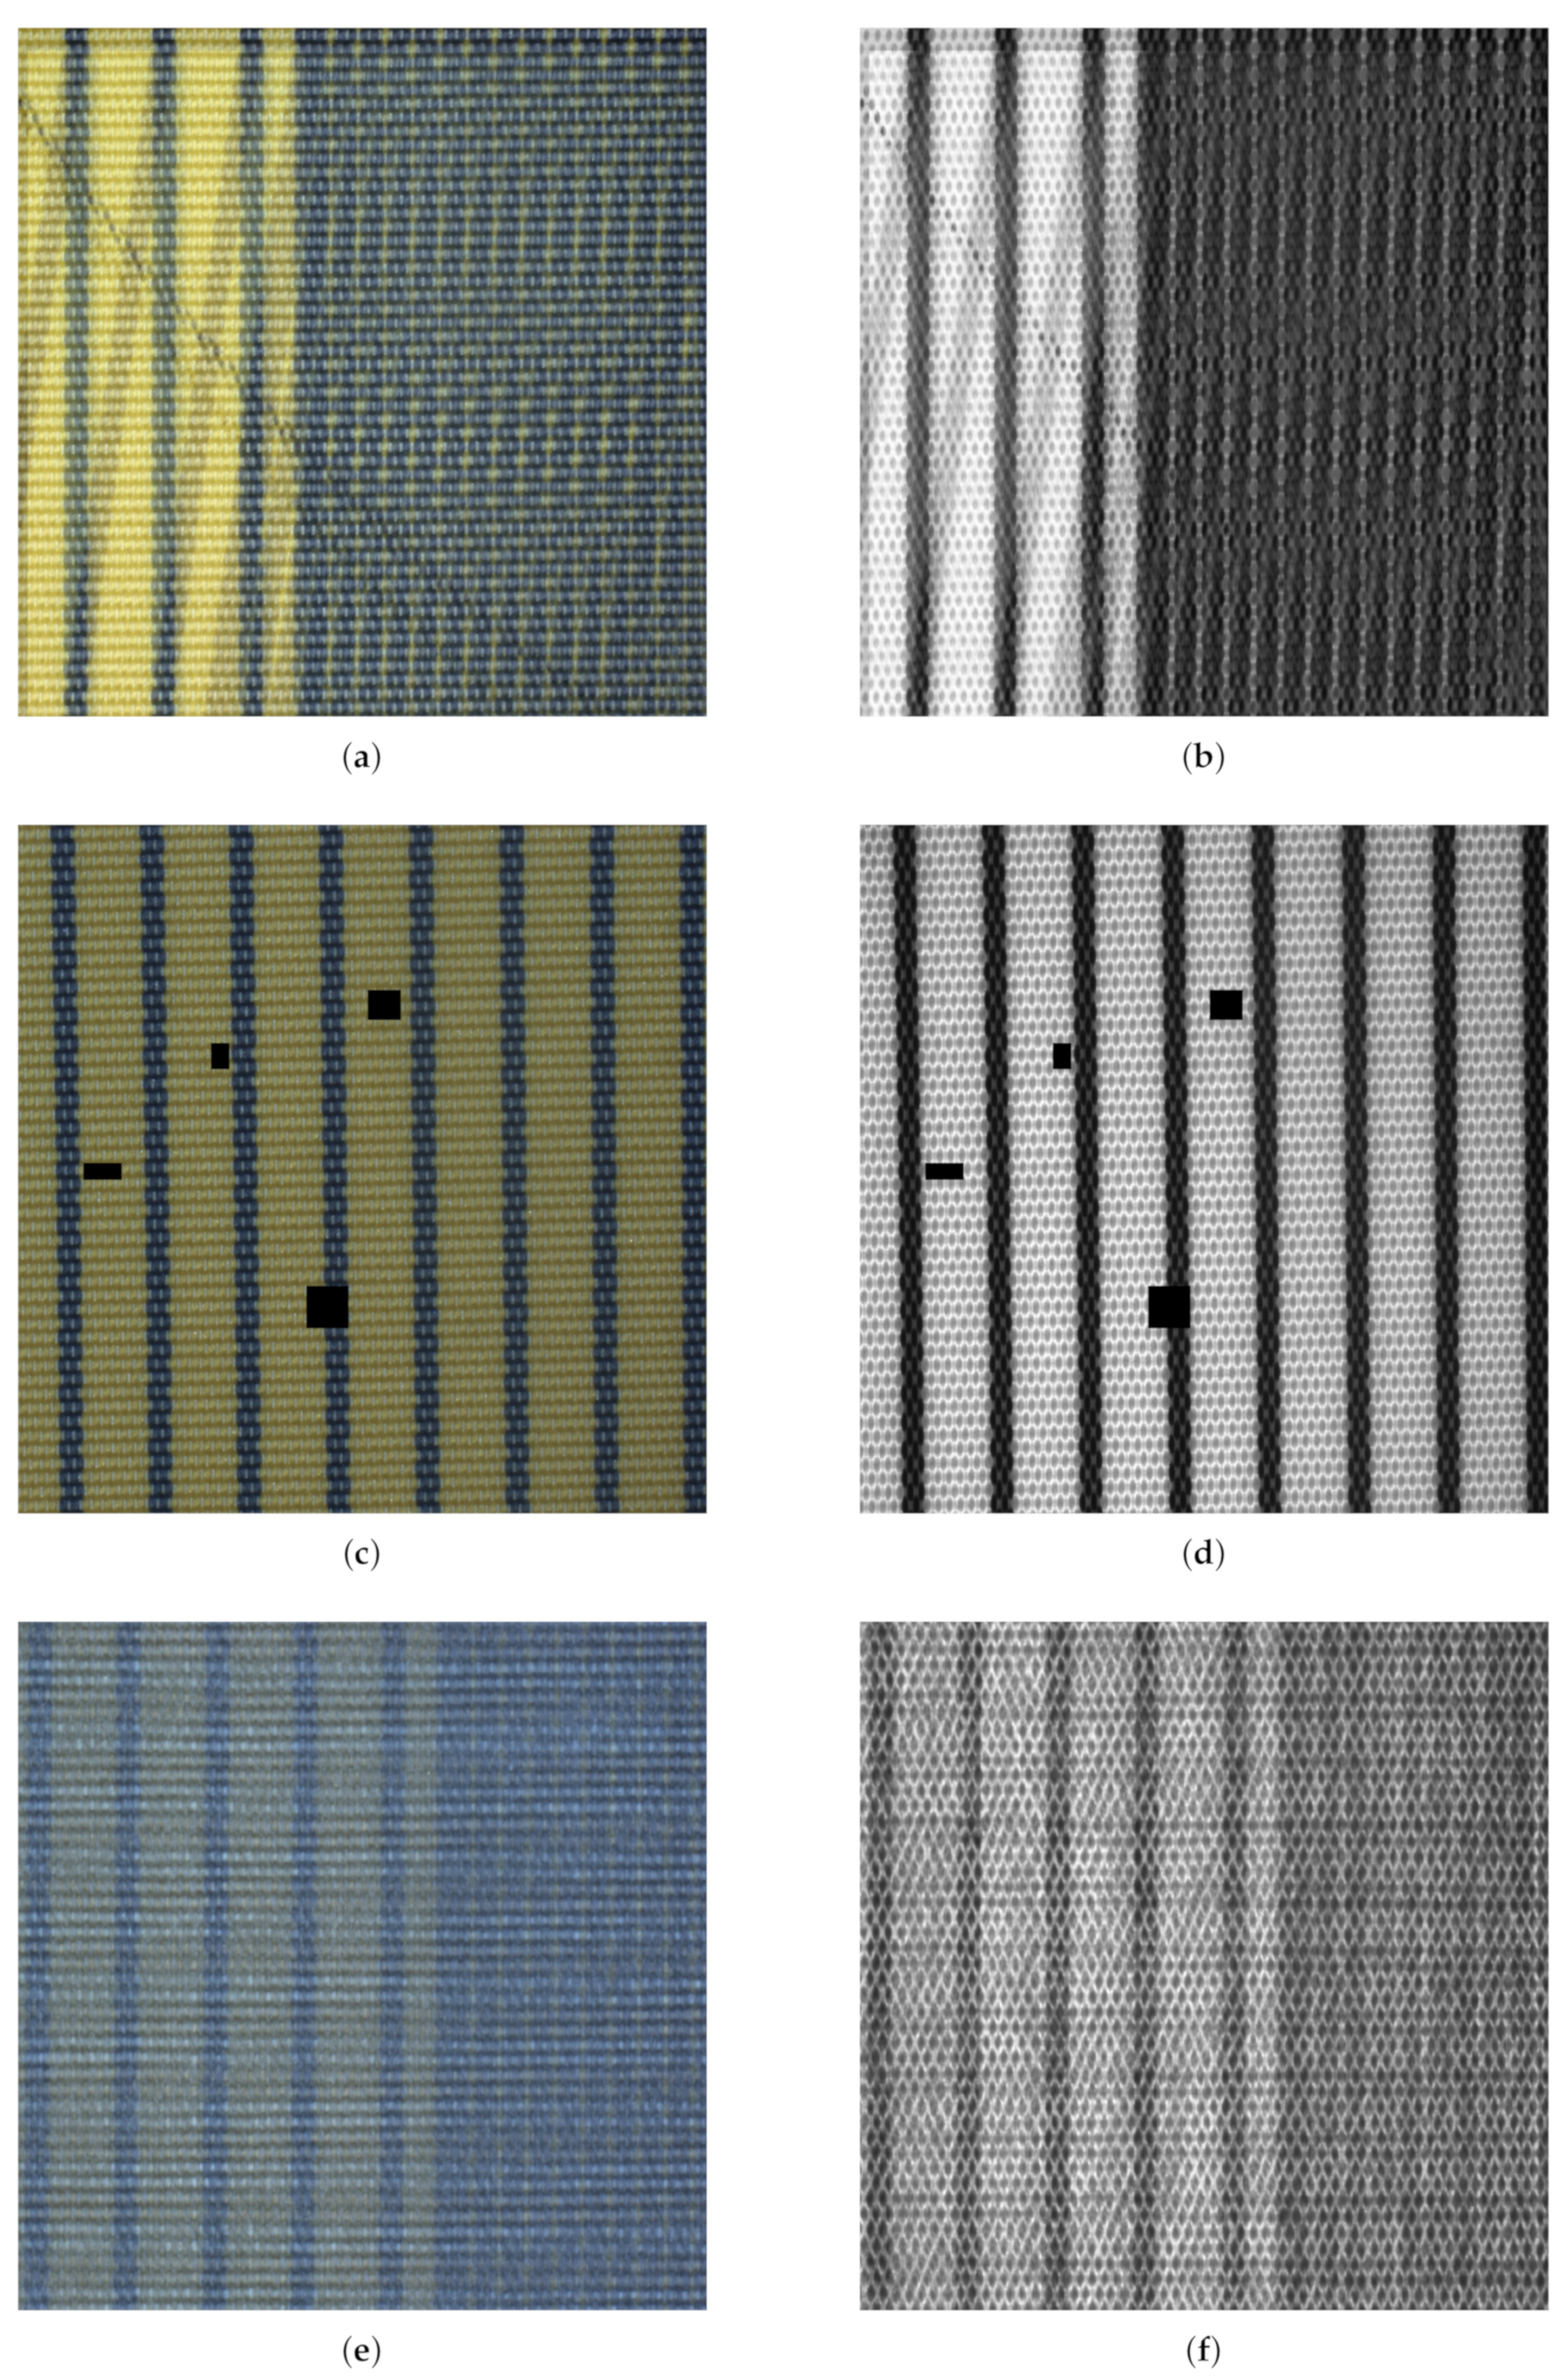
In AugMix [
45], augmentations are achieved by randomly sampling and compositing augmentations from a predefined set of base augmentations. We adapt AugMix to the fabric AD task by ensuring that every front- and back-light image pair is augmented identically (refer
Section 3). Furthermore, we restrict the sampled augmentations and their parametrization to useful values as determined by prior experiments and provide details in
Table 3. We leave the parameters
,
width and
depth of AugMix at default values, as proposed in [
45], and apply AugMix to 50% of the training samples. Last, we omit the Jensen–Shannon divergence term from the augmented images, as it showed no additional benefits during preliminary experiments. A representative sample for the augmentations generated by AugMix is shown in
Figure 4a,b.
4.1.2. CutOut
In CutOut [
47], random parts from an image are erased in order to enforce that the model bases its decision on multiple features/regions of interest. We adapted CutOut to the fabric AD task by ensuring that the same parts are erased in every front- and back-light image pair. When employed, we apply CutOut to 50% of the training samples and randomly erase between 1 and 4 rectangular patches of width and height
, respectively. These parameters were again determined based on preliminary experiments and remain fixed throughout this work. A representative sample for the augmentations generated by CutOut is shown in
Figure 4c,d.
4.1.3. MixUp
In MixUp [
13], the vicinity of the training data was sampled by mixing both training samples and their respective class labels. We adapted MixUp to the fabric AD task by ensuring that we only mix within the anomalous and normal samples respectively. The reason for this is that the evaluated hypersphere classifier (HSC) loss (refer
Section 4.3.2) requires binary labels, which would no longer be present when mixing between anomalous and normal samples. Apart from this, we left all hyperparameter values of MixUp as proposed in [
13] and applied MixUp to all training samples. A representative sample for the augmentations generated by MixUp is shown in
Figure 4e,f.
4.2. ImageNet Pre-Training
ImageNet pre-training has been shown to improve robustness to data distribution shifts [
22,
25], and we therefore investigated its potential benefits. Since our input data consisted of effectively 4 color channels (RGB reflectance + transmission luminance, refer
Section 5.1), we initialized all but the first convolution layer of the assessed convolutional neural networks (CNNs) with weights generated by training on ImageNet. Thus, the first convolution layer was trained from scratch after being initialized as proposed in [
50], whereas the rest of the CNN’s weights were fine-tuned.
The benefits of pre-training have been furthermore reported to diminish with the increasing semantic distance between the target domain and the domain used for pre-training [
23,
51], which is large in our case. However, these results refer to in-distribution performance only, and it has not yet been investigated whether the same tendency holds also for distribution shifts. Moreover, transfer learning with ImageNet-pre-trained weights was shown to be beneficial for supervised fabric AS based on front-light RGB images recently [
19].
4.3. Loss Functions
We also evaluated the potential benefits of different loss functions on the generalization of supervised fabric AD methods to unseen fabrics. Specifically, we employed the standard binary cross-entropy (BCE) [
52], as well as the HSC [
53] and the focal loss (FL) objectives [
54]. Both HSC and FL objectives are modifications of the BCE.
4.3.1. BCE
The BCE is defined as:
where
denotes a neural network parametrized by
applied to an image
, and
y denotes whether an image is considered normal (
) or anomalous (
).
4.3.2. HSC
Since the BCE does not enforce that normal/defect-free data are concentrated, the HSC objective has been proposed [
53], defined as
Here, the anomaly score of an image is given as .
4.3.3. FL
When framing AD to be an imbalanced classification problem, the FL objective can be applied [
54]. It modifies the BCE objective to give an increased weight to samples that are currently uncertain/misclassified under the learned decision boundary. Specifically, it is defined as:
with
being the focusing parameter that can be used to put increasing focus on misclassified samples. During our experiments, we left
as proposed in [
54].
4.4. Dataset Diversity
The appearance of fabrics is mainly influenced by the imaging setup and by the fabric properties, which are themselves determined by the material composition (e.g., color) and fabric production parameters (e.g., the weave-repeat for woven fabrics). We argue that our imaging setup is optimal for visual inspection, since it covers both light reflectance and light transmission (refer
Figure 2a), the two most important optical properties for fabric defect detection [
40]; therefore, we left it fixed throughout our studies. Still, we varied the fabric appearance by acquiring fabrics composed of different materials as well as production properties (refer
Figure 2). However, it should be noted that we did not capture images of highly complex fabrics, e.g., fabrics woven via jacquard, and mainly limited ourselves to fabrics composed of synthetic materials. The reason for this is that the majority of technical fabrics, which are subject to stricter quality control, are made from synthetic fibers. To test the influence of dataset diversity on model generalization, we evaluated both a small subset comprised of the 21 first fabrics (referred to as dataset A) and the complete dataset (referred to as dataset B).
4.5. Model Architecture and Complexity
We also assessed the influence of model architecture and complexity on the generalization to unseen fabrics. To this end, we trained different variants of the ResNet [
55], as well as the EfficientNet [
56] architecture. We chose the ResNet since it is a commonly used model architecture in computer vision research and the EfficientNet for its superior performance on ImageNet. This is important, as architectures with better ImageNet performance are more suited for transfer learning [
23]. Specifically, we trained ResNet-18, ResNet-34 and ResNet-50, as well as EfficientNet-B0, EfficientNet-B2 and EfficientNet-B4 variants, since initial experiments showed that lower model complexities already achieve competitive/sufficient fabric AD performance. An overview of the models with respect to number of trainable parameters, number of floating-point operations (FLOPs) as well as frames per second (FPS) achieved on an Nvidia RTX 3090 is given in
Table 4. We note that the lower FPS for EfficientNet compared to ResNet can be attributed to the unoptimized implementation of depth-wise convolutions in PyTorch [
57], the acceleration framework used in our experiments.
4.6. Post Hoc Adaptation Methods
We also investigated whether the proposed post hoc adaptation methods benefit from better generalizing models. Specifically, we made use of the procedure proposed in [
21] and fit GMMs to estimate the PDF of the unseen fabrics in the latent representations at layer
l of a converged model
. The GMM is defined as:
with
,
K being the number of Gaussian mixture components and
and
denoting the mean vector and covariance matrix of mixture component
i. We approximate the parameters of the GMM by the expectation maximization (EM) algorithm, as is common practice [
58]. We further estimate the number of Gaussian mixture components
K by using the Bayesian information criterion (BIC), choosing it for its strong regularization characteristics [
59]. Moreover, we set
l equal to the layer used for the HSC objective (i.e., the last feature layer).
Following [
21], we used the NLL of the unseen fabric under the estimated PDF,
as the anomaly score.
While we also tried to evaluate potential benefits yielded by fine-tuning the converged models using normal data of the unseen fabrics, initial experiments showed drastic drops in performance due to the onset of catastrophic forgetting. Furthermore, similar observations have been made for AD in natural images recently [
60]. Therefore, we instead evaluated models that have been re-trained from scratch, incorporating normal data of the unseen fabrics here, but note that this is infeasible for an eventual industrial application.
We furthermore failed to assess the benefits of better generalizing models for post hoc adaptation methods that synthesize defects by means of GANs [
18,
20]. While we did implement them, the GAN-based methods failed to converge for our dataset, due to their complex and inherently unstable training process [
33].
6. Discussion
We have investigated the influence of various components on the generalization of supervised fabric AD methods and give a high-level summary of identified trends in
Table 9.
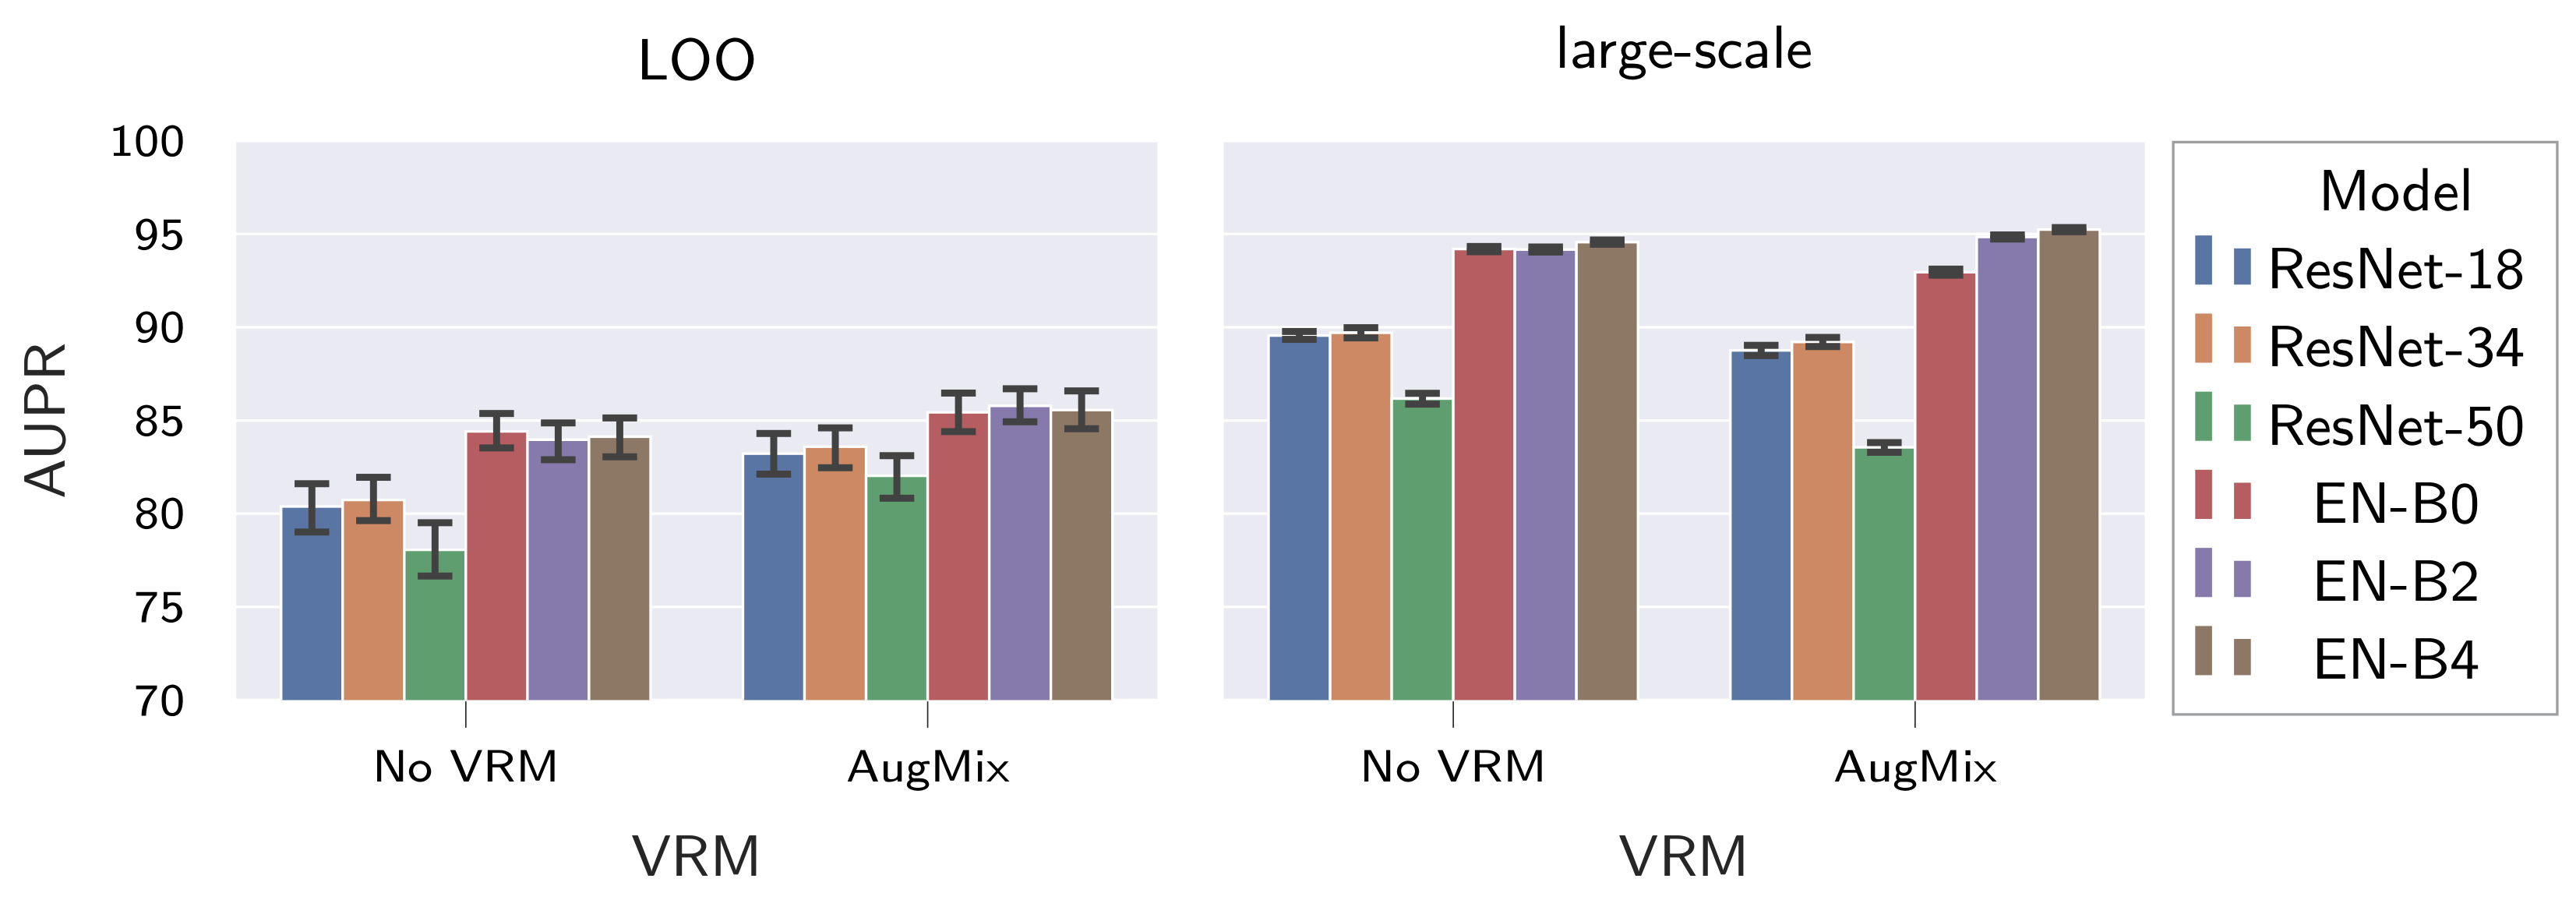
Considering the large differences between large-scale dataset performance and performance on the held-out fabrics, e.g.,
AUPR of
vs.
for an EfficientNet-B4 pre-trained on ImageNet and fine-tuned with HSC loss under application of AugMix on dataset B (refer
Table 8), it can be concluded that cross-fabric generalization of supervised fabric AD models is indeed largely affected by the “distribution gap”. This is further supported by the fact that the LOO fabric had the biggest influence on the conducted variance decomposition (refer
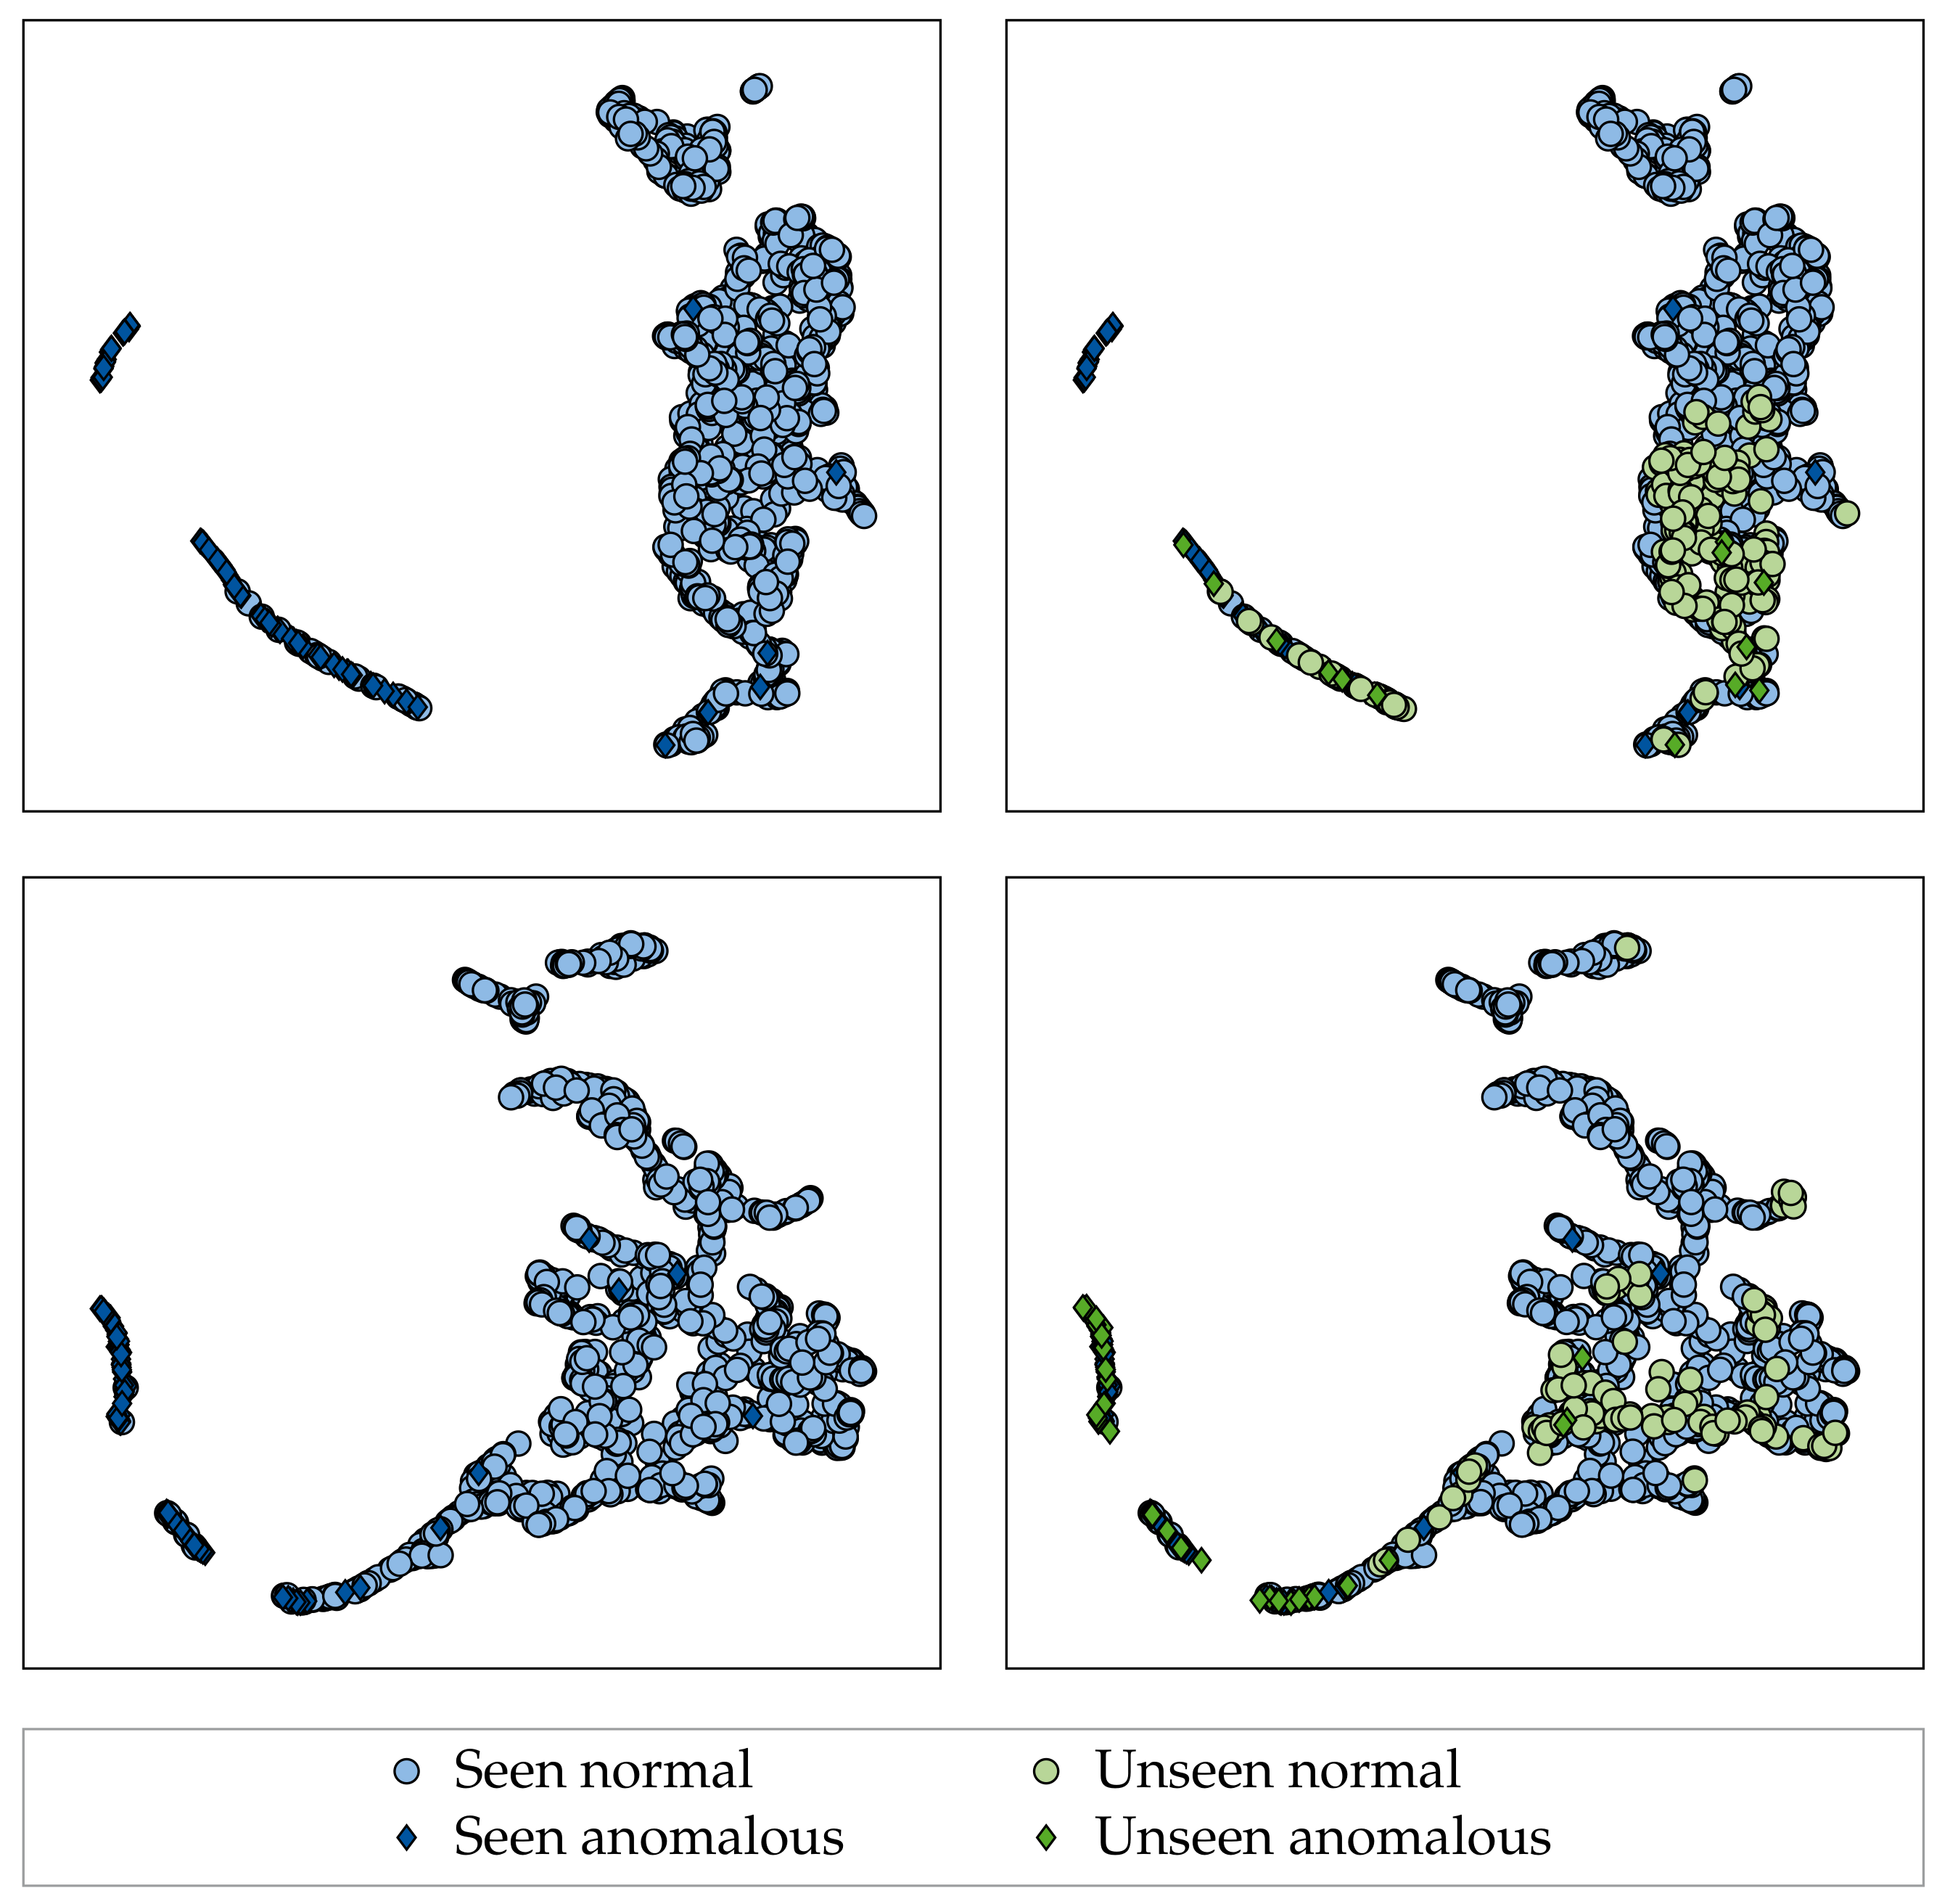
Section 5.2.1.1). Moreover, when investigating the unseen fabrics in the latent embeddings of the models, it could be seen that a shift occurs in both the normal and the anomaly distribution for fabrics with low LOO performance compared to those with high LOO performance (
Section 5.2.1.2). Combined with other recent works [
53,
67], this indicates that the anomaly distribution does not follow a uniform distribution over the latent space [
68,
69] but rather follows a mixture distribution. We therefore argue that future work on supervised fabric AD/defect detection should always perform hold-out experiments similar to ours in order to assess the resistance of proposed methods to distribution shifts (as denoted by LOO performance) in addition to the generalization within the distributions used for training (large-scale dataset performance).
With respect to the influence of the individual components assessed in this work, several conclusions can be drawn: First, ImageNet pre-training increases both generalization within the dataset used for training and the resistance to input distribution shifts and should therefore be used whenever possible (
Section 5.2.1). We thus observe trends similar to [
22,
25], even for datasets that differ greatly from natural images in their appearance [
23,
51], and note that the same observation was made in the medical domain recently [
70]. Moreover, ImageNet-weights were only partially transferred in our work, as the first convolution layer was trained from scratch due to the multichannel nature of the employed image-acquisition setup (refer
Figure 2a). Here, useful next steps would be to contrast pre-training on different datasets, as performed in [
51]. Notably, this comparison should also include defect detection datasets, as a high similarity between source and target domain as well as source and target tasks have been shown to improve transfer learning performance [
51].
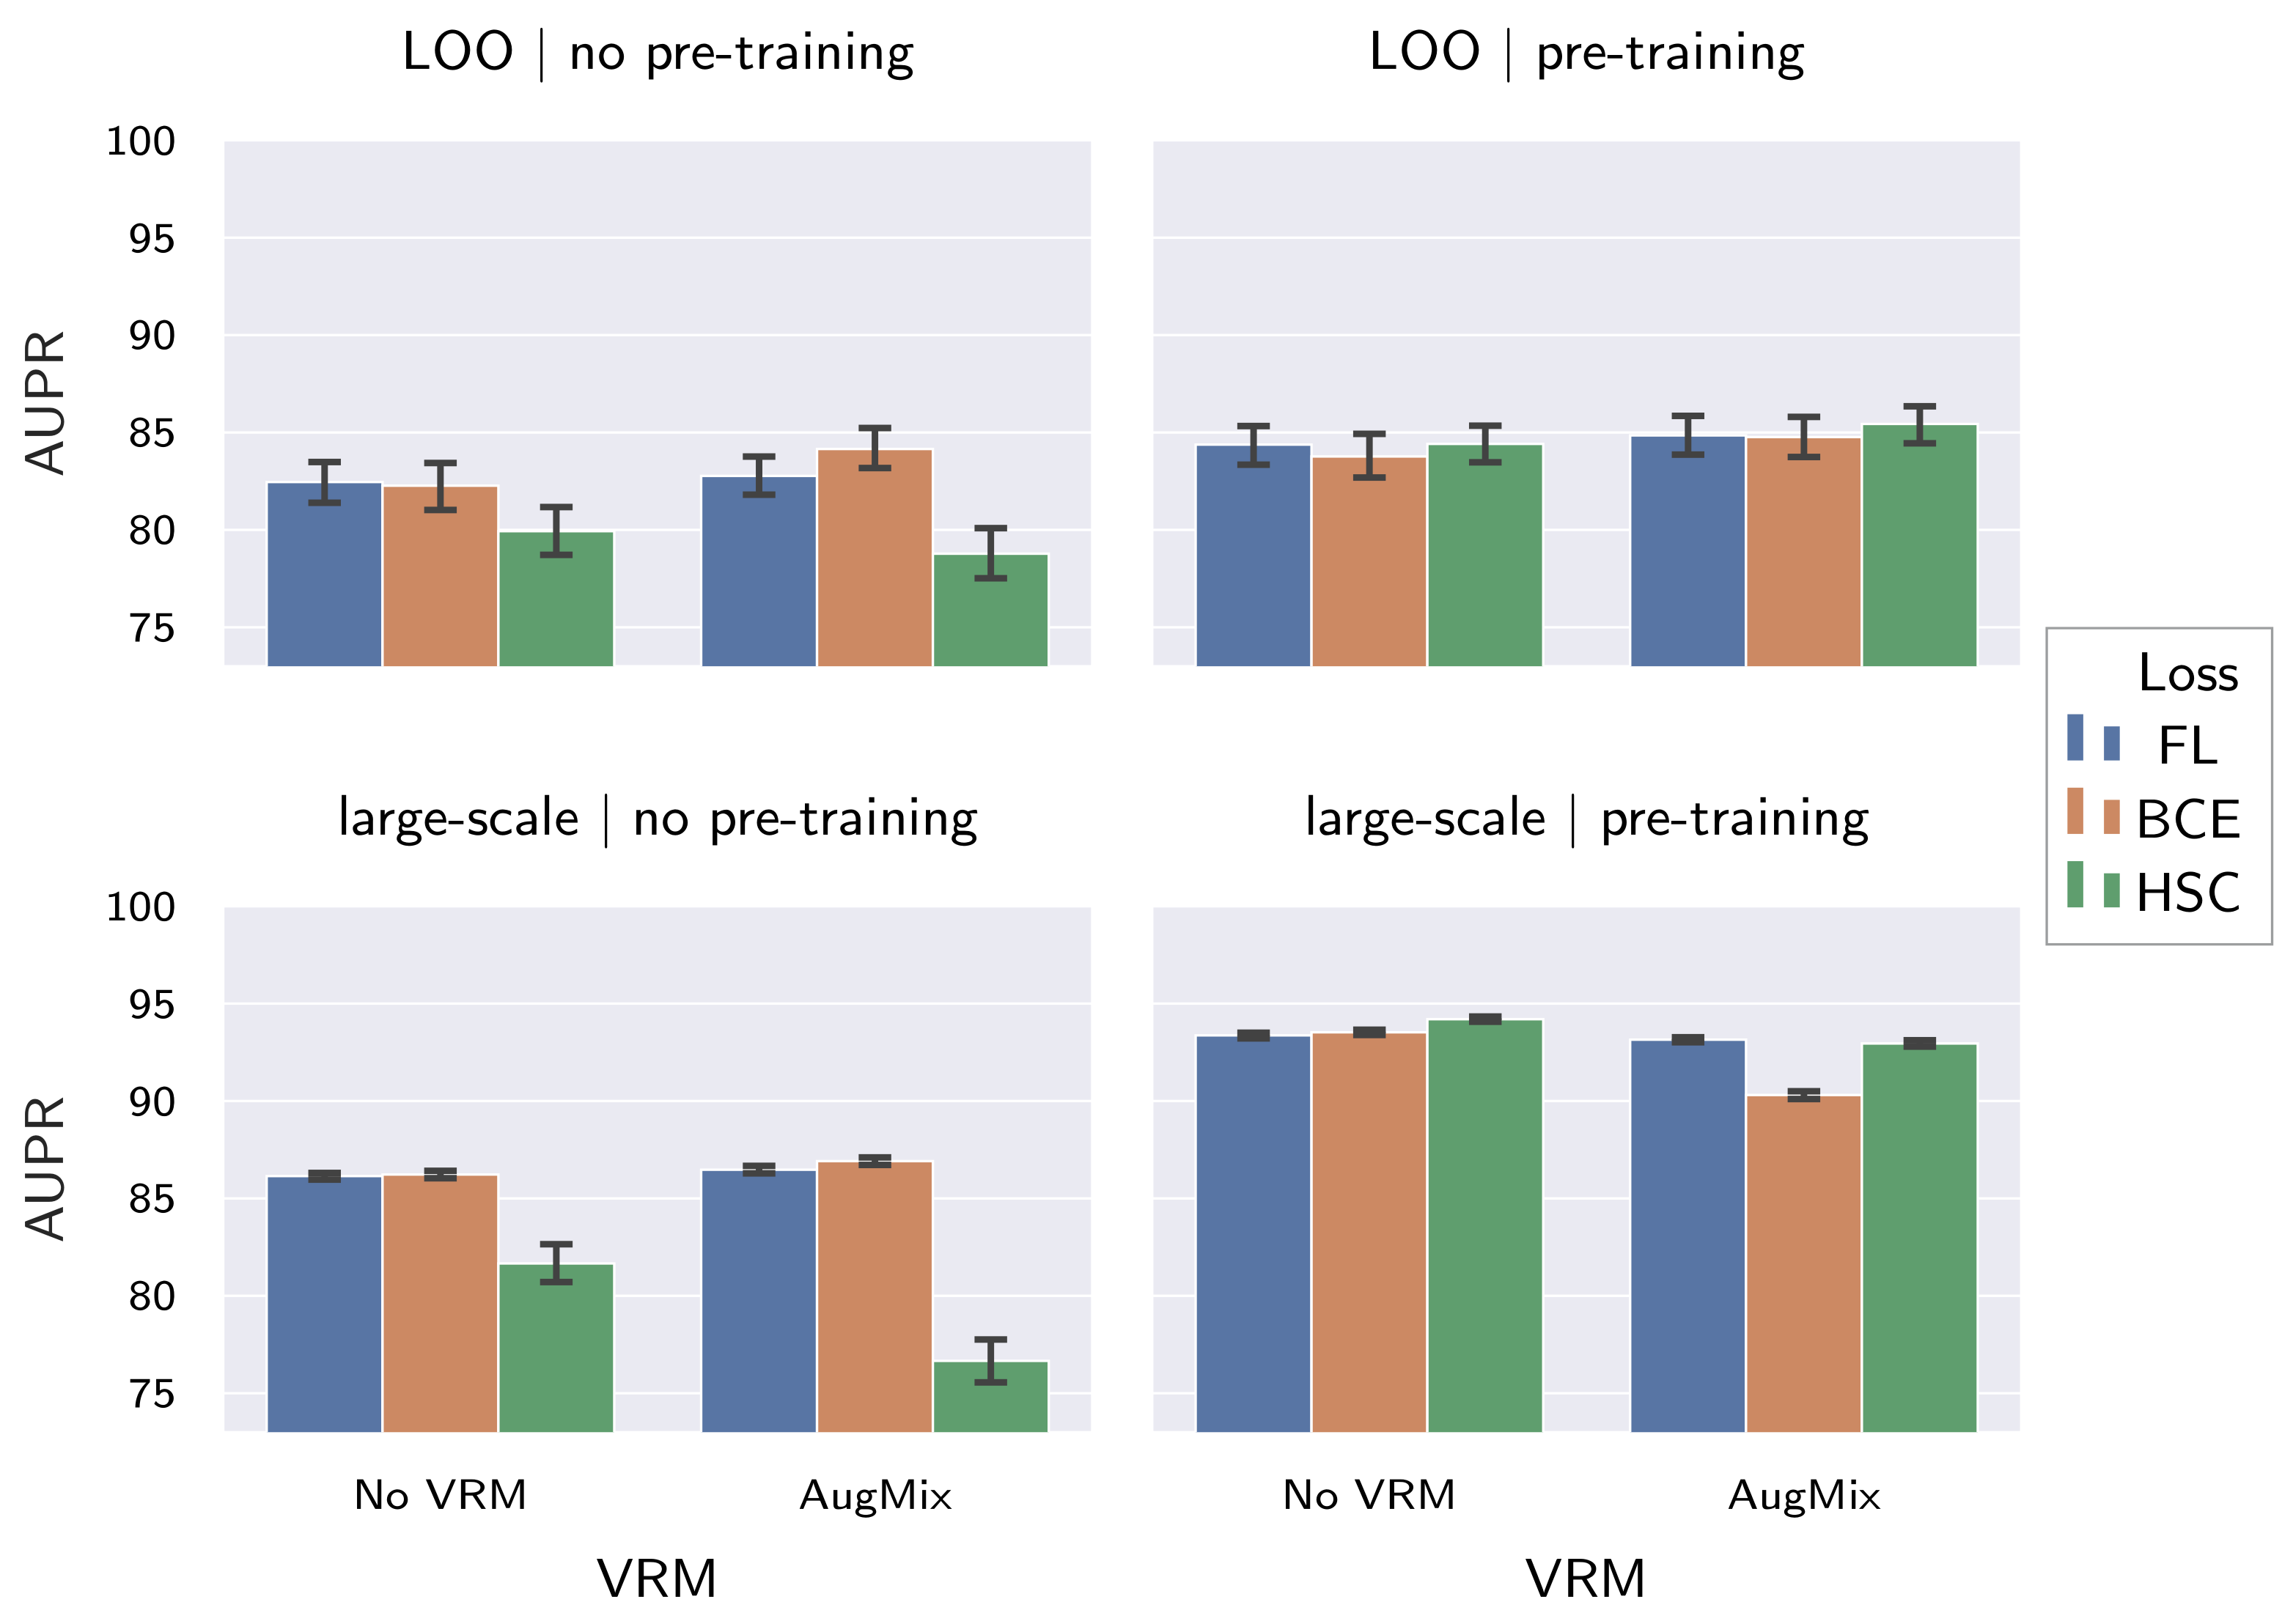
Next, loss functions perform comparable to each other when employed without pre-training or VRM (
Section 5.2.1). However, when combined with AugMix and ImageNet pre-training, HSC loss was shown to slightly outperform the other losses, with respect to both generalization within the large-scale dataset and resistance to input distribution shifts. This can be attributed to the fact that HSC is the only loss out of those evaluated that enforces a clustering of the normal data distribution (refer
Section 4.3.2). As this poses a stronger constraint, it therefore seems likely that shifts in the normal data distribution affect models trained with this loss only to a lesser extent.
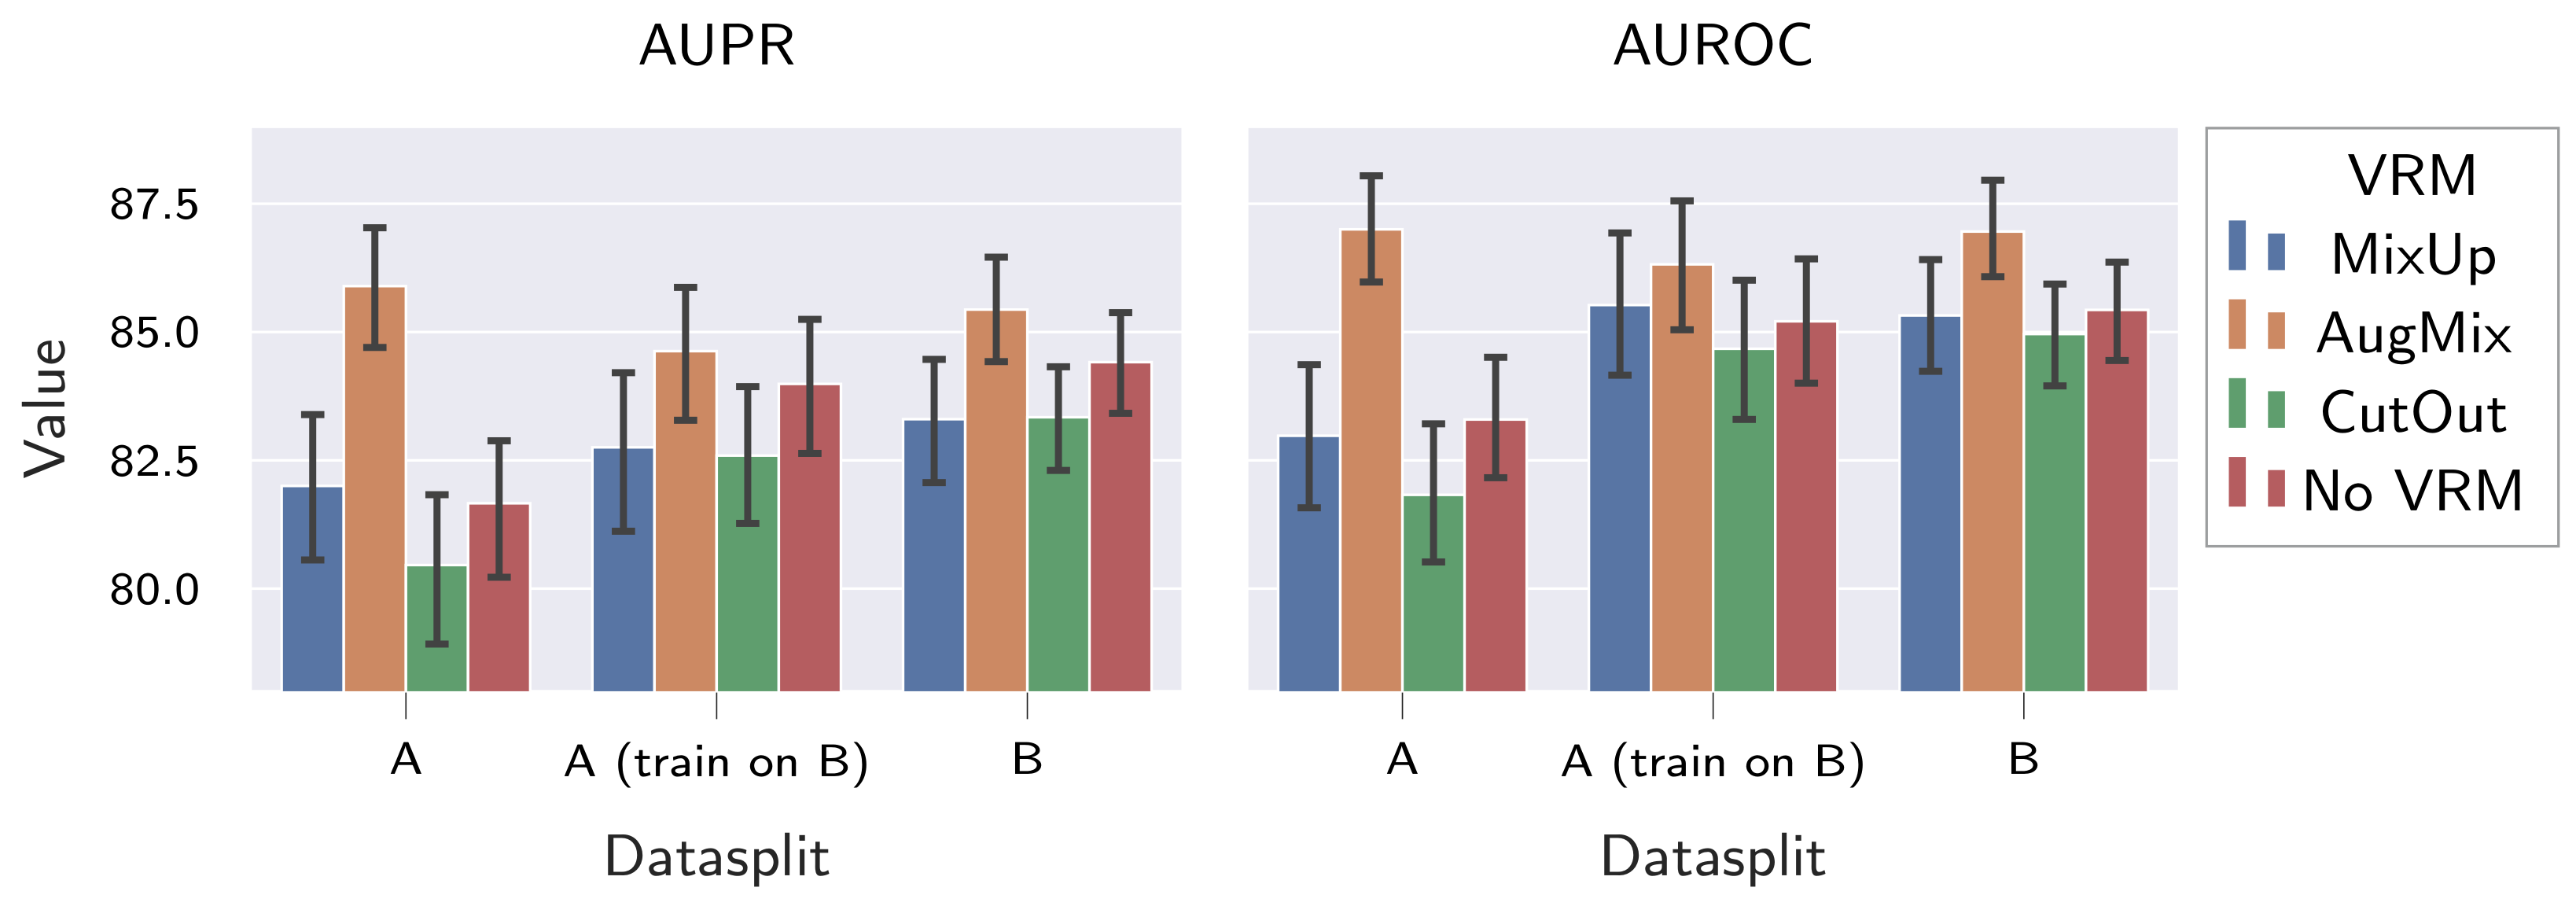
When investigating the influence of dataset composition and VRM-type (Secton
Section 5.2.2), it was shown that more diverse datasets increase the resistance to input distribution shifts. Moreover, good large-scale dataset performance was observed also for the large dataset B. This is in contradiction to [
19], where worse large-scale dataset performance was observed for more diverse fabric datasets compared to less-diverse datasets. However, it should be noted that the research focused on AS rather than AD in [
19]. We will therefore revalidate our findings on the ZJULeaper dataset [
19] in future work. Regarding the different VRM types, it was found that only AugMix consistently improves resistance to distribution shifts. However, AugMix simultaneously reduced the generalization within the large-scale dataset in four of the six evaluated model configurations (
Table 7). This indicates that VRM methods proposed on natural images might not be easily transferred to the supervised fabric AD task, and developing schemes that consistently improve both the resistance to distribution shifts and generalization within the large-scale dataset is thus left for future work. Here, we propose to adapt augmentation schemes where the best possible augmentations are learned [
22,
48,
49] to the fabric inspection task or to employ adversarial training with on-manifold adversarial examples [
71].
Regarding model architecture and model complexity (
Section 5.2.3), it was found that architectures with improved ImageNet performance had both better generalization within the large-scale dataset and stronger resistance to distribution shifts compared to architectures with lower ImageNet performance. Regarding model complexity, no conclusive statement can be made, as best generalization within the large-scale dataset was achieved by EfficientNet-B4, yet highest resistance to input distribution shifts was observed for EfficientNet-B2. This finding is in direct contradiction to the statement that increasing model complexity improves resistance to distribution shifts of input data [
72,
73]. However, exhaustive evaluations of said hypothesis were inconclusive [
22] and, therefore, in agreement with the findings presented here. Thus, the influence of model complexity on the resistance to input distribution shifts most likely depends on the performed task and the used data, and can be either beneficial or detrimental.
We furthermore investigated whether the observed tendencies are synergetic to post hoc adaptation techniques (
Section 5.3) and found this to be the case. Since fine-tuning the models and their learned representations in a post hoc manner failed, we chose to re-train all supervised fabric AD methods under the addition of normal data from the held-out fabrics instead. Interestingly, this approach decreased both the generalization within the large-scale dataset and the resistance to input distribution shifts on its own. When coupled with post hoc adaptation by means of PDF-estimation, however, resistance to input distribution shifts was improved. From this, it can be inferred that defect-free samples of a fabric can be used to generate more discriminative feature representations, but that both defect and defect-free samples of a fabric are required in order to learn a discriminative decision boundary in said feature representations. Due to the limited overall performance gains and the large computational cost incurred from re-training the model per fabric, however, this method cannot be recommended for further use. Moreover, the combination of its low performance gains with the observed shifts in the anomaly distribution (
Section 5.2.1.2) indicates that successfully developing additional post hoc adaptation methods based on defect-free data only might be difficult.
Limitations
While we created a large-scale fabric dataset, we limited ourselves to fabrics composed of synthetic materials and medium complexity of appearance. We will therefore focus on further increasing the diversity of our fabric dataset by sampling a wider variety of materials (e.g., cotton) and fabric types (e.g., jacquard fabrics) in future work. Moreover, we focused our evaluations on the OLP fabric dataset created in this work. We will therefore revalidate our findings on the ZJULeaper dataset [
19] in future work. Furthermore, we still require labeled anomalies to assess fabric AD performance on unseen fabrics. Instead, it would be preferable to estimate a model’s applicability on previously unseen fabrics using normal data only, which are more readily available. To this end, we will develop measures that use normal data only in future work, basing them on generalization measures [
61,
62]. In this context, we will also try to quantify the severity of the shifts occurring for both the anomaly and the normal data distribution. Last, we limited our analysis to supervised fabric AD. We will therefore extend our analysis to supervised AS [
15,
19,
74,
75] as well as object/defect detection methods [
16,
28,
76] in future work. We note that it would be interesting to assess the resistance of reference-based approaches [
76] to input distribution shifts here, given that reference images should provide ample information about the shift in the normal/defect-free data distribution.


