
Video Anomaly Detection Based on Convolutional Recurrent AutoEncoder


Abstract
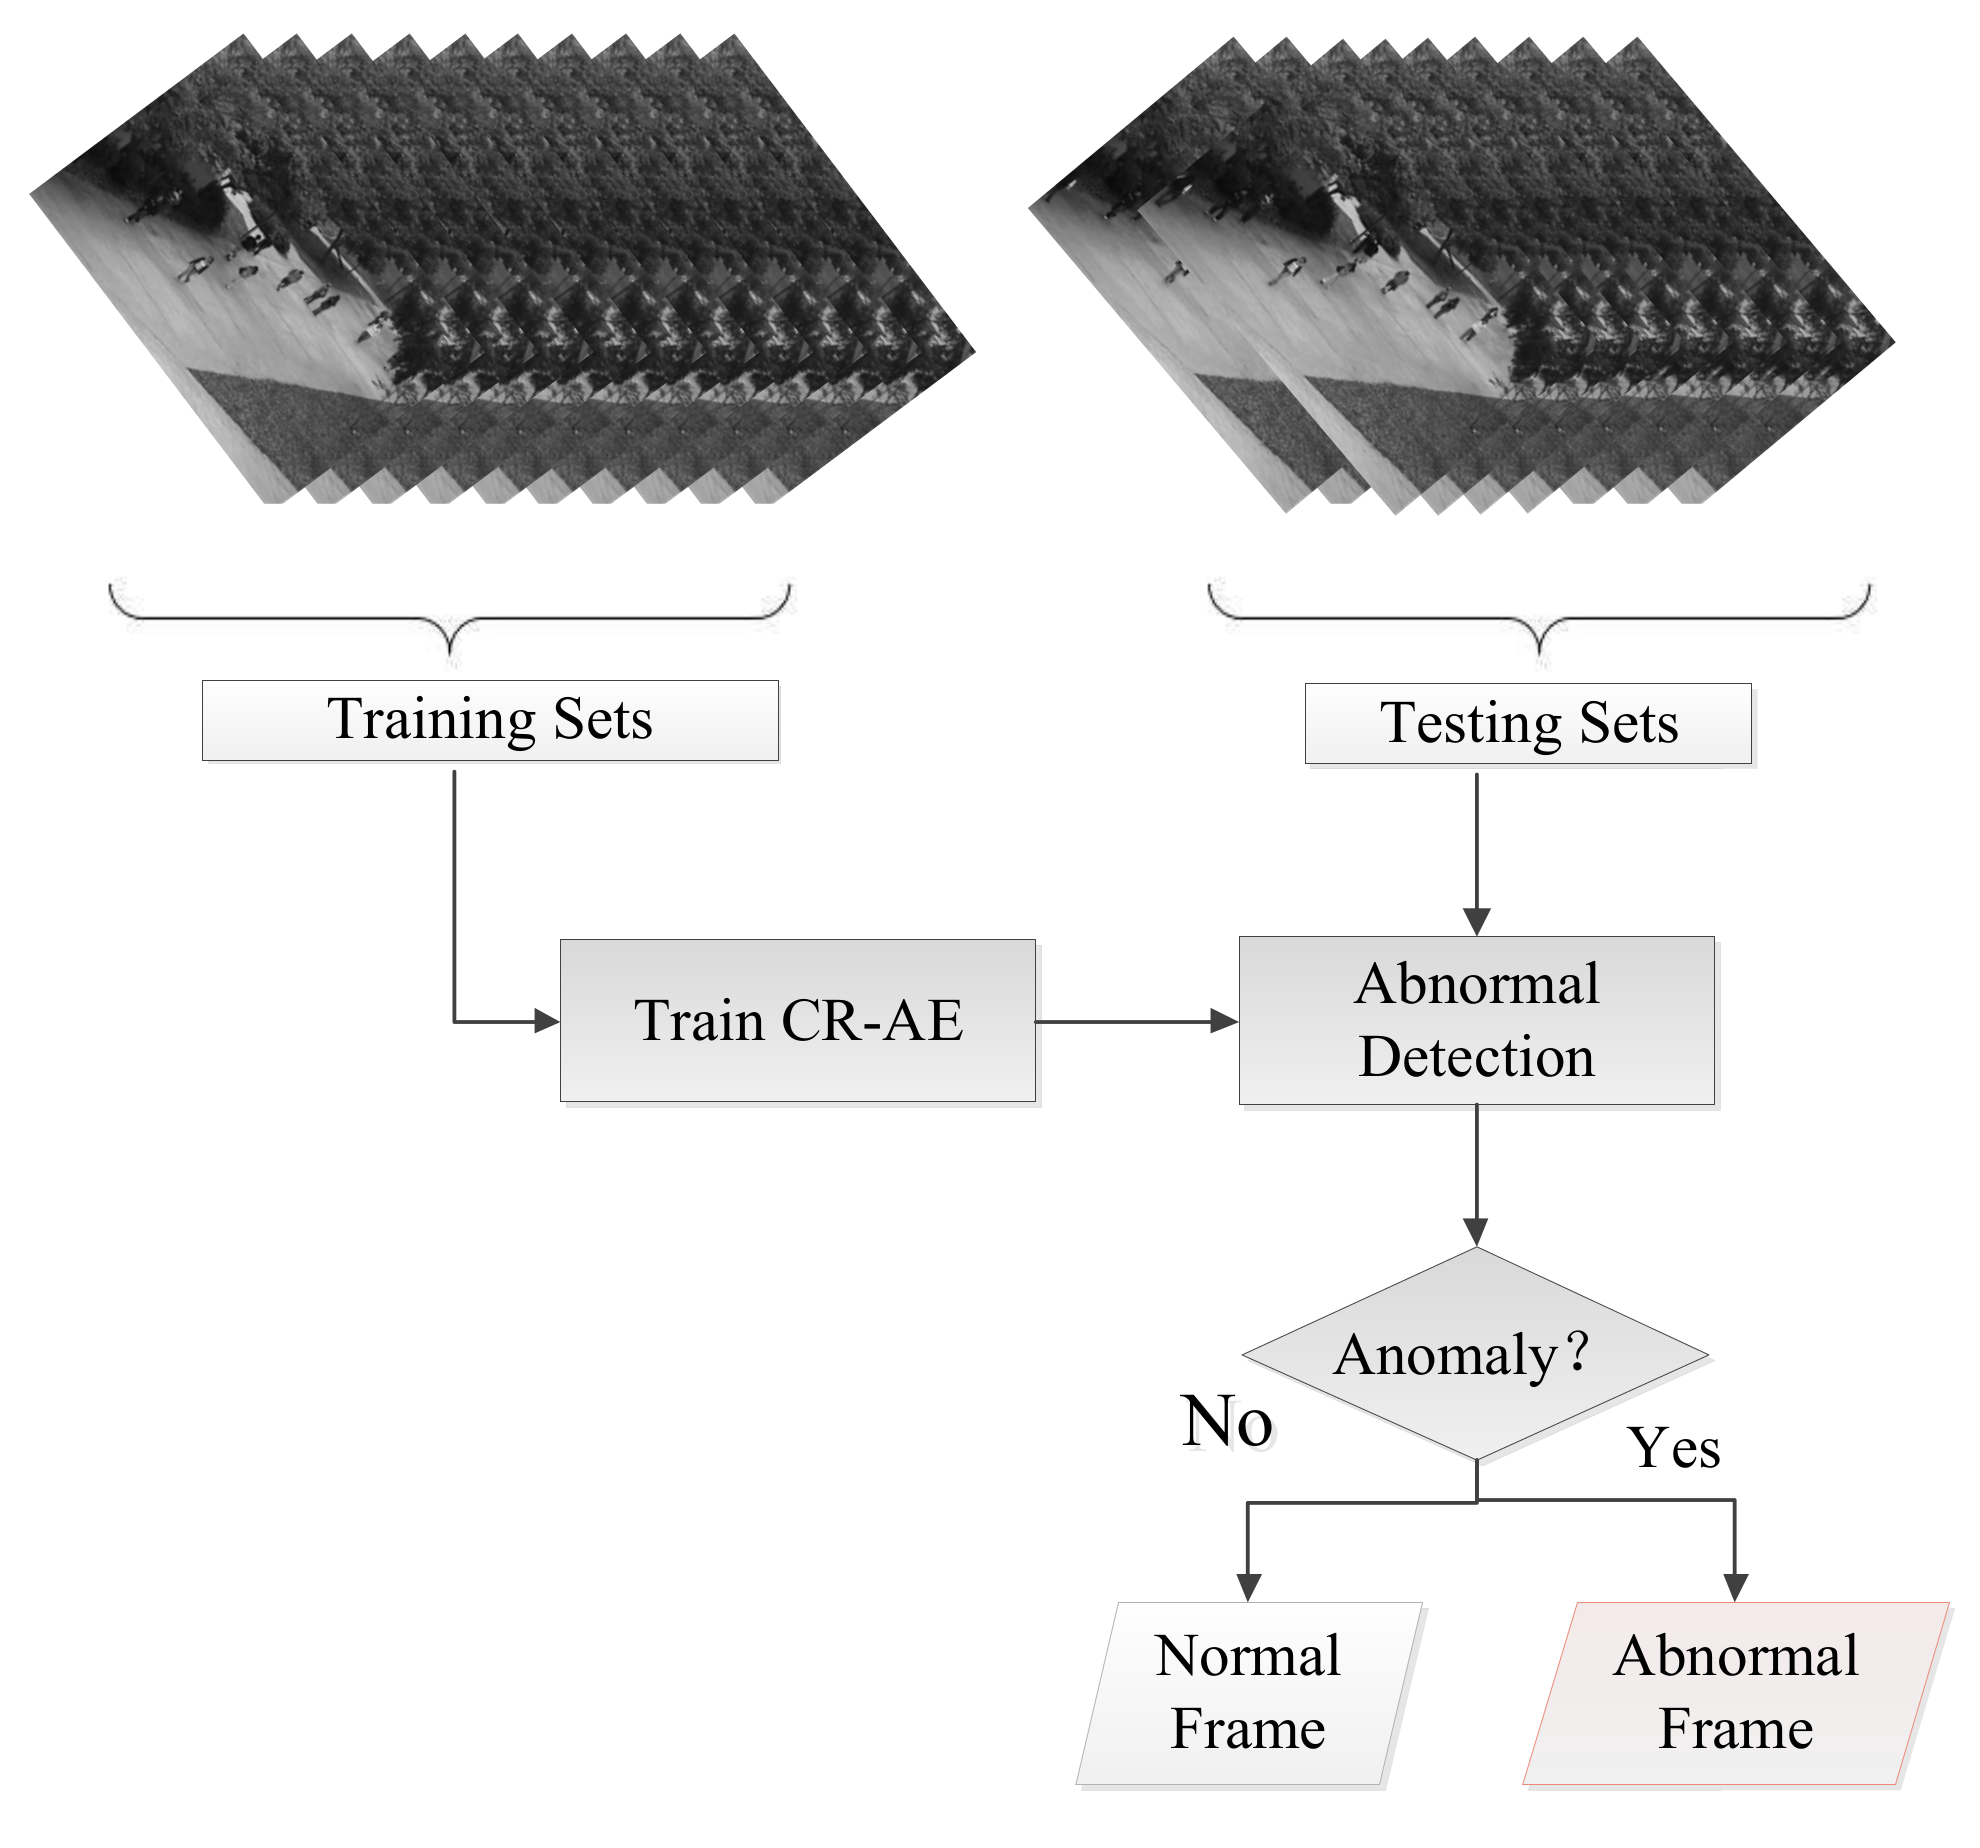
:1. Introduction
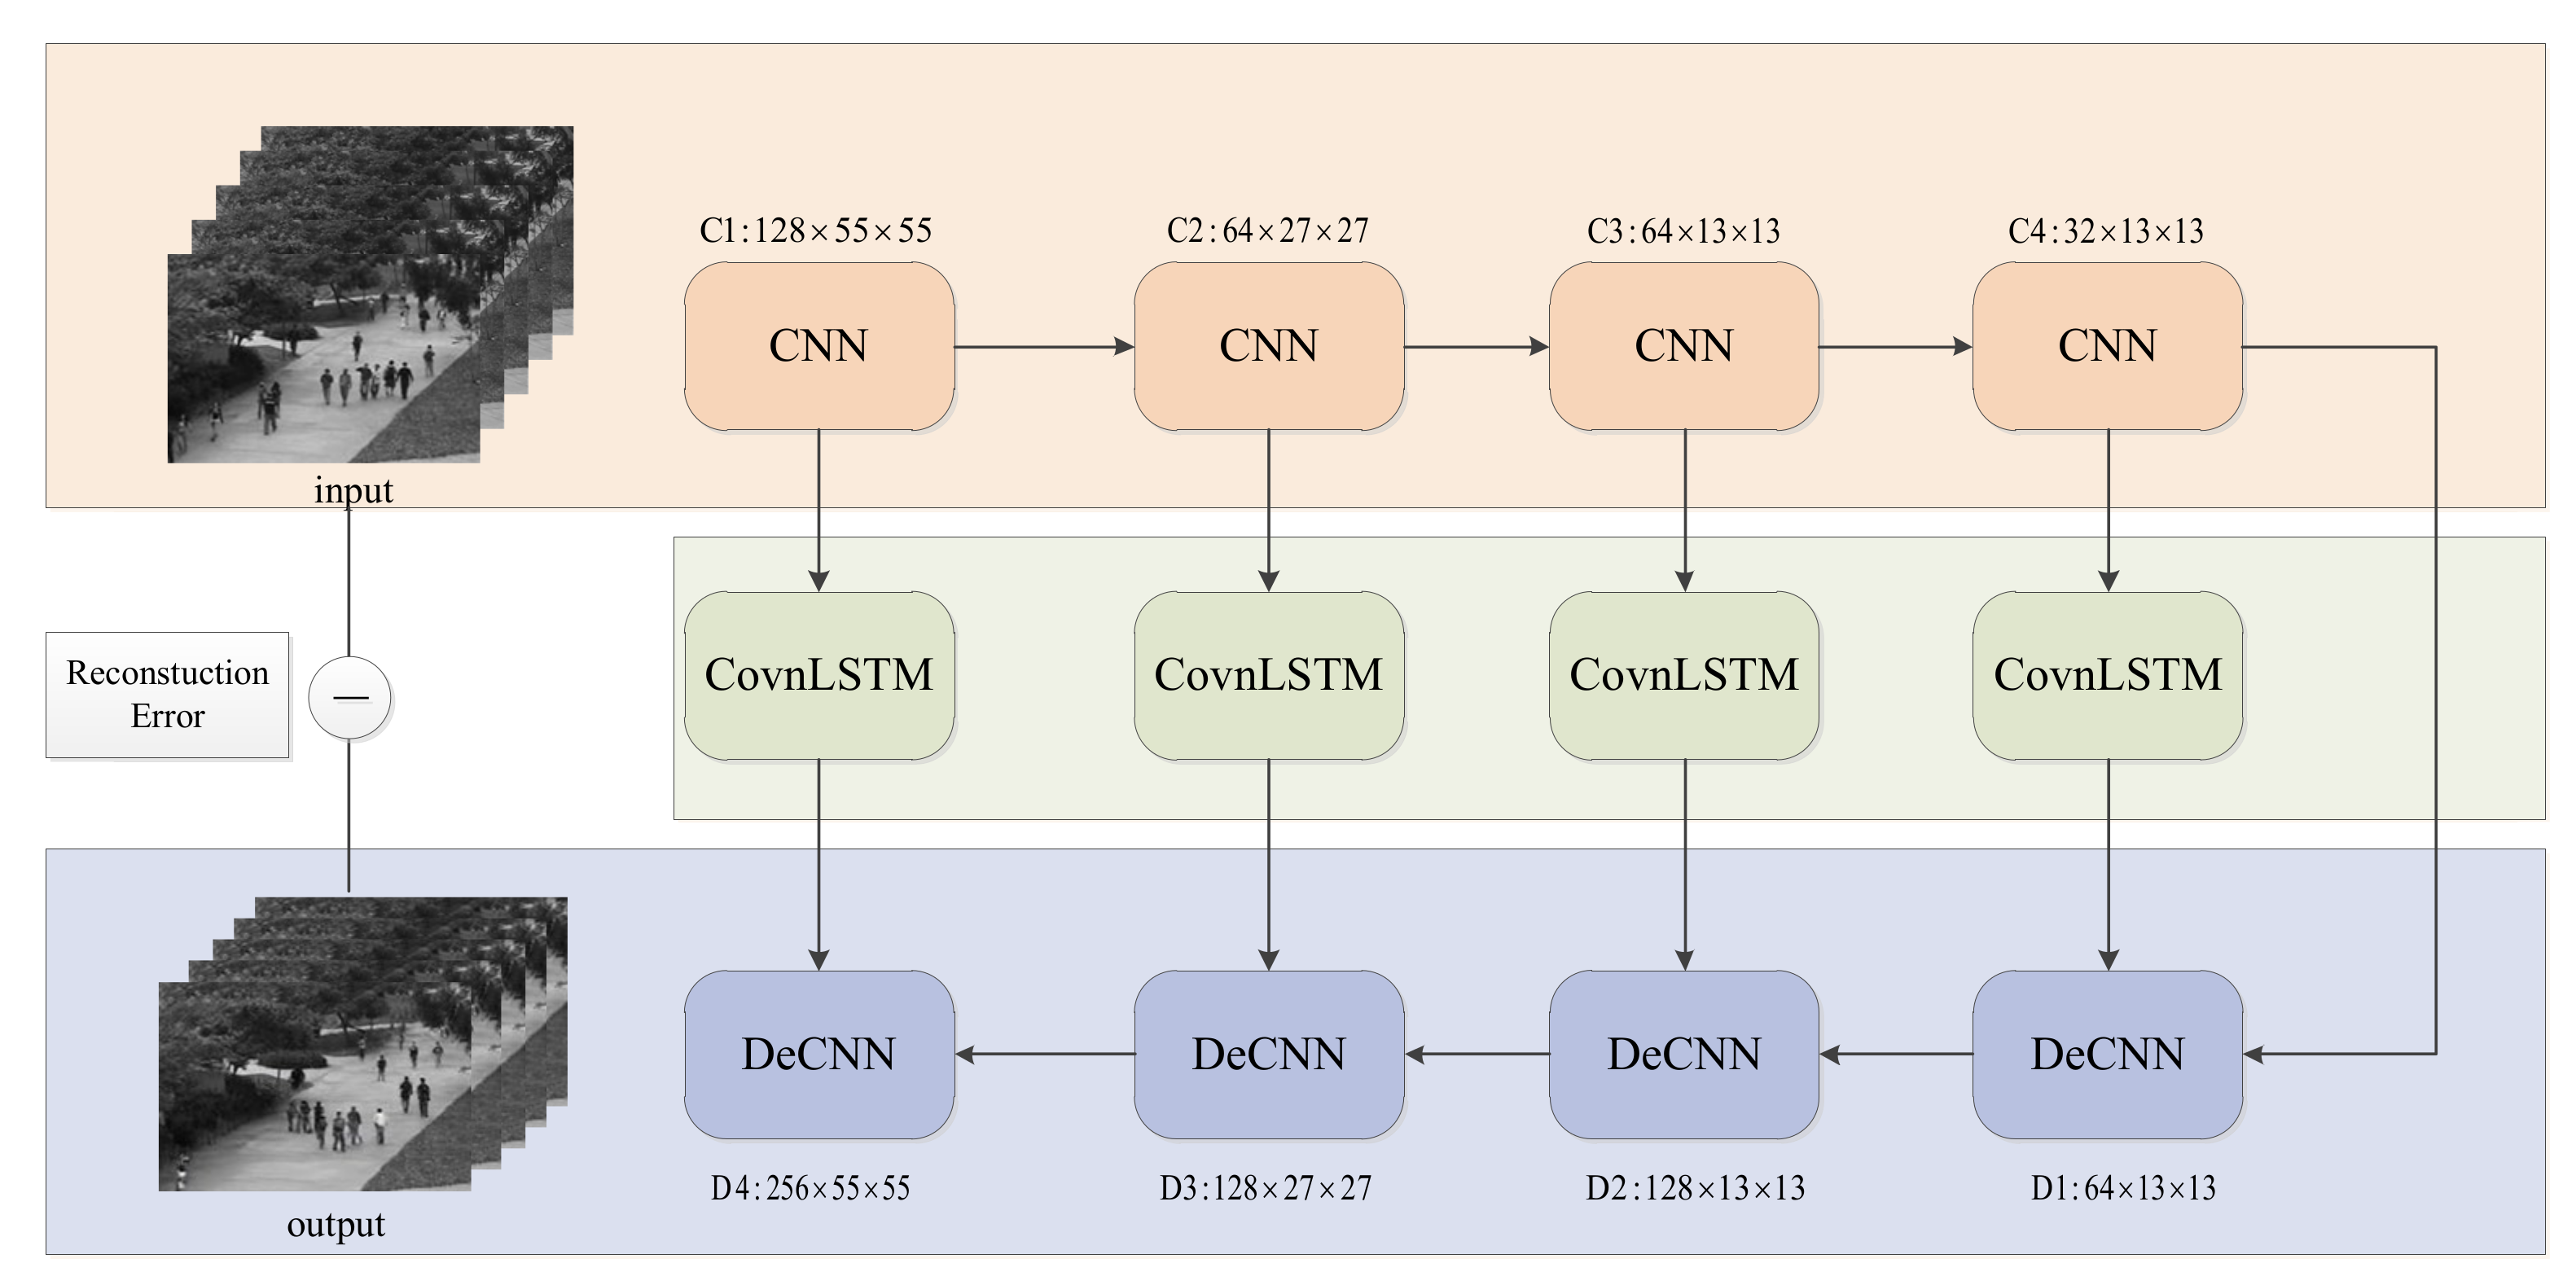
- We proposed an end-to-end deep learning framework for anomaly detection called Convolutional Recurrent AutoEncoder (CR-AE) for video anomaly detection. It is established by encoding the spatial regularity and temporal pattern with two common network architectures. They are the attention-based Convolutional Long–Short-Term Memory (ConvLSTM) network and the convolutional AutoEncoder (ConvAE). To the extent of our knowledge, this is the first time that the hybrid architectures of the attention-based ConvLSTM and ConvAE have been considered for video anomaly detection.
- We adopted only a network to simultaneously detect the spatial and temporal anomaly to replace the conventional two-stream network. Compared with the conventional two-stream network, the CR-AE need not extract optical flow and train the weights of the two architectures.
- We extensively evaluated our approach on the publicly available video anomaly detection datasets. The experiment demonstrates that our approach attains superior results compared to the state-of-the-art methods.
2. Related Work
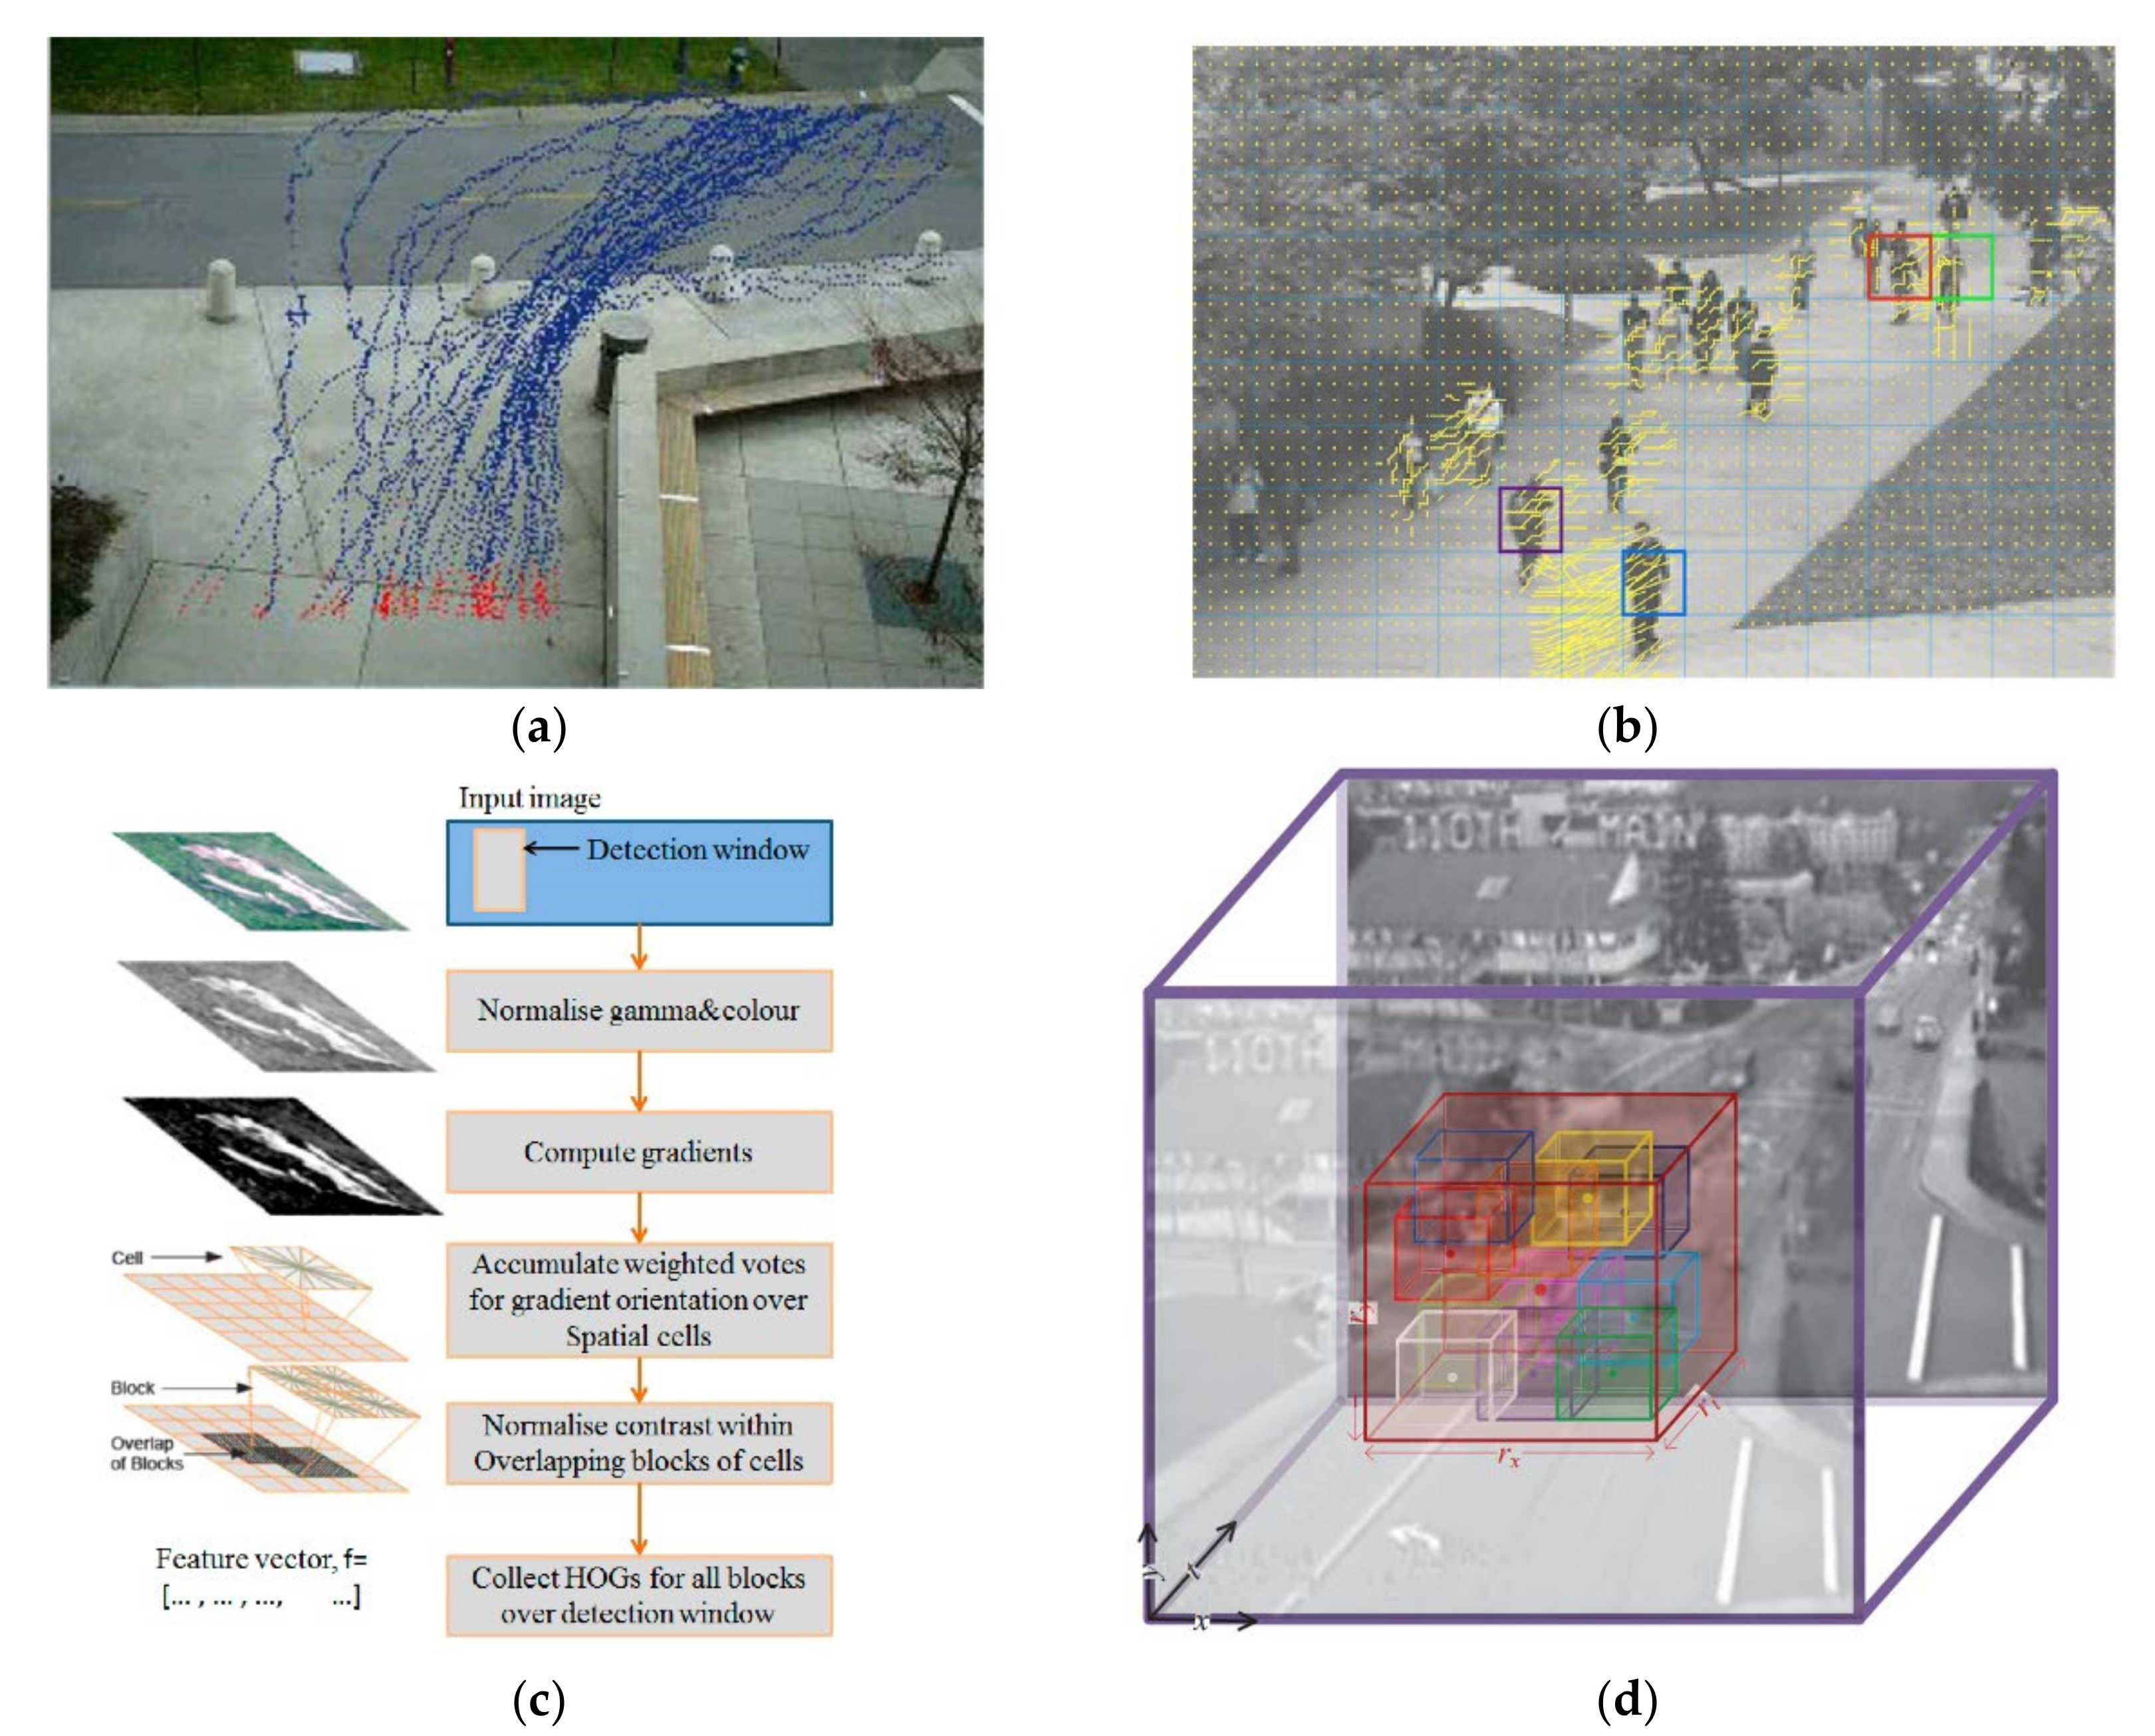
2.1. Hand-Crafted Feature-Based Anomaly Detection Method
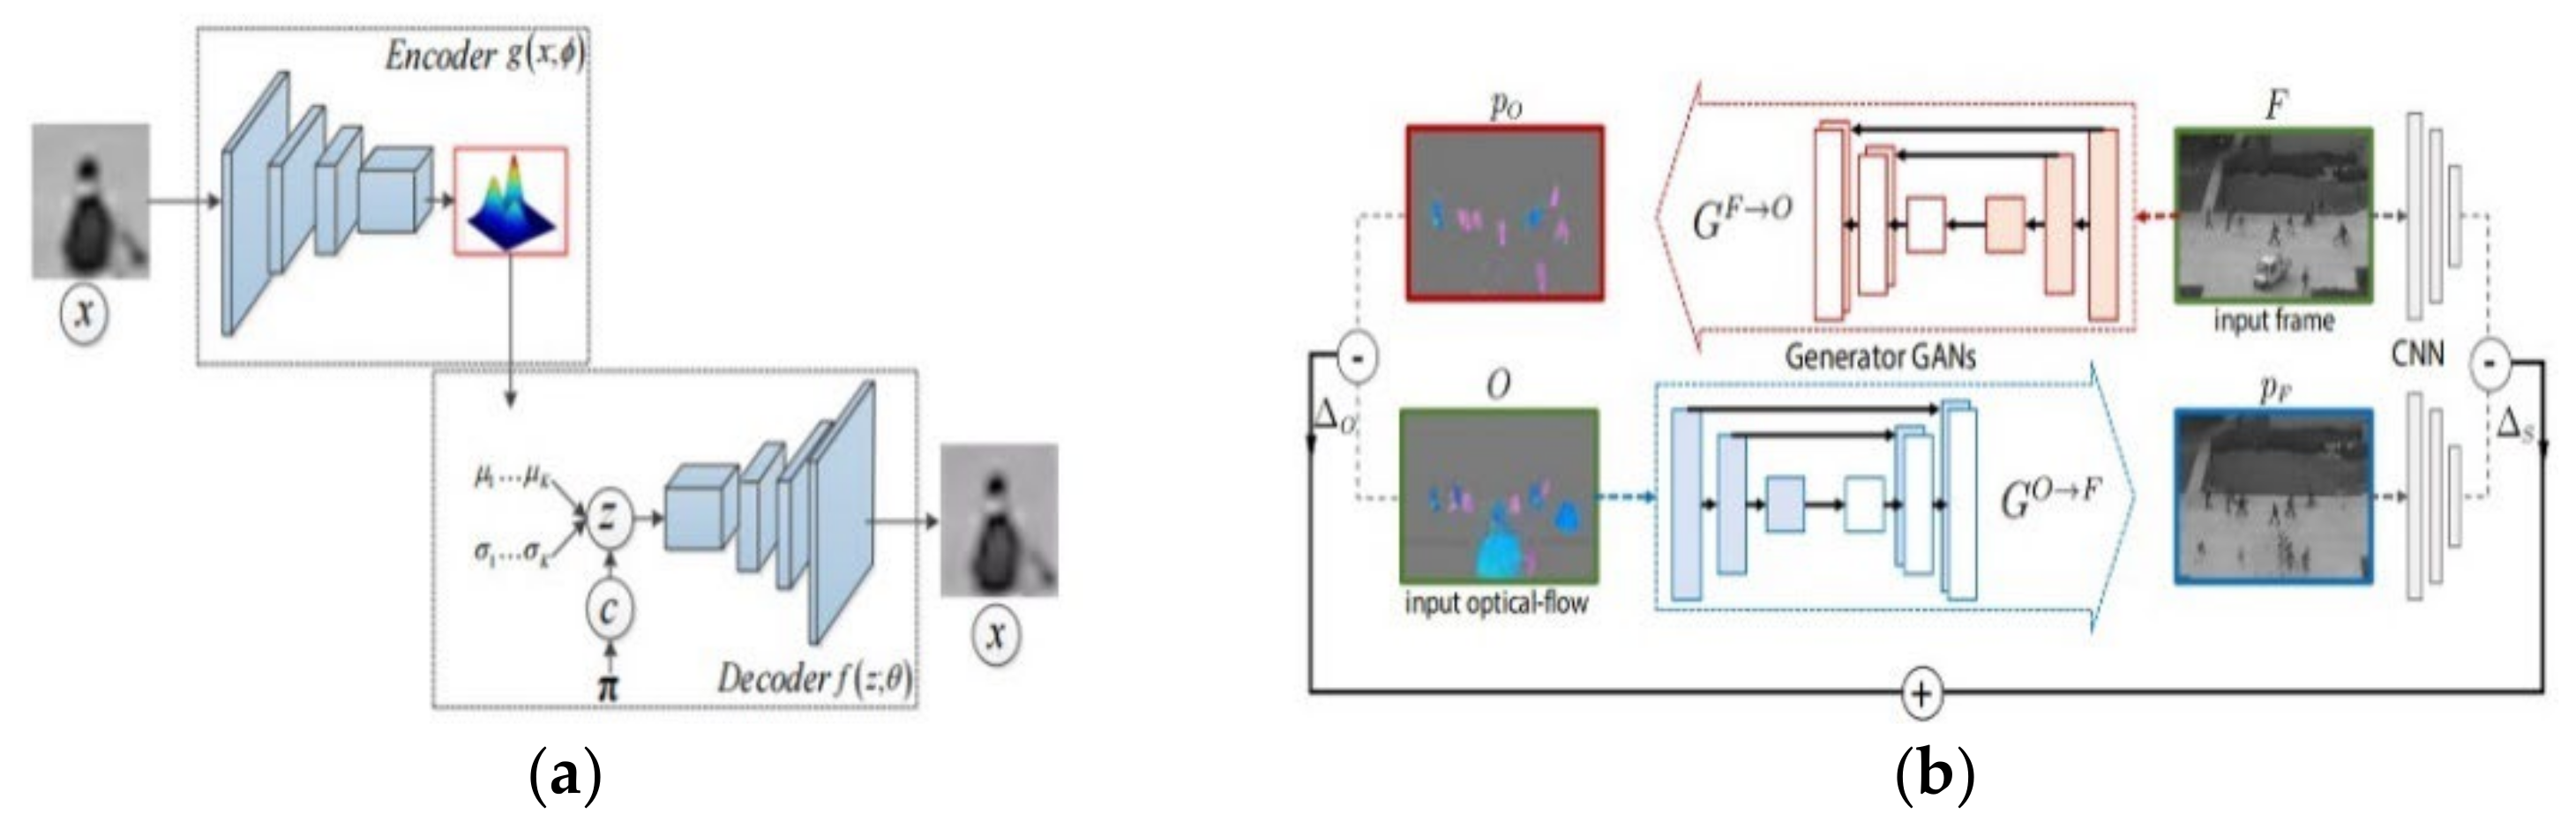
2.2. Deep Learning-Based Anomaly Detection Method
3. Method
3.1. Problem Formulation
3.2. Learning the CR-AE Network
3.3. Prediction
4. Experiment and Results
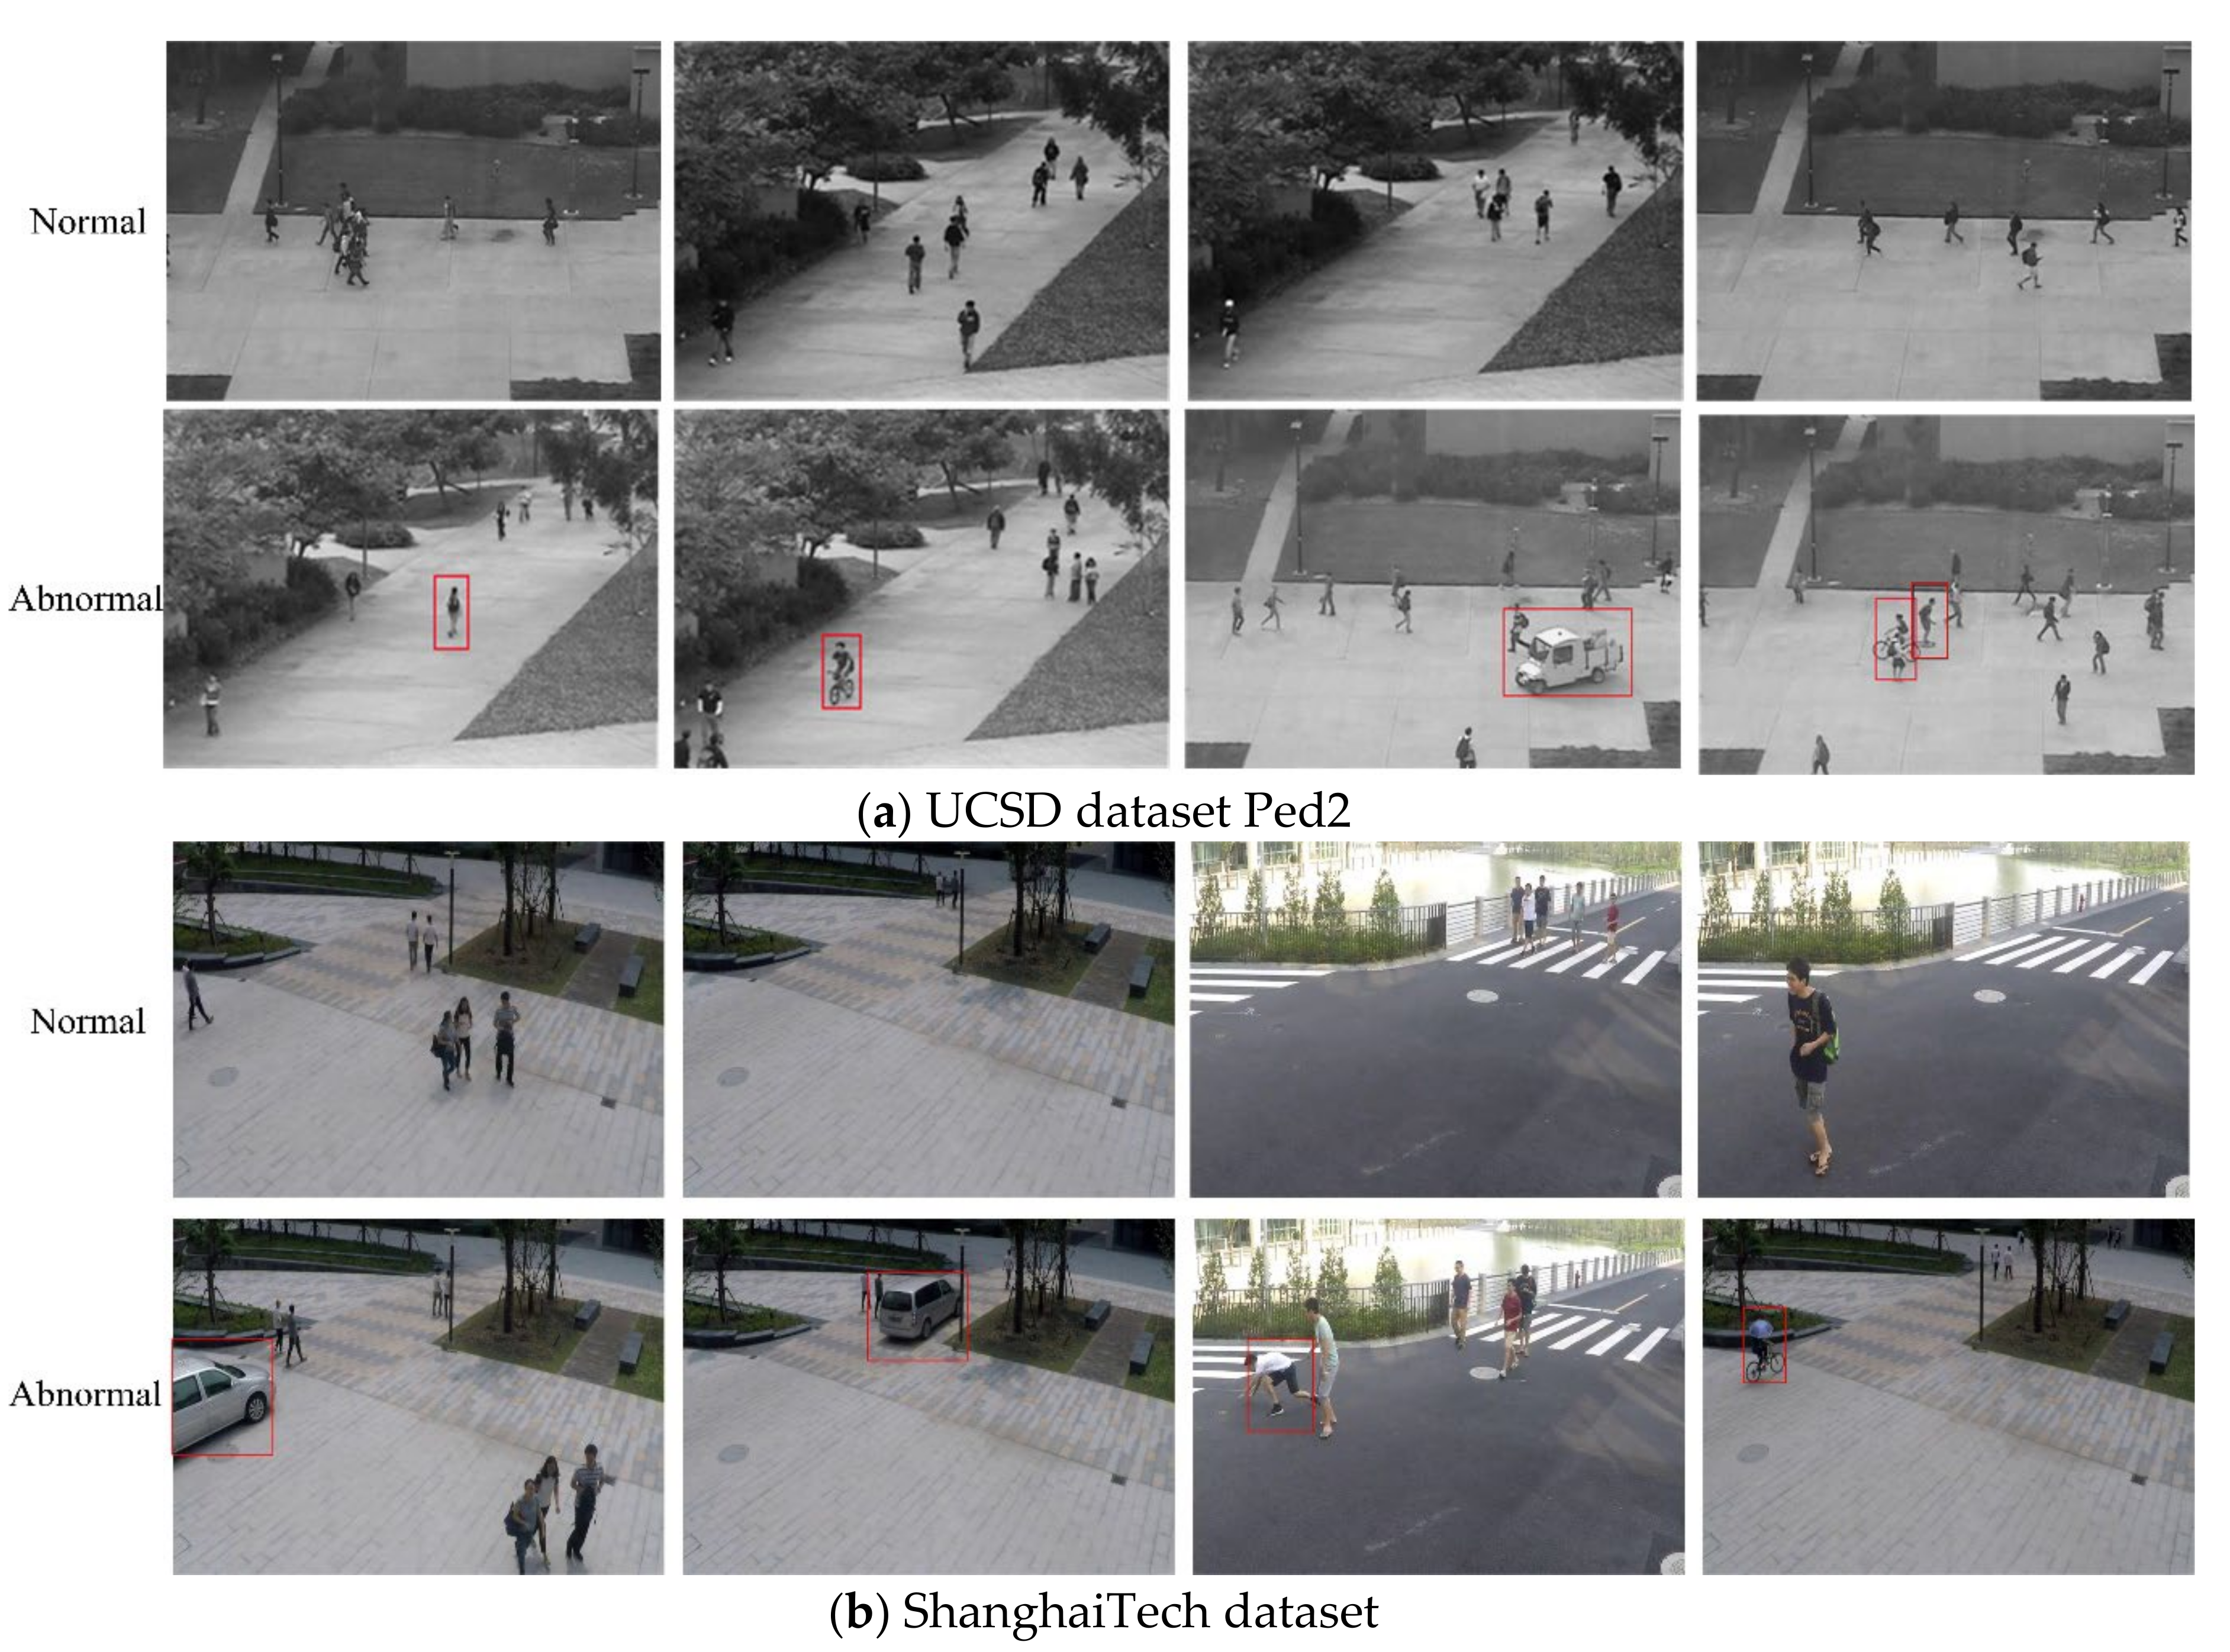
4.1. Datasets
4.2. Implementation Details
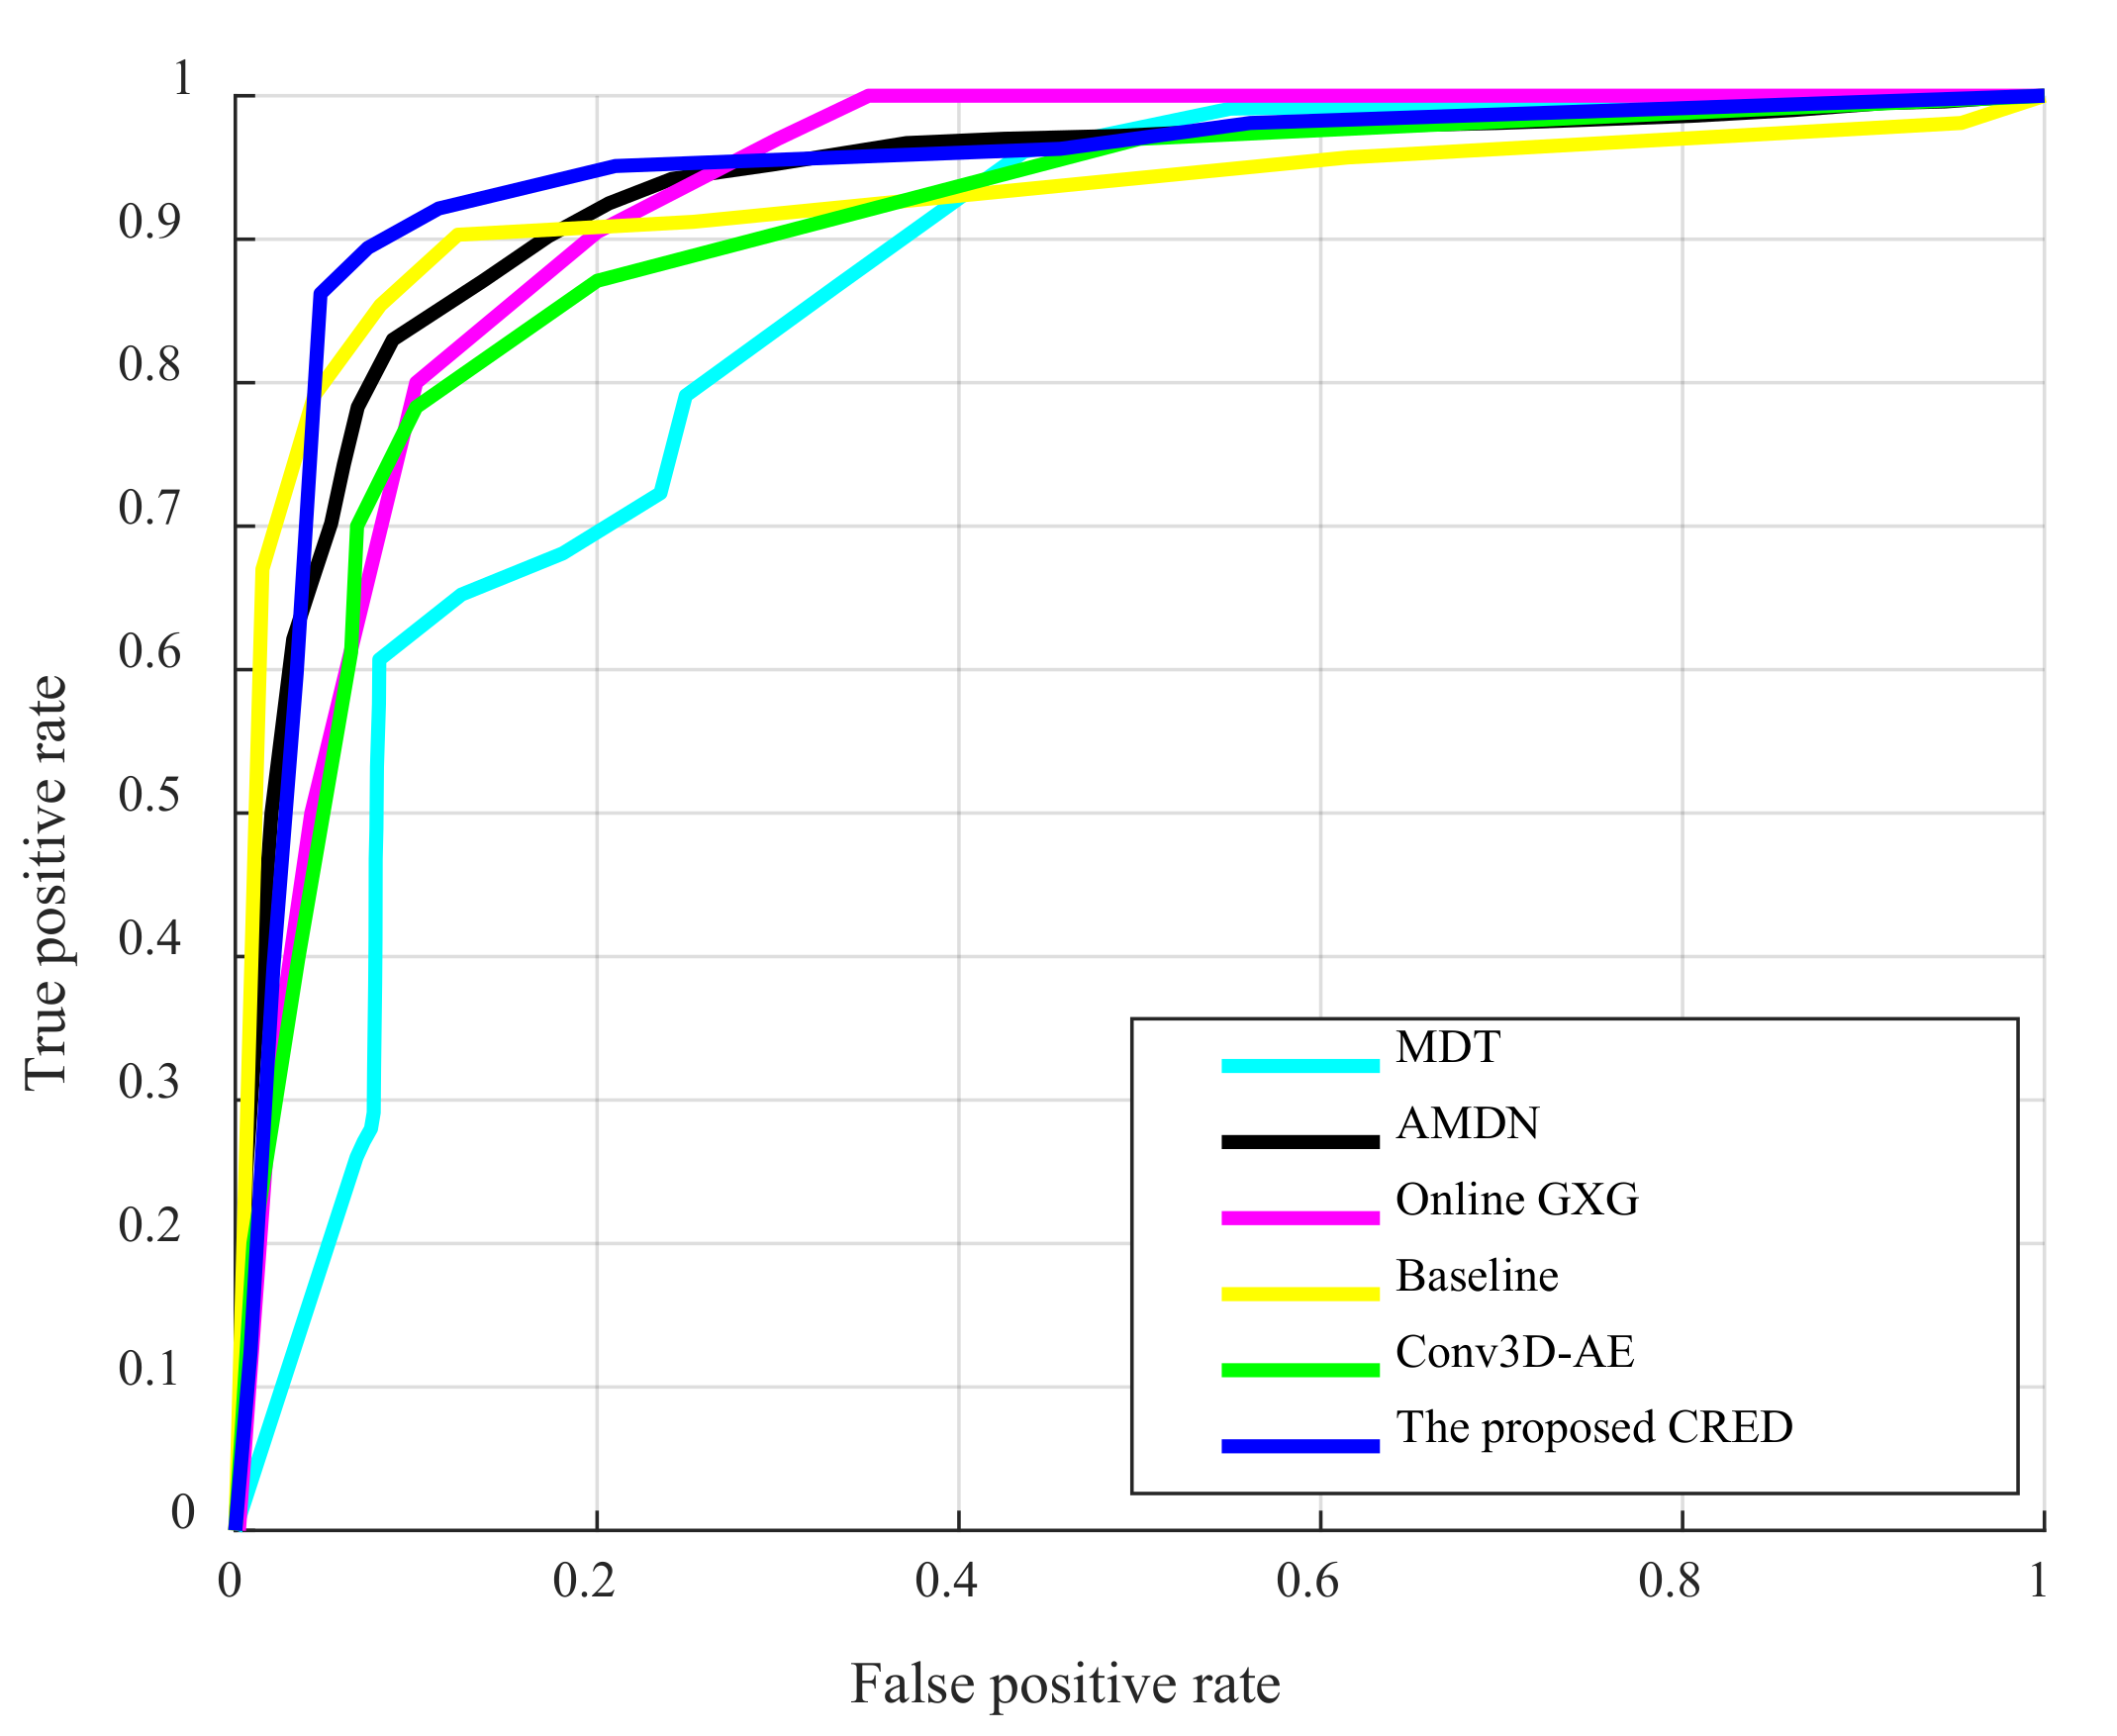
4.3. Results on the UCSD ped2 Dataset
4.4. Results on the ShanghaiTech Dataset
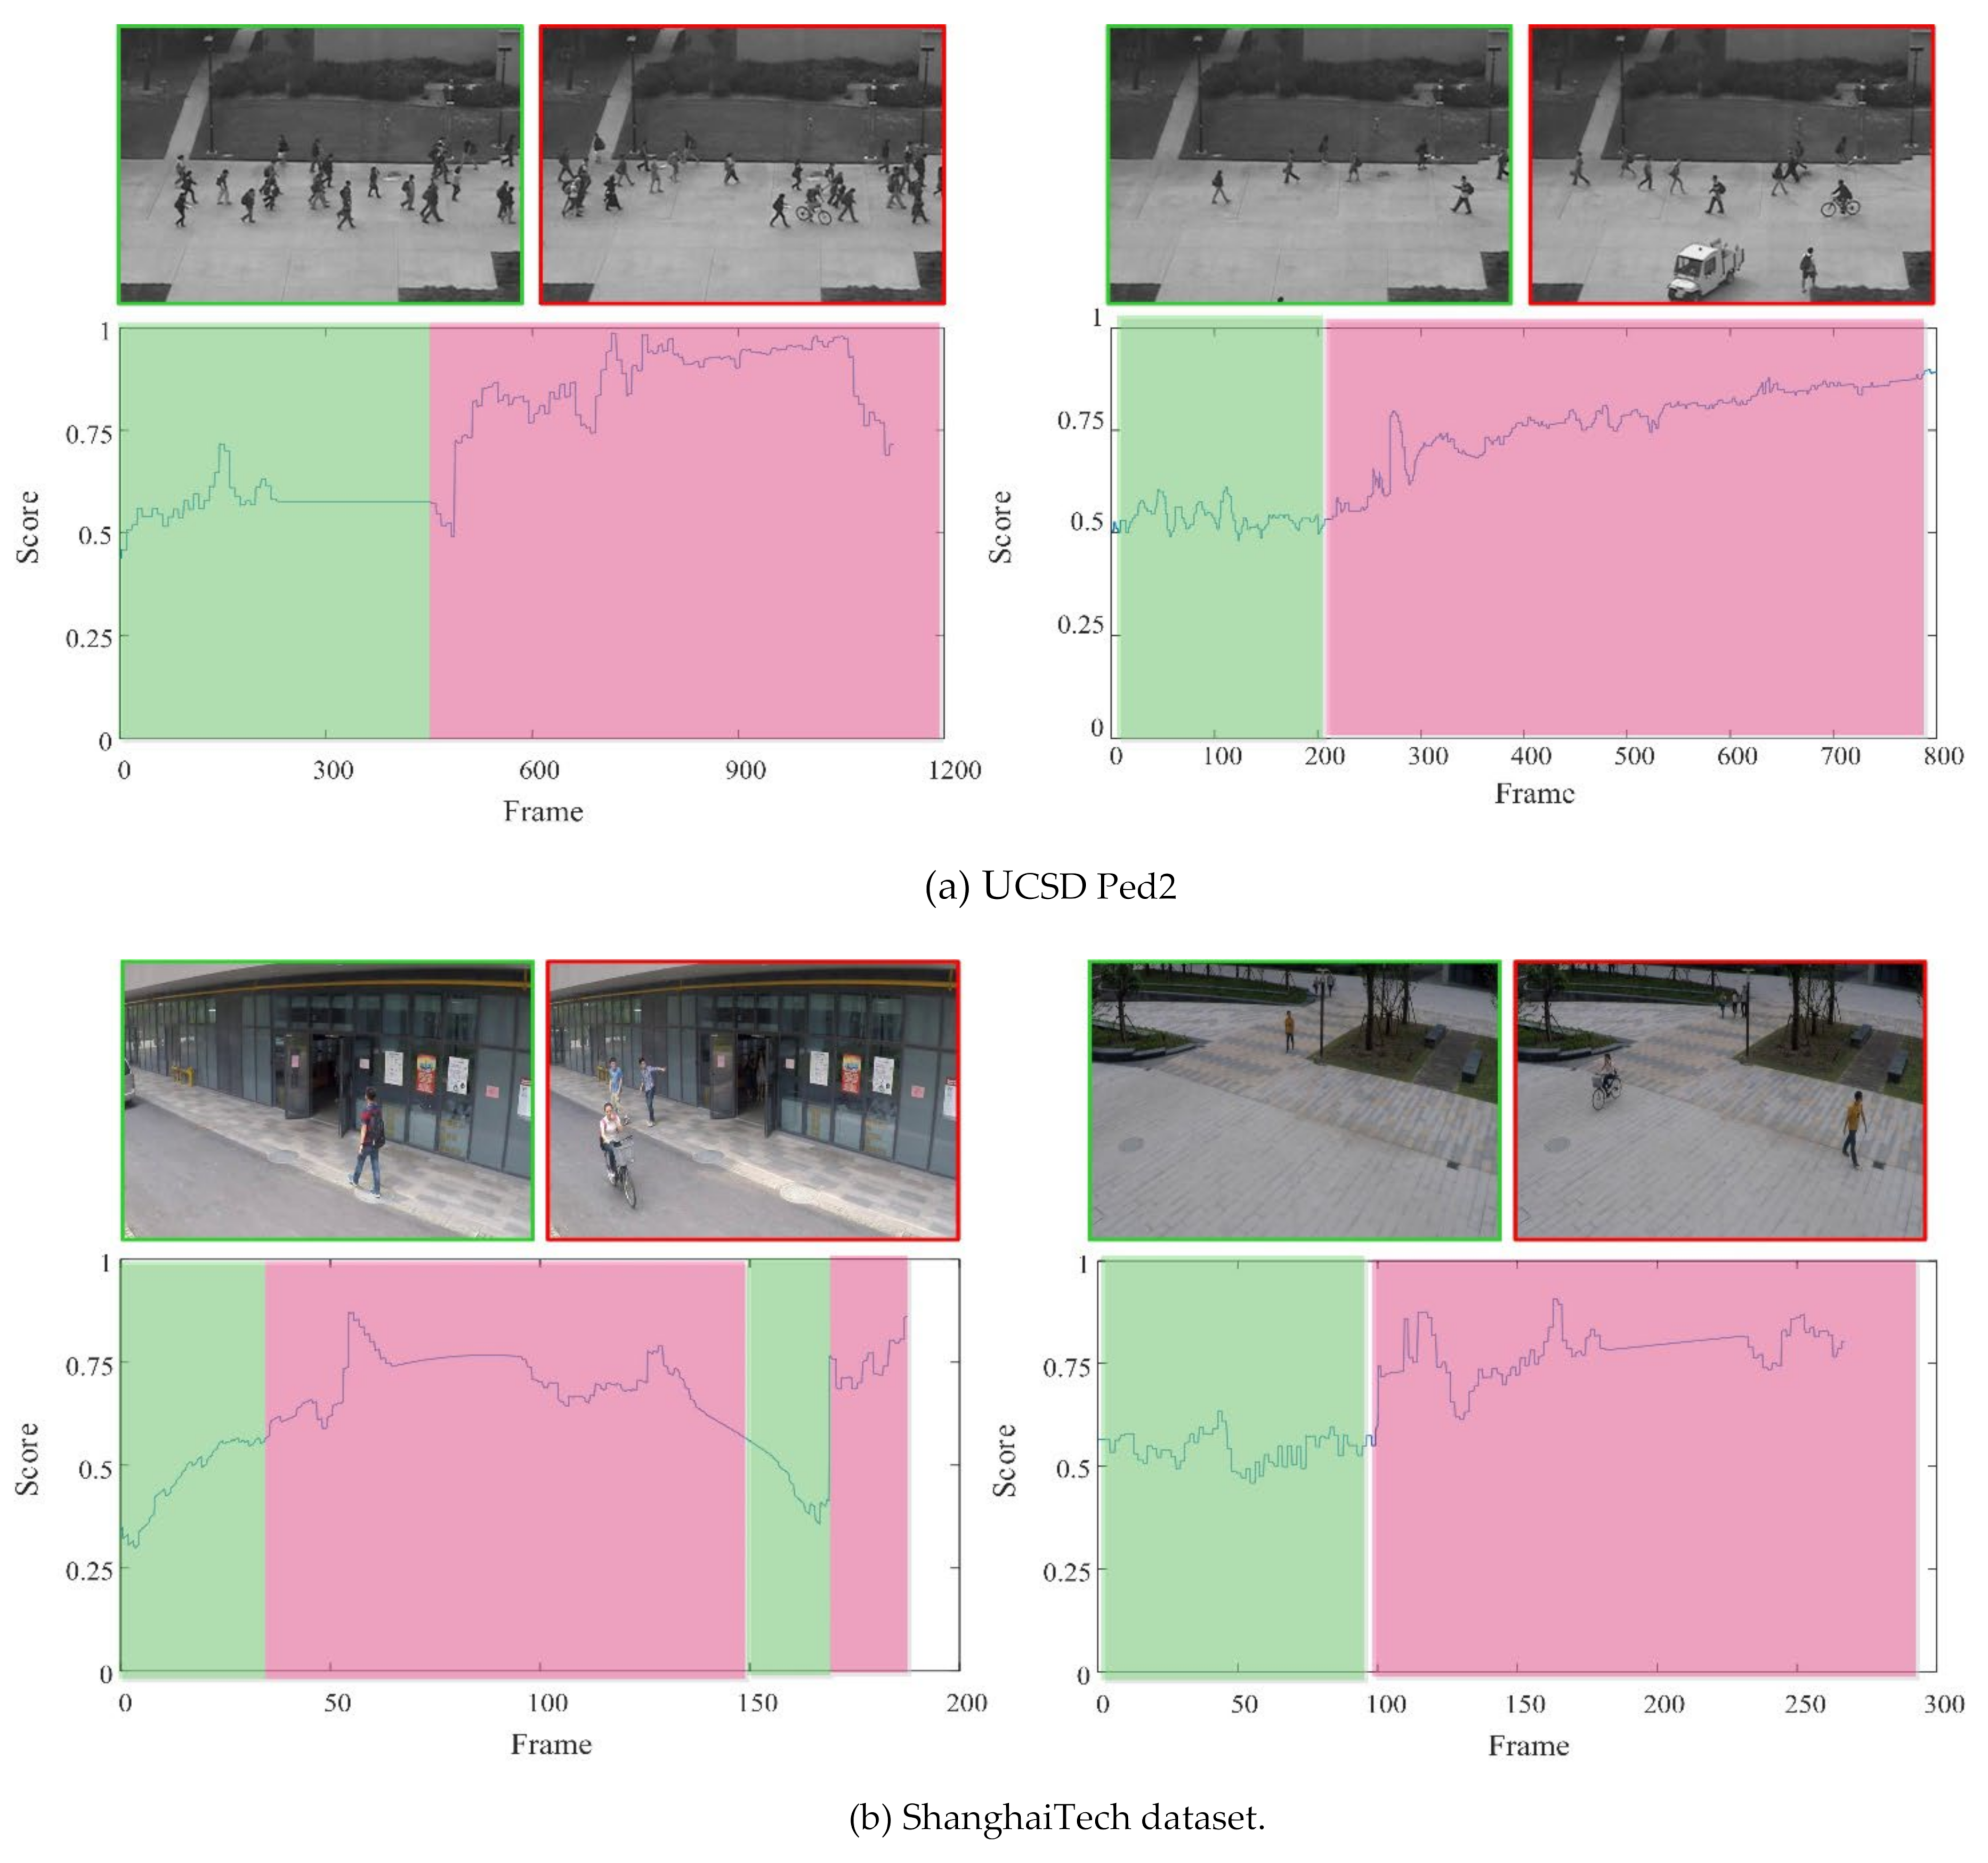
4.5. Visual Results
4.6. Computational Efficiency
5. Conclusions
Author Contributions
Funding
Institutional Review Board Statement
Informed Consent Statement
Data Availability Statement
Conflicts of Interest
References
- Murugan, B.S.; Elhoseny, M.; Shankar, K.; Uthayakumar, J. Region-based scalable smart system for anomaly detection in pedestrian walkways. Comput. Electr. Eng. 2019, 75, 146–160. [Google Scholar] [CrossRef]
- Park, H.; Noh, J.; Ham, B. A Survey on Deep Learning Techniques for Video Anomaly Detection. Int. J. Comput. Eng. Inf. Technol. 2021, 10, 184–191. [Google Scholar]
- Luo, W.; Liu, W.; Lian, D.; Tang, J.; Duan, L.; Peng, X.; Gao, S. Video anomaly detection with sparse coding inspired deep neural networks. IEEE Trans. Pattern Anal. Mach. Intell. 2019, 43, 1070–1084. [Google Scholar] [CrossRef] [PubMed]
- Cosar, S.; Donatiello, G.; Bogorny, V.; Garate, C.; Aivares, O.; Bemond, F. Toward abnormal trajectory and event detection in video surveillance. IEEE Trans. Circuits Syst. Video Technol. 2016, 27, 683–695. [Google Scholar] [CrossRef]
- Mansour, R.F.; Gutierrez, J.E.; Gamarra, M.; Villanueva, J.A.; Leal, N. Intelligent video anomaly detection and classification using faster RCNN with deep reinforcement learning model. Image Vis. Comput. 2021, 112, 104229. [Google Scholar] [CrossRef]
- Fernando, T.; Gammulle, H.; Denman, S. Deep Learning for Medical Anomaly Detection A Survey. ACM Comput. Surv. 2022, 54, 1–37. [Google Scholar] [CrossRef]
- Xu, K.; Jiang, X.; Sun, T. Anomaly detection based on stacked sparse coding with intraframe classification strategy. IEEE Trans. Multimed. 2018, 20, 1062–1074. [Google Scholar] [CrossRef]
- Cheng, K.; Chen, Y.; Fang, W. Video anomaly detection and localization using hierarchical feature representation and gaussian process regression. In Proceedings of the IEEE Conference on Computer Vision and Pattern Recognition, Boston, MA, USA, 7–12 June 2015; pp. 2909–2917. [Google Scholar]
- Zhang, X.; Yang, S.J.; Zhang, W. Video anomaly detection and localization using motion-field shape description and homogeneity testing. Pattern Recognit. 2020, 105, 107394. [Google Scholar] [CrossRef]
- Leyva, R.; Sanchez, V.; Li, C. Video anomaly detection with compact feature sets for online performance. IEEE Trans. Image Process. 2017, 26, 3463–3478. [Google Scholar] [CrossRef] [PubMed] [Green Version]
- Huang, L.; Cao, L.; Li, N. A state perception method for infrared dim and small targets with deep learning. Chin. Opt. 2020, 13, 527–536. [Google Scholar]
- Ionescu, R.; Georgescu, M.; Shao, L. Object-centric auto-encoders and dummy anomalies for abnormal event detection in video. In Proceedings of the IEEE Conference on Computer Vision and Pattern Recognition, Long Beach, CA, USA, 15–20 June 2019; pp. 7834–7843. [Google Scholar]
- Xu, D.; Yan, Y.; Ricci, E.; Sebe, N. Detecting anomalous events in videos by learning deep representations of appearance and motion. Comput. Vis. Image Underst. 2017, 156, 117–127. [Google Scholar] [CrossRef]
- Hasan, M.; Choi, J.; Neumanny, J. Learning temporal regularity in video sequences. In Proceedings of the IEEE Conference on Computer Vision and Pattern Recognition, Las Vegas, NV, USA, 7–12 June 2016; pp. 733–742. [Google Scholar]
- Fan, Y.; Wen, G.; Li, D.; Qiu, S.; Levine, M.D. Video Anomaly Detection and Localization via Gaussian Mixture Fully Convolutional Variational Autoencoder. Comput. Vis. Image Underst. 2020, 195, 102920. [Google Scholar] [CrossRef] [Green Version]
- Hinton, G.; Salakhutdinov, R. Reducing the Dimensionality of Data with Neural Networks. Science 2006, 313, 504–507. [Google Scholar] [CrossRef] [PubMed] [Green Version]
- Ramachandra, B.; Jones, M.; Vatsavai, R. Learning a distance function with a Siamese network to localize anomalies in videos. In Proceedings of the IEEE Winter Conference on Applications of Computer Vision, Snowmass Village, CO, USA, 2–5 March 2020; pp. 2587–2596. [Google Scholar]
- Ravanbakhsh, M.; Nabi, M.; Mousavi, H.; Sangineto, E.; Sebe, N. Abnormal event detection in videos using generative adversarial nets. In Proceedings of the IEEE International Conference on Image Processing, Beijing, China, 17–20 September 2017; pp. 1577–1581. [Google Scholar]
- Ruff, L.; Vandermulen, R.; Gornitz, N.; Deecke, L.; Siddiqui, S.; Binder, A.; Muller, E.; Kloft, M. Deep One-Class Classification. In Proceedings of the 35th International Conference on Machine Learning, Stockholm, Sweden, 10–15 July 2019; pp. 6981–6996. [Google Scholar]
- Abati, D.; Porrello, A.; Calderara, S.; Cucchiara, R. Latent space autoregression for novelty detection. In Proceedings of the IEEE Conference on Computer Vision and Pattern Recognition, Long Beach, CA, USA, 15–20 June 2019; pp. 481–490. [Google Scholar]
- Luo, W.; Liu, W.; Gao, S. A revisit of sparse coding based anomaly detection in stacked rnn framework. In Proceedings of the IEEE International Conference on Computer Vision, Venice, Italy, 22–29 October 2017; pp. 341–349. [Google Scholar]
- Teed, Z.; Deng, J. RAFT: Recurrent All Pairs Field Transforms for Optical Flow. In Proceedings of the European Conference on Computer Vision, Glasgow, UK, 23–28 August 2020; pp. 4839–4843. [Google Scholar]
- Dong, G.; Liu, L.; Vuong, L.; Budhaditya, S.; Moussa, M.R.; Svetha, V.; Hengel, A. Memorizing normality to detect anomaly: Memory-augmented deep autoencoder for unsupervised anomaly detection. In Proceedings of the IEEE International Conference on Computer Vision, Los Angeles, CA, USA, 15–21 June 2019; pp. 1705–1714. [Google Scholar]
- Junejo, I. Using dynamic Bayesian network for scene modeling and anomaly detection. Signal Image Video Process. 2010, 4, 1–10. [Google Scholar] [CrossRef]
- Sekh, A.; Dogra, D.; Kar, S. Video trajectory analysis using unsupervised clustering and multi-criteria ranking. Soft Comput. 2020, 24, 16643–16654. [Google Scholar] [CrossRef]
- Wang, H.; Kläser, A.; Schmid, C.; Liu, C.-L. Dense trajectories and motion boundary descriptors for action recognition. Int. J. Comput. Vis. 2013, 103, 60–79. [Google Scholar] [CrossRef] [Green Version]
- Wang, H.; Schmid, C. Action recognition with improved trajectories. In Proceedings of the IEEE International Conference on Computer Vision, San Francisco, CA, USA, 15–17 June 2013; pp. 3551–3558. [Google Scholar]
- Convertini, N.; Dentamaro, V.; Impedovo, D. A controlled benchmark of video violence detection techniques. Information 2020, 11, 321. [Google Scholar] [CrossRef]
- Xu, L.; Gong, C.; Yang, J. Violent video detection based on MoSIFT feature and sparse coding. In Proceedings of the 2014 IEEE International Conference on Acoustics, Speech and Signal Processing, Florence, Italy, 4–9 May 2014; pp. 3538–3542. [Google Scholar]
- Roshtkhari, M.J.; Levine, M.D. Online dominant and anomalous behavior detection in videos. In Proceedings of the IEEE International Conference on Computer Vision, Portland, OR, USA, 7–13 June 2013; pp. 2611–2618. [Google Scholar]
- Dalal, N.; Triggs, B. Histograms of Oriented Gradients for Human Detection. In Proceedings of the IEEE Conference on Computer Vision and Pattern Recognition, San Diego, CA, USA, 5–11 June 2005; pp. 886–893. [Google Scholar]
- Keval, D.; Yasin, Y. Online Anomaly Detection in Surveillance Videos with Asymptotic Bounds on False Alarm Rate. Pattern Recognit. 2021, 114, 107865. [Google Scholar]
- Song, H.; Sun, C.; Wu, X. Learning Normal Patterns via Adversarial Attention-Based Autoencoder for Abnormal Event Detection in Videos. IEEE Trans. Multimed. 2020, 22, 2138–2148. [Google Scholar] [CrossRef]
- Shi, X.; Chen, Z.; Wang, H.; Yeung, D.-Y.; Wong, W.-K.; Woo, W.-C. Convolutional lstm network: A machine learning approach for precipitation nowcasting. In Proceedings of the Conference and Workshop on Neural Information Processing Systems, Montreal, QC, Canada, 7–12 December 2015; pp. 802–810. [Google Scholar]
- Mahadevan, V.; Li, W.; Bhalodia, V.; Vasconcelos, N. Anomaly detection in crowded scenes. In Proceedings of the IEEE Computer Society Conference on Computer Vision and Pattern Recognition, San Francisco, CA, USA, 15–17 June 2010; pp. 1975–1981. [Google Scholar]
- Luo, W.; Liu, W.; Gao, S. Remembering history with convolutional lstm for anomaly detection. In Proceedings of the IEEE International Conference on Multimedia and Expo, Hong Kong, China, 10–14 July 2017; pp. 439–444. [Google Scholar]
- Kingma, D.; Ba, J. Adam: A Method for Stochastic Optimization. In Proceedings of the 3rd International Conference on Learning Representations, Bejing, China, 22–24 June 2014. [Google Scholar]
- Liu, W.; Luo, W.; Lian, D.; Gao, S. Future frame prediction for anomaly detection—A new baseline. In Proceedings of the IEEE Conference on Computer Vision and Pattern Recognition, Salt Lake City, UT, USA, 18–22 June 2018; pp. 6536–6545. [Google Scholar]
- Hu, Y.; Zhang, Y.; Davis, L. Unsupervised Abnormal Crowd Activity Detection Using Semiparametric Scan Statistic. In Proceedings of the IEEE Conference on Computer Vision and Pattern Recognition Workshops, San Francisco, CA, USA, 15–17 June 2013; pp. 767–774. [Google Scholar]
- Sun, Q.; Liu, H.; Harada, T. Online Growing Neural Gas for Anomaly Detection in Changing Surveillance Scenes. Pattern Recognit. 2017, 64, 187–201. [Google Scholar] [CrossRef]
- Ionescu, R.; Smeureanu, S.; Alexe, B.; Popescu, M. Unmasking the Abnormal Events in Video. In Proceedings of the International Conference on Computer Vision, Venice, Italy, 22–29 October 2017; pp. 2914–2922. [Google Scholar]


| Layer | Input | Kernel Size | Stride/ Pad | Output | Last/ Next Layer |
|---|---|---|---|---|---|
| Input | 5 × 227 × 227 | ||||
| Conv1 | 5 × 227 × 227 | 3 × 3 | 2/0 | 128 × 55 × 55 | Input/Conv2 + Lstm1 |
| Conv2 | 128 × 27 × 27 | 3 × 3 | 2/0 | 65 × 27 × 27 | Conv 1/Conv3 + Lstm2 |
| Conv3 | 64 × 27 × 27 | 3 × 3 | 2/0 | 64 × 13 × 13 | Conv 2/Conv4 + Lstm3 |
| Conv4 | 64 × 13 × 13 | 3 × 3 | 2/0 | 32 × 13 × 13 | Conv 3/De-conv1 + Lstm4 |
| Lstm1 | 128 × 55 × 55 | N/A | N/A | 128 × 55 × 55 | Conv1/De-conv4 |
| Lstm2 | 64 × 27 × 27 | N/A | N/A | 64 × 27 × 27 | Conv2/De-conv3 |
| Lstm3 | 64 × 13 × 13 | N/A | N/A | 64 × 13 × 13 | Conv3/De-conv2 |
| Lstm4 | 32 × 13 × 13 | N/A | N/A | 32 × 13 × 13 | Conv4/De-conv1 |
| De-conv1 | 32 × 13 × 13 | 3 × 3 | 2/0 | 64 × 13 × 13 | Lstm4 + Conv4/De-conv2 |
| De-conv2 | 64 × 13 × 13 | 3 × 3 | 2/0 | 128 × 27 × 27 | Lstm3 + Conv1/De-conv3 |
| De-conv3 | 128 × 27 × 27 | 3 × 3 | 2/0 | 256 × 55 × 55 | Lstm2 + Conv2/De-conv4 |
| De-conv4 | 128 × 55 × 55 | 3 × 3 | 2/0 | 5 × 277 × 277 | Lstm3 + De-conv3/Output |
| Output | 5 × 277 × 277 |
| Method | AUC |
|---|---|
| MPPCA [35] | 69.3% |
| MDT [35] | 82.9% |
| SSS [39] | 94.0% |
| Online GNG [40] | 94.0% |
| Unmasking [41] | 82.2% |
| ADMN [13] | 90.8% |
| MT-FRCN [10] | 92.2% |
| Conv2D-AE [14] | 85.0% |
| Conv3D-AE [14] | 91.2% |
| ConvLSTM-AE [21] | 88.1% |
| StackRNN [36] | 92.2% |
| Baseline [38] | 95.4% |
| The proposed CR-AE | 95.6% |
| Method | AUC |
|---|---|
| Conv2D-AE [14] | 60.9% |
| StackRNN [36] | 68.0% |
| Baseline [38] | 72.8% |
| Asymptotic Bound [32] | 70.9% |
| MemAE [23] | 71.2% |
| The proposed CR-AE | 73.1% |
| Method | Computing Environment | CPU | GPU | RAM | Detection Speed (fps) |
|---|---|---|---|---|---|
| MDT [35] | - | 3.0 GHz | - | 2.0 GB | 0.04 |
| StackRNN [36] | Python + Tensorflow | 3.5 GHz | - | 16 GB | 120 |
| AMDN [13] | MATLAB 2015 | 2.1 GHz | Nvidia Quadro K4000 | 32 GB | 0.11 |
| Unmasking [41] | Python + Tensorflow | - | GTX TITAN Xp | - | 20 |
| Proposed CR-AE | Python 3.7 + Tensorflow2.5 | 5.1 GHz | NVIDIA GTX 3080 | 32 GB | 249 |
Publisher’s Note: MDPI stays neutral with regard to jurisdictional claims in published maps and institutional affiliations. |
© 2022 by the authors. Licensee MDPI, Basel, Switzerland. This article is an open access article distributed under the terms and conditions of the Creative Commons Attribution (CC BY) license (https://creativecommons.org/licenses/by/4.0/).
Share and Cite
Wang, B.; Yang, C. Video Anomaly Detection Based on Convolutional Recurrent AutoEncoder. Sensors 2022, 22, 4647. https://doi.org/10.3390/s22124647
Wang B, Yang C. Video Anomaly Detection Based on Convolutional Recurrent AutoEncoder. Sensors. 2022; 22(12):4647. https://doi.org/10.3390/s22124647
Chicago/Turabian StyleWang, Bokun, and Caiqian Yang. 2022. "Video Anomaly Detection Based on Convolutional Recurrent AutoEncoder" Sensors 22, no. 12: 4647. https://doi.org/10.3390/s22124647
APA StyleWang, B., & Yang, C. (2022). Video Anomaly Detection Based on Convolutional Recurrent AutoEncoder. Sensors, 22(12), 4647. https://doi.org/10.3390/s22124647