
TLSO with Graphene Sensors—An Application to Measurements of Corrective Forces in the Prototype of Intelligent Brace


Abstract
:1. Introduction
2. Relevant Research
3. Materials and Methods
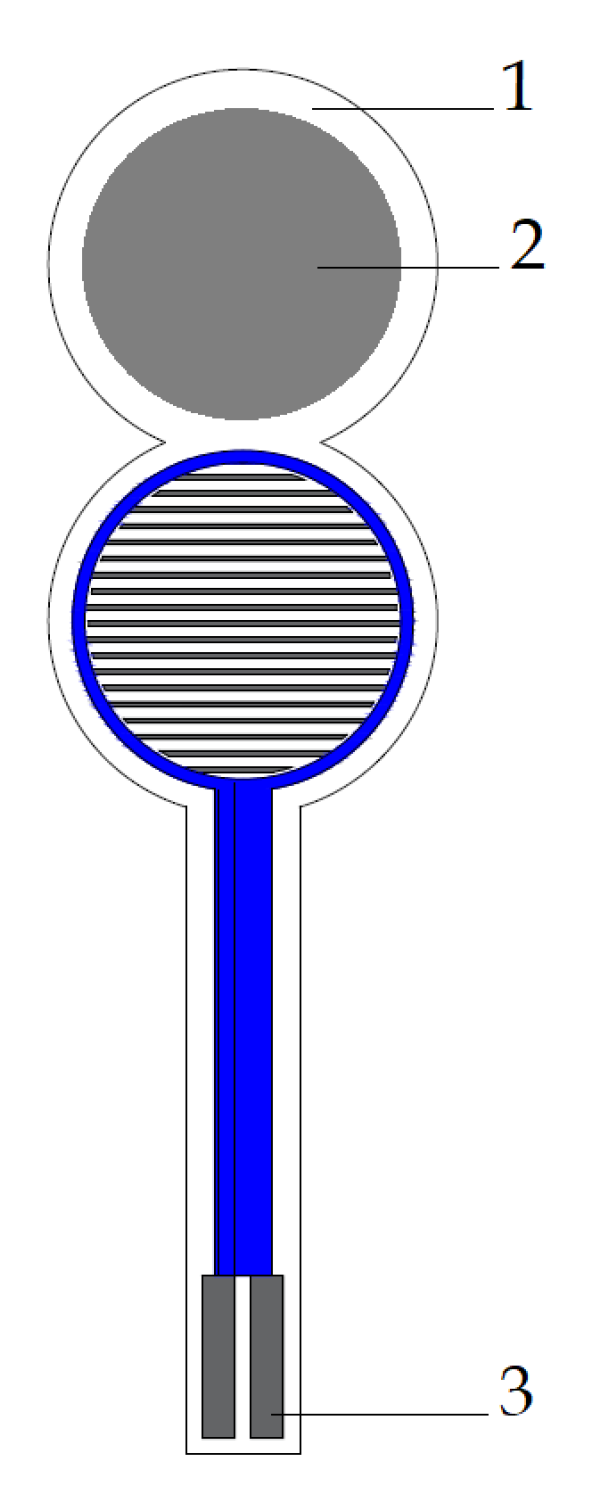
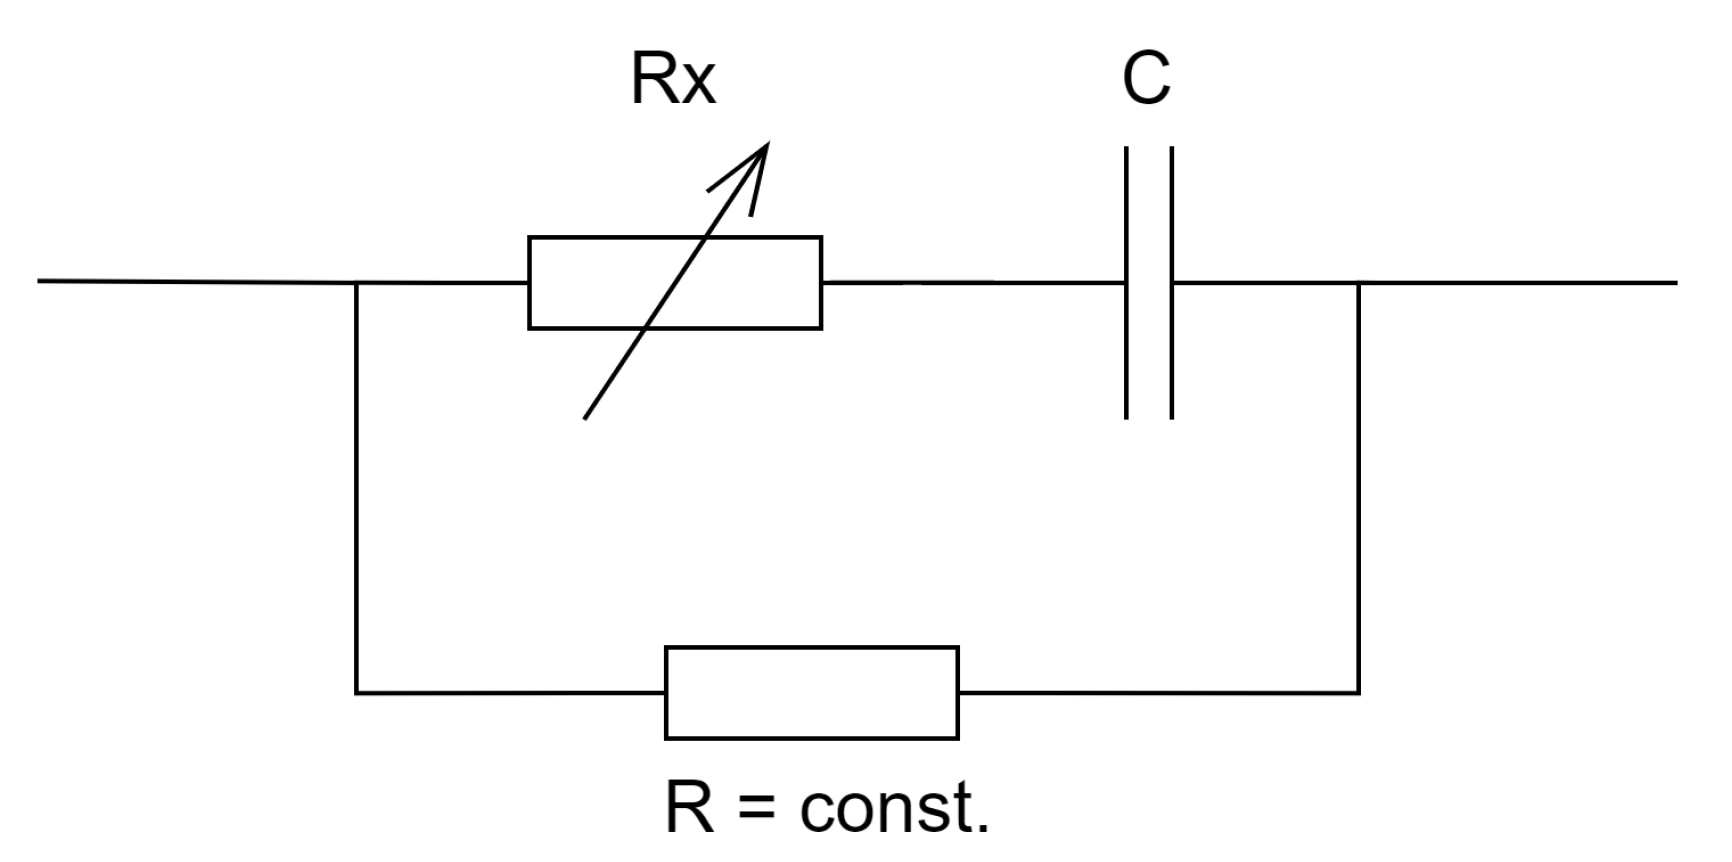
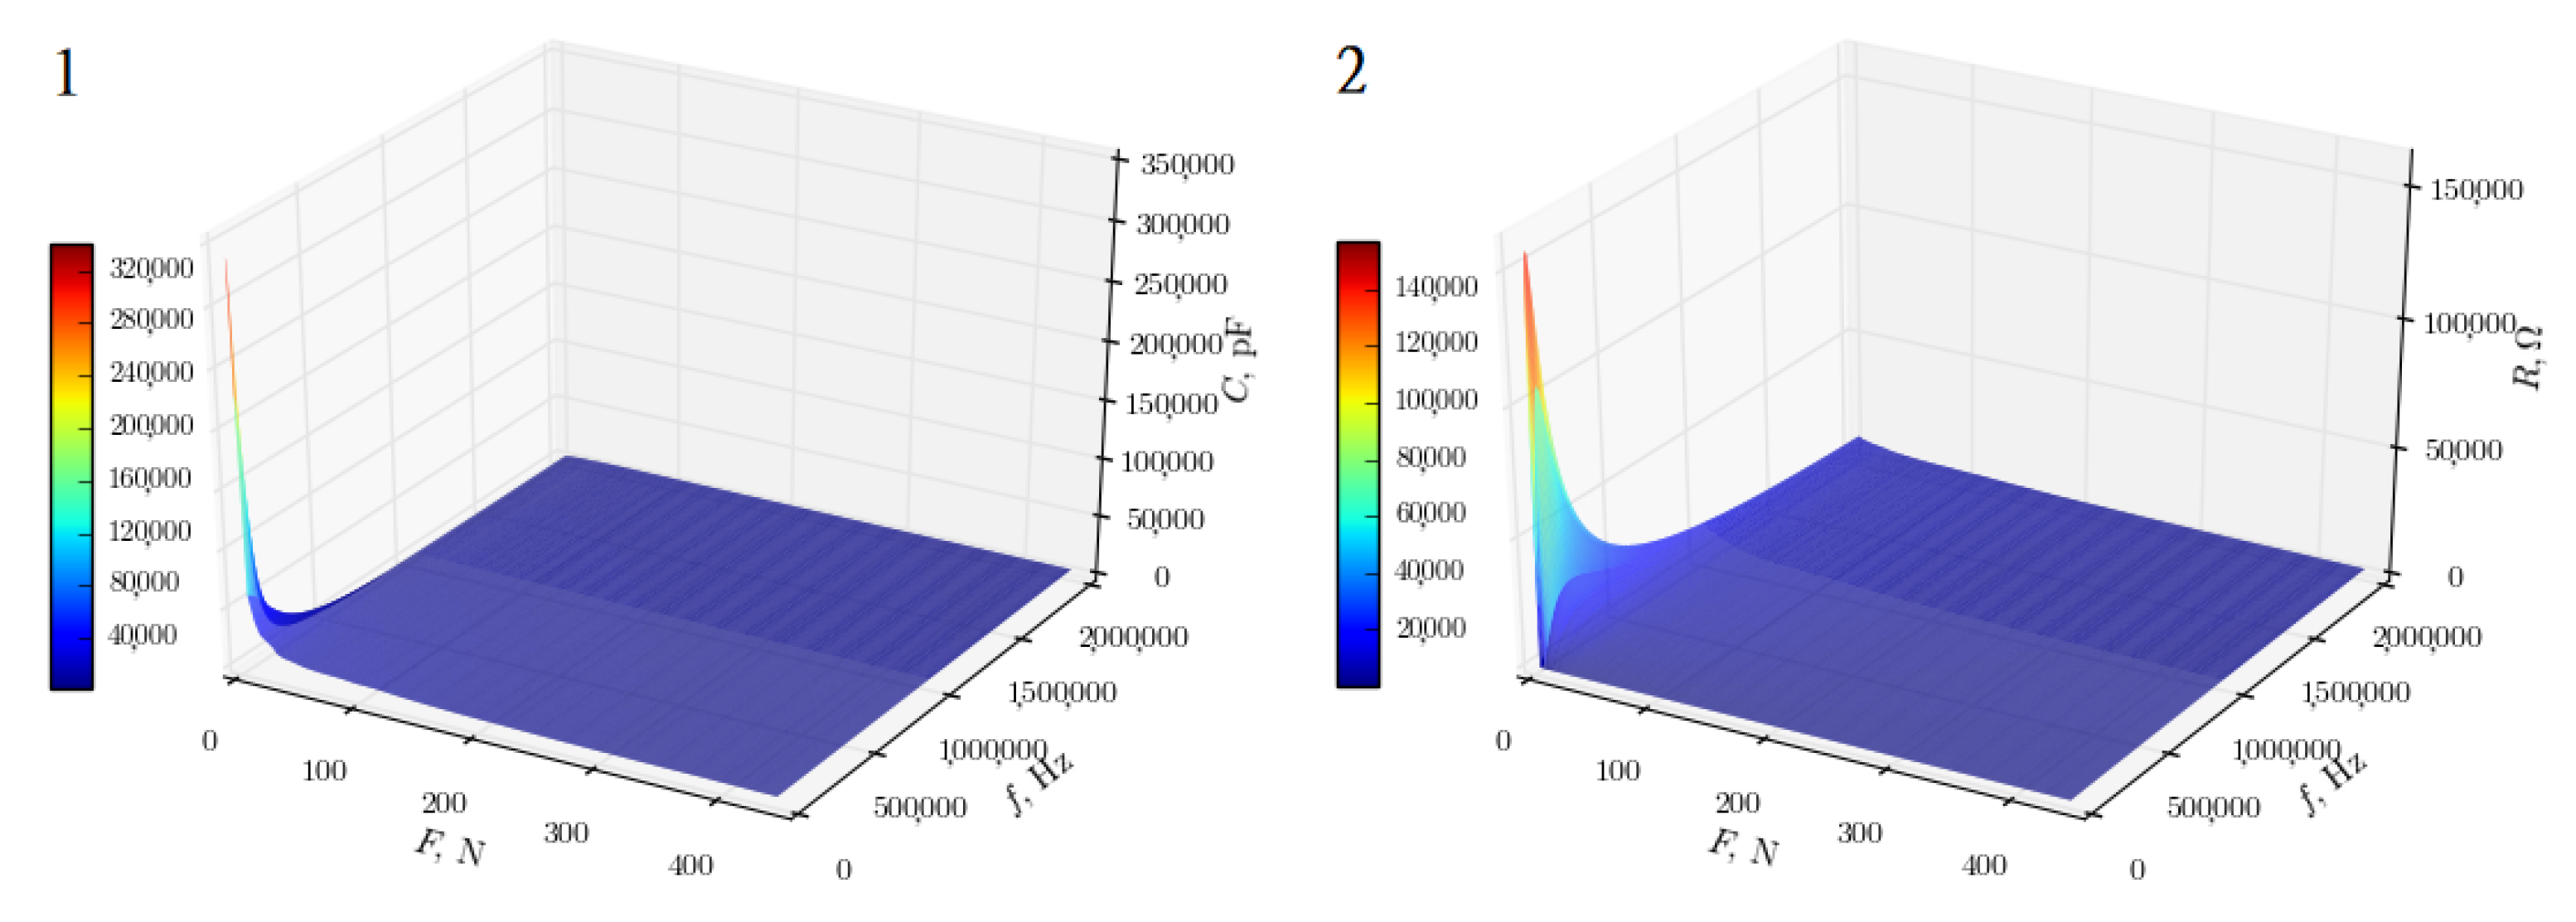
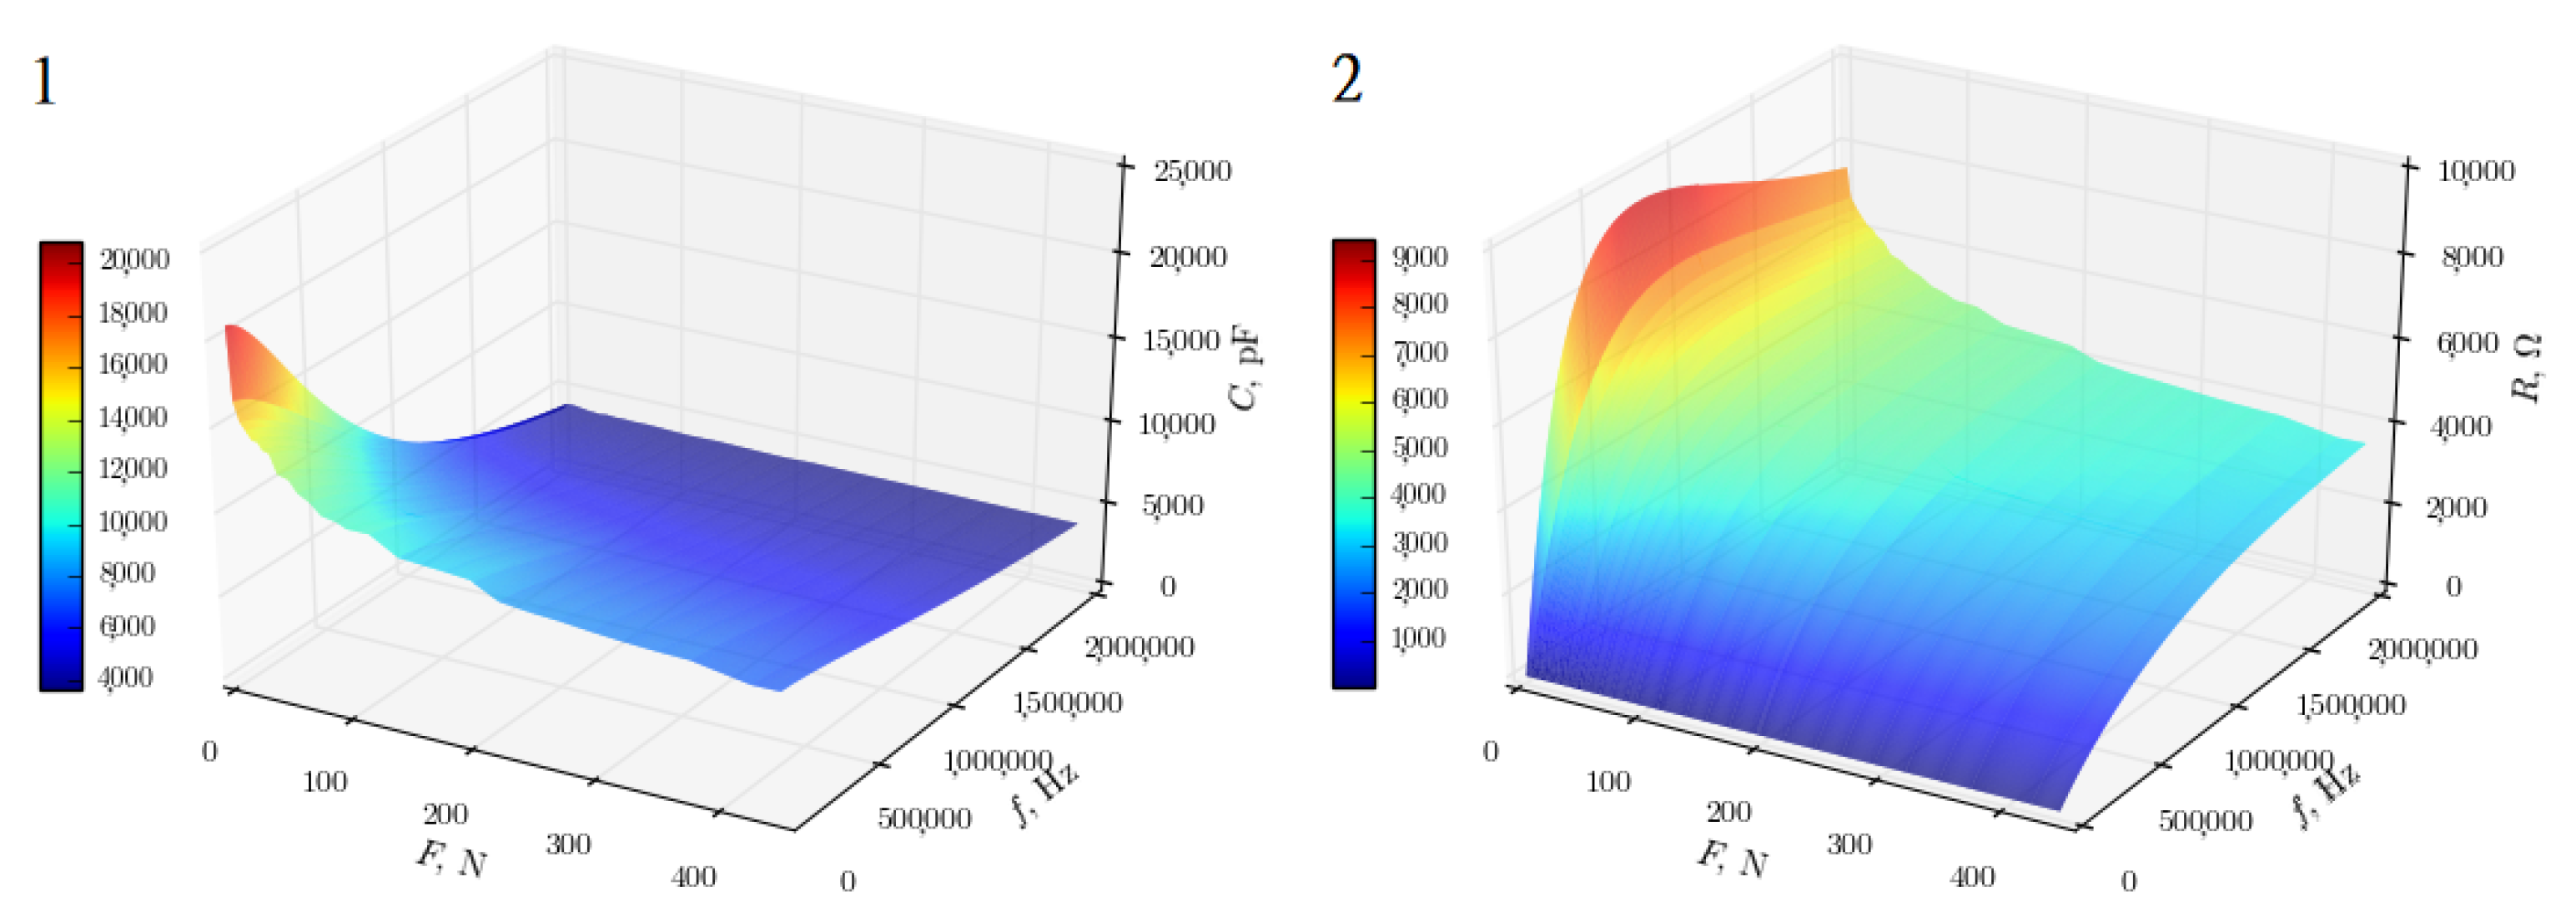
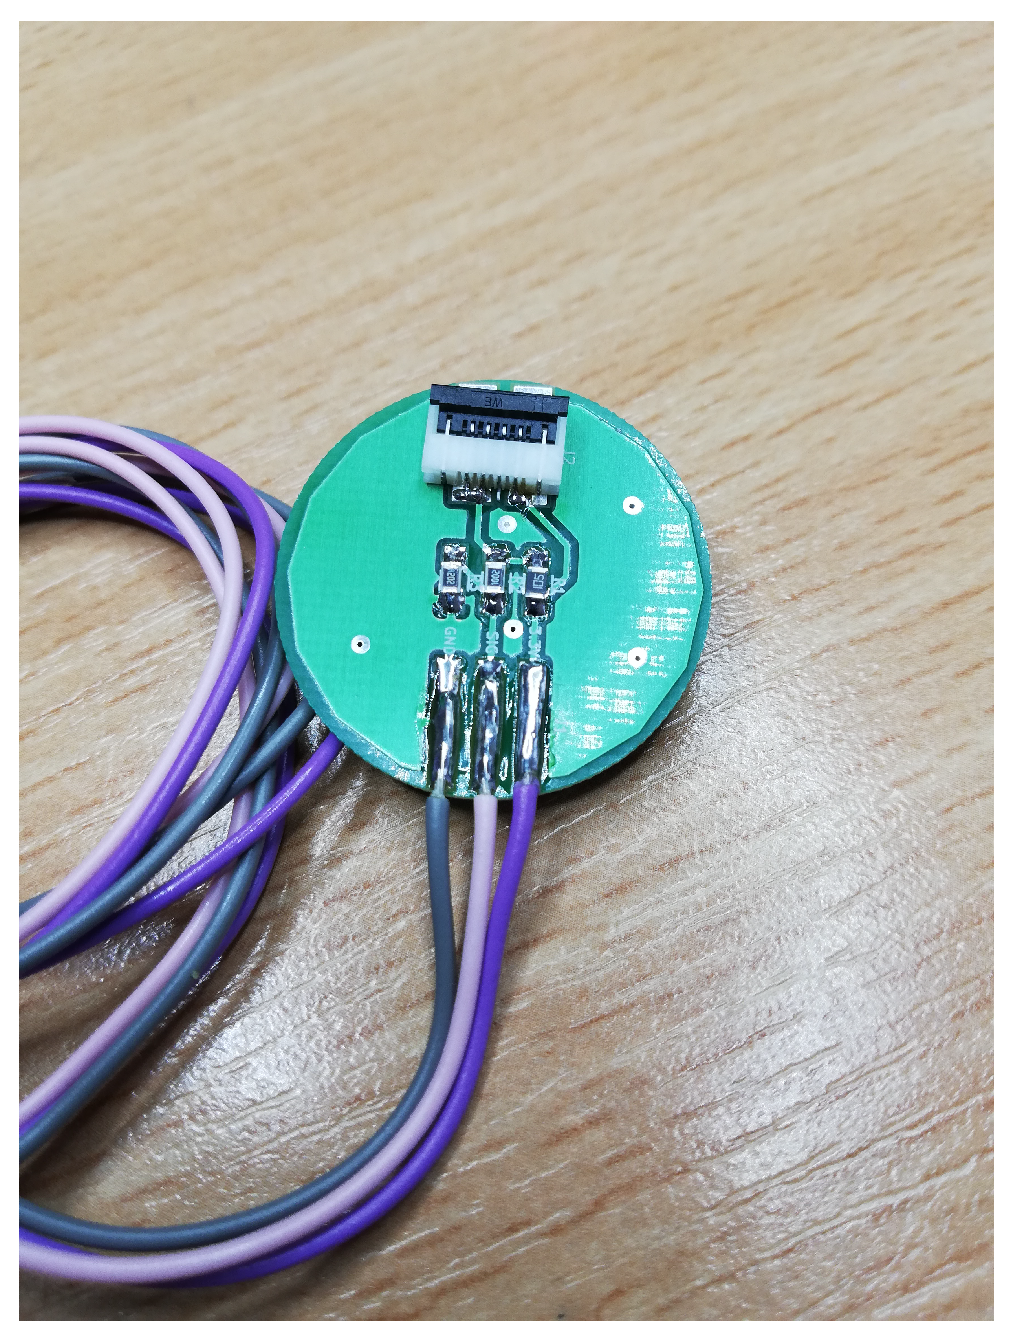
3.1. Thin-Film Pressure Sensors
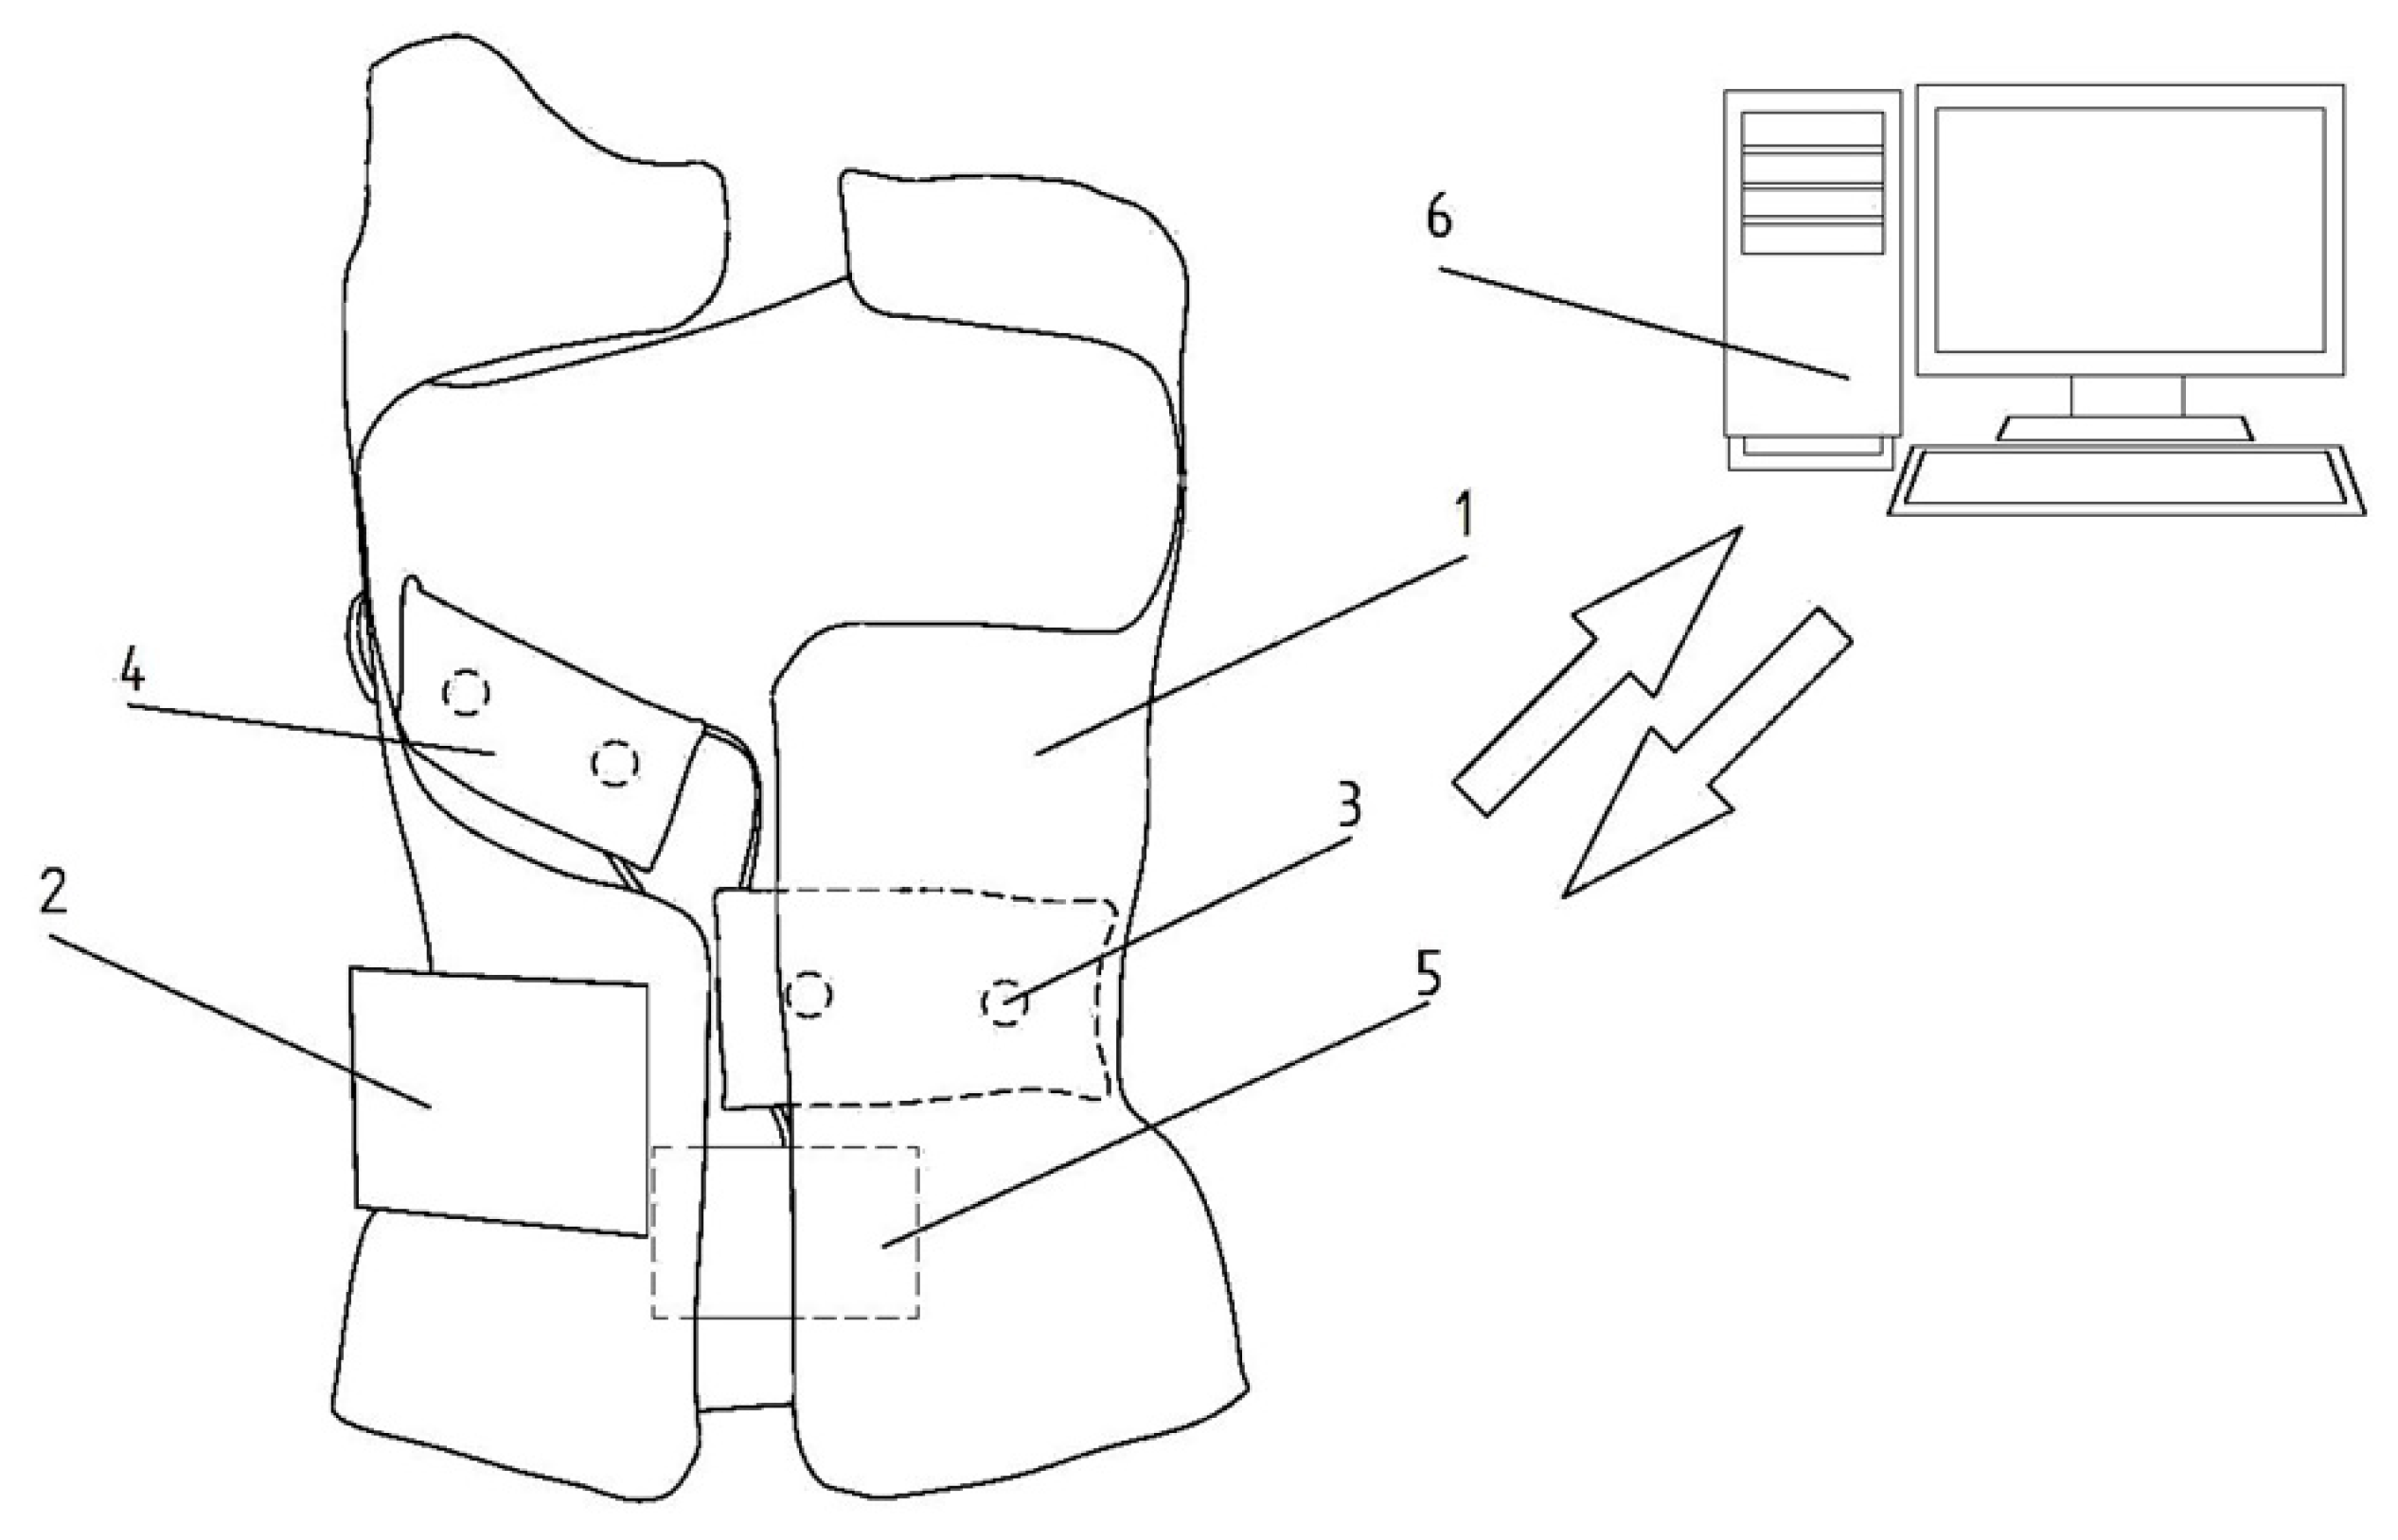
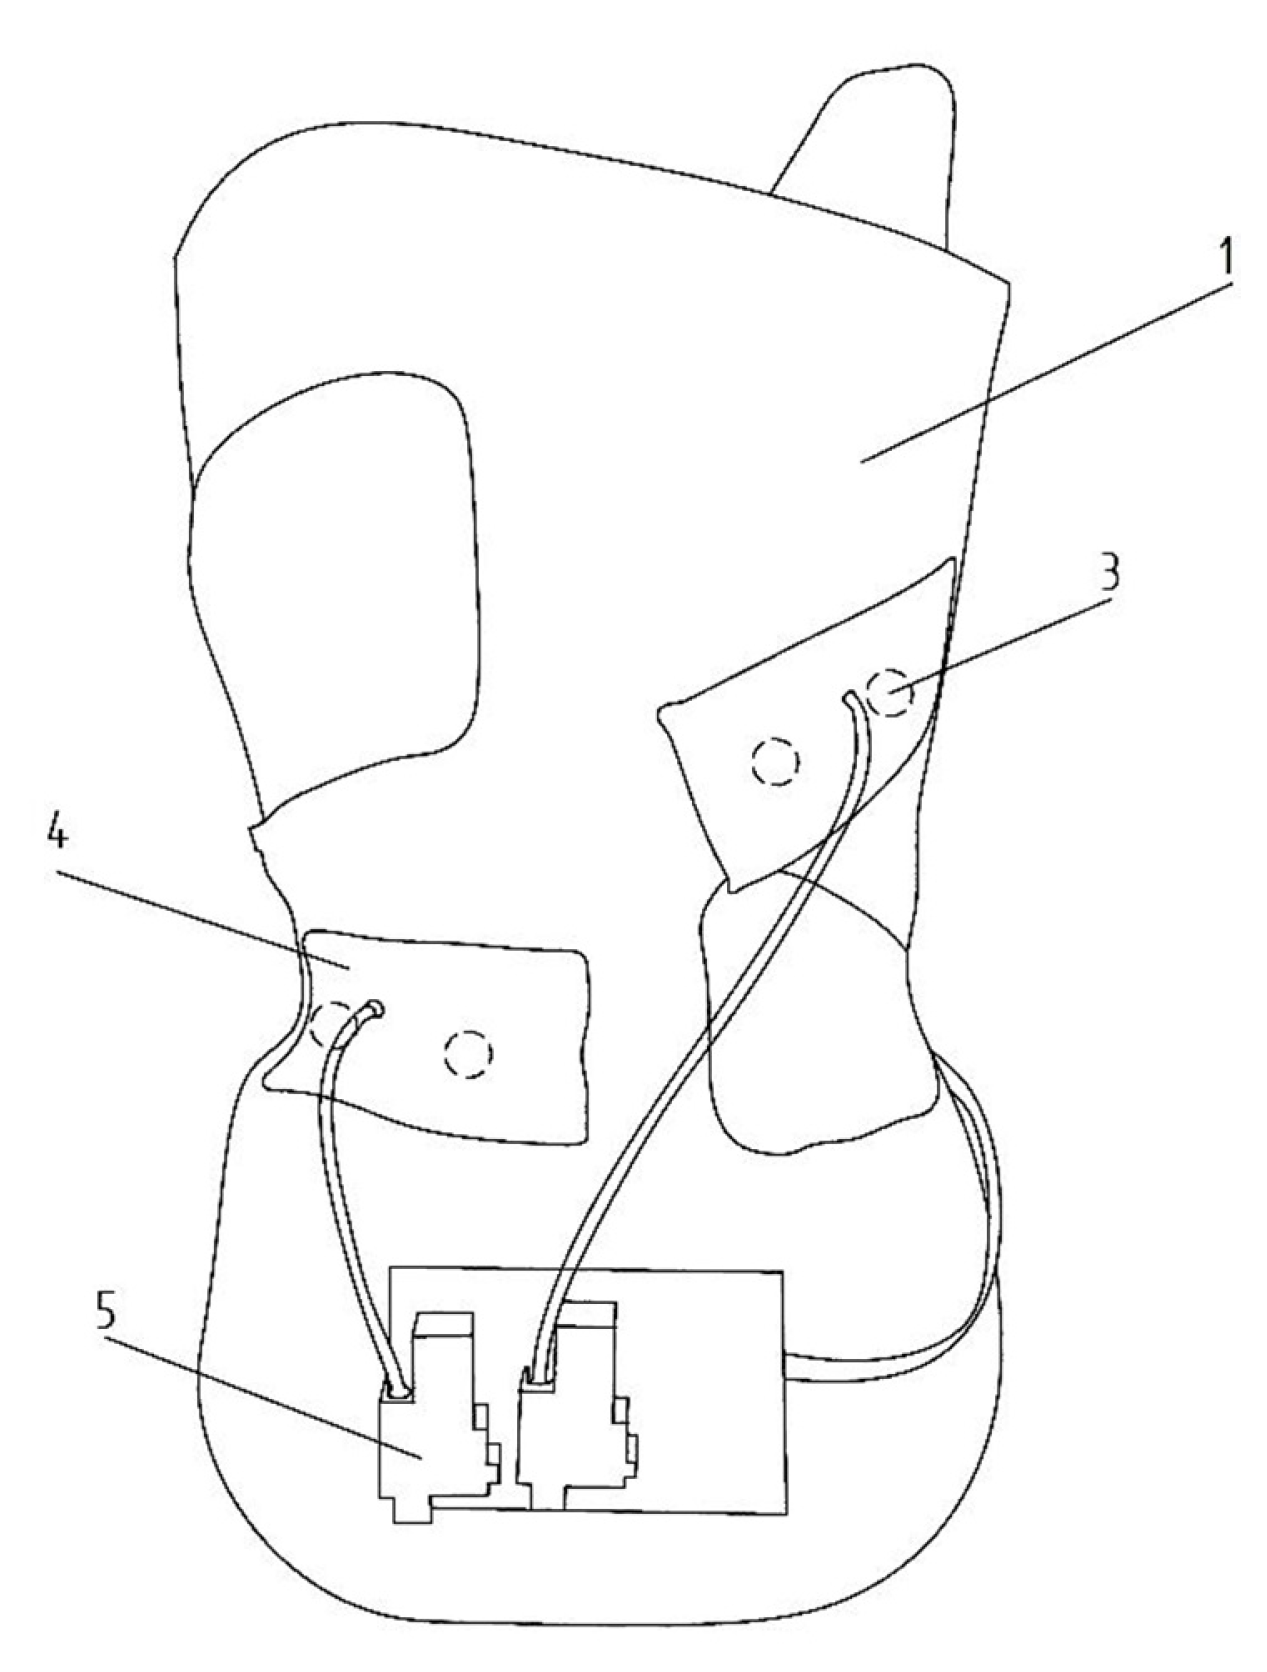
3.2. System
3.3. Database
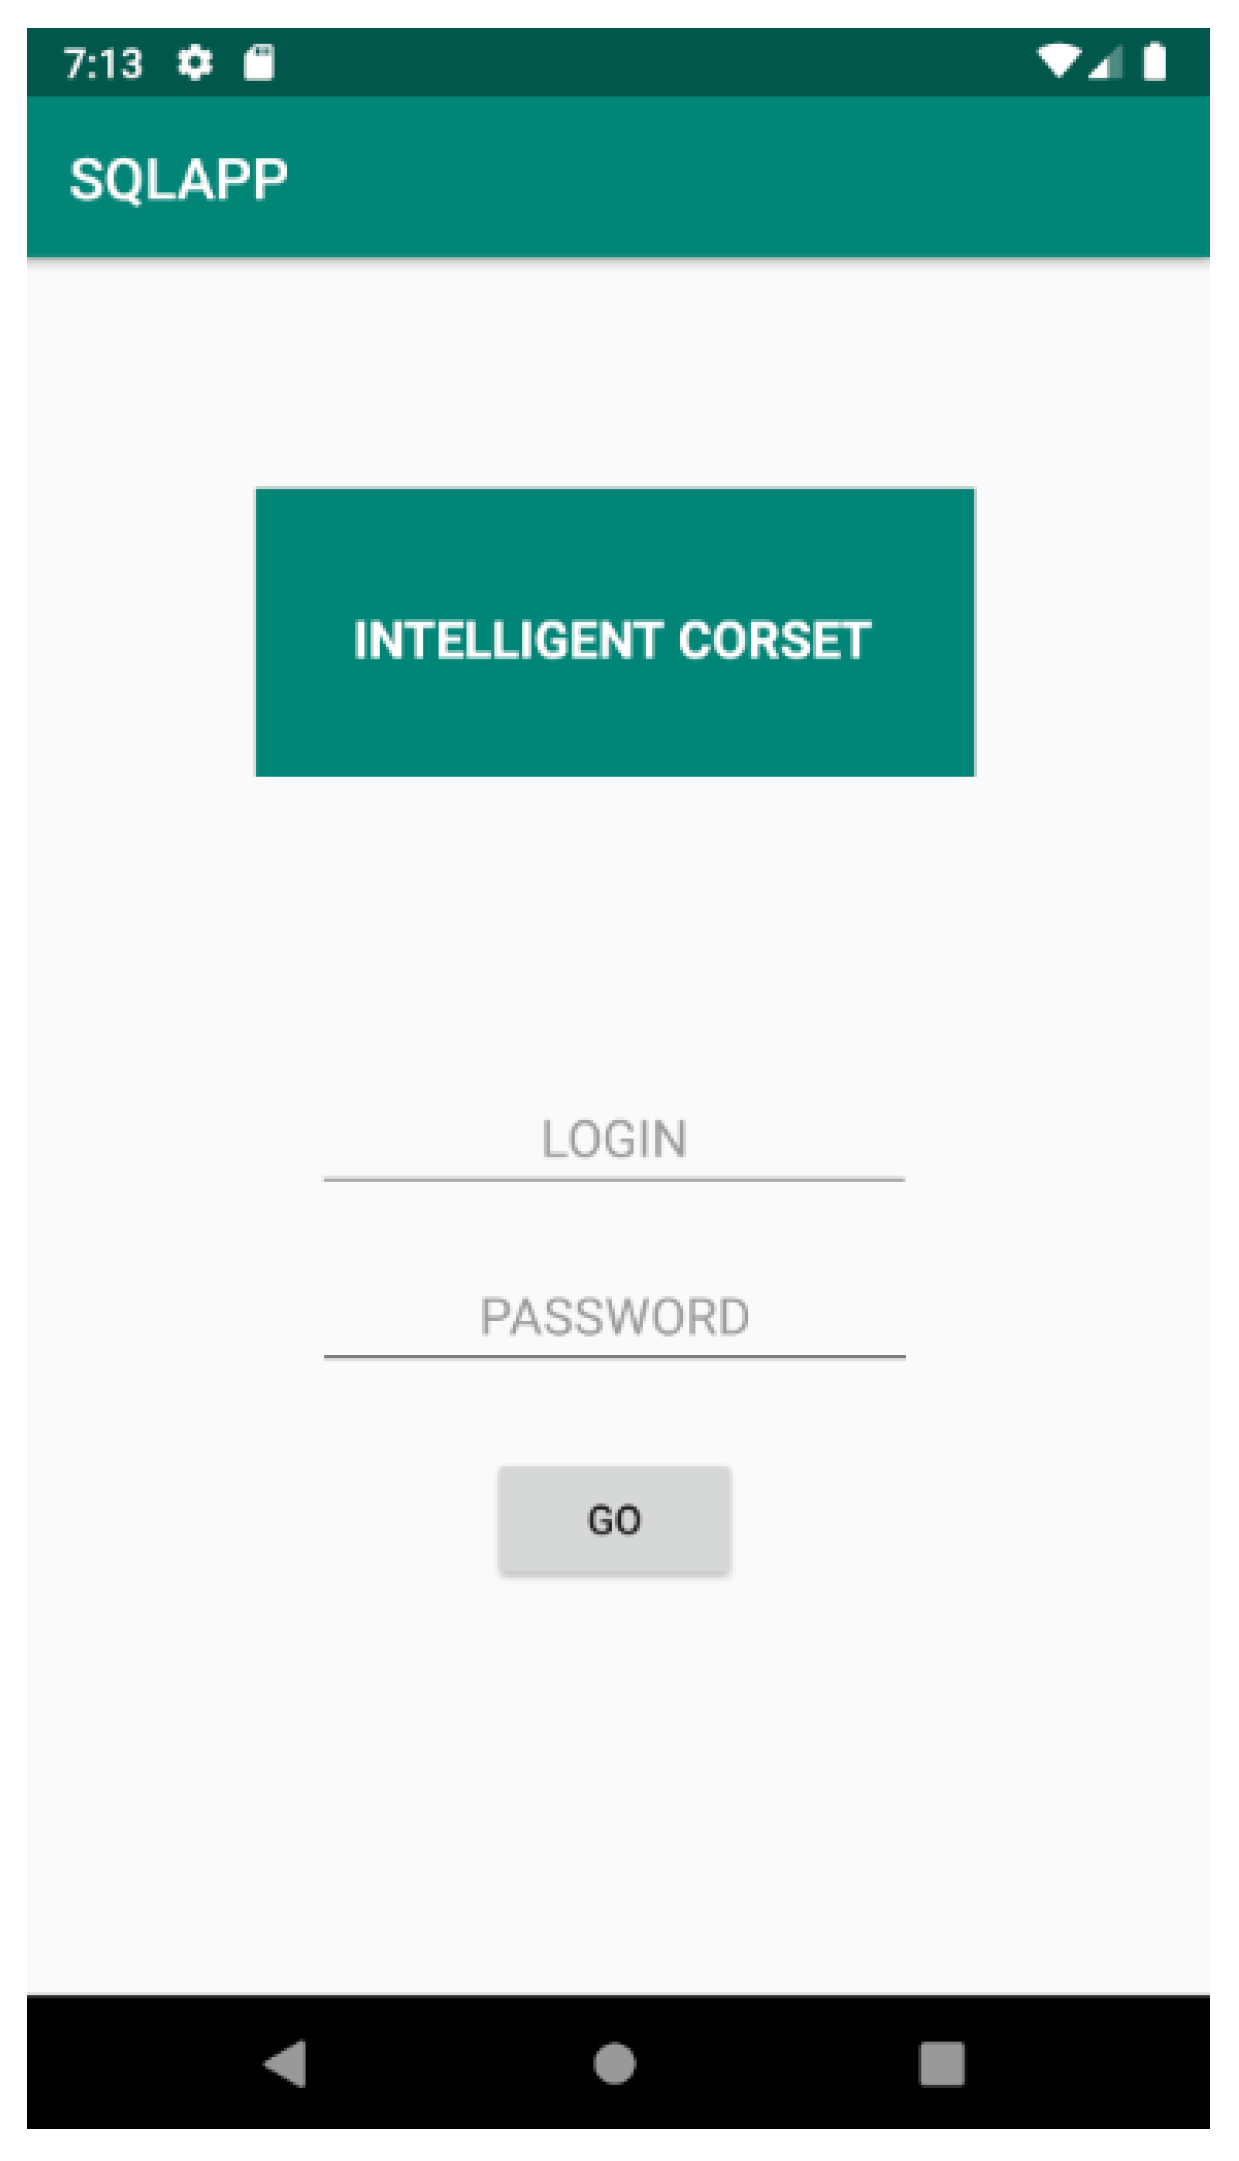
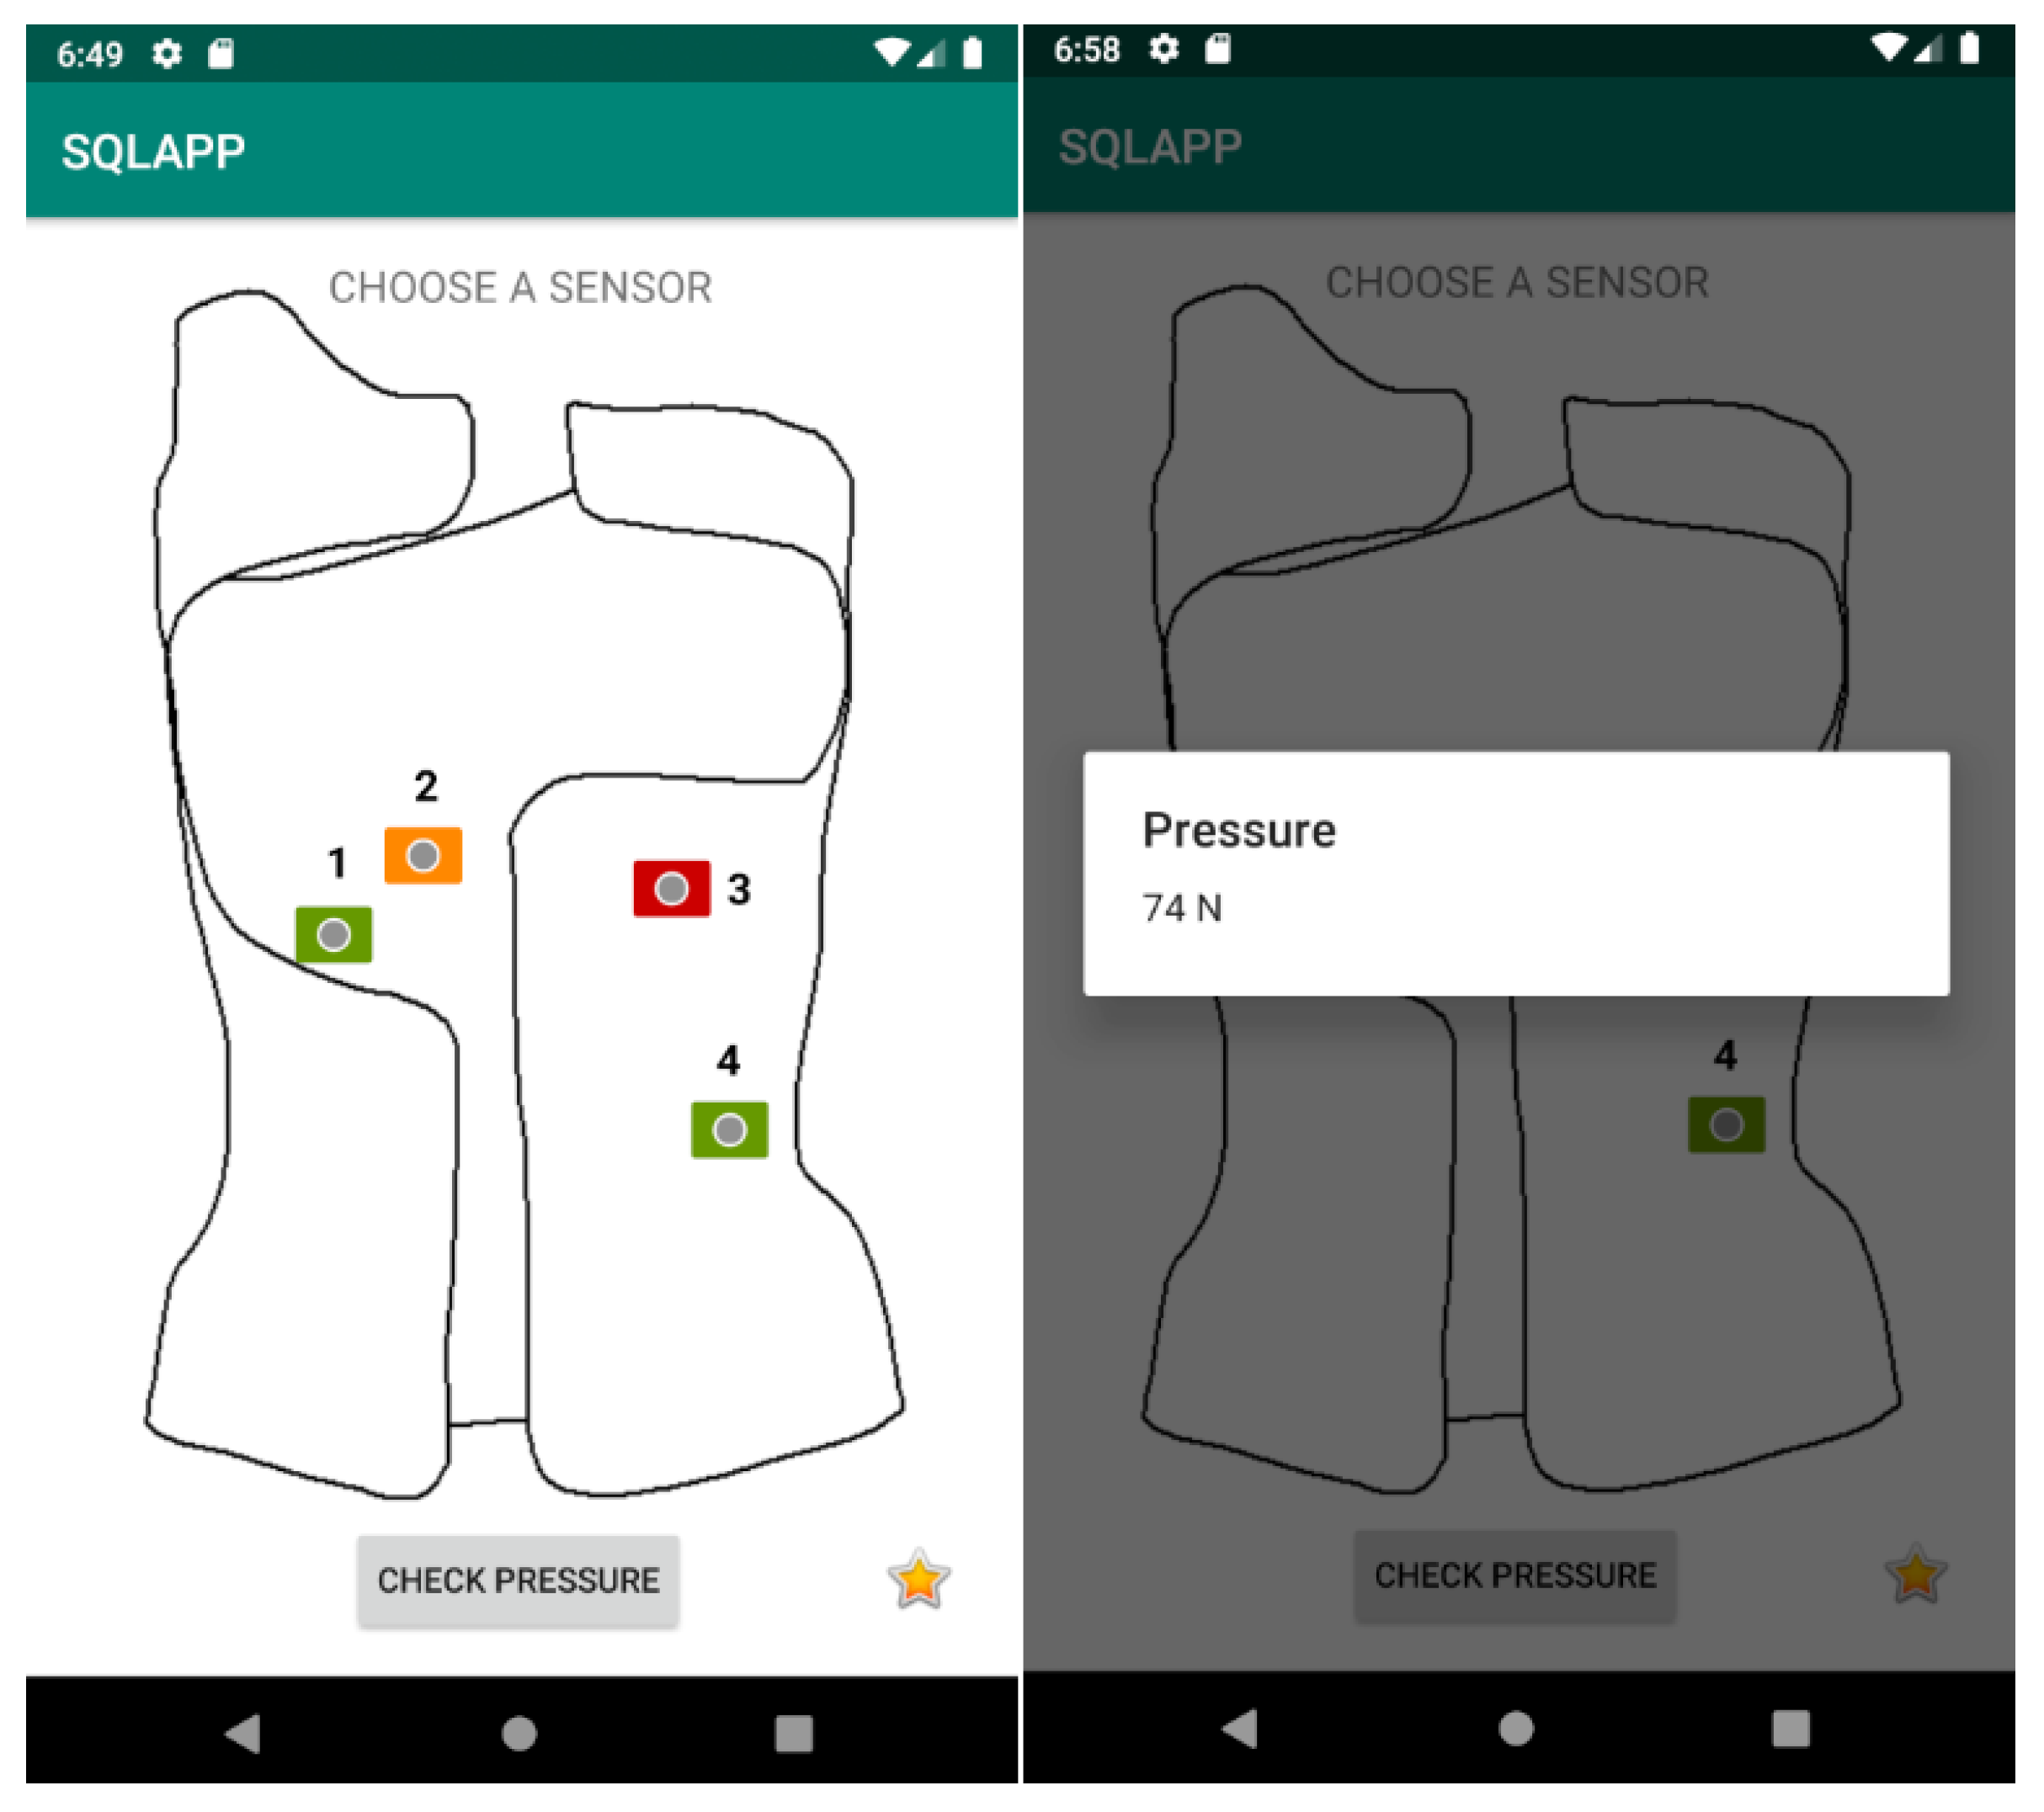
3.4. Application for Android System
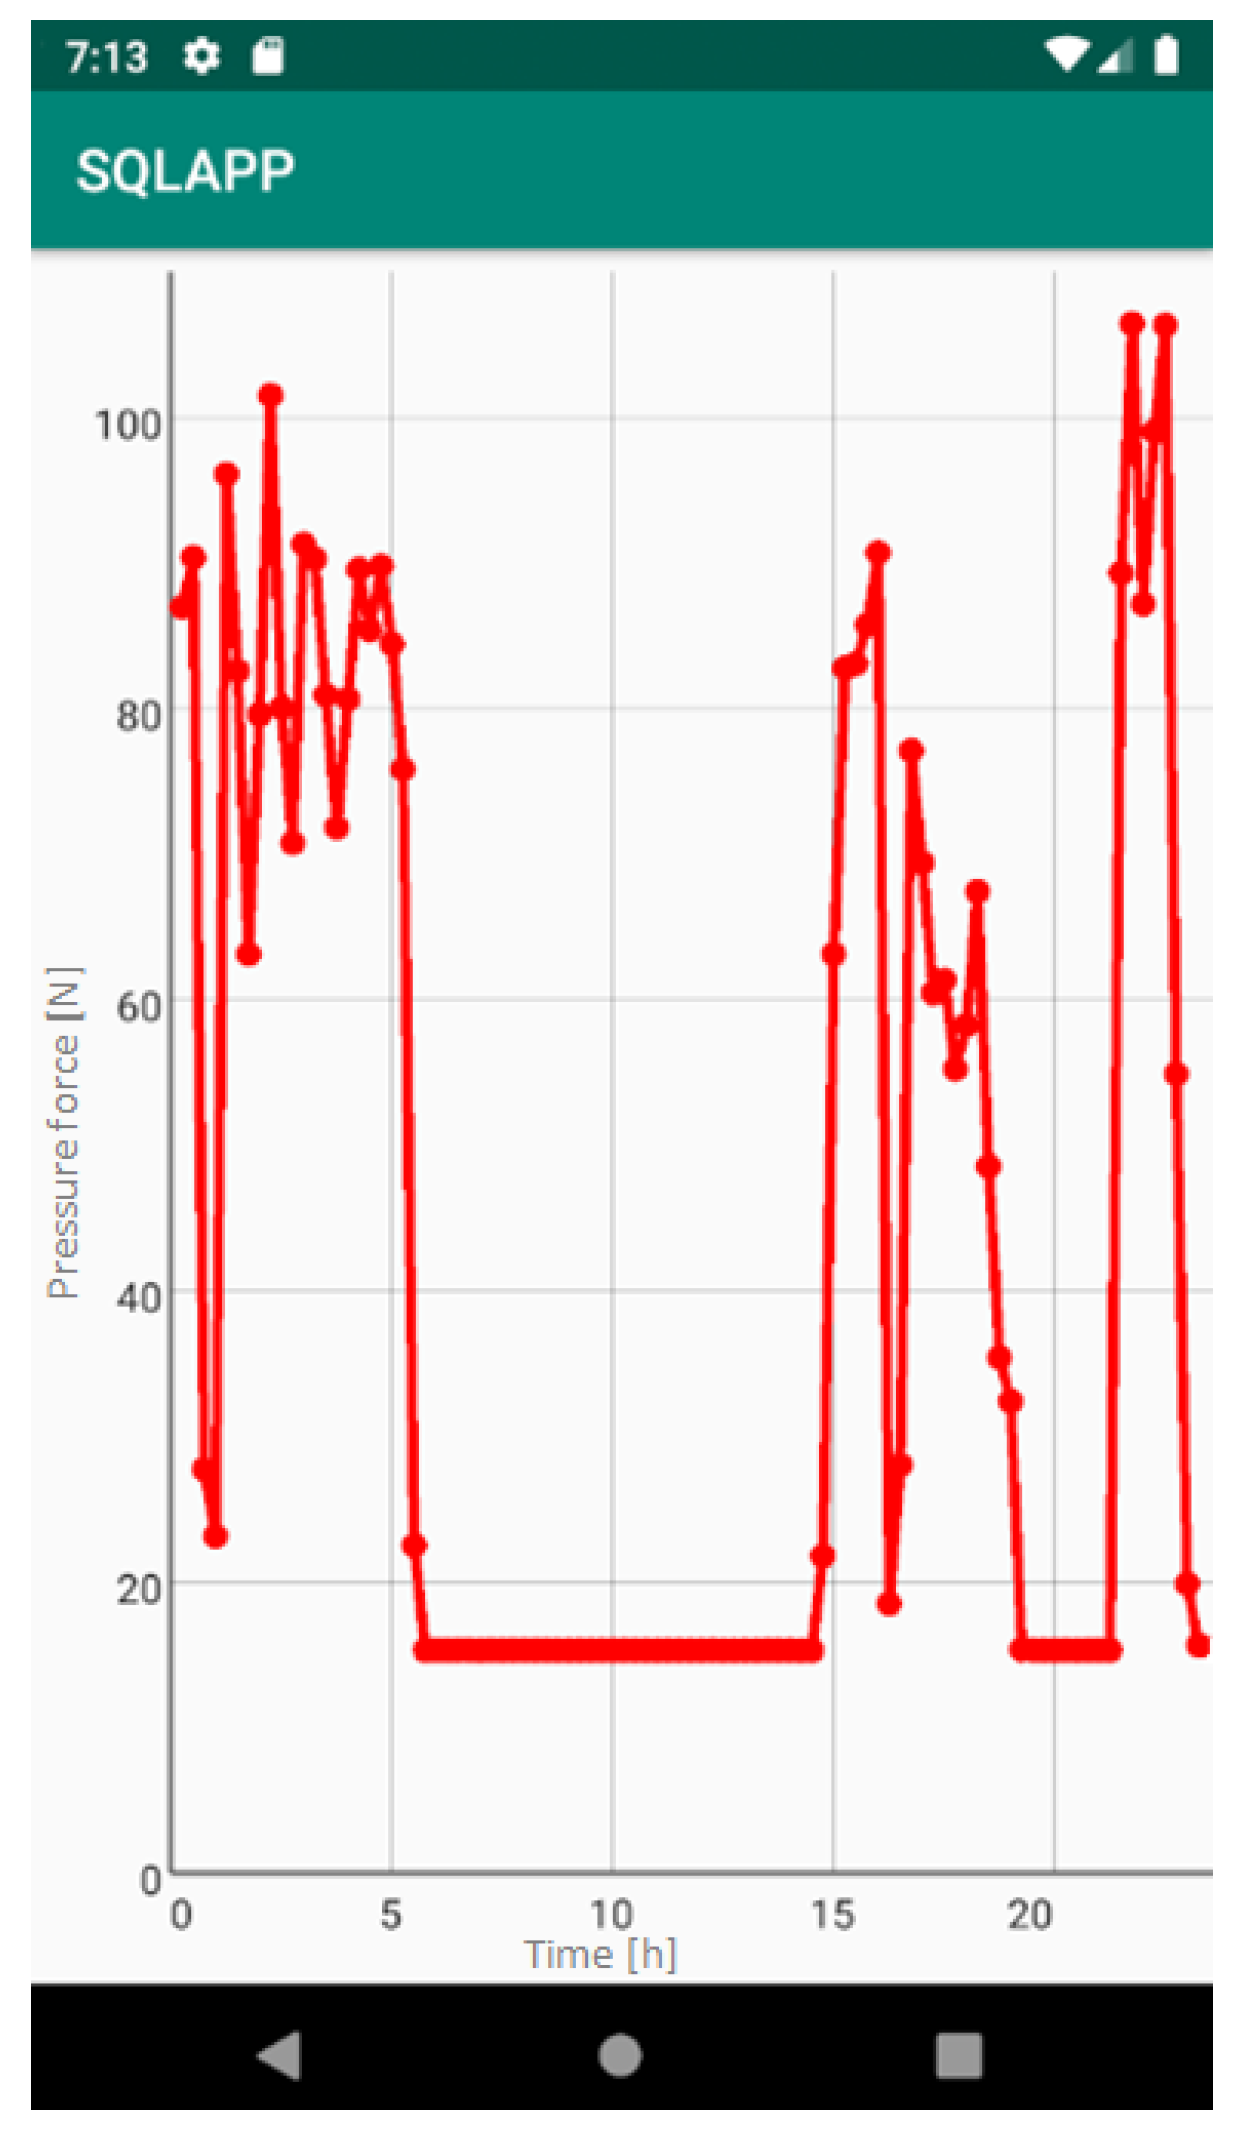
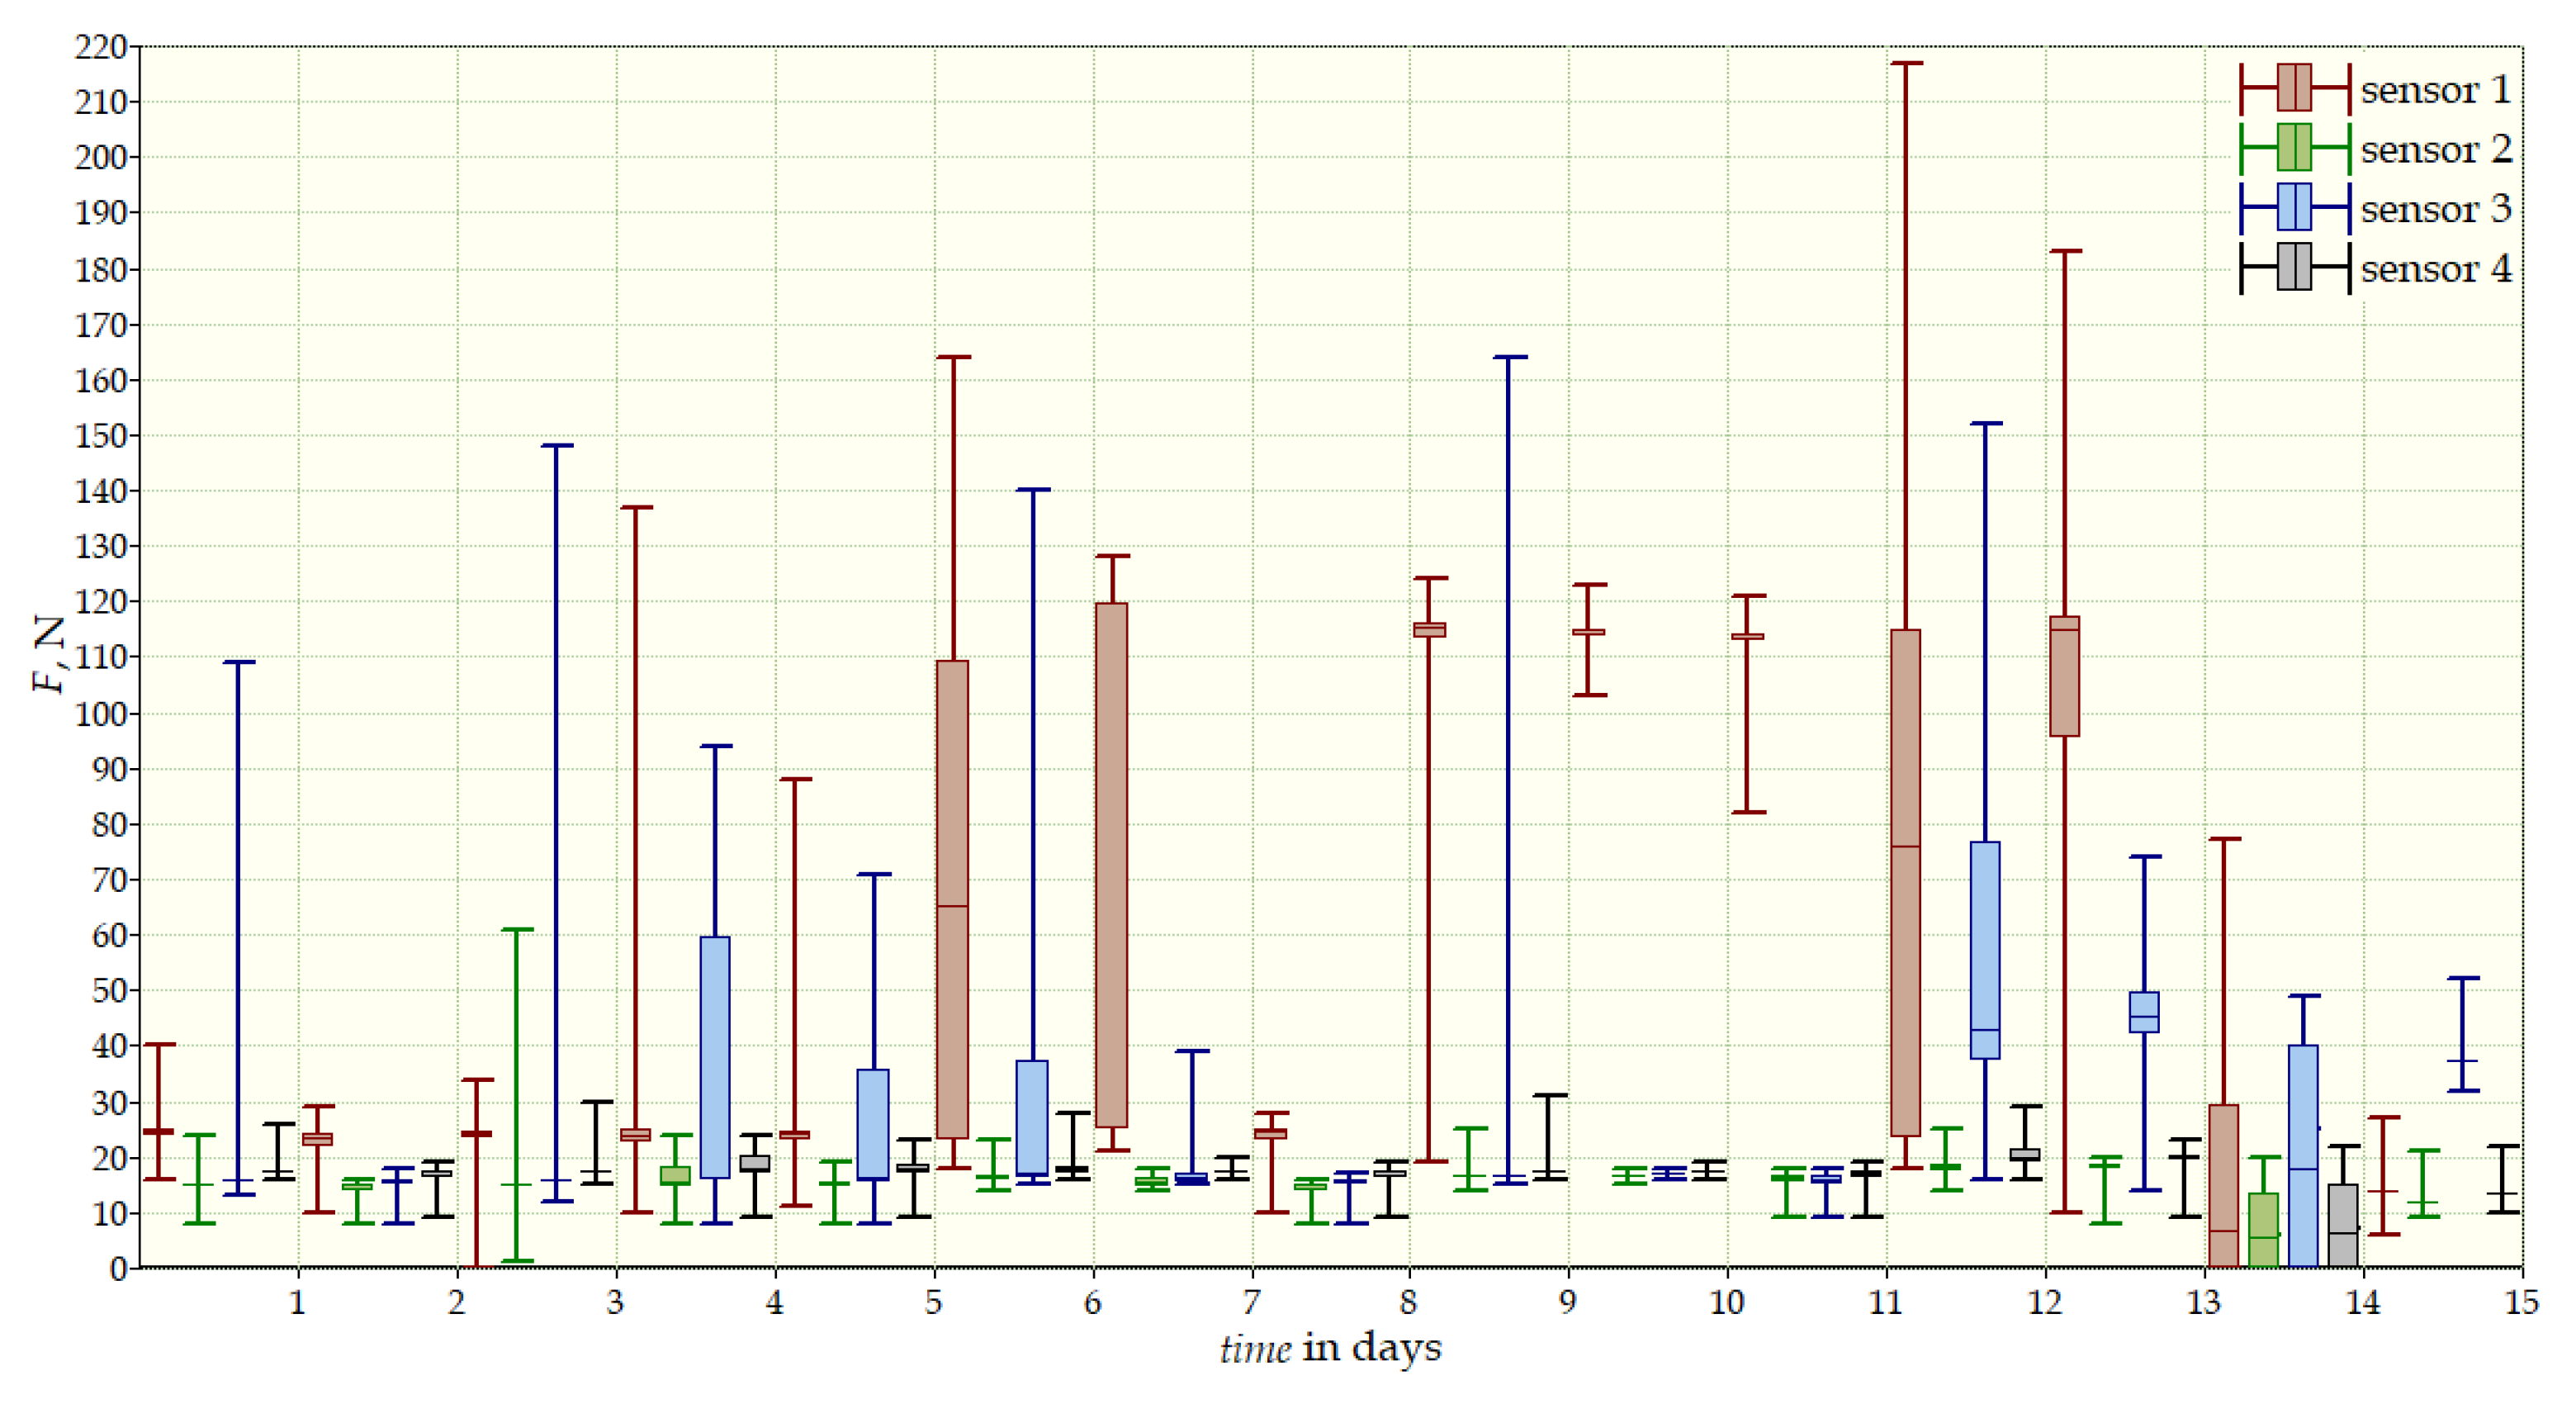
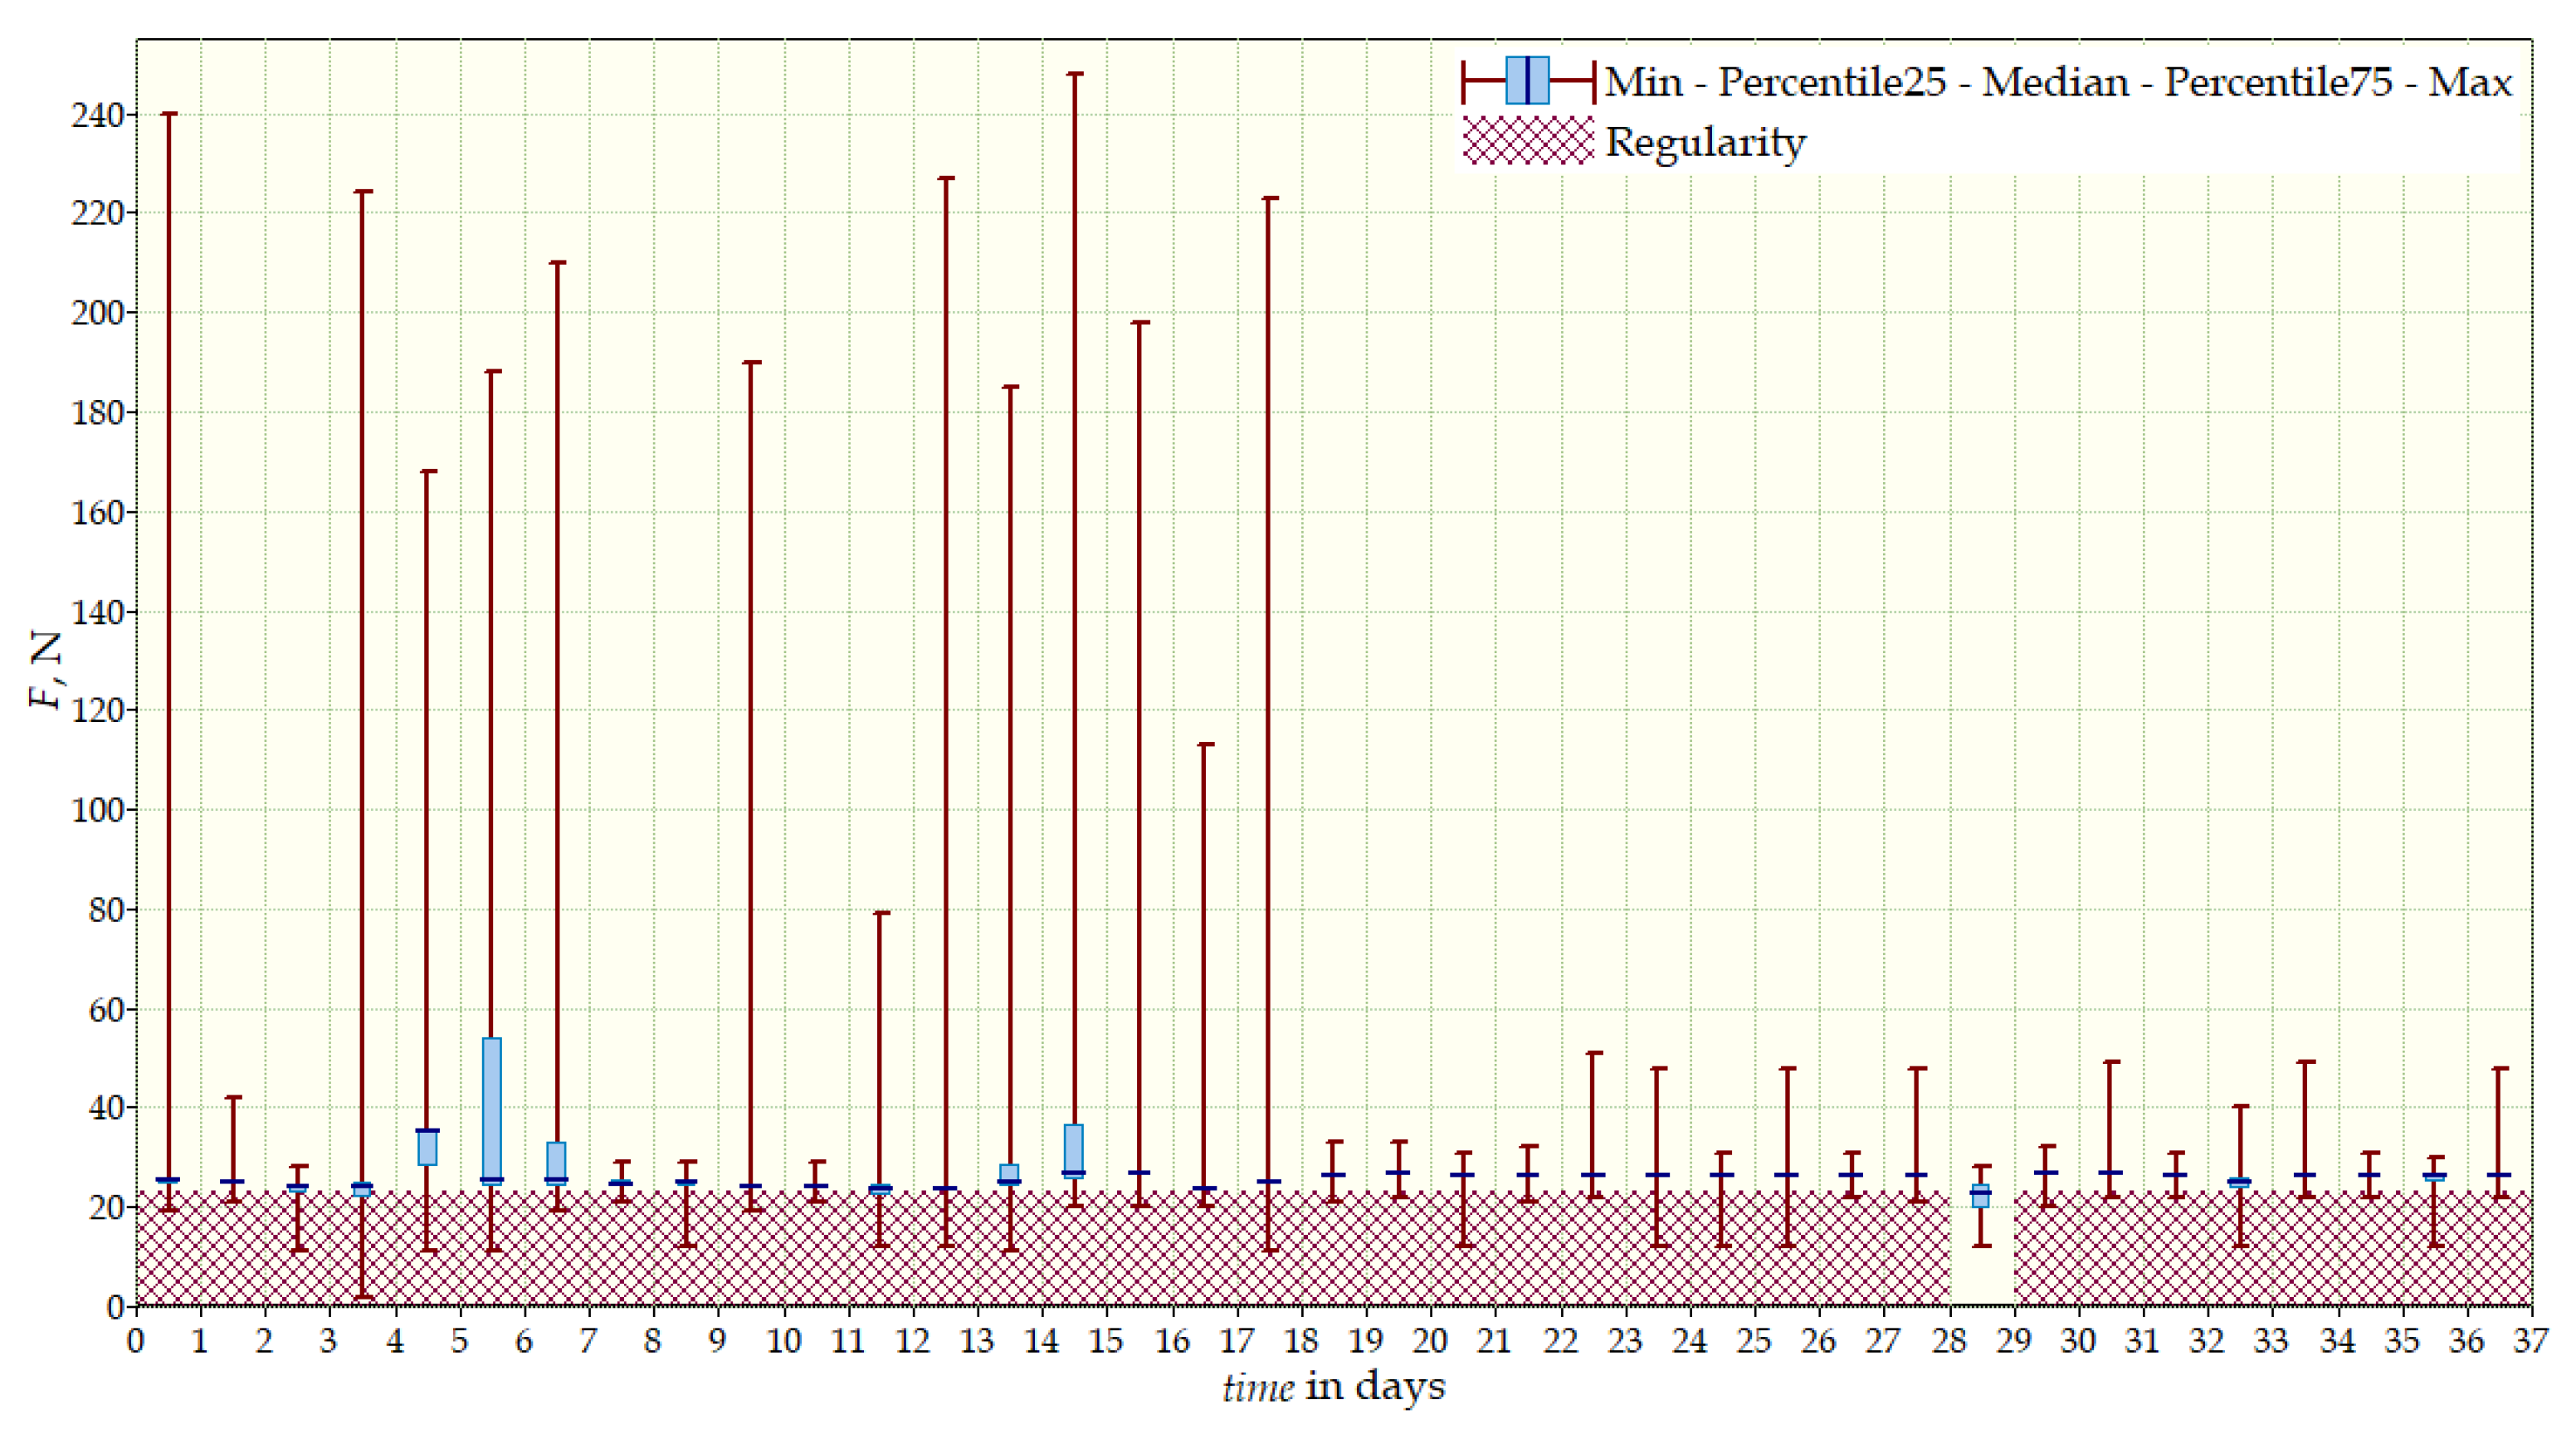
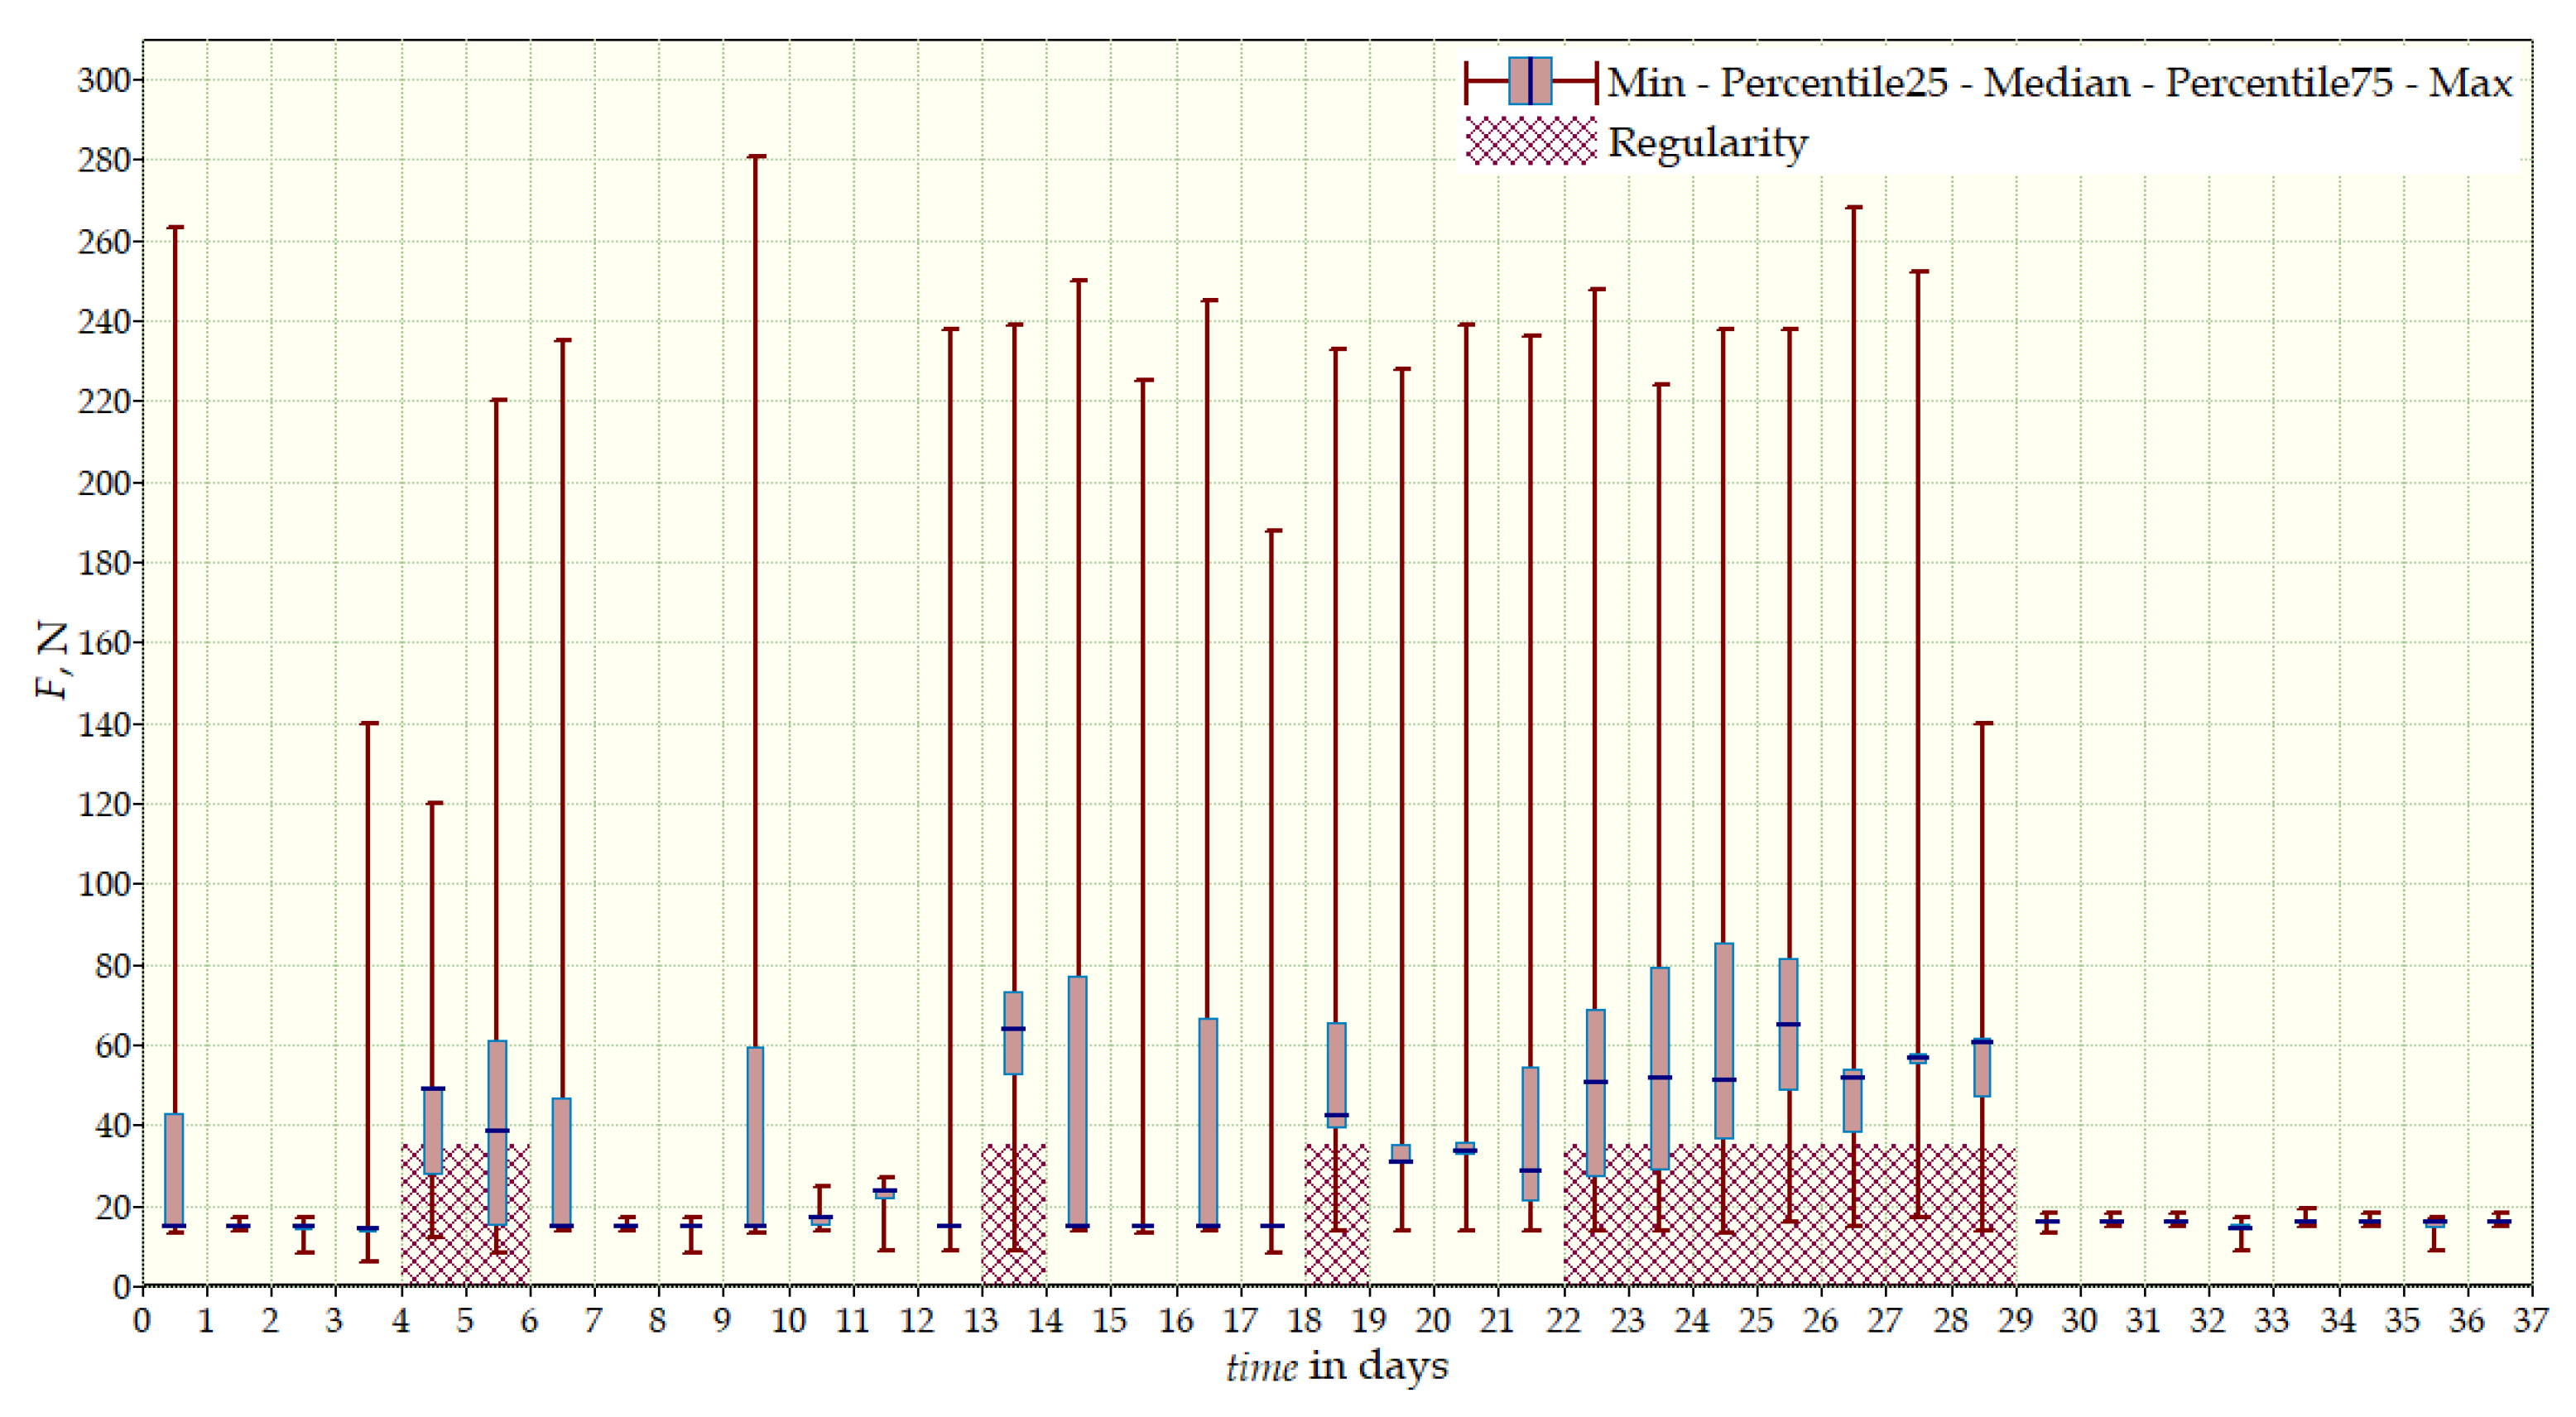
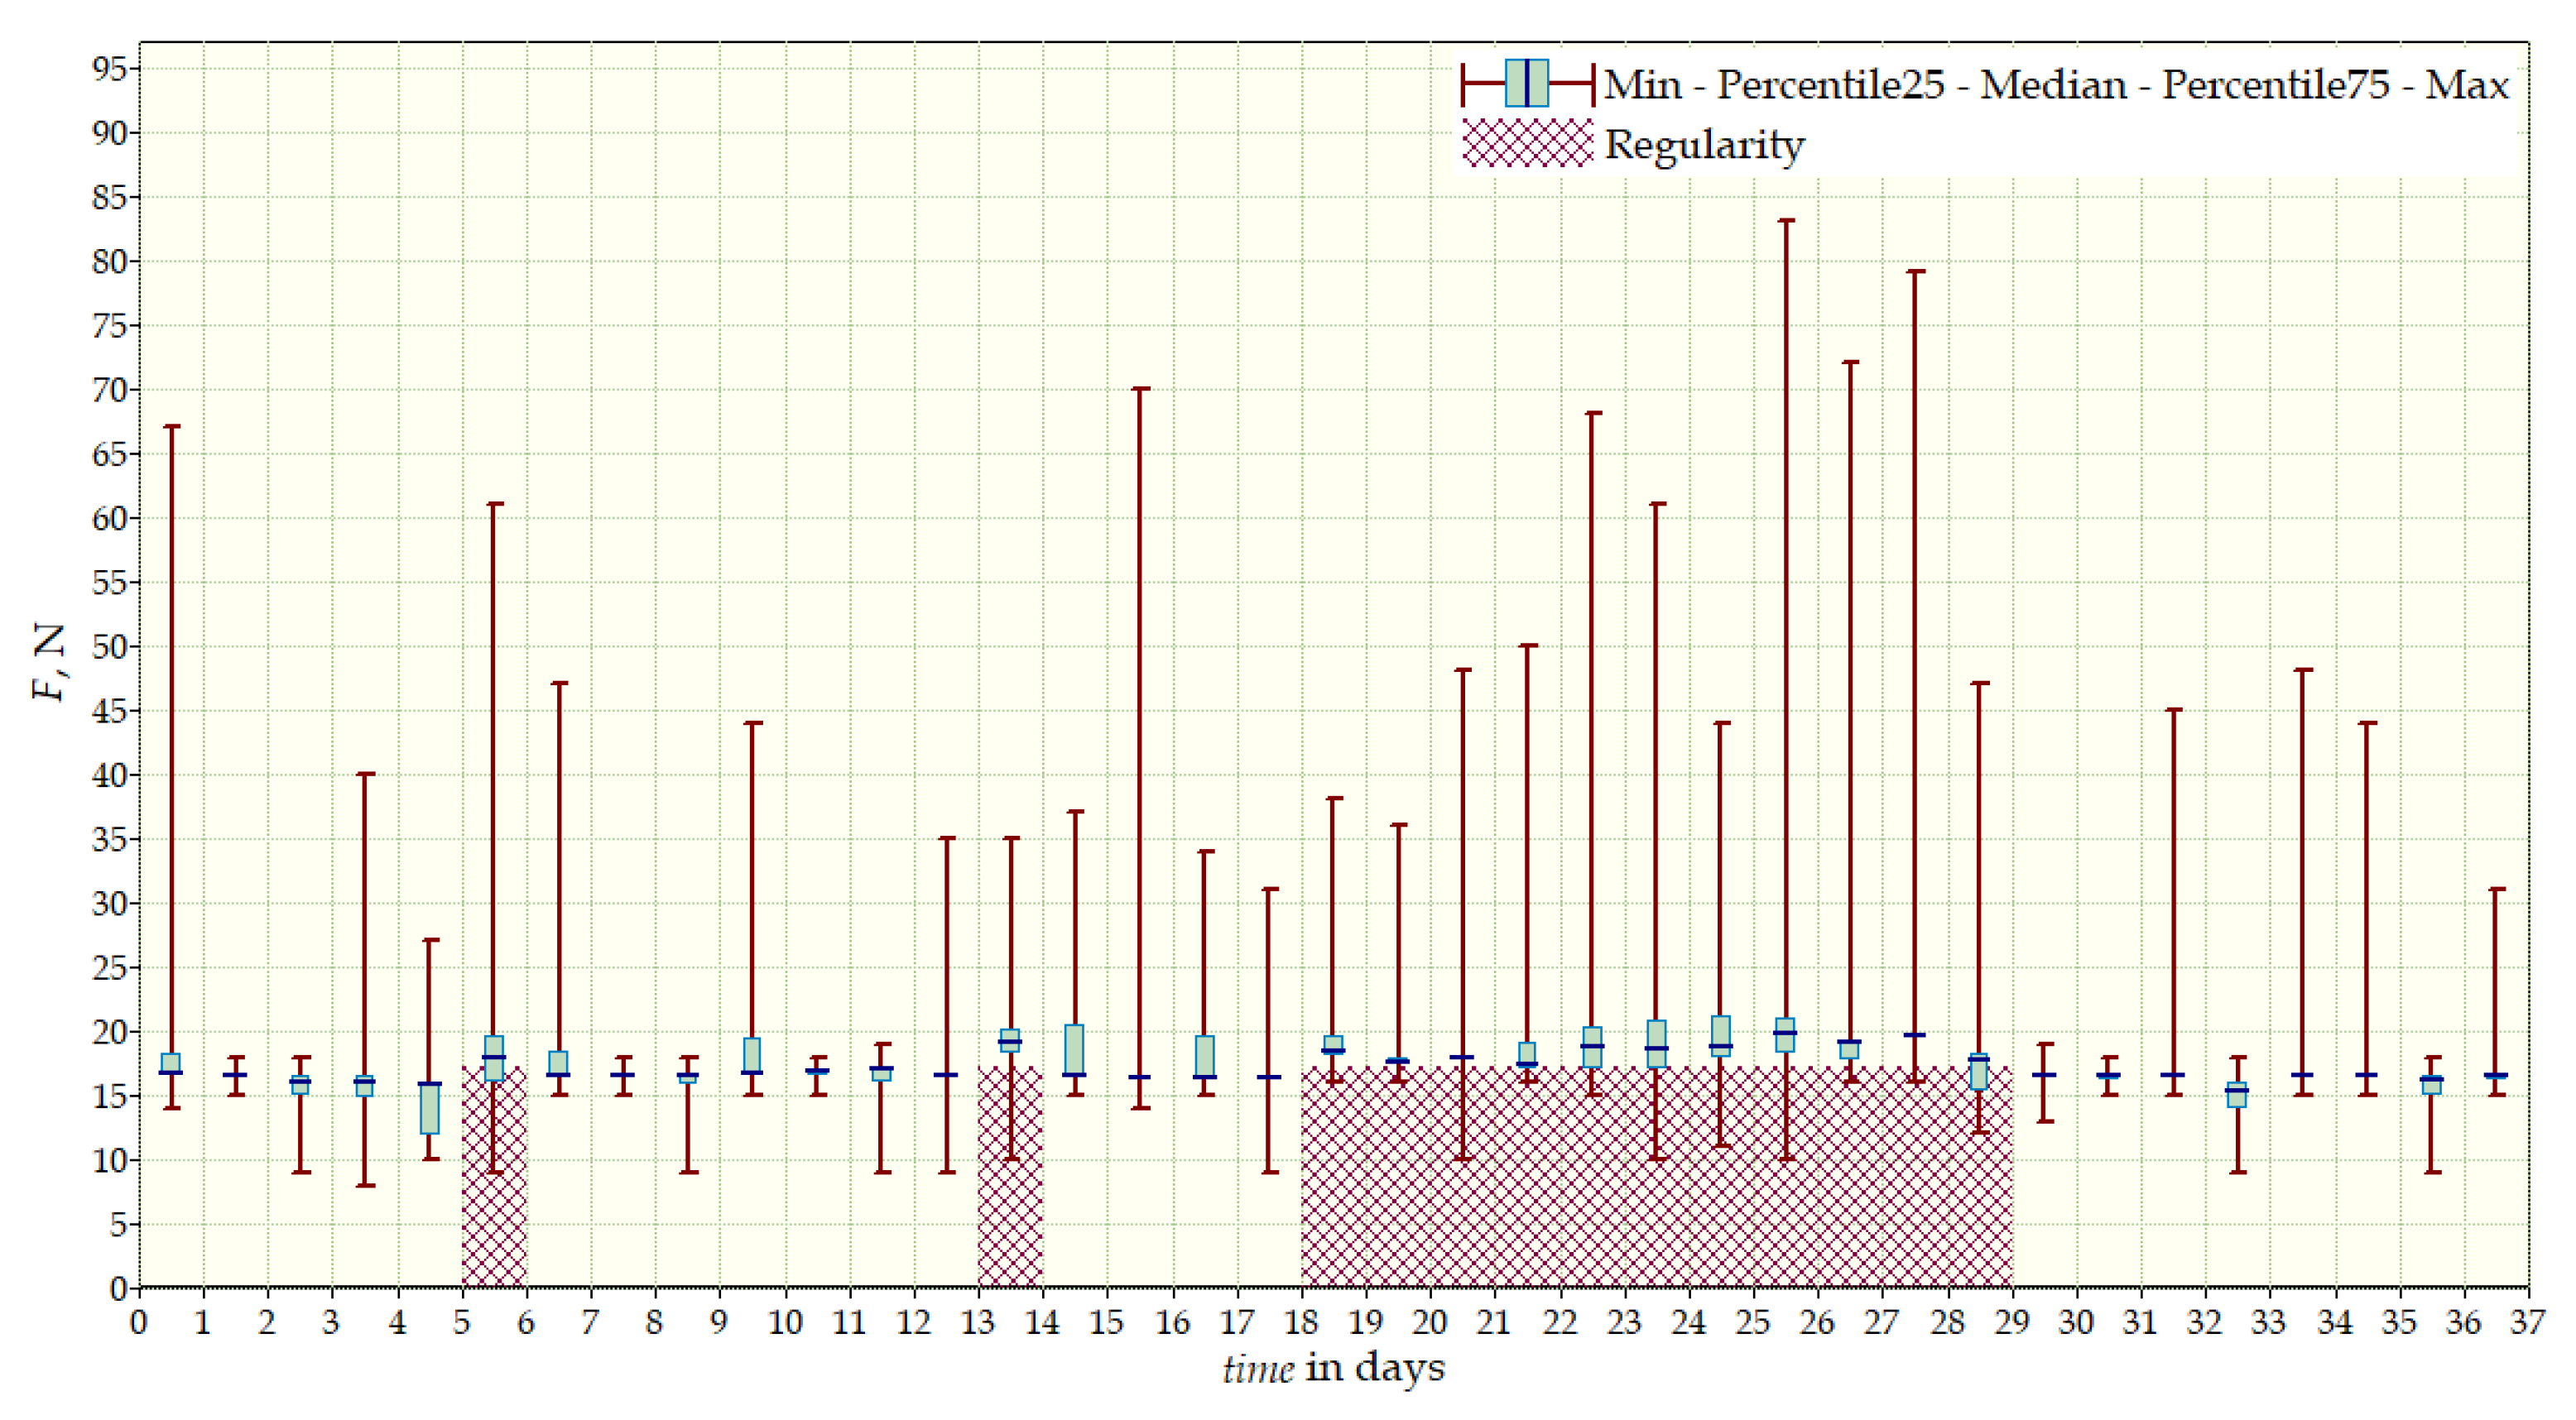
4. Results
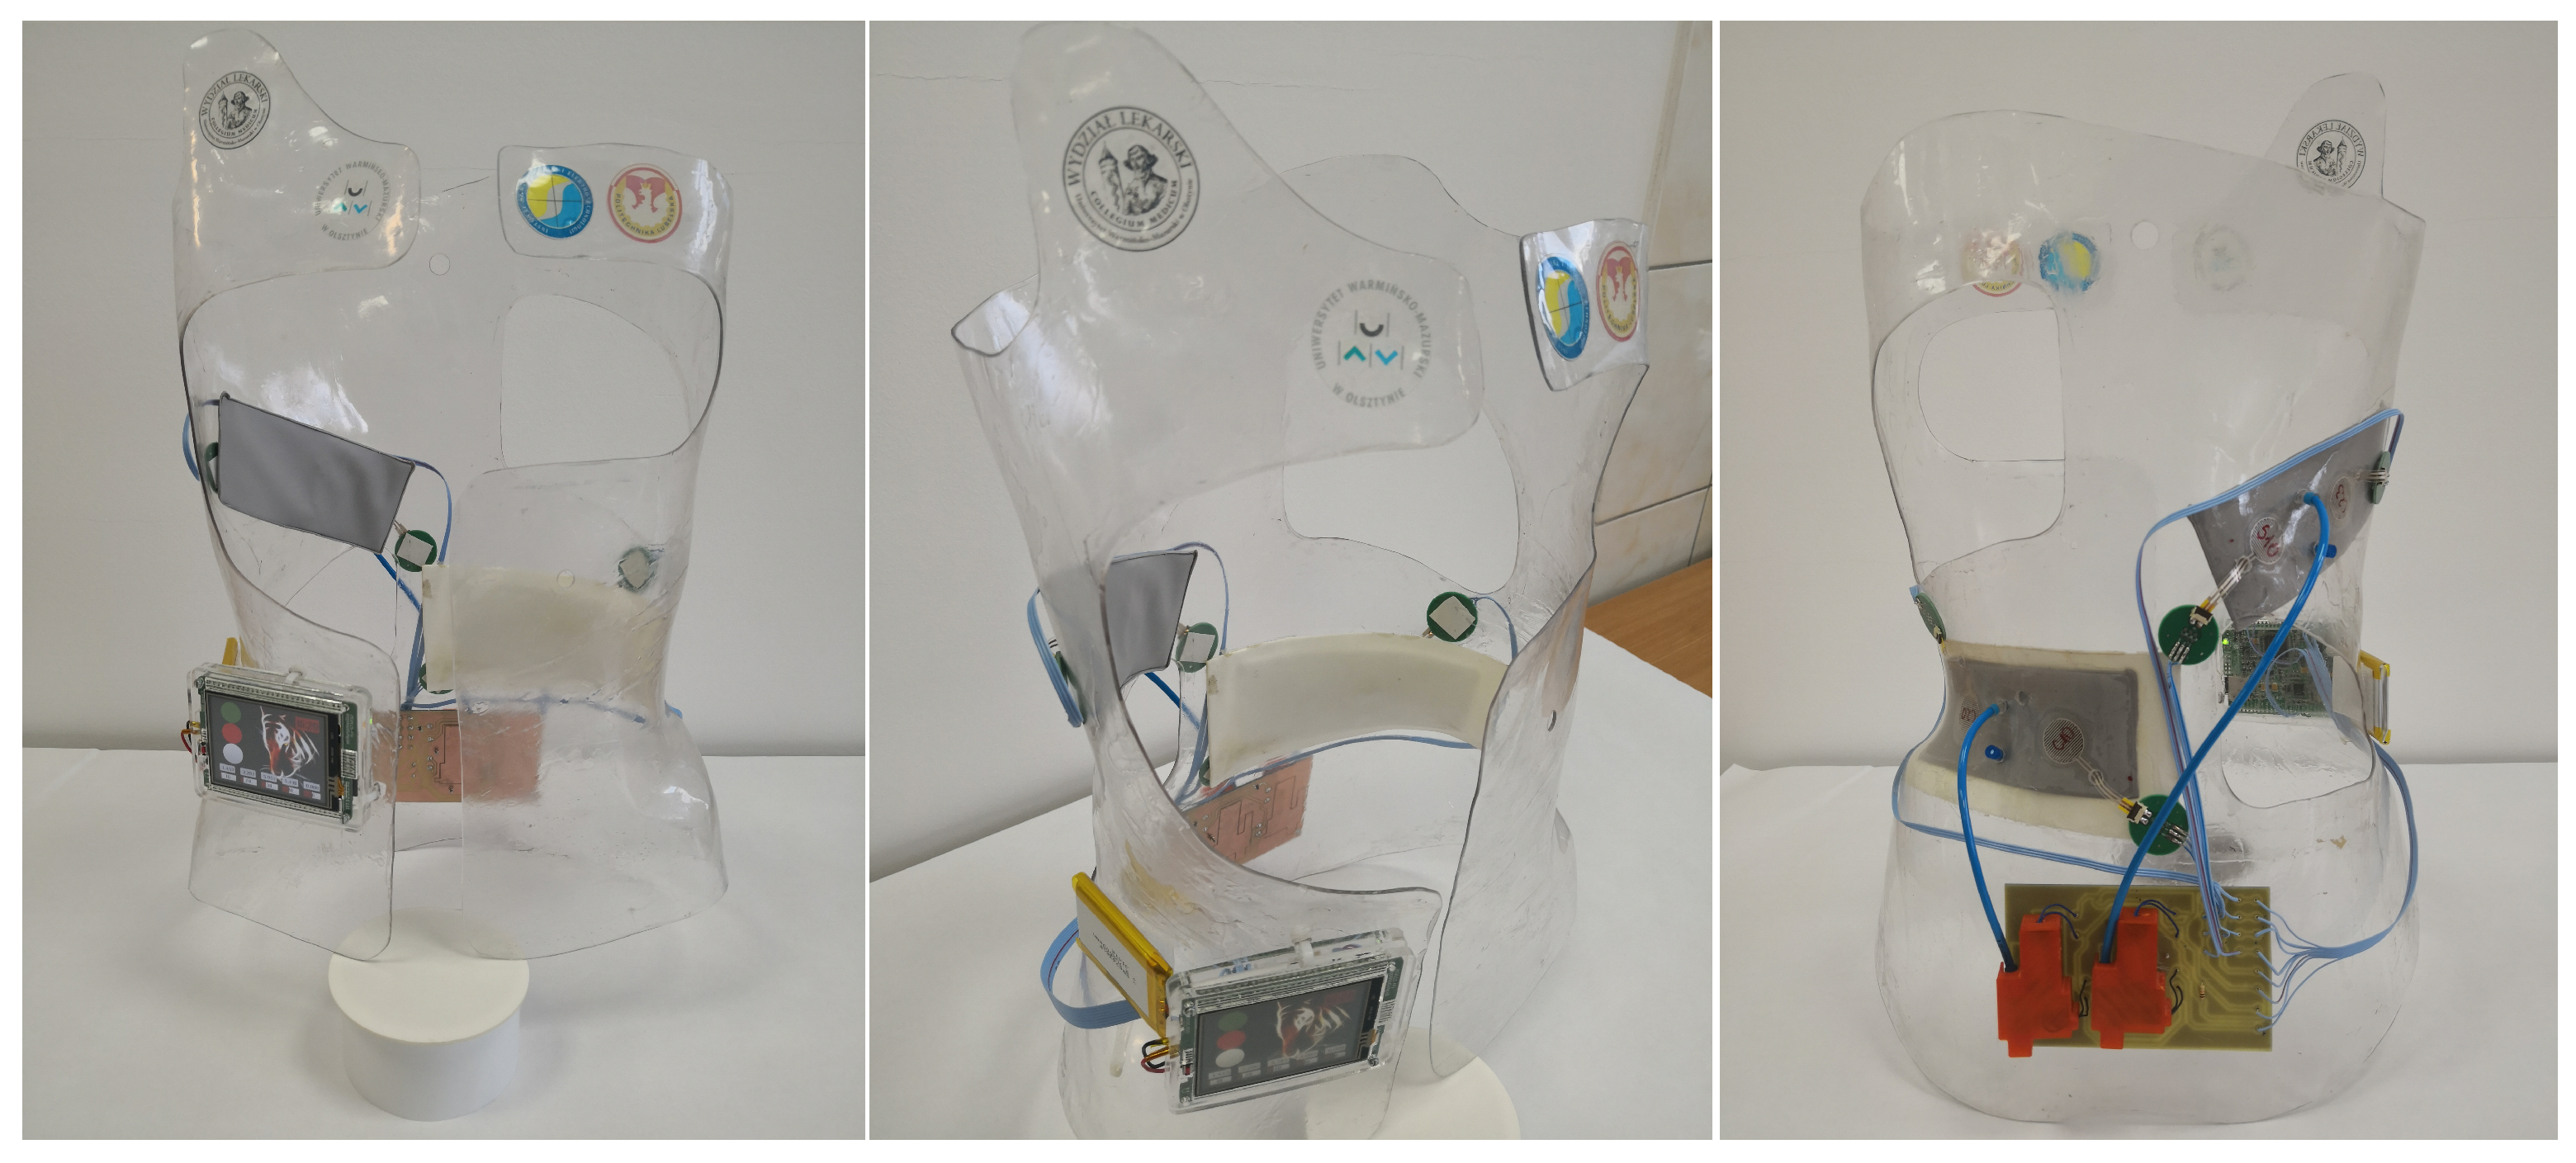
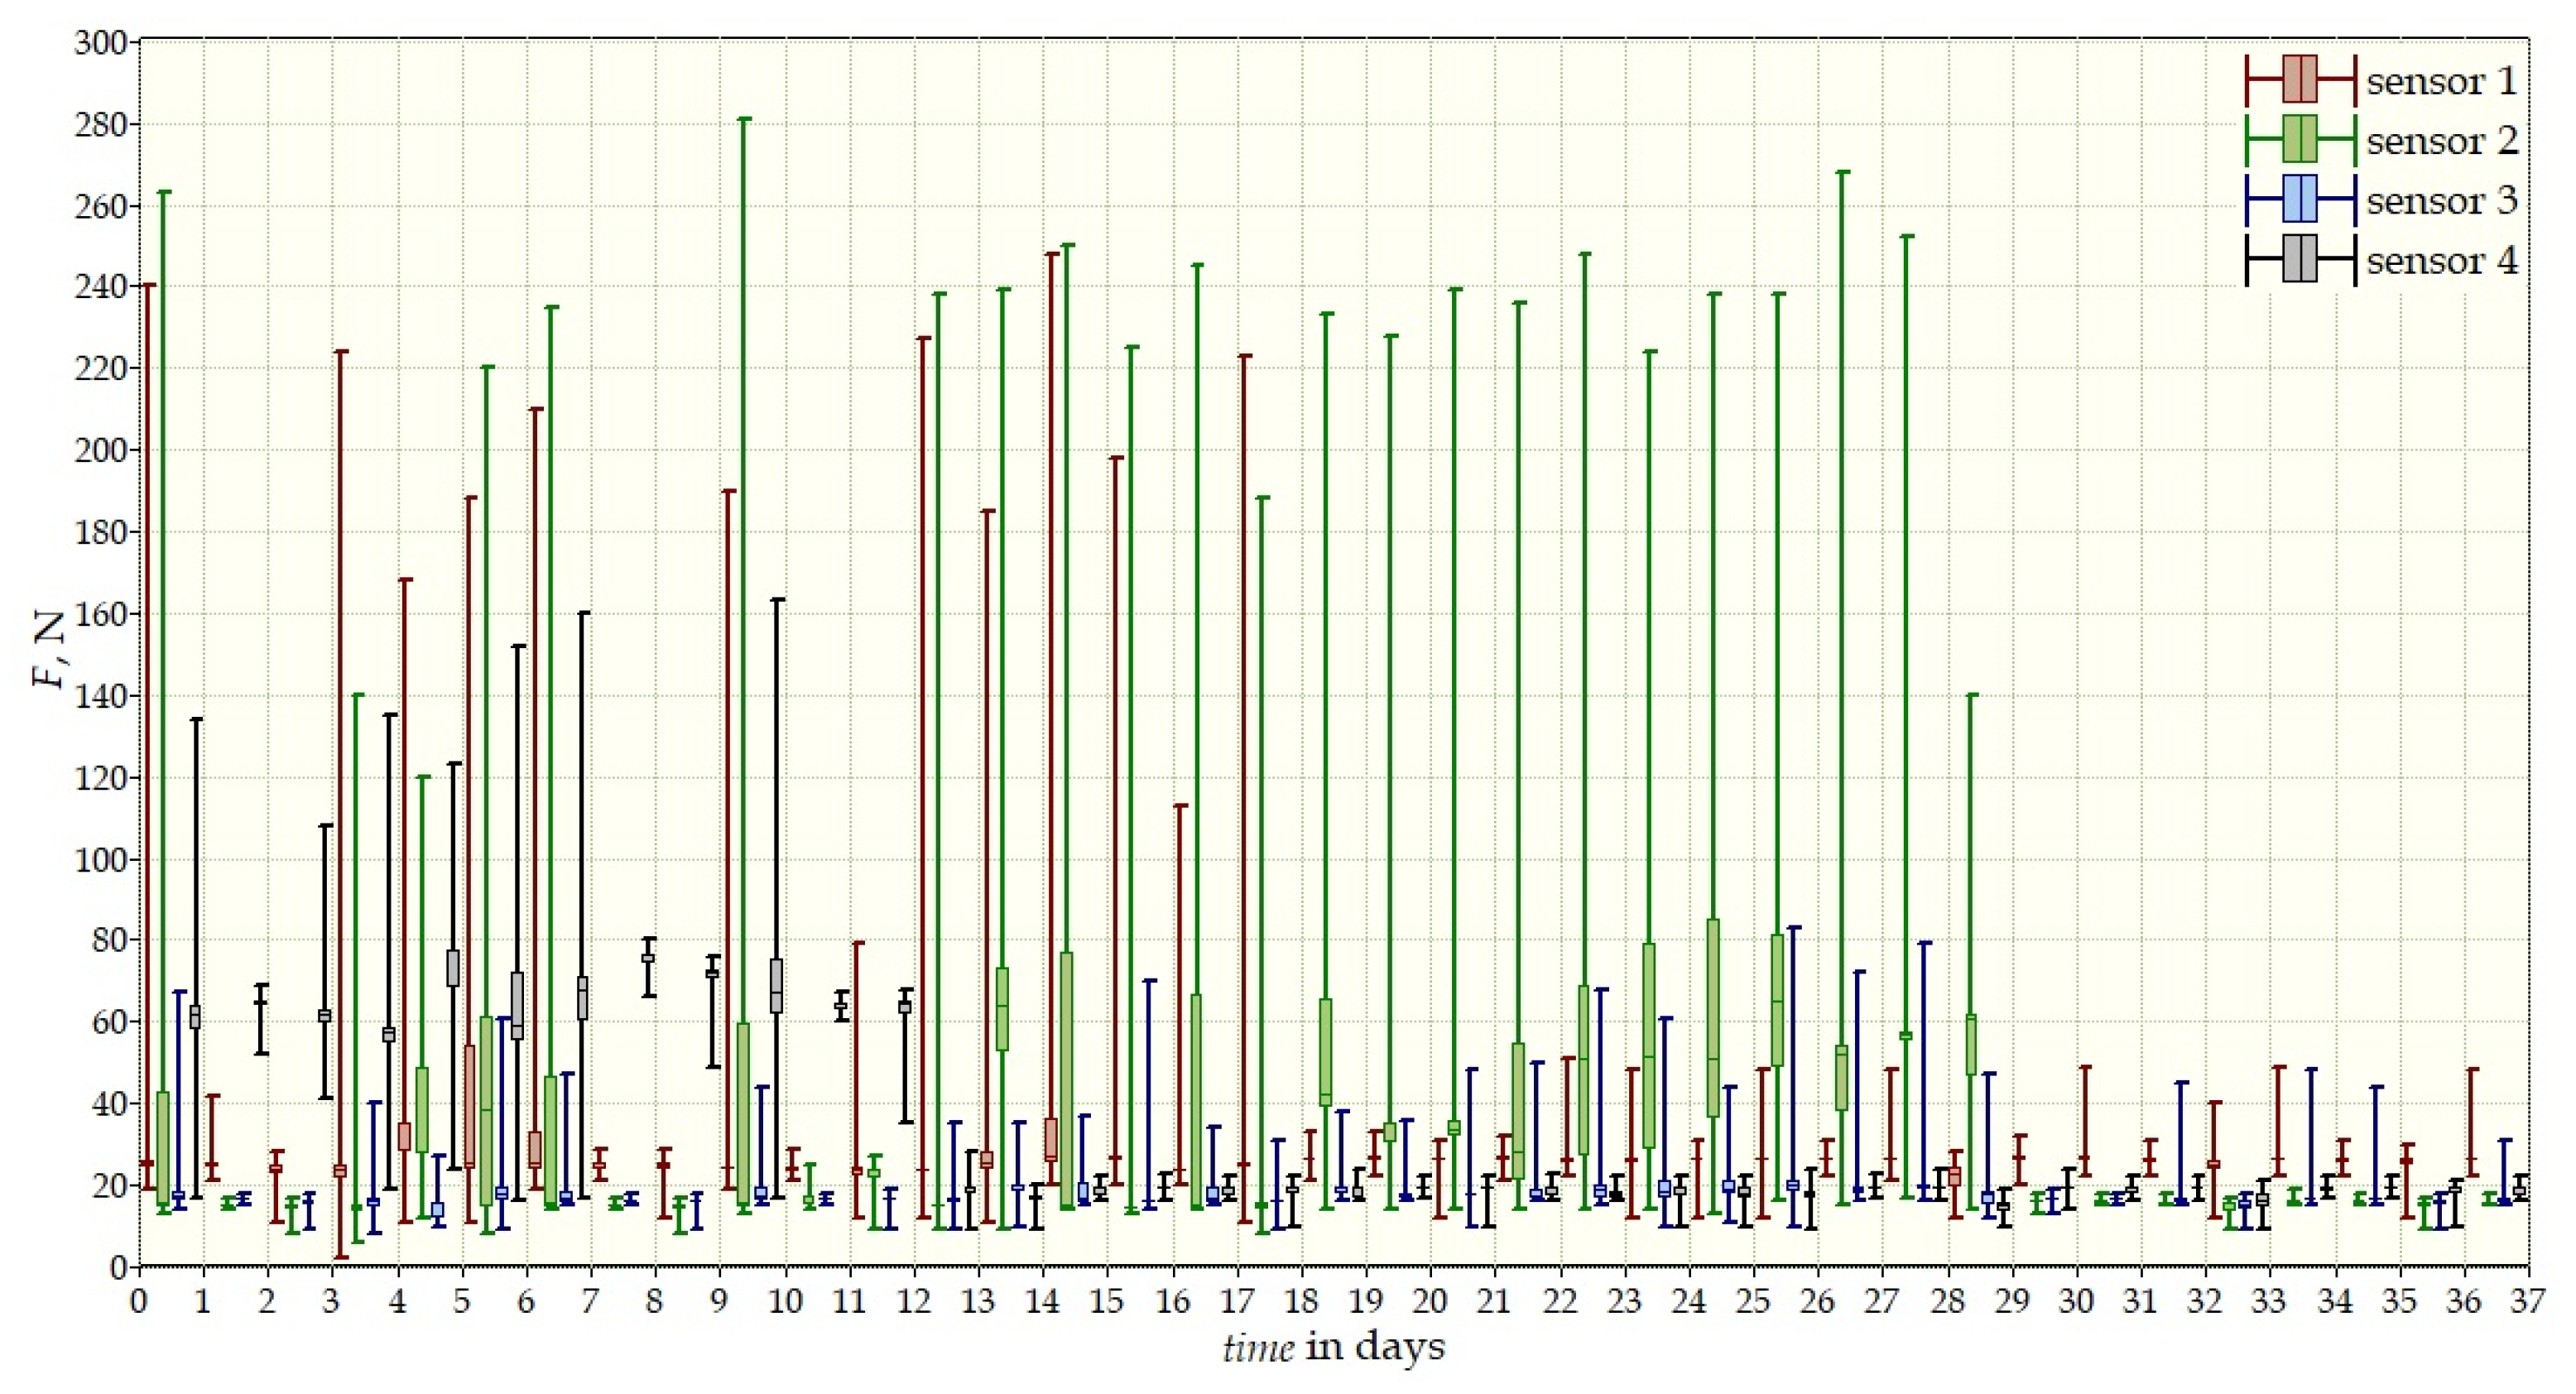
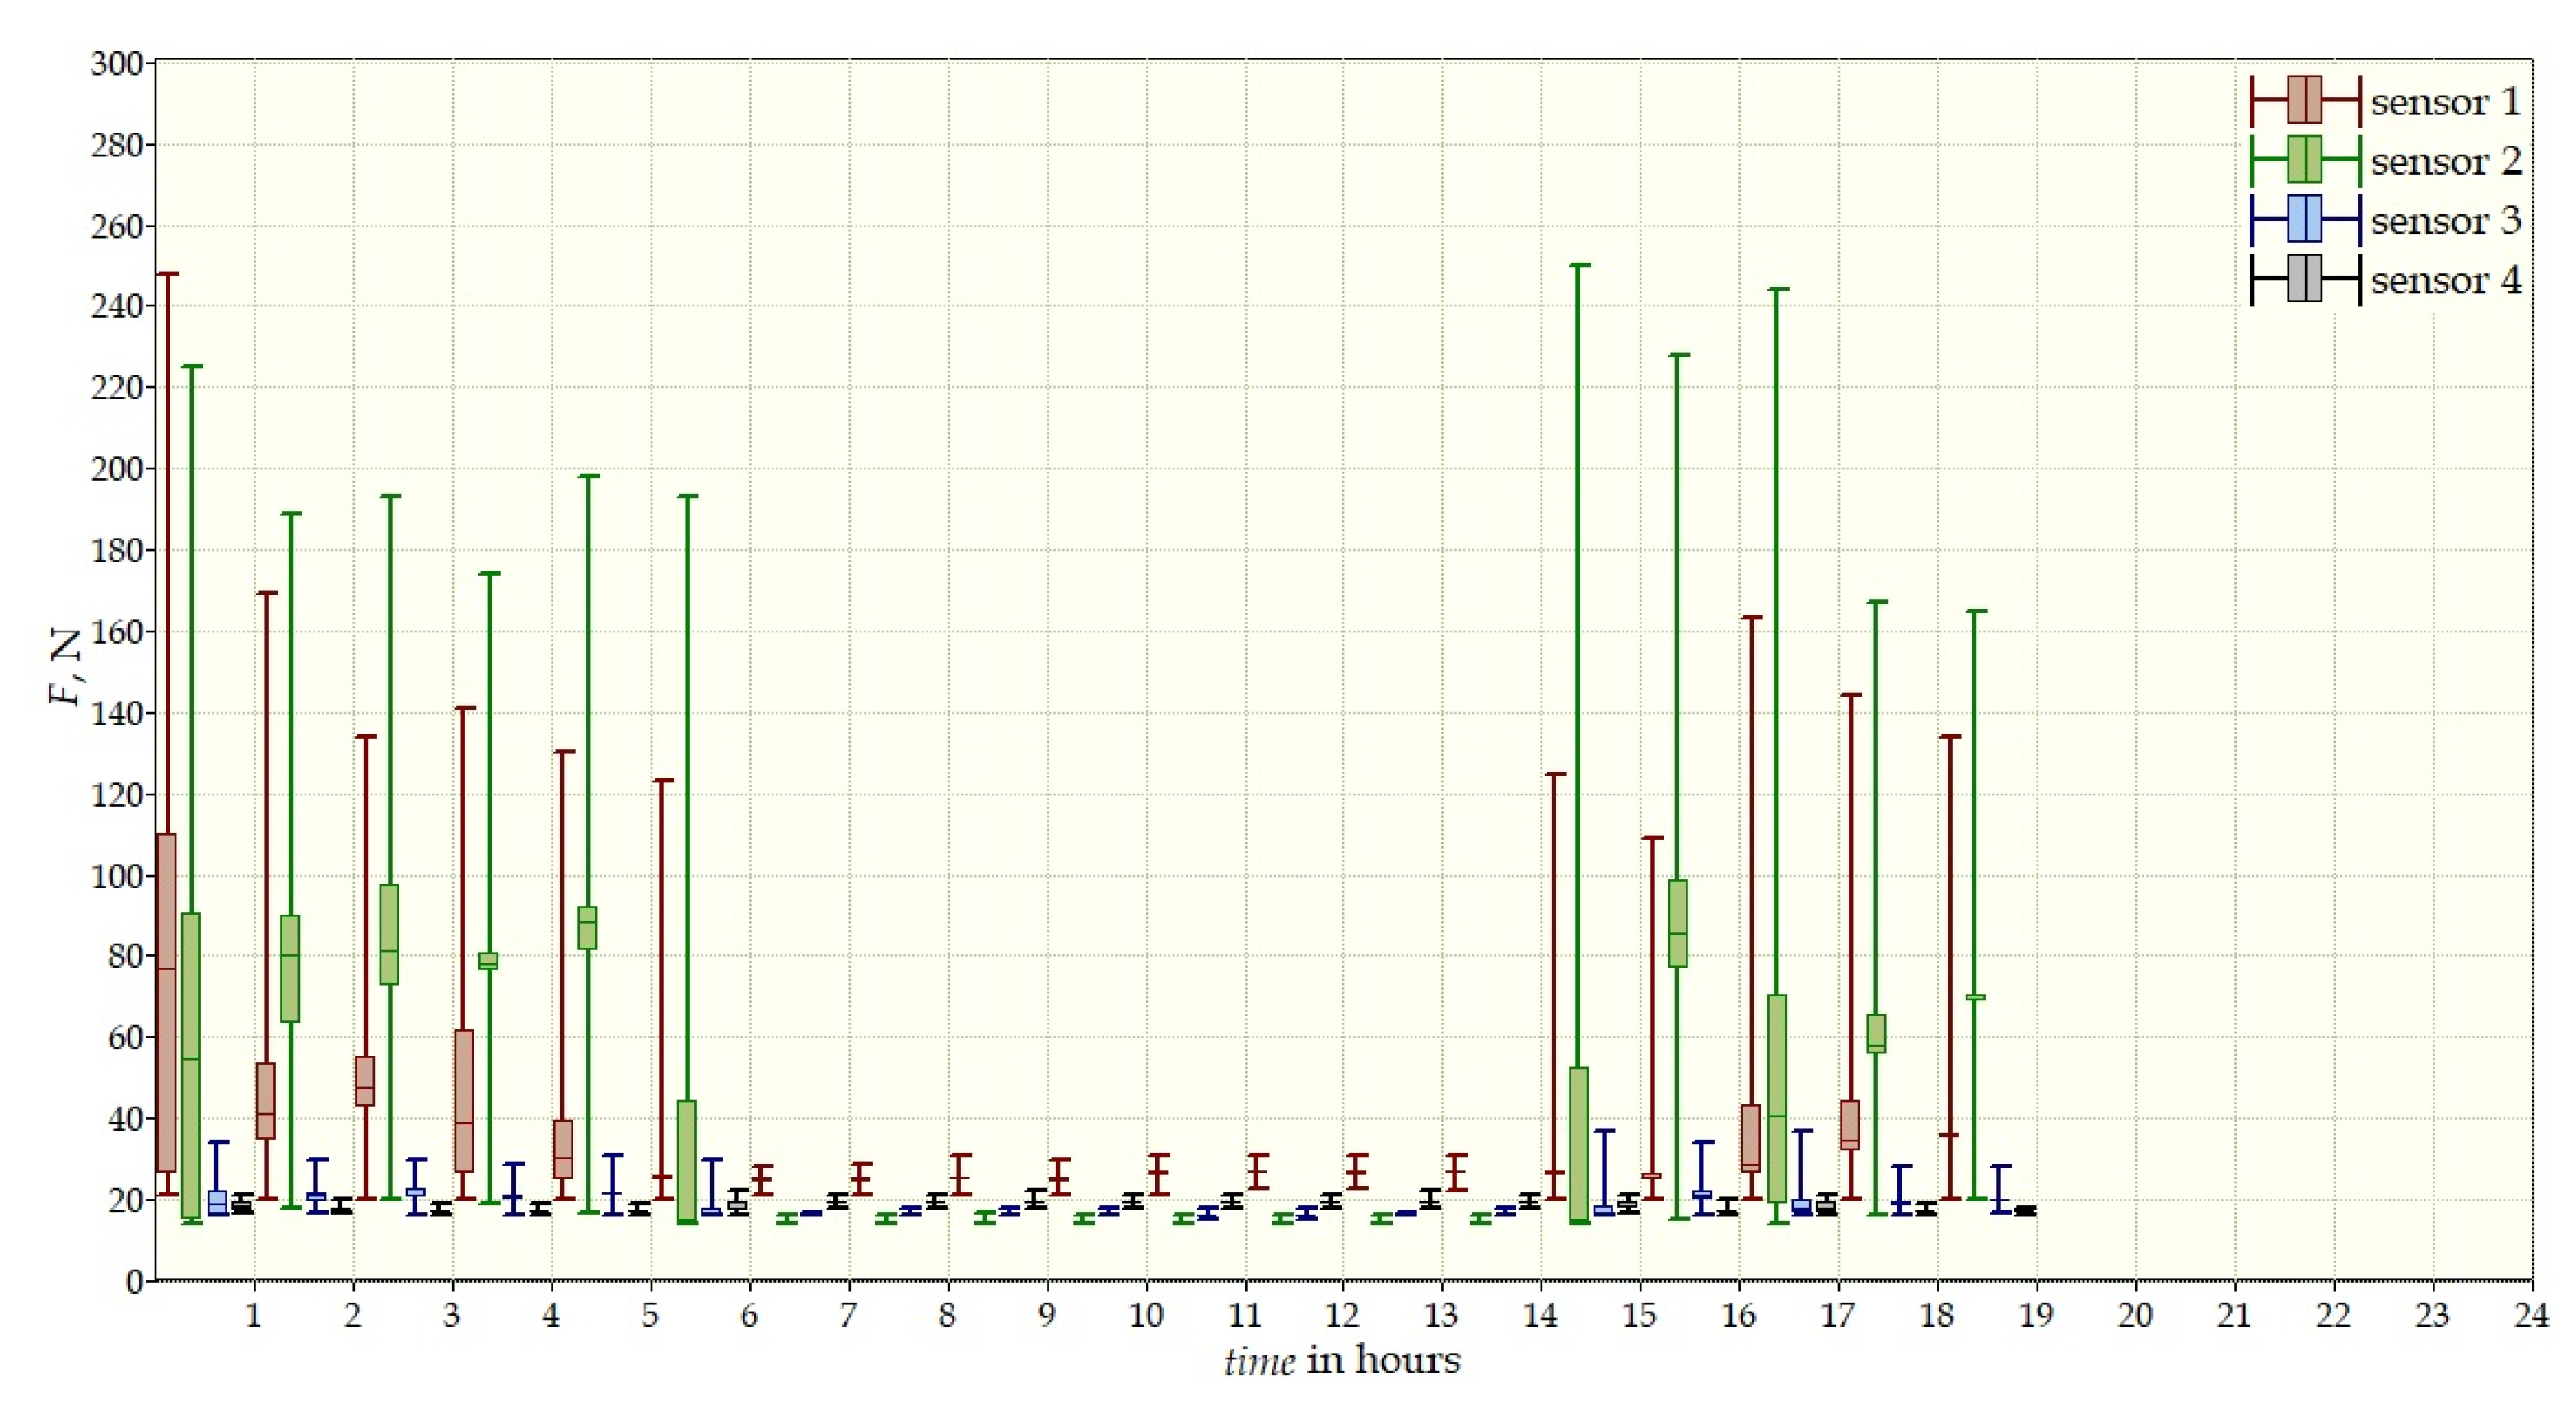
- Sensor 1—on the chest, left side;
- Sensor 2—below the right shoulder blade, close to the spine;
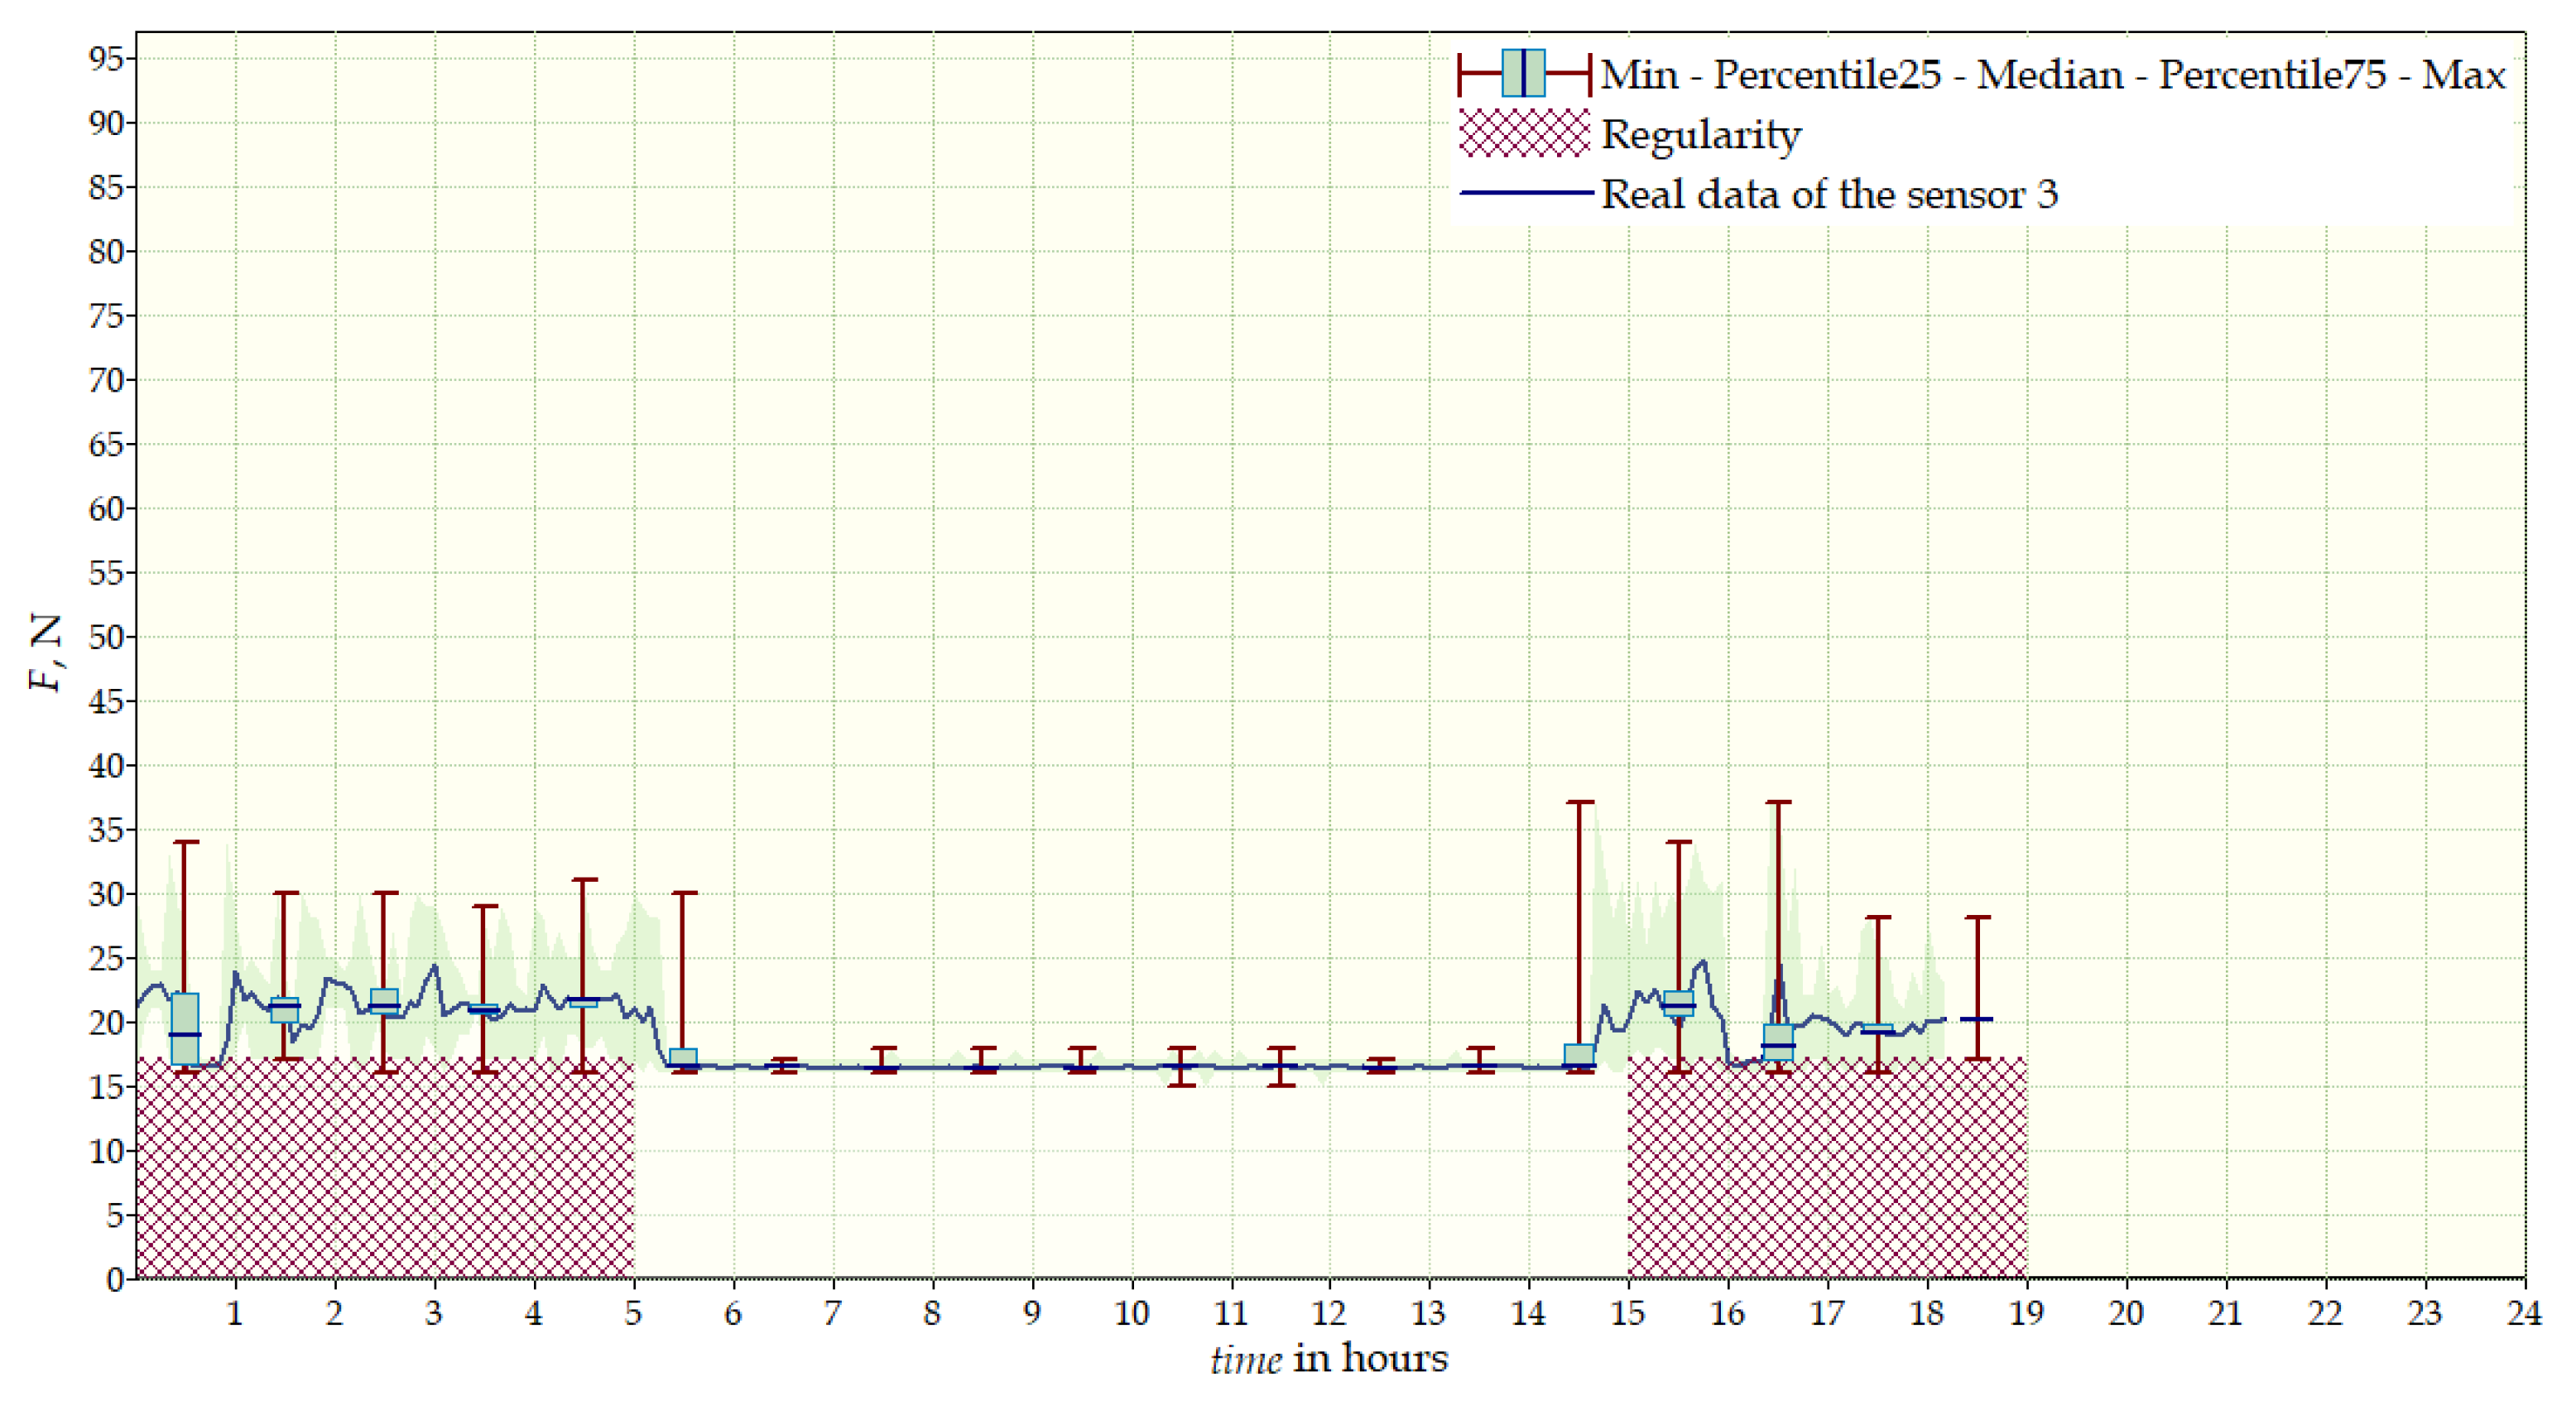
- Sensor 3—below the right shoulder blade, to the right of sensor 2;
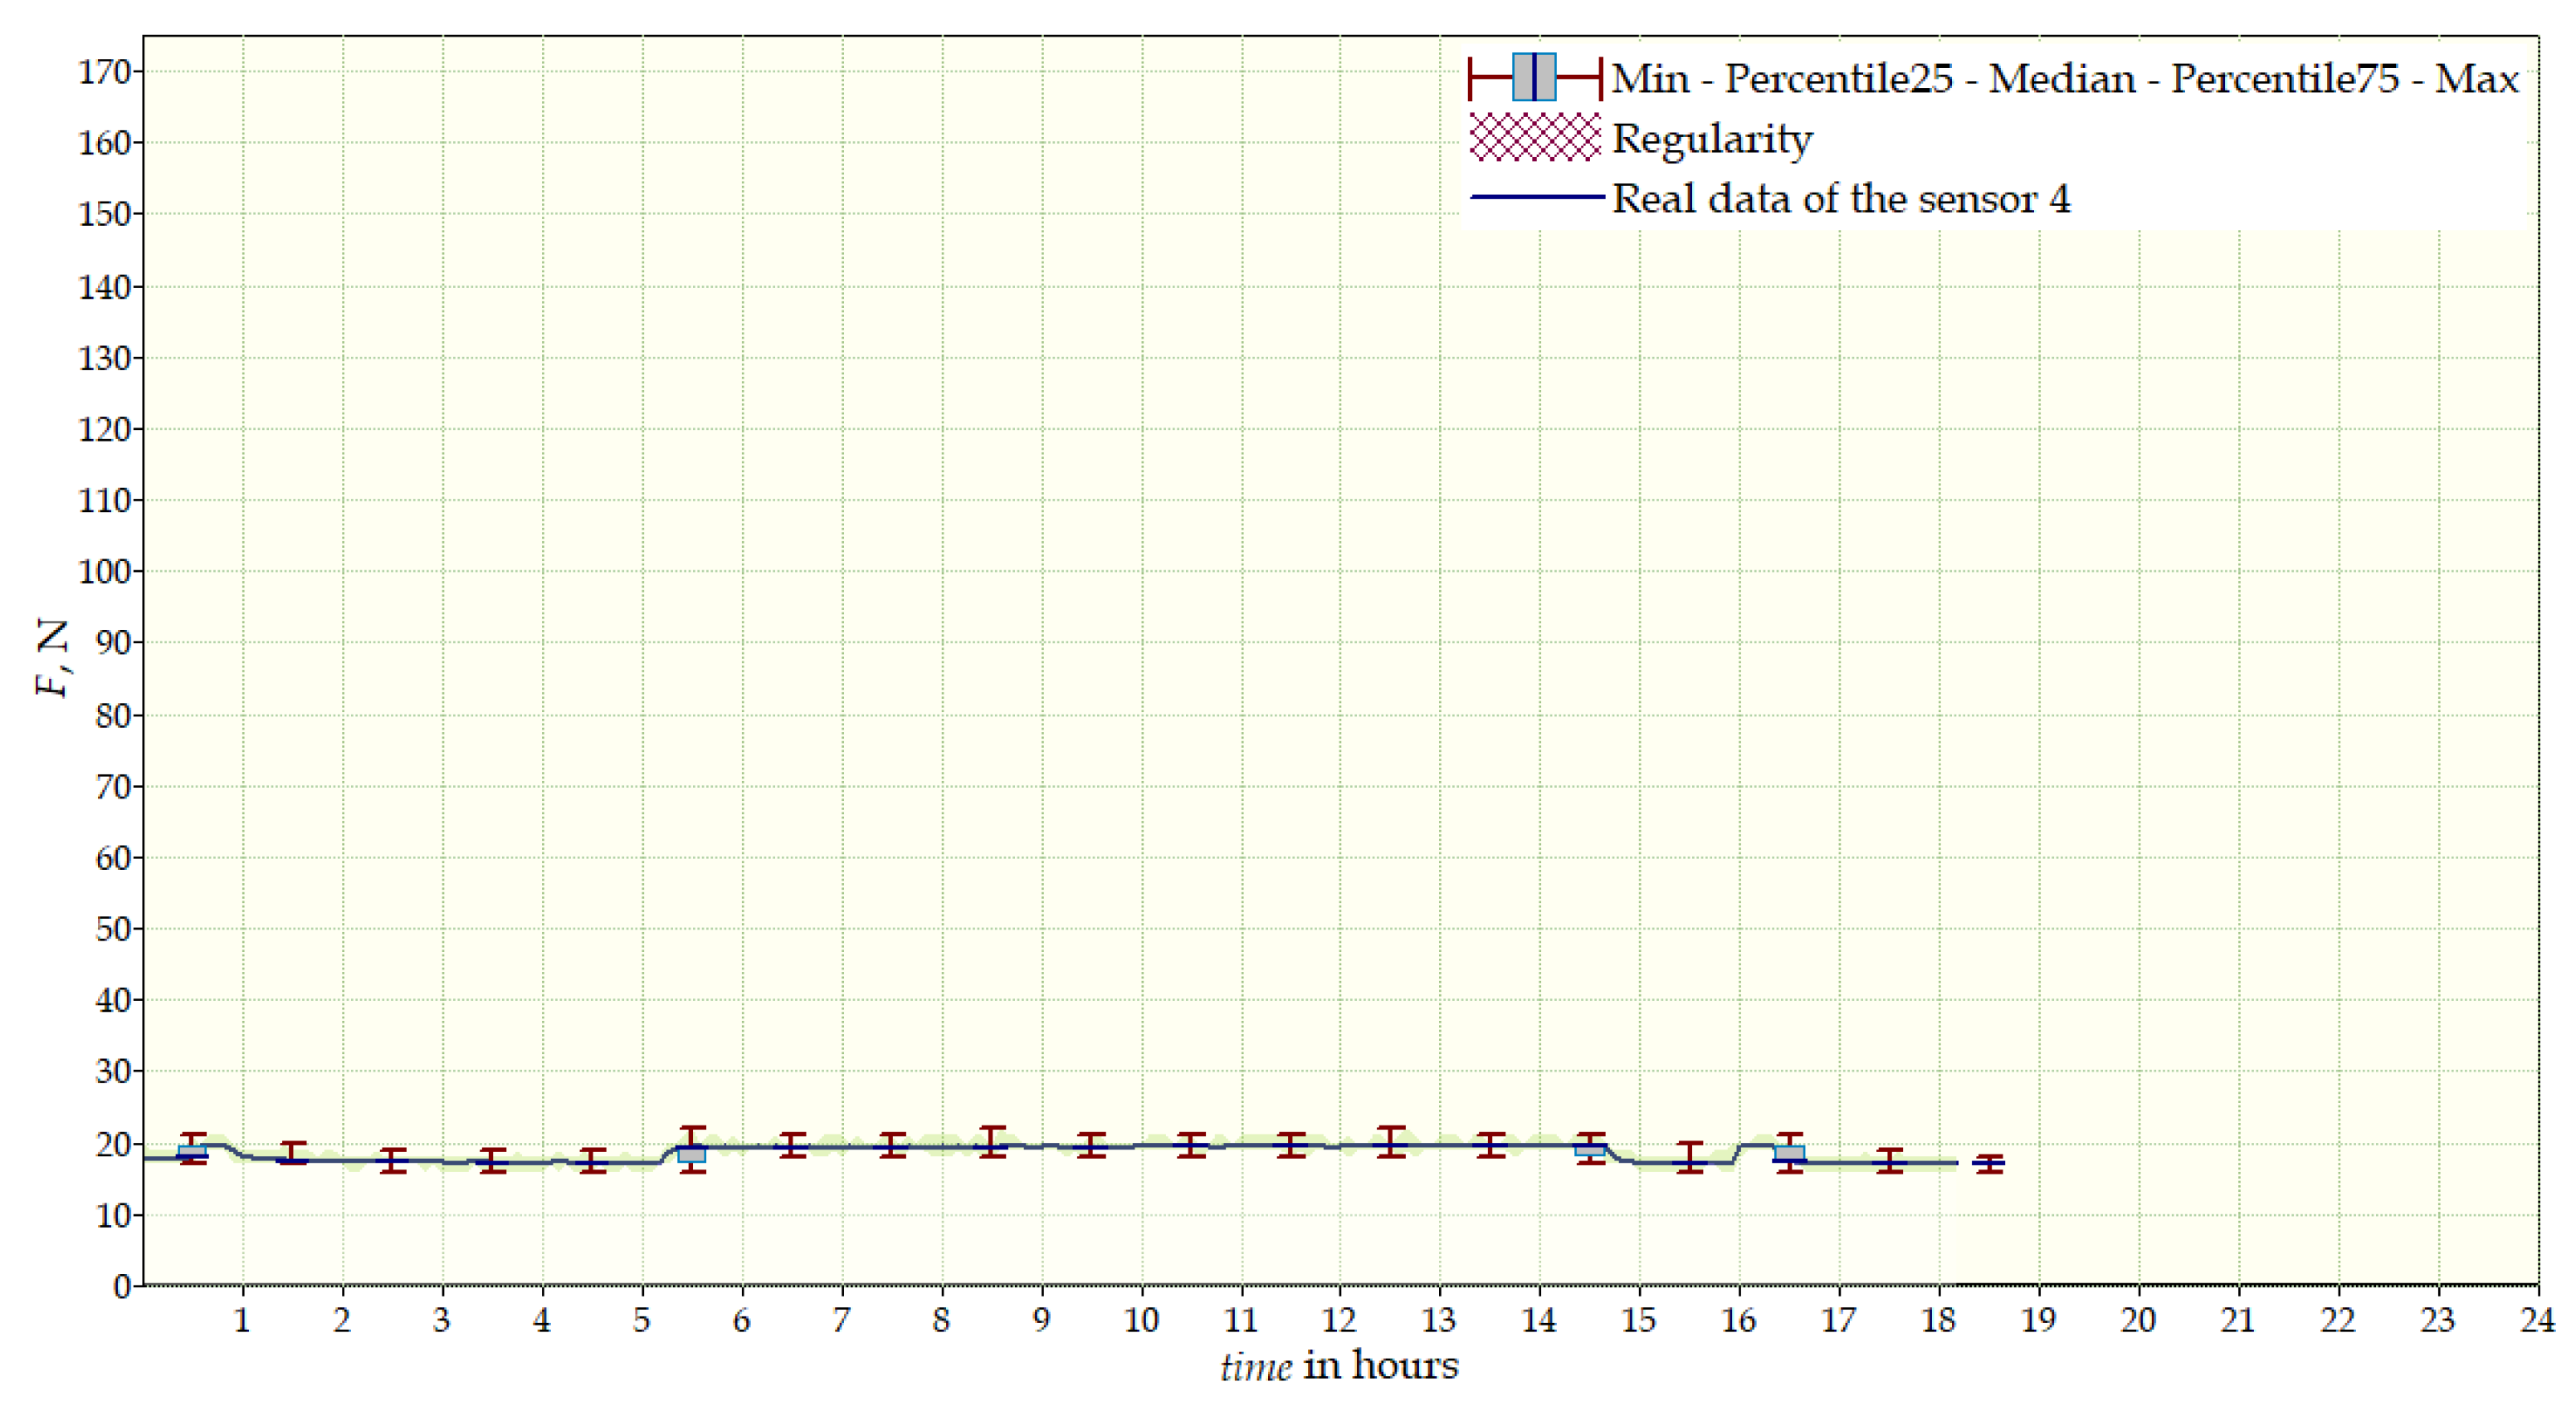
- Sensor 4—below the left shoulder blade.
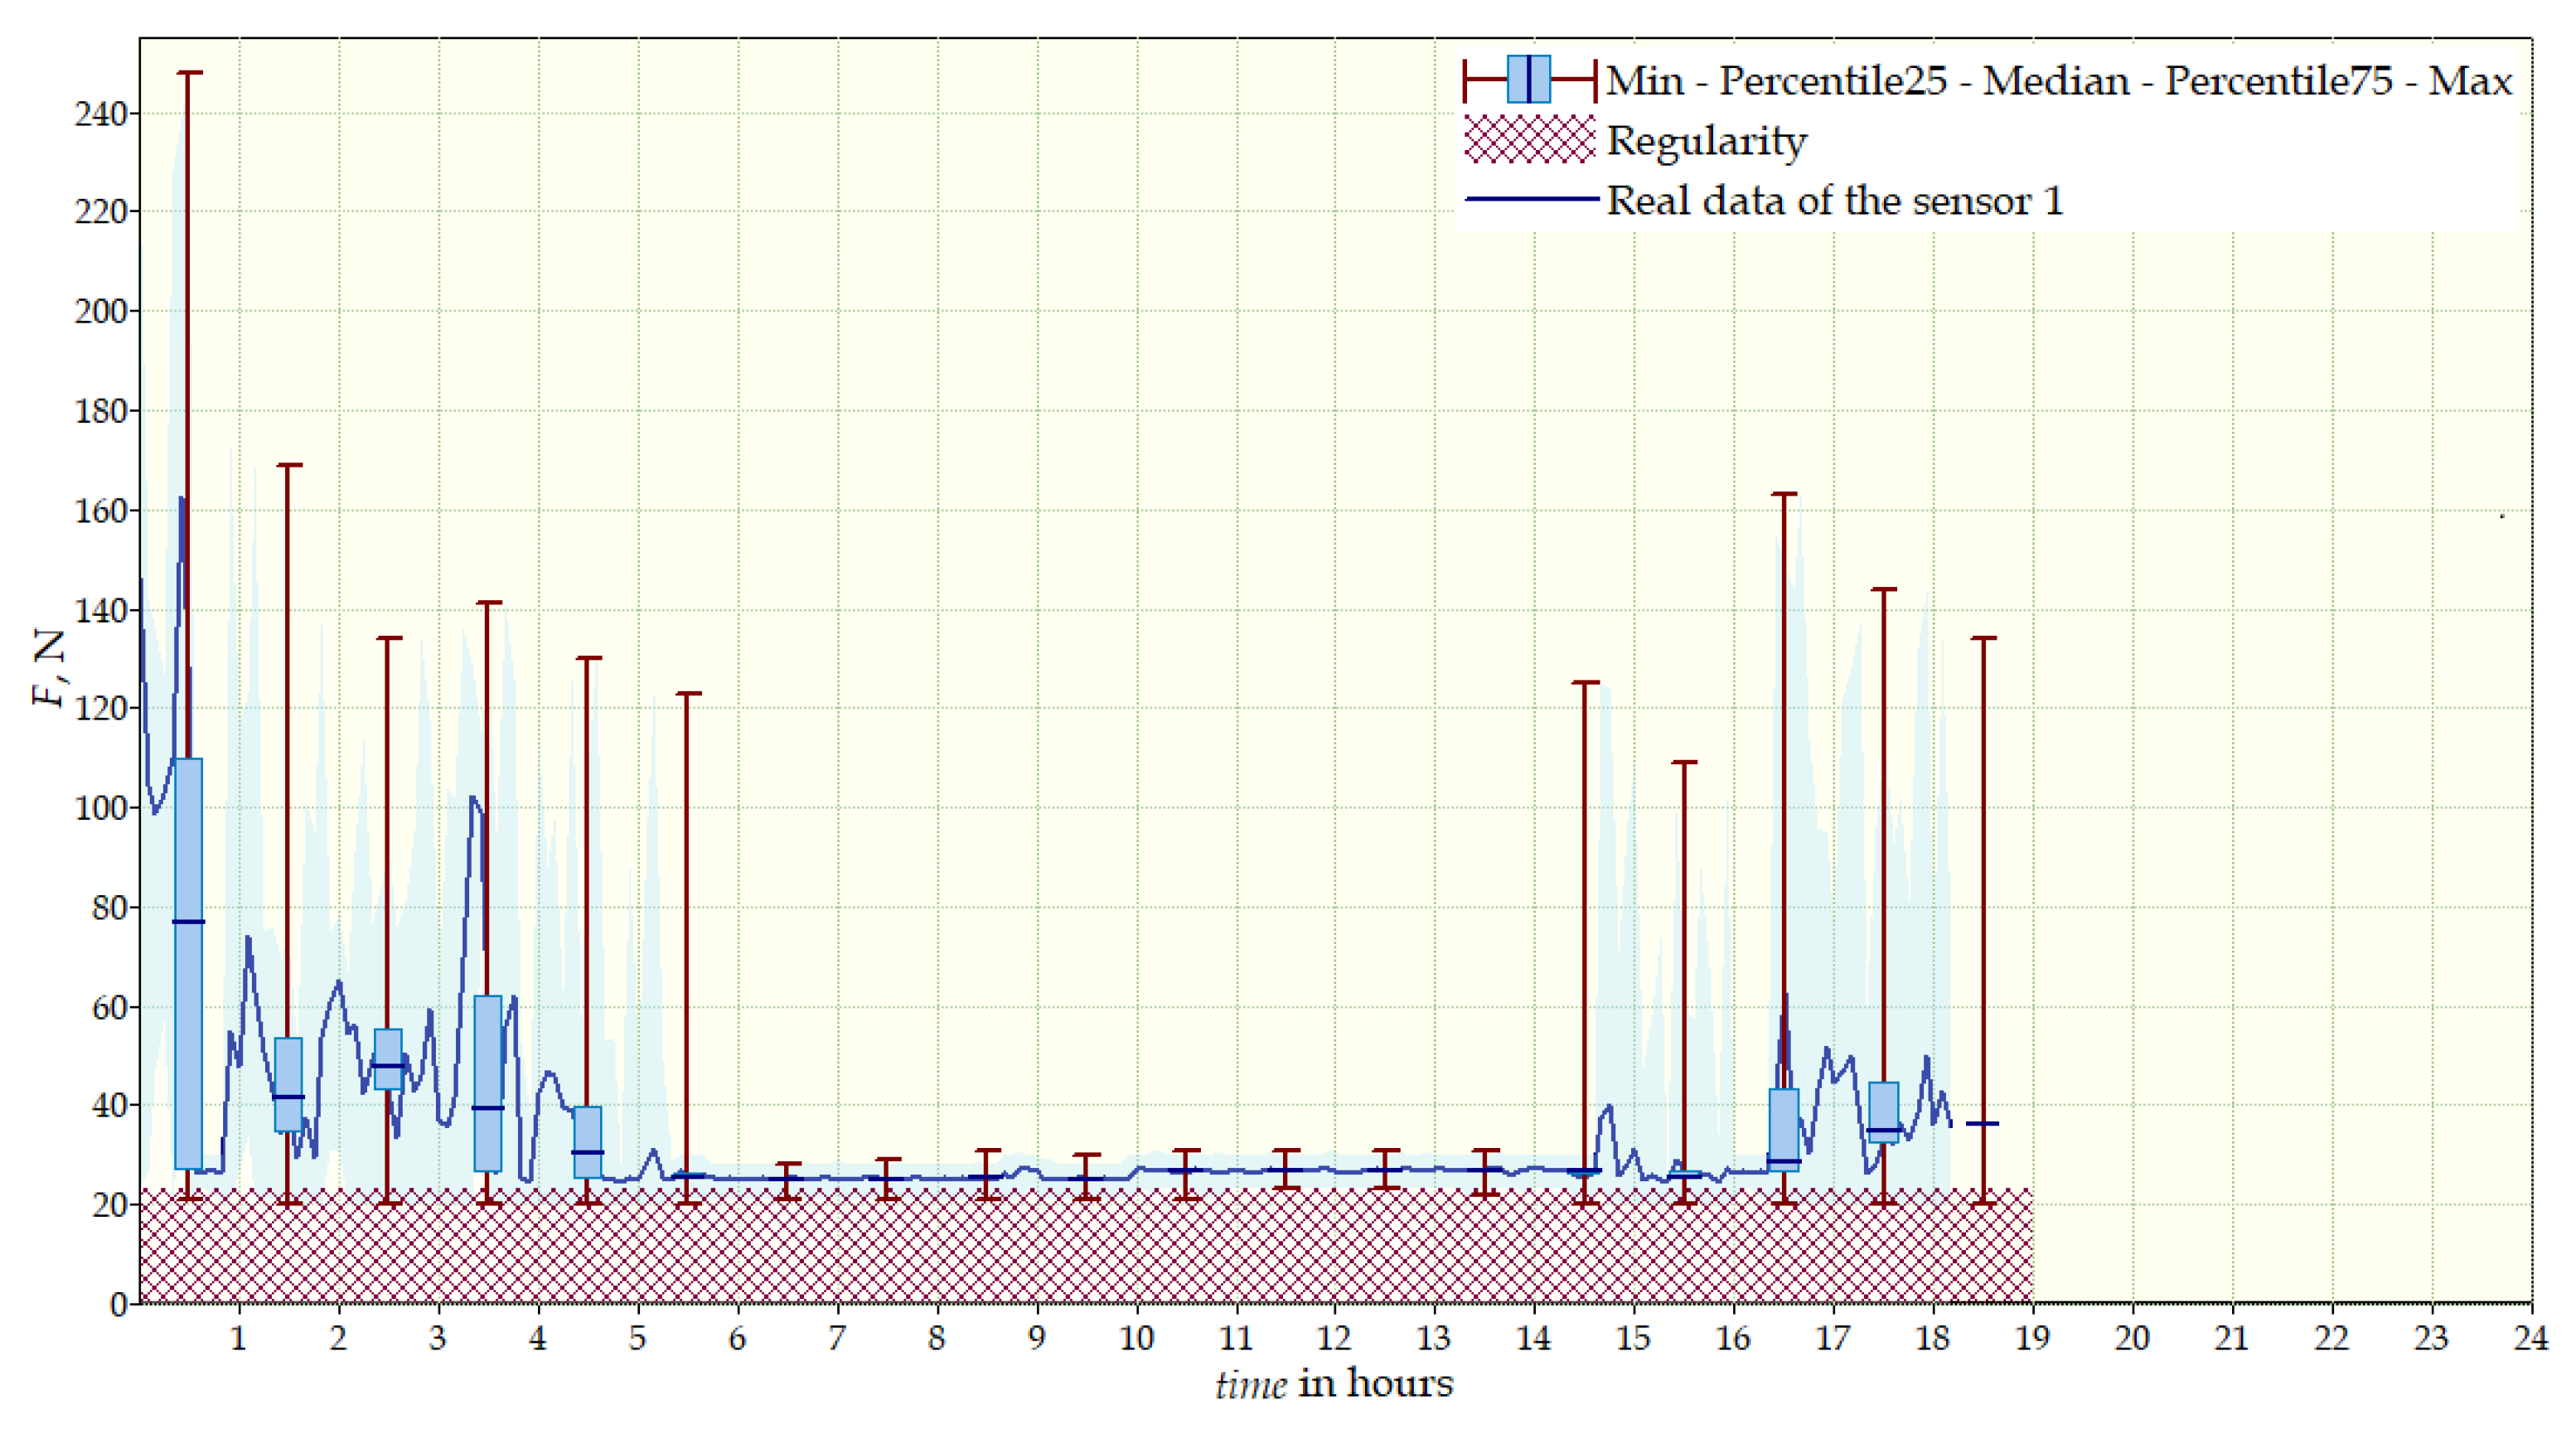
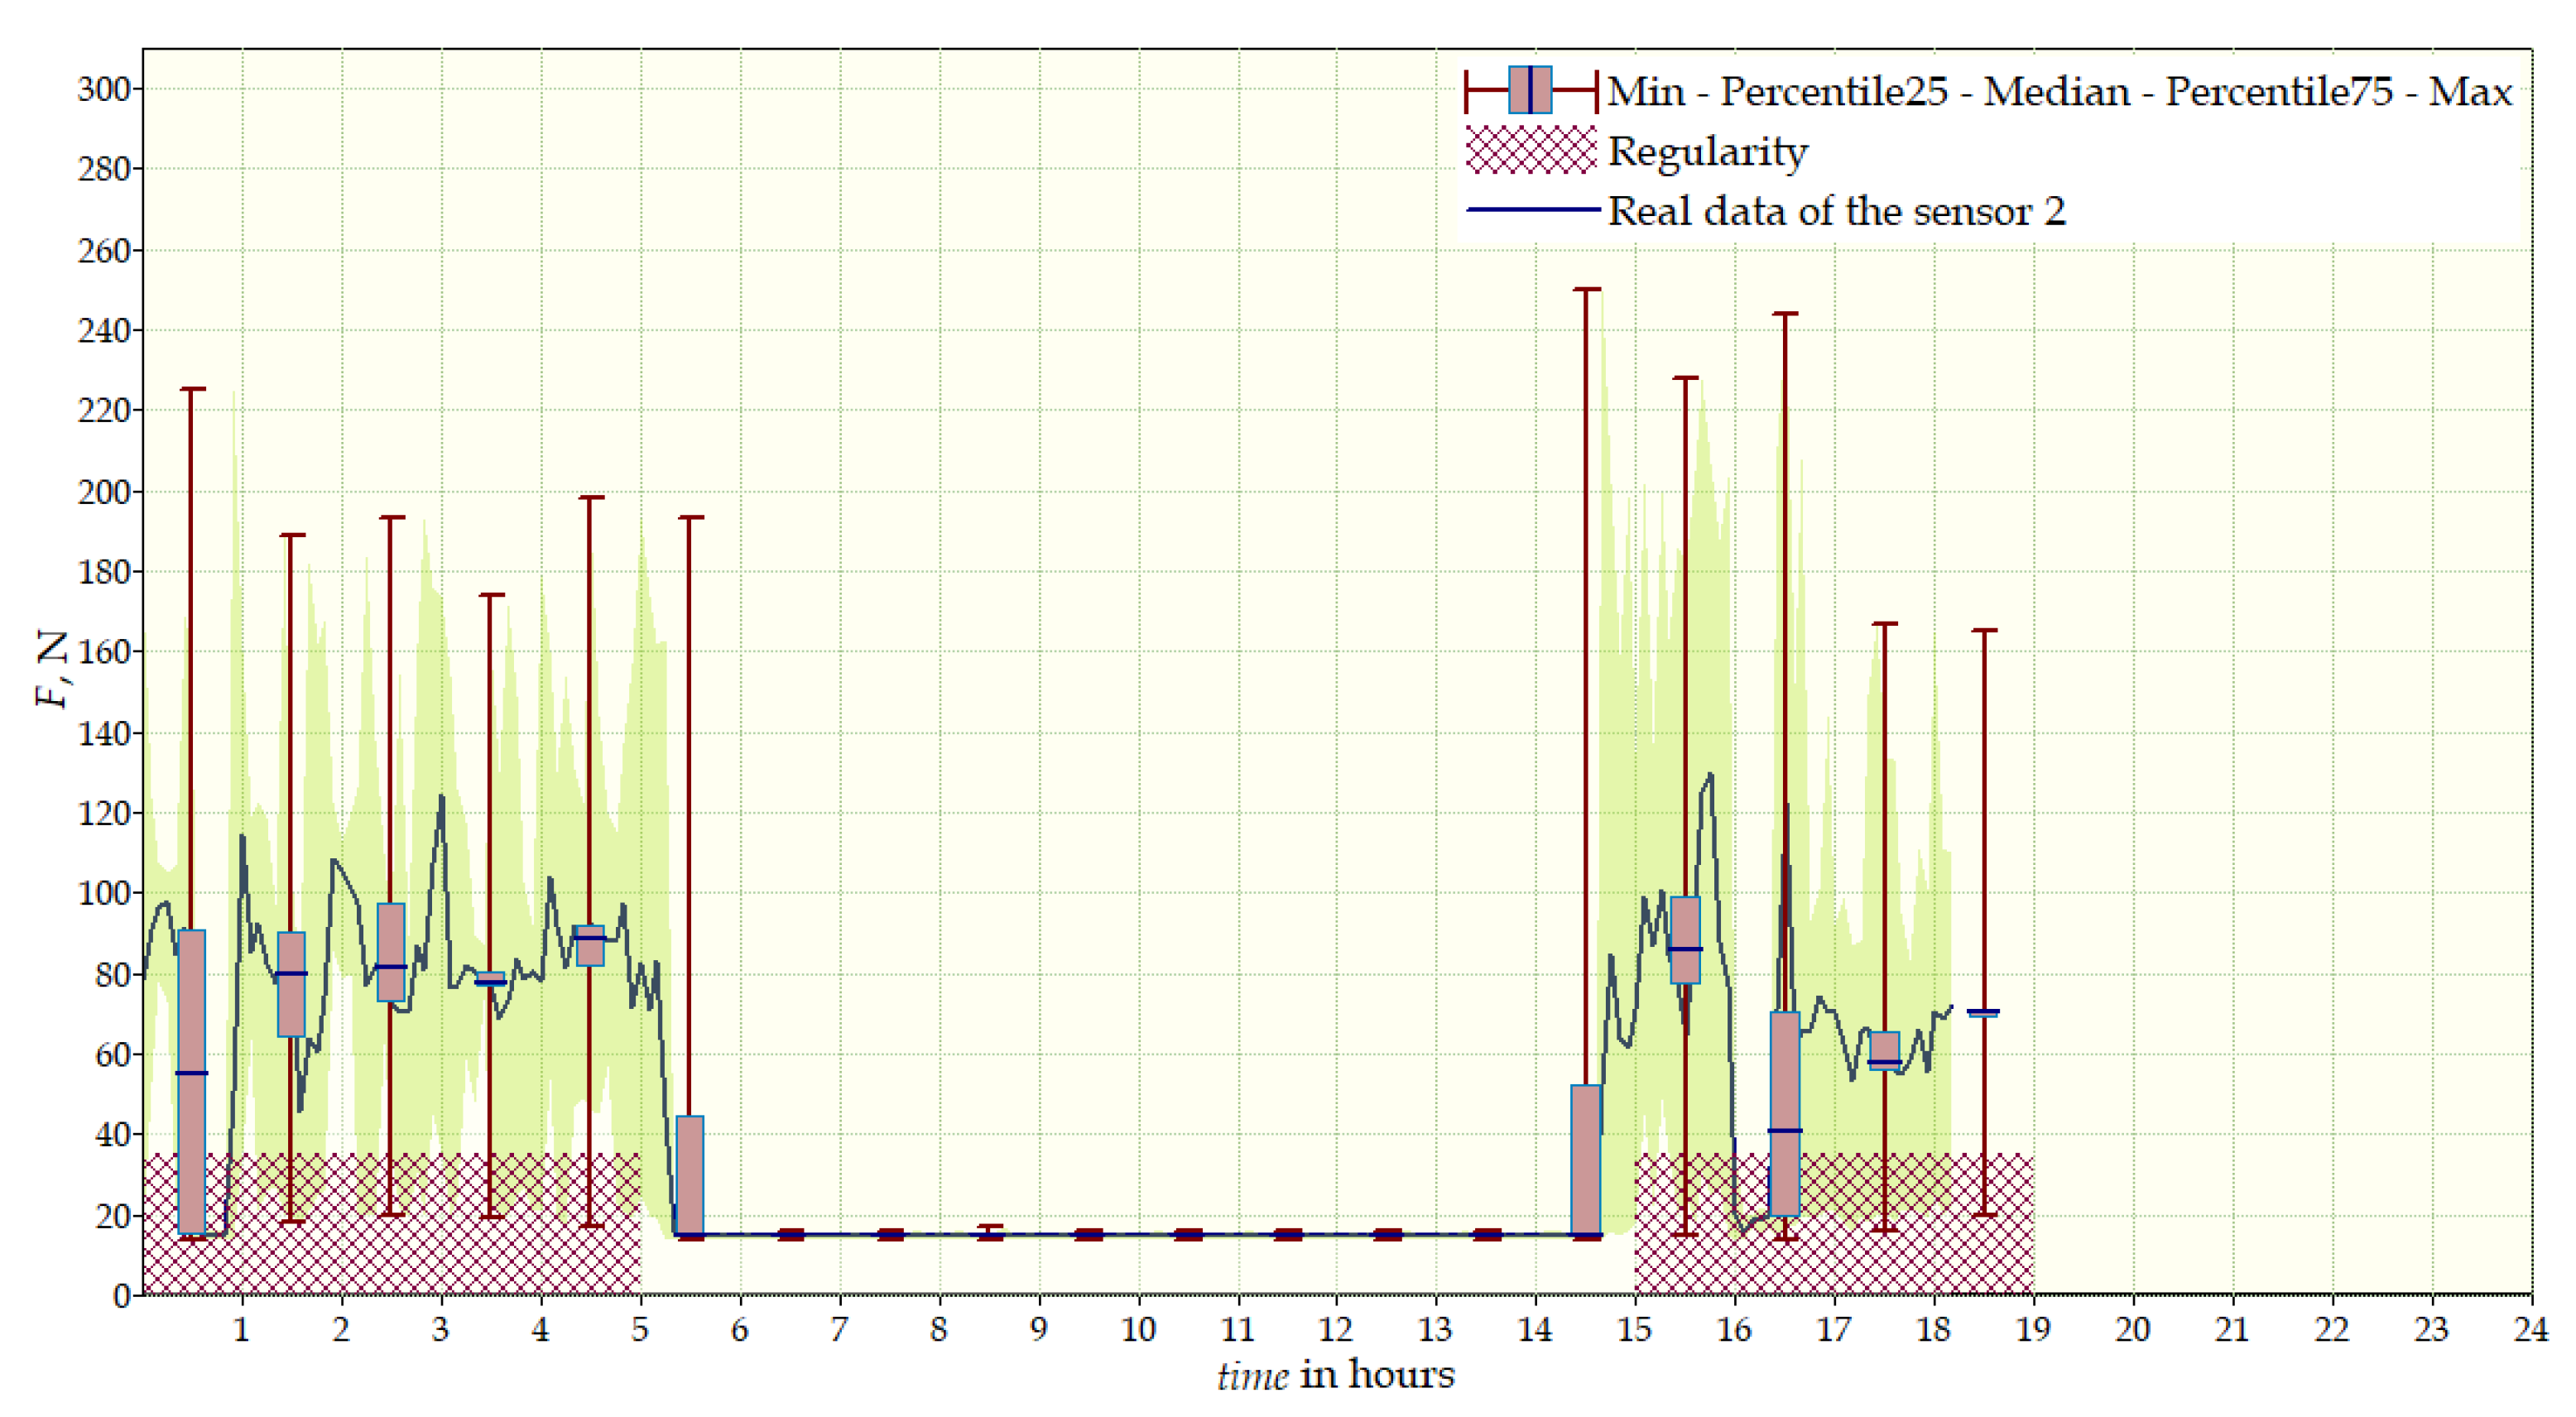
- Sensor 1—below the right shoulder blade, to the right of sensor 2;
- Sensor 2—below the right shoulder blade, close to the spine;
- Sensor 3—on the chest, left side;
- Sensor 4—below the left shoulder blade.
5. Conclusions
Author Contributions
Funding
Conflicts of Interest
Abbreviations
| TLSO | Thoracic Lumbar Sacral Orthosis |
| IS | Idiopathic Scoliosis |
| DC | Direct Current |
| AC | Alternating Current |
| LCD | Liquid-Crystal Display |
| TFT | Thin-Film-Transistor |
| GSM | Global System for Mobile Communications |
References
- Negrini, S.; Donzelli, S.; Aulisa, A.G.; Czaprowski, D.; Schreiber, S.; de Mauroy, J.C.; Diers, H.; Grivas, T.B.; Knott, P.; Kotwicki, T.; et al. 2016 SOSORT guidelines: Orthopaedic and rehabilitation treatment of idiopathic scoliosis during growth. Scoliosis Spinal Disord. 2018, 13, 3. [Google Scholar] [CrossRef] [PubMed] [Green Version]
- Lou, E.; Raso, J.; Hill, D.; Durdle, N.G. Low power wireless load monitoring system for the treatment of scoliosis. IEEE Trans. Instrum. Meas. 2002, 51, 908–911. [Google Scholar] [CrossRef]
- Lou, E.; Zbinden, D.; Mosberger, P.; Hill, D.L.; Raso, V.J. A wireless personal wearable network system to understand the biomechanics of orthotic for the treatment of scoliosis. In Proceedings of the 30th Annual International Conference of the IEEE Engineering in Medicine and Biology Society, Vancouver, BC, Canada, 20–25 August 2008; pp. 3426–3429. [Google Scholar]
- Lou, E.; Venkateswaran, S.; Hill, D.L.; Raso, J.V.; Donauer, A. An intelligent active brace system for the treatment of scoliosis. IEEE Trans. Instrum. Meas. 2004, 53, 1146–1151. [Google Scholar] [CrossRef]
- Bache, B.A.; Iftikhar, O.; Dehzangi, O. Brace Treatment Monitoring Solution for Idiopathic Scoliosis Patients. In Proceedings of the 2017 16th IEEE International Conference on Machine Learning and Applications (ICMLA), Cancun, Mexico, 18–21 December 2017; pp. 580–585. [Google Scholar]
- Dehzangi, O.; Iftikhar, O.; Bache, B.A.; Wensman, J.; Li, Y. Force and activity monitoring system for scoliosis patients wearing back braces. In Proceedings of the 2018 IEEE International Conference on Consumer Electronics (ICCE), Las Vegas, NV, USA, 12–14 January 2018; pp. 1–4. [Google Scholar]
- Dehzangi, O.; Mohammadi, M.; Li, Y. Smart brace for monitoring patients with scoliosis using a multimodal sensor board solution. In Proceedings of the 2016 IEEE Healthcare Innovation Point-Of-Care Technologies Conference (HI-POCT), Cancun, Mexico, 9–11 November 2016; pp. 66–698. [Google Scholar]
- Bansode, S.; Shinde, T.; Nimmagadda, M.; Garapati, S.; Abdel-Qader, I. Design and implementation of regulated-pressure brace with on-board control and monitoring abilities for the treatment of scoliosis. In Proceedings of the 2017 Second International Conference on Electrical, Computer and Communication Technologies (ICECCT), Coimbatore, India, 22–24 February 2017; pp. 1–5. [Google Scholar]
- Hudák, R.; Rajt’úková, V.; Živcák, J.; Hudák, J.; Bednarčíková, L. The use of matrix tactile sensors (MTS) for diagnostics of the efficiency of production, testing and application of a trunk orthosis. In Proceedings of the 2012 IEEE 13th International Symposium on Computational Intelligence and Informatics (CINTI), Budapest, Hungary, 20–22 November 2012; pp. 299–304. [Google Scholar]
- Evans, K.R.; Lou, E.; Faulkner, G. Optimization of a Low-Cost Force Sensor for Spinal Orthosis Applications. IEEE Trans. Instrum. Meas. 2013, 62, 3243–3250. [Google Scholar] [CrossRef]
- Fuss, F.K.; Ahmad, A.; Tan, A.M.; Razman, R.; Weizman, Y. Pressure sensor system for customised scoliosis braces. Sensors 2021, 21, 1153. [Google Scholar] [CrossRef] [PubMed]
- Bernat, M. Virtual Environment for Identification of Static Characteristic Parameters of Thin-Film Resistive Pressure Sensors. Master’s Thesis, Lublin University of Technology, Lublin, Poland, 2017. [Google Scholar]
- Janczak, D.; Słoma, M.; Wróblewski, G.; Młożniak, A.; Jakubowska, M. Screen-printed resistive pressure sensors containing graphene nanoplatelets and carbon nanotubes. Sensors 2014, 14, 17304–17312. [Google Scholar] [CrossRef] [PubMed] [Green Version]
- Wolska, W. Complex Mathematical Model of Thin-Film Pressure Sensors. Master’s Thesis, Lublin University of Technology, Lublin, Poland, 2019. [Google Scholar]
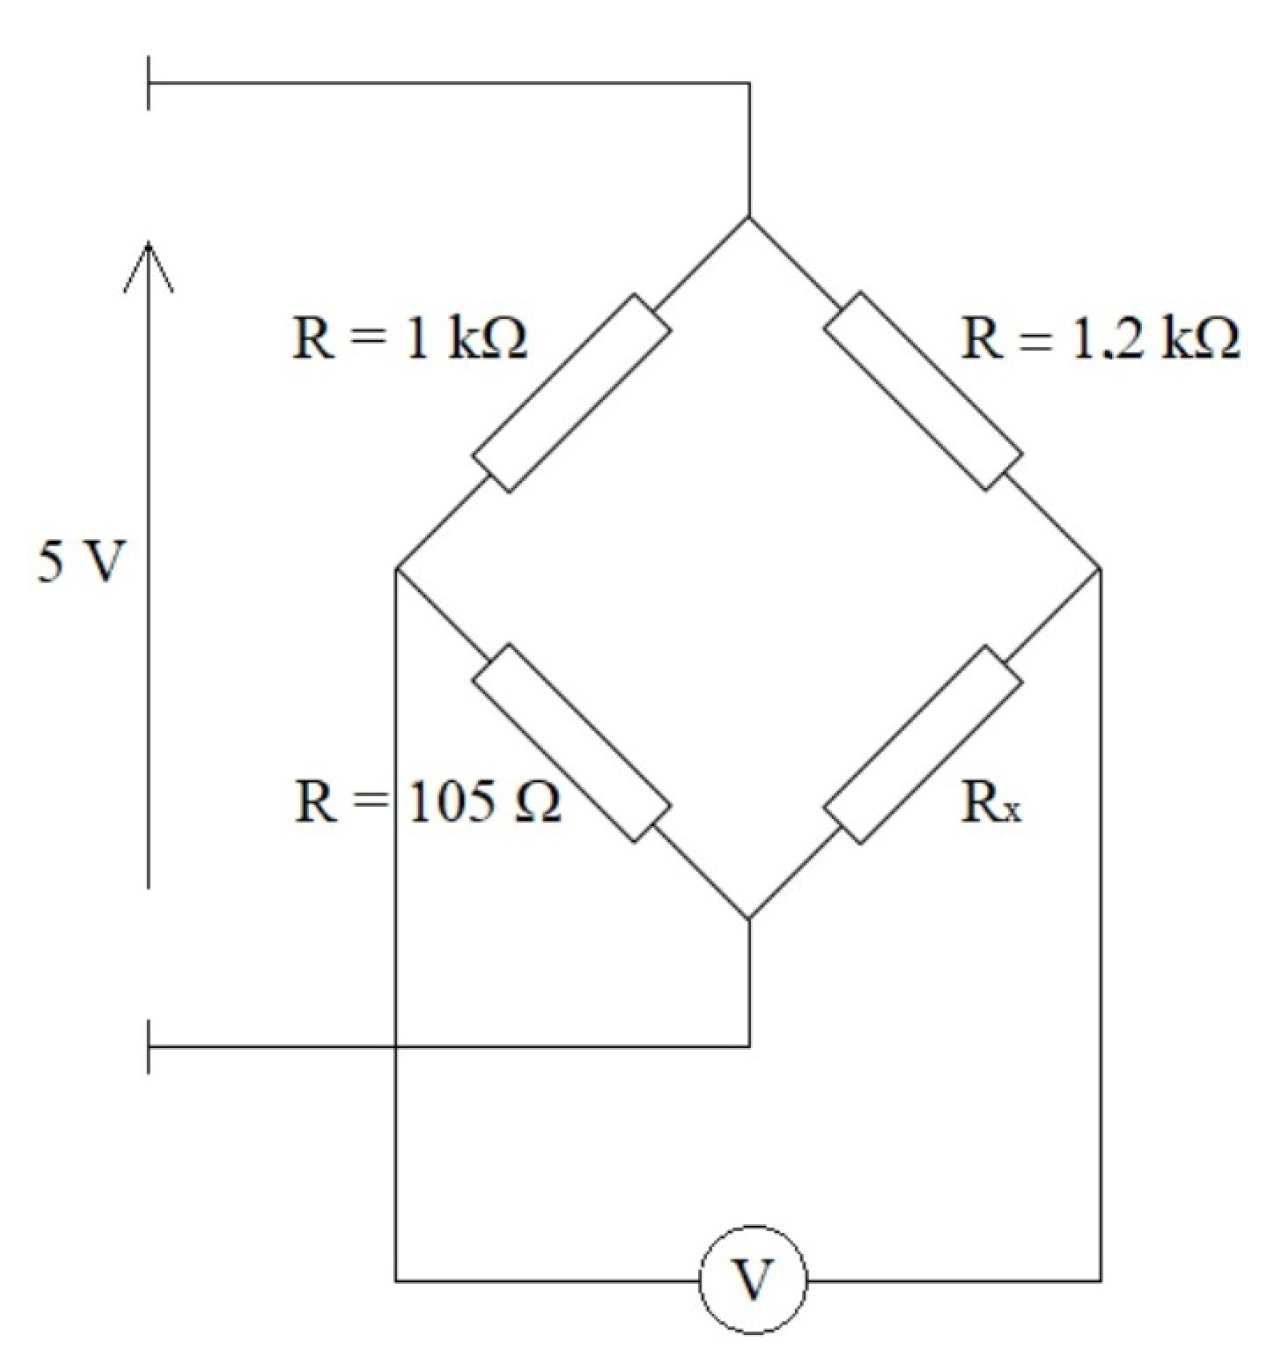
- Hoffmann, K. Applying the Wheatstone Bridge Circuit; HBM: Darmstadt, Germany, 1974. [Google Scholar]
- Chalmers, E.; Lou, E.; Hill, D.; Zhao, H.V. An advanced compliance monitor for patients undergoing brace treatment for idiopathic scoliosis. Med. Eng. Phys. 2015, 37, 203–209. [Google Scholar] [CrossRef] [PubMed]
- Karol, L.A.; Virostek, D.; Felton, K.; Wheeler, L. Effect of Compliance Counseling on Brace Use and Success in Patients with Adolescent Idiopathic Scoliosis. J. Bone Jt. Surg. 2016, 98, 9–14. [Google Scholar] [CrossRef] [PubMed] [Green Version]
- Pham, V.M.; Houilliez, A.; Schill, A.; Carpentier, A.; Herbaux, B.; Thevenon, A. Study of the pressures applied by a Chêneau brace for correction of adolescent idiopathic scoliosis. Prosthet. Orthot. Int. 2008, 32, 345–355. [Google Scholar] [CrossRef] [PubMed] [Green Version]
Publisher’s Note: MDPI stays neutral with regard to jurisdictional claims in published maps and institutional affiliations. |
© 2022 by the authors. Licensee MDPI, Basel, Switzerland. This article is an open access article distributed under the terms and conditions of the Creative Commons Attribution (CC BY) license (https://creativecommons.org/licenses/by/4.0/).
Share and Cite
Tymińska, P.; Zaborowska-Sapeta, K.; Janczak, D.; Giżewski, T. TLSO with Graphene Sensors—An Application to Measurements of Corrective Forces in the Prototype of Intelligent Brace. Sensors 2022, 22, 4015. https://doi.org/10.3390/s22114015
Tymińska P, Zaborowska-Sapeta K, Janczak D, Giżewski T. TLSO with Graphene Sensors—An Application to Measurements of Corrective Forces in the Prototype of Intelligent Brace. Sensors. 2022; 22(11):4015. https://doi.org/10.3390/s22114015
Chicago/Turabian StyleTymińska, Patrycja, Katarzyna Zaborowska-Sapeta, Daniel Janczak, and Tomasz Giżewski. 2022. "TLSO with Graphene Sensors—An Application to Measurements of Corrective Forces in the Prototype of Intelligent Brace" Sensors 22, no. 11: 4015. https://doi.org/10.3390/s22114015
APA StyleTymińska, P., Zaborowska-Sapeta, K., Janczak, D., & Giżewski, T. (2022). TLSO with Graphene Sensors—An Application to Measurements of Corrective Forces in the Prototype of Intelligent Brace. Sensors, 22(11), 4015. https://doi.org/10.3390/s22114015