
Learning to Combine Local and Global Image Information for Contactless Palmprint Recognition


Abstract
:1. Introduction
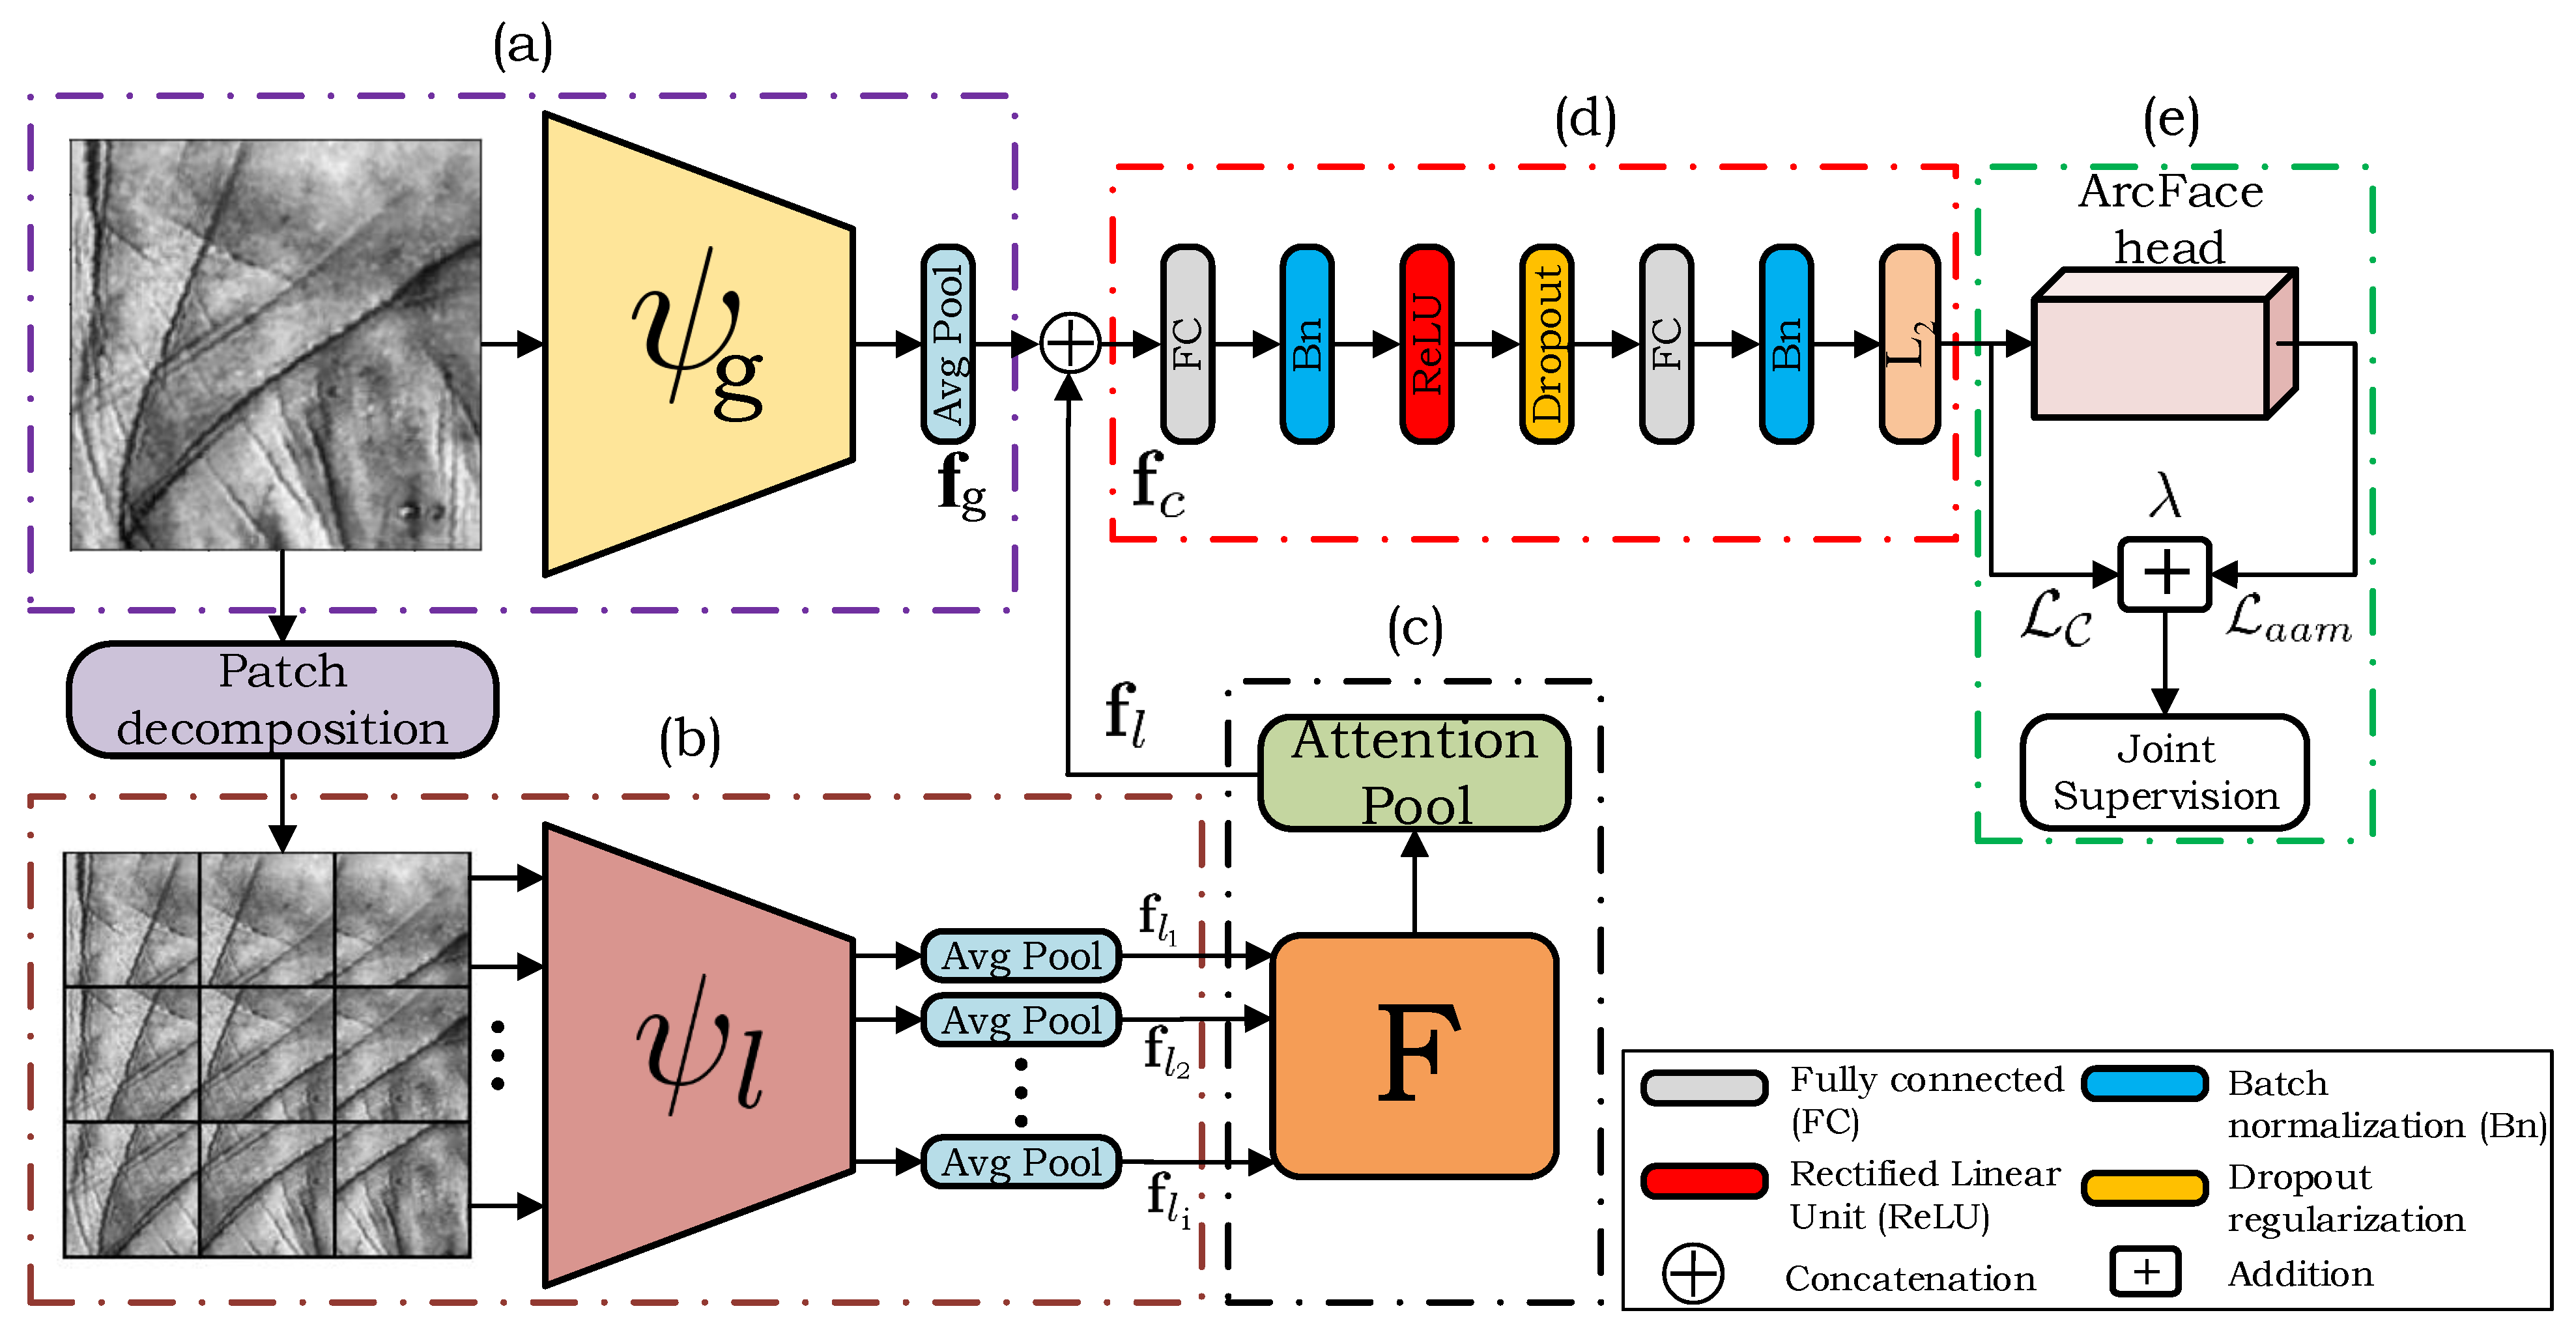
- We present a hybrid DL approach for contactless palmprint recognition based on a novel two-path network architecture that takes global as well as local image information into account.
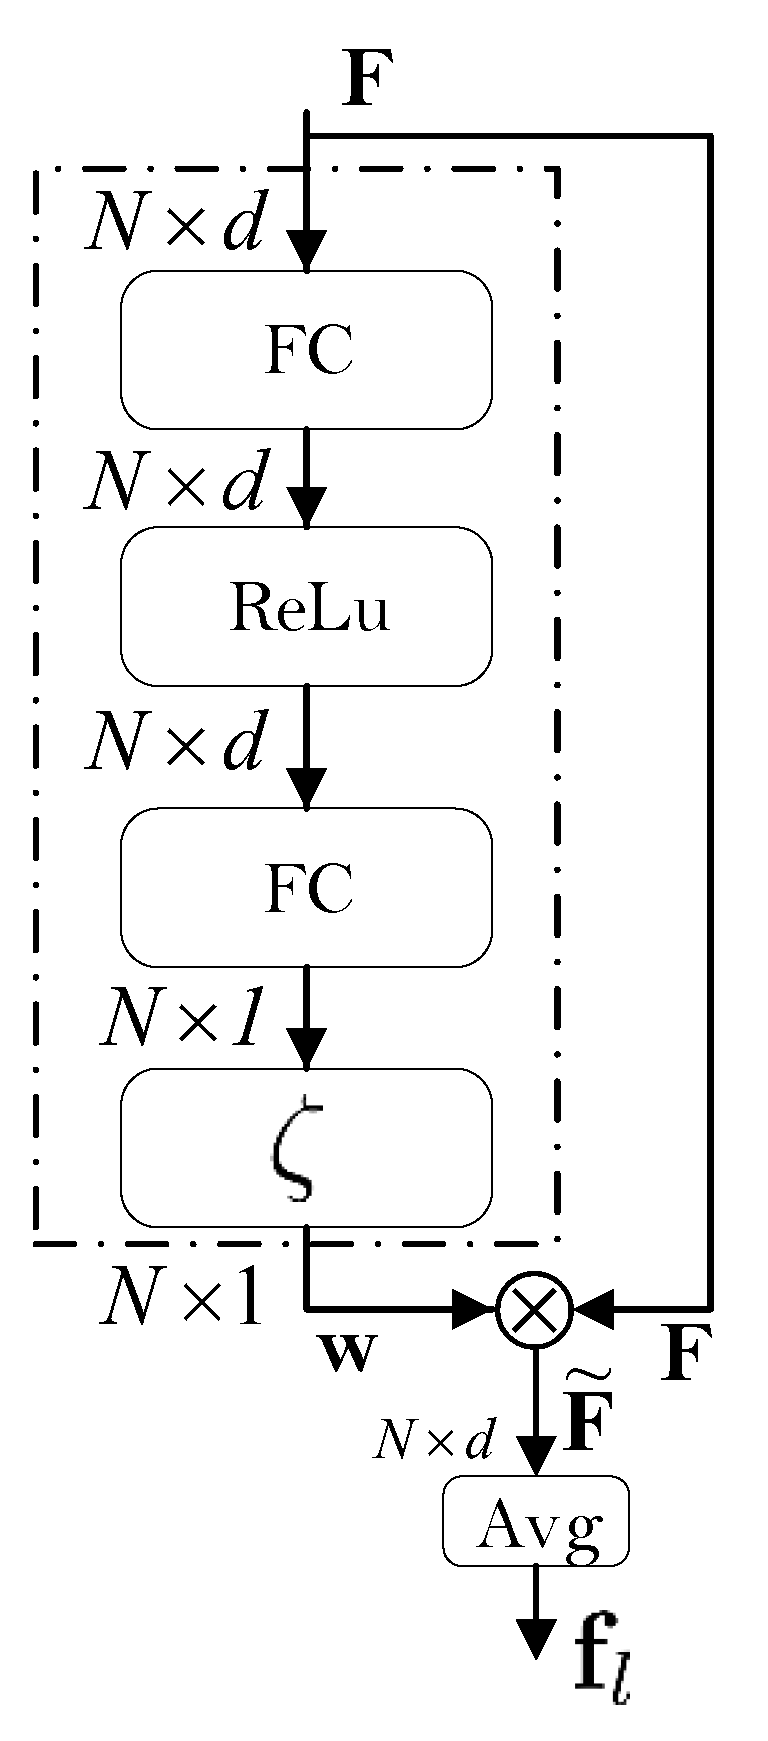
- We propose an attention-based channel pooling operation, which is capable of (adaptively) extracting the most discriminative (local) information from sampled patches of the given input image.
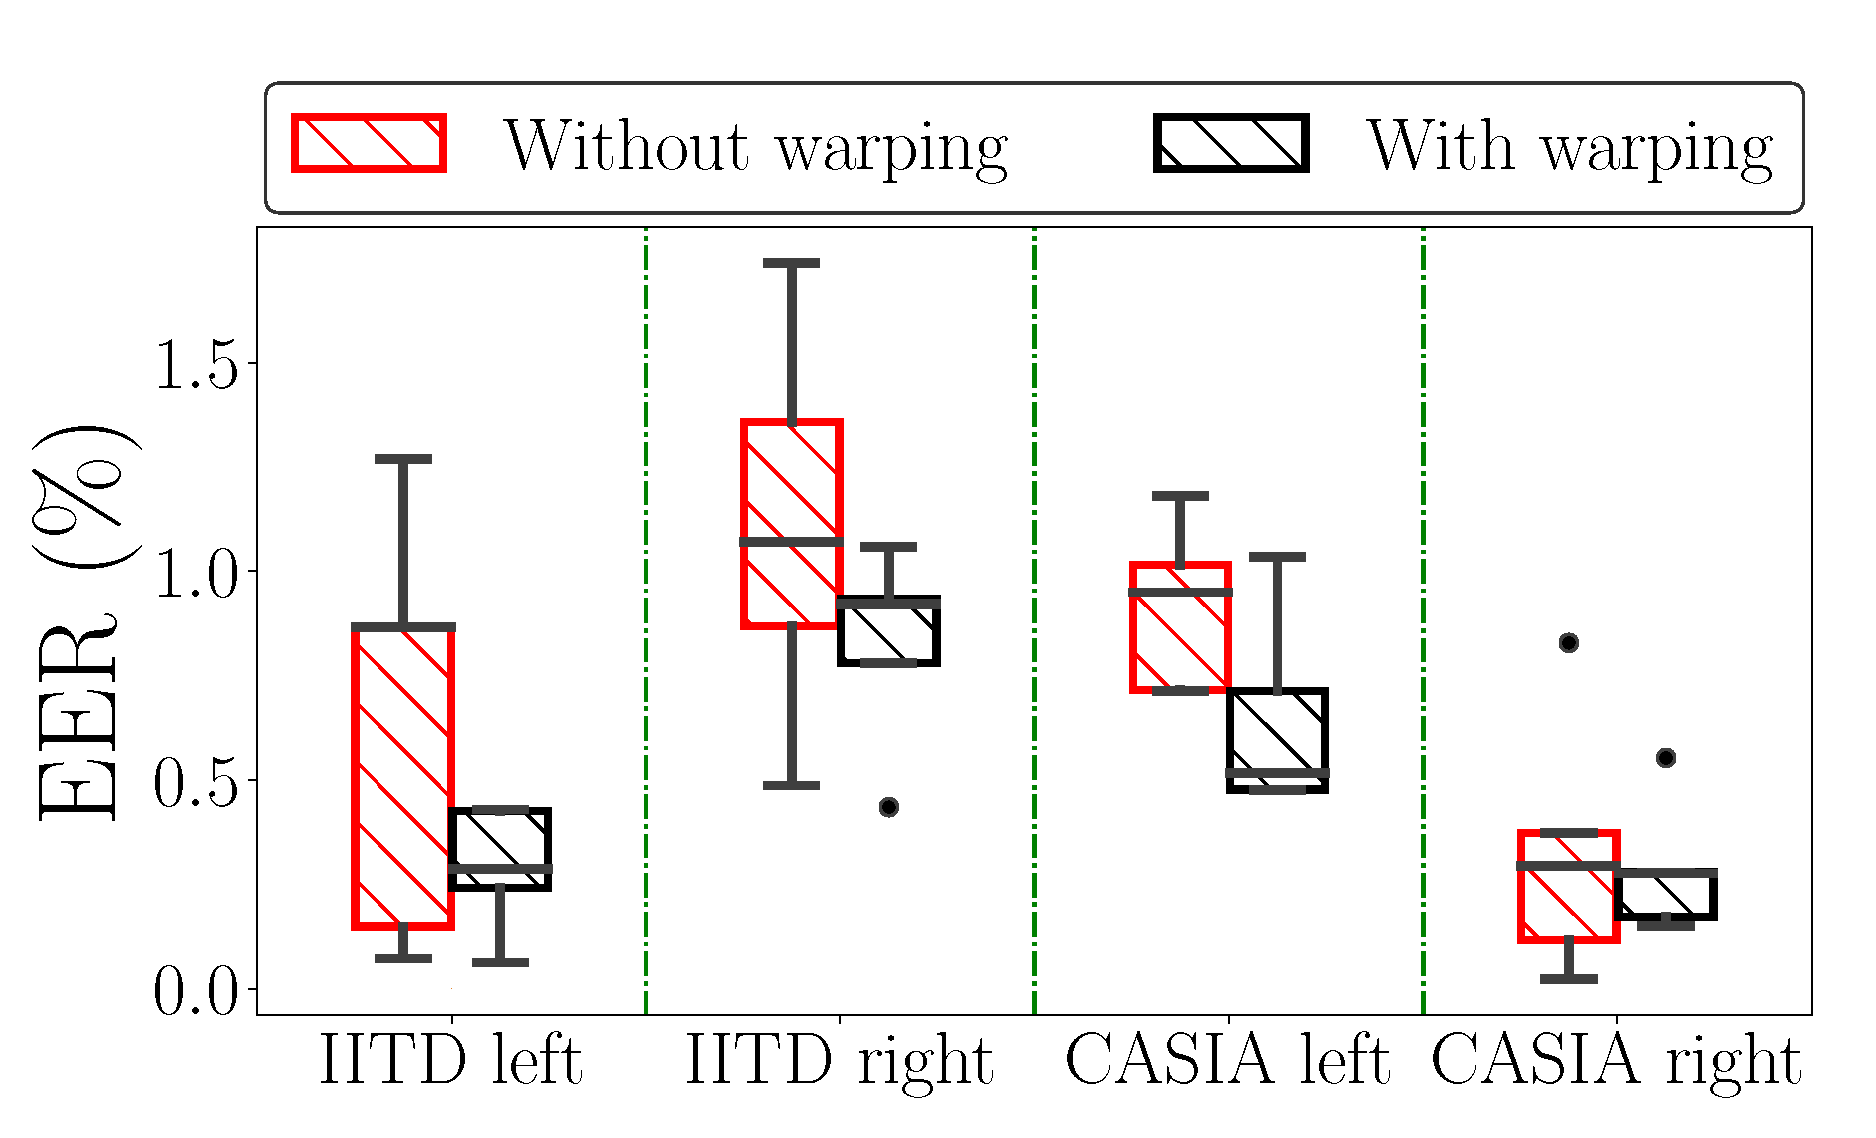
- We introduce thin plate splines (TPS) as an augmentation procedure for explicitly modeling elastic deformations and demonstrate that the proposed augmentation procedure is beneficial for recognition performance.
- We show the benefit of combining local and global image information into discriminative representations that lead to a state-of-the-art performance for contactless palmprint recognition on two publicly available datasets.
2. Related Work
2.1. Conventional Methods
2.2. Deep Learning Methods
3. Proposed Method
3.1. Overview of the Proposed Model
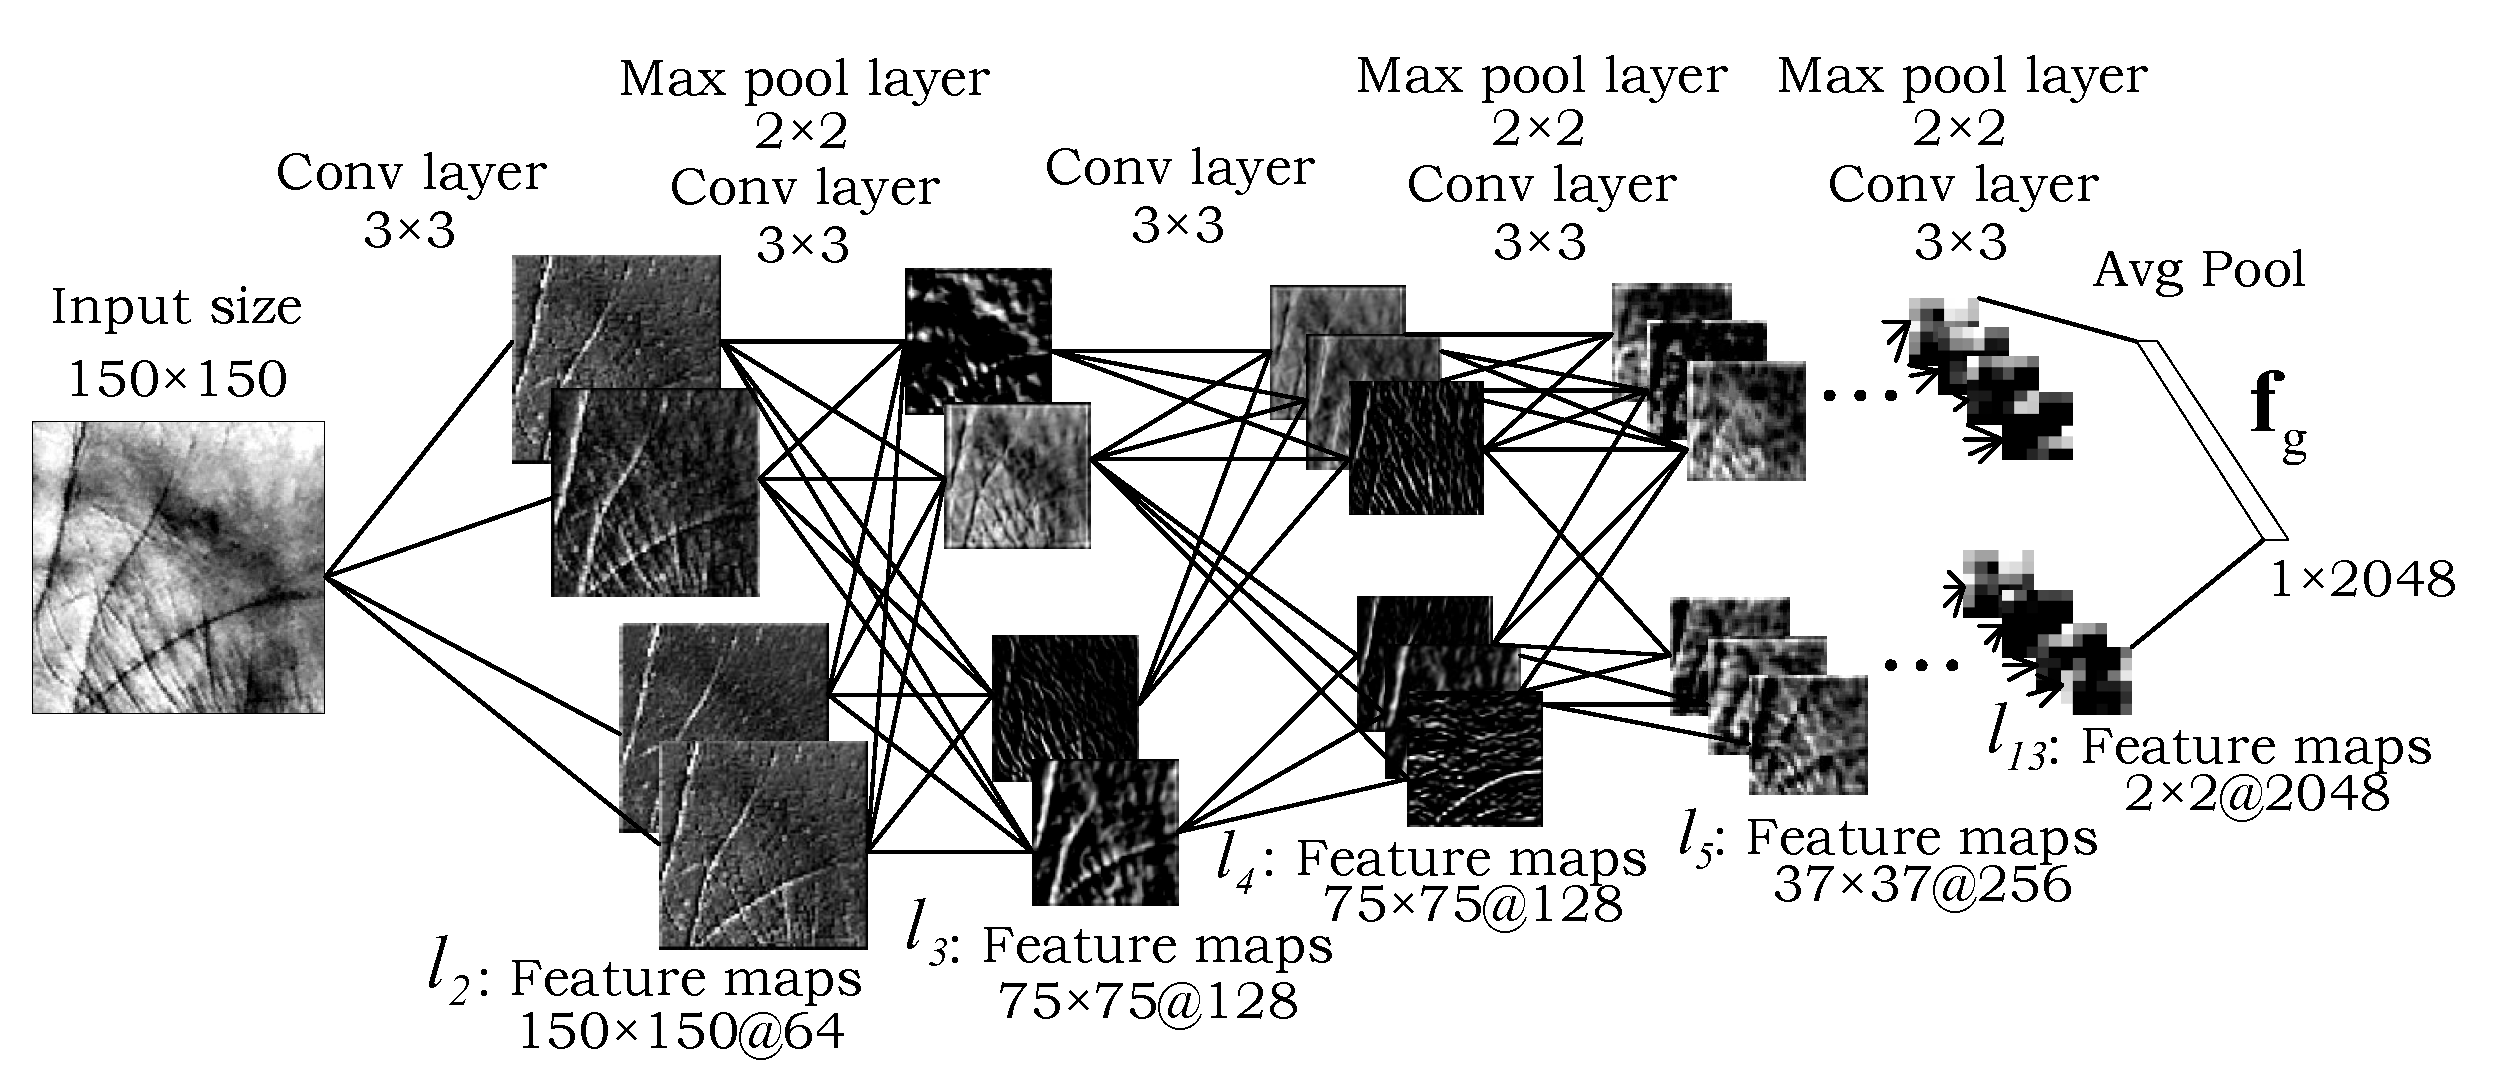
3.2. The Global Processing Path
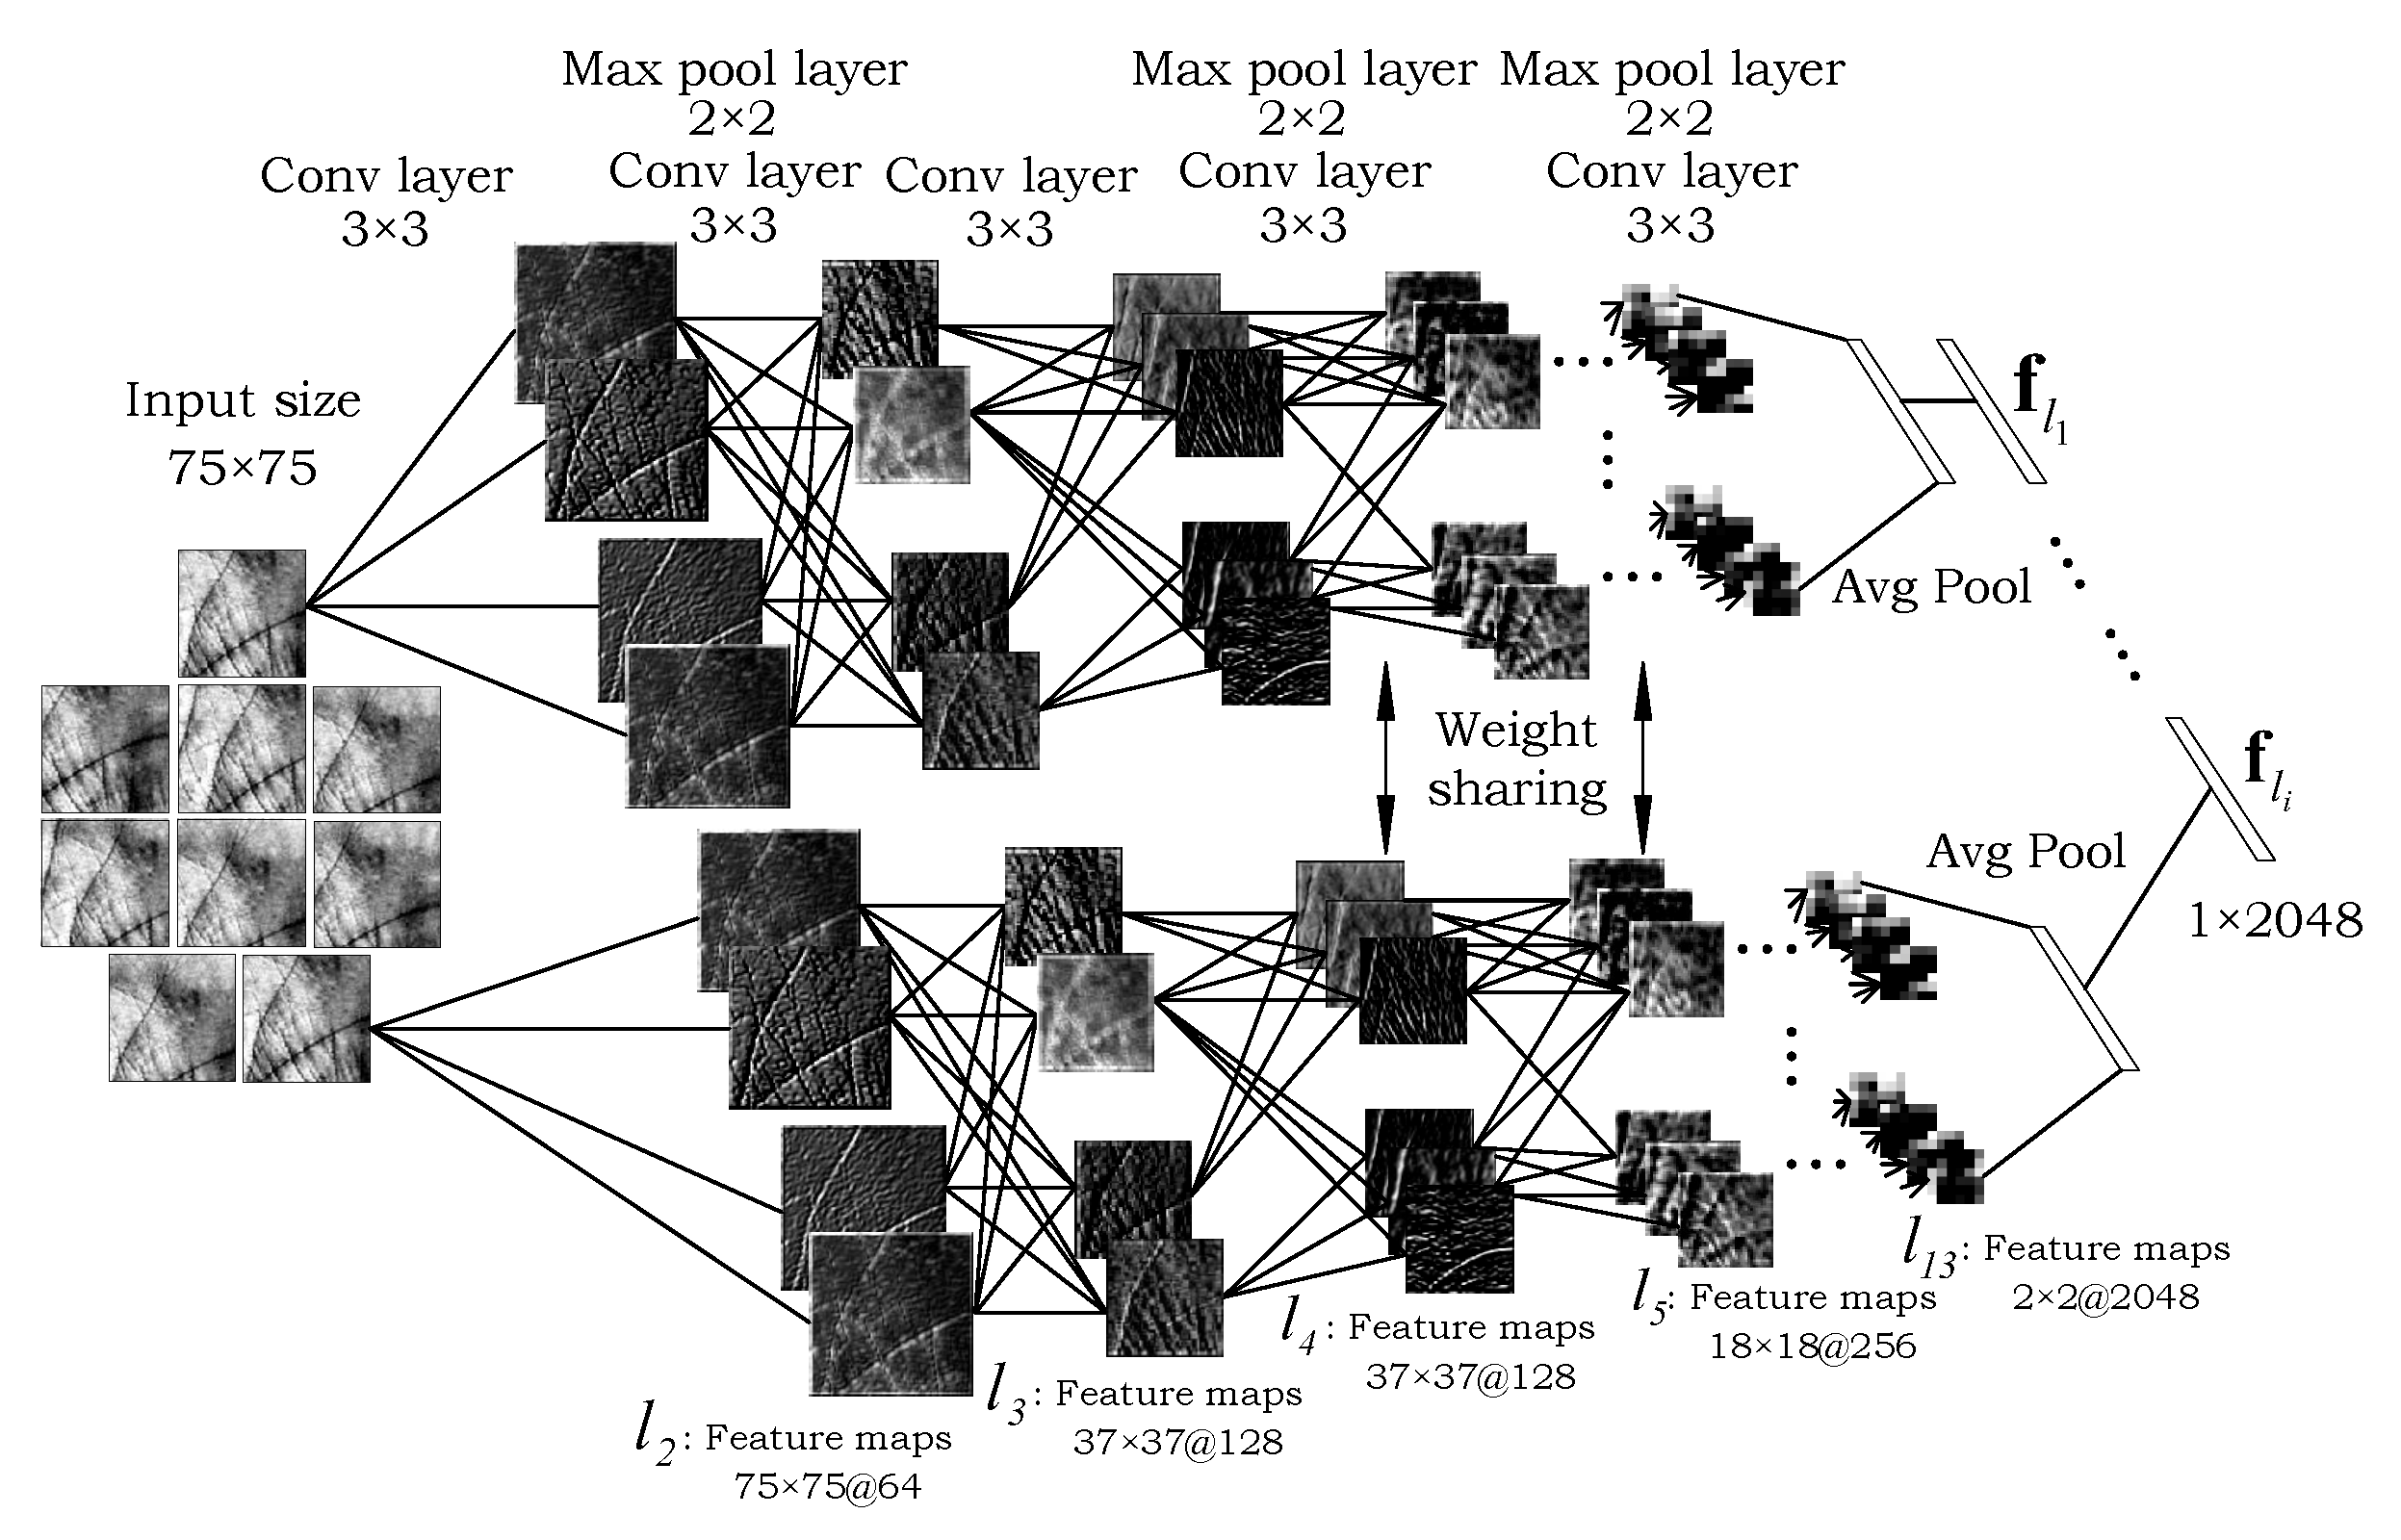
3.3. The Local Patch-Based Processing Path
3.4. The Attention Mechanism
3.5. Combining Information
3.6. Discriminative Feature Learning Approach for Deep Palmprint Recognition
3.7. Model Implementation
4. Experiments
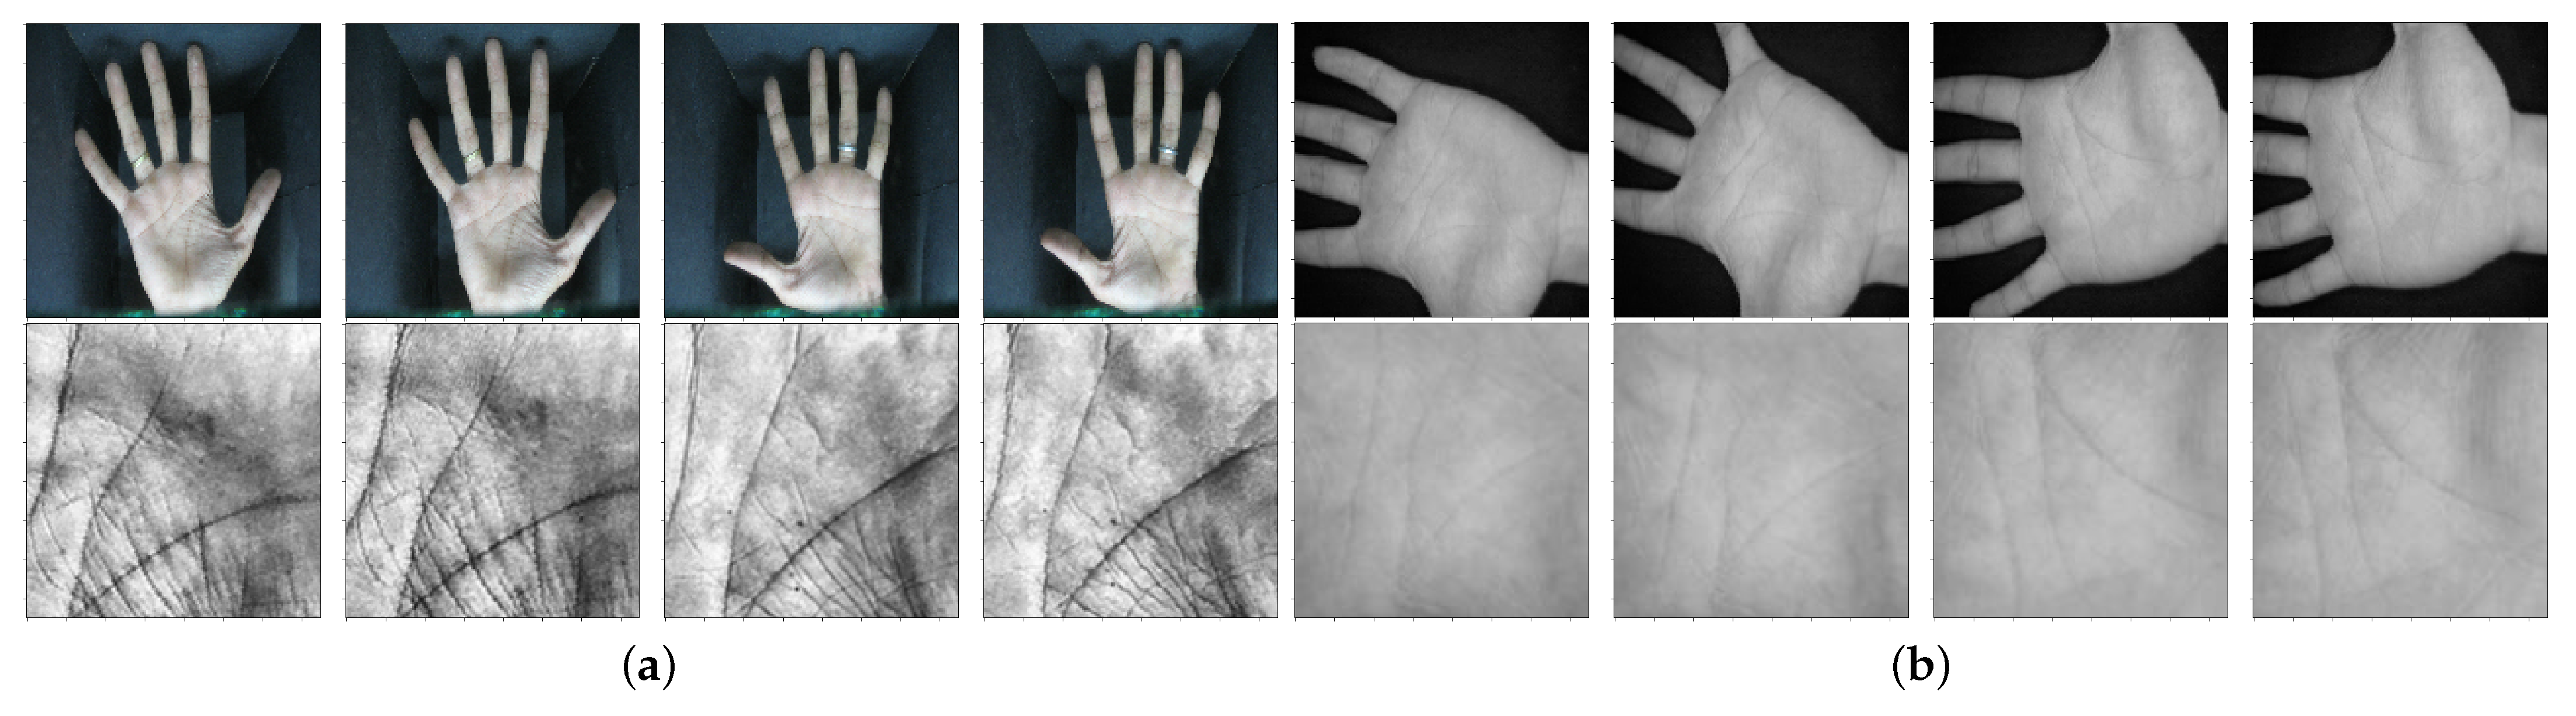
4.1. Experimental Datasets
4.1.1. IITD Palmprint Image Dataset
4.1.2. CASIA Palmprint Image Dataset
4.2. Experimental Setup
4.3. Performance Metrics
- Area Under the Curve (AUC): AUC represents a performance metric that measures the overall performance of a learned binary model and is typically computed from a standard Receiver Operating Characteristic (ROC) curve. This metric is widely used to assess performance of biometric systems operating in verification mode. A poor model fit results in AUC which indicates randomness, on the other hand, a good model fit results in AUC .
- Verification Rate at the False Accept Rate of 0.1% (VER@0.1FAR): This performance measure corresponds to an operating point on the ROC curve and is computed as follows:where is the relevant decision threshold, FAR denotes the False Accept Rate, and FRR is the False Reject Rate. FAR corresponds to the percentage/fraction of times an invalid (impostor) user is accepted by the system and is calculated as follows:Similarly, FRR represents the percentage/fraction of times a valid (genuine) user is rejected by the system and is calculated as follows:
- Verification Rate at the False Accept Rate of 1% (VER@1FAR): This measure corresponds to another operating point on the ROC curve defined as follows:where denotes the relevant decision threshold.
- Equal Error Rate (EER): The last performance measure, EER, is defined with a decision threshold that ensures equal values of FAR and FRR as follows:
4.4. Training Details
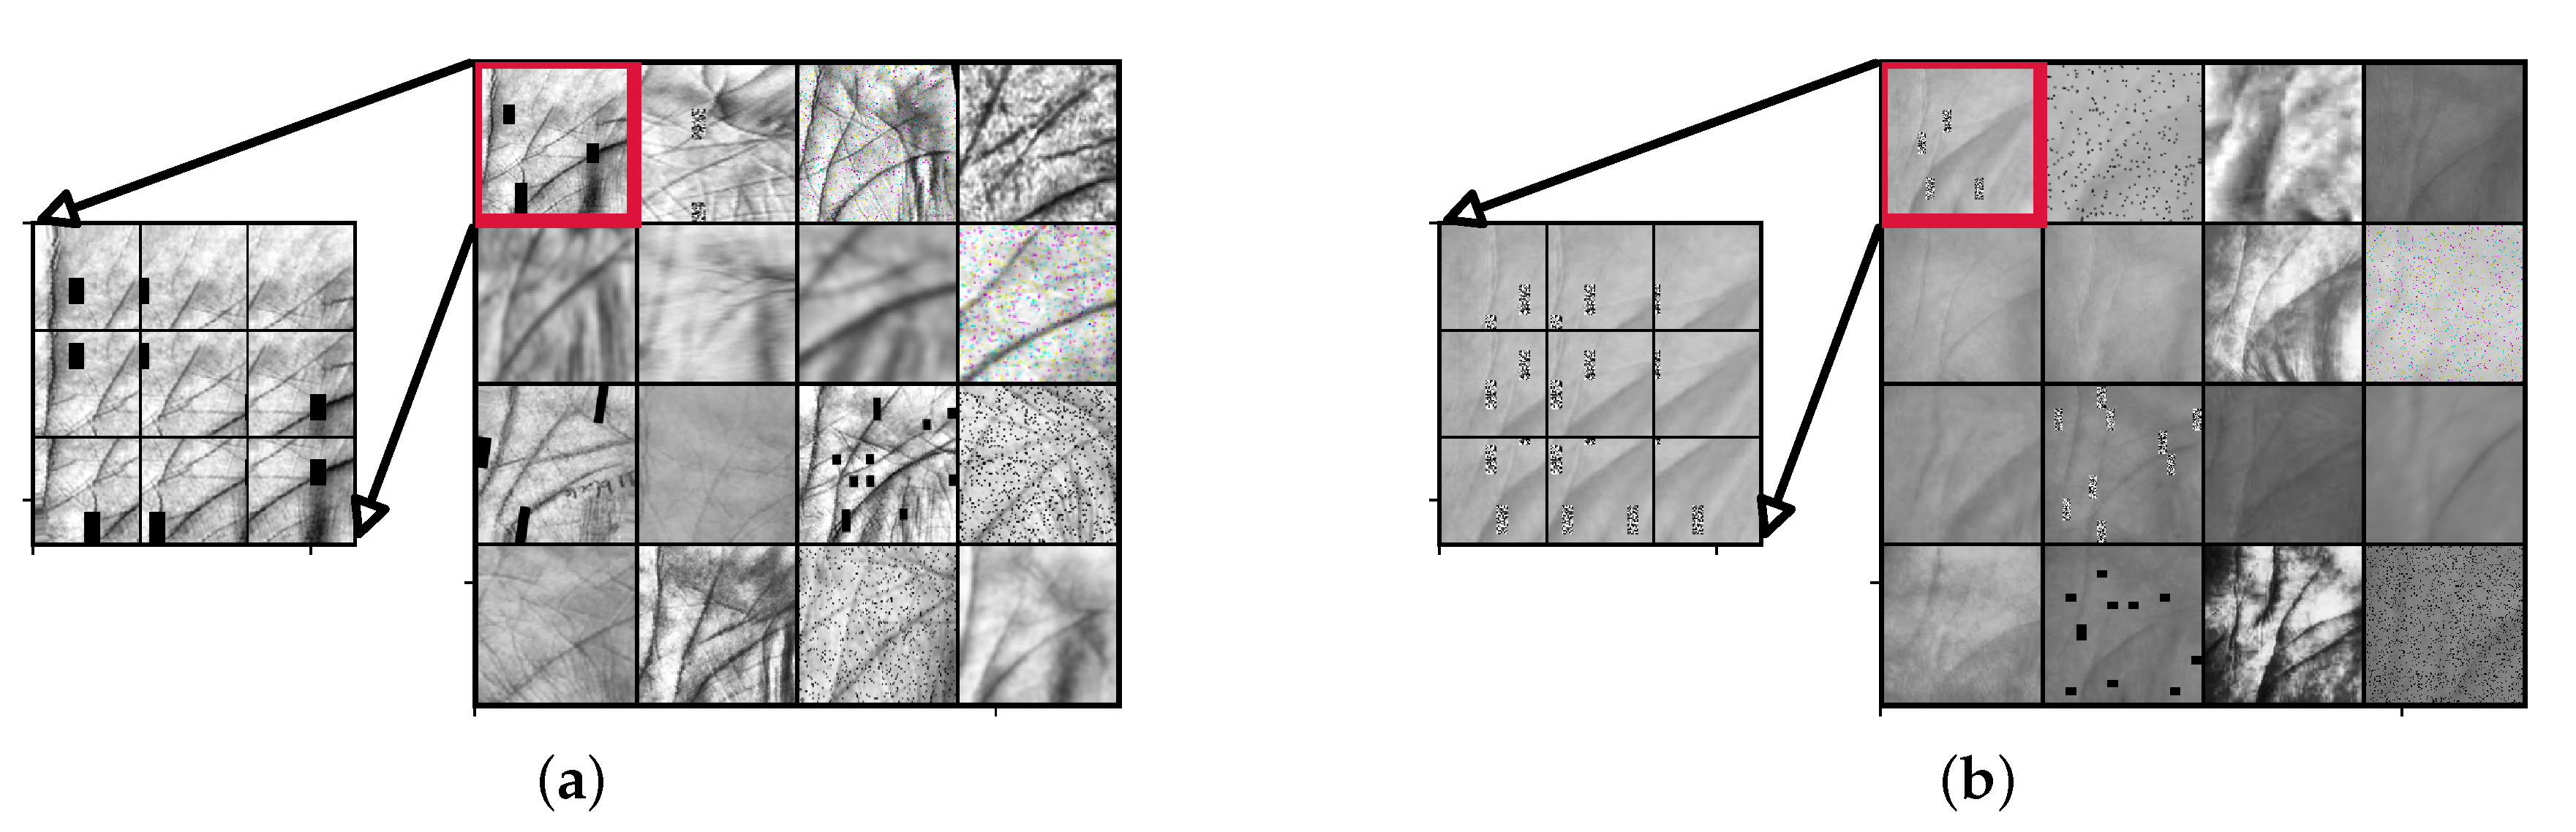
- Histogram equalization,
- Rotations in the range °,
- Random cropping (with a 50% chance), where between 5% and 30% of the original image is cropped away,
- Multiplication of all image pixels with a random value v sampled once per image in the range (0.9, 1.2),
- Application of one of the following:
- (1)
- Random corruption of p percent of all pixels within an image area by salt-and-pepper noise, where %. The size of the image area is between 2% and 20% of the size of the input image,
- (2)
- Random replacement of a certain fraction of pixels from the image with zero, with a percentage value %, with 20% per-channel probability,
- (3)
- Random replacement of rectangular masks from the image with zeros, with a percentage value %. The size of the masks is between 2% and 20% of the size of the input image,
- Application of one of the following:
- (1)
- Blurring with a Gaussian kernel with a sigma value between (),
- (2)
- Blurring using averaging over neighborhoods that have random sizes, which can vary between 5 and 11 in height and 1 and 3 in width,
- (3)
- Application of motion blur with a kernel size of pixels.
5. Quantitative Results
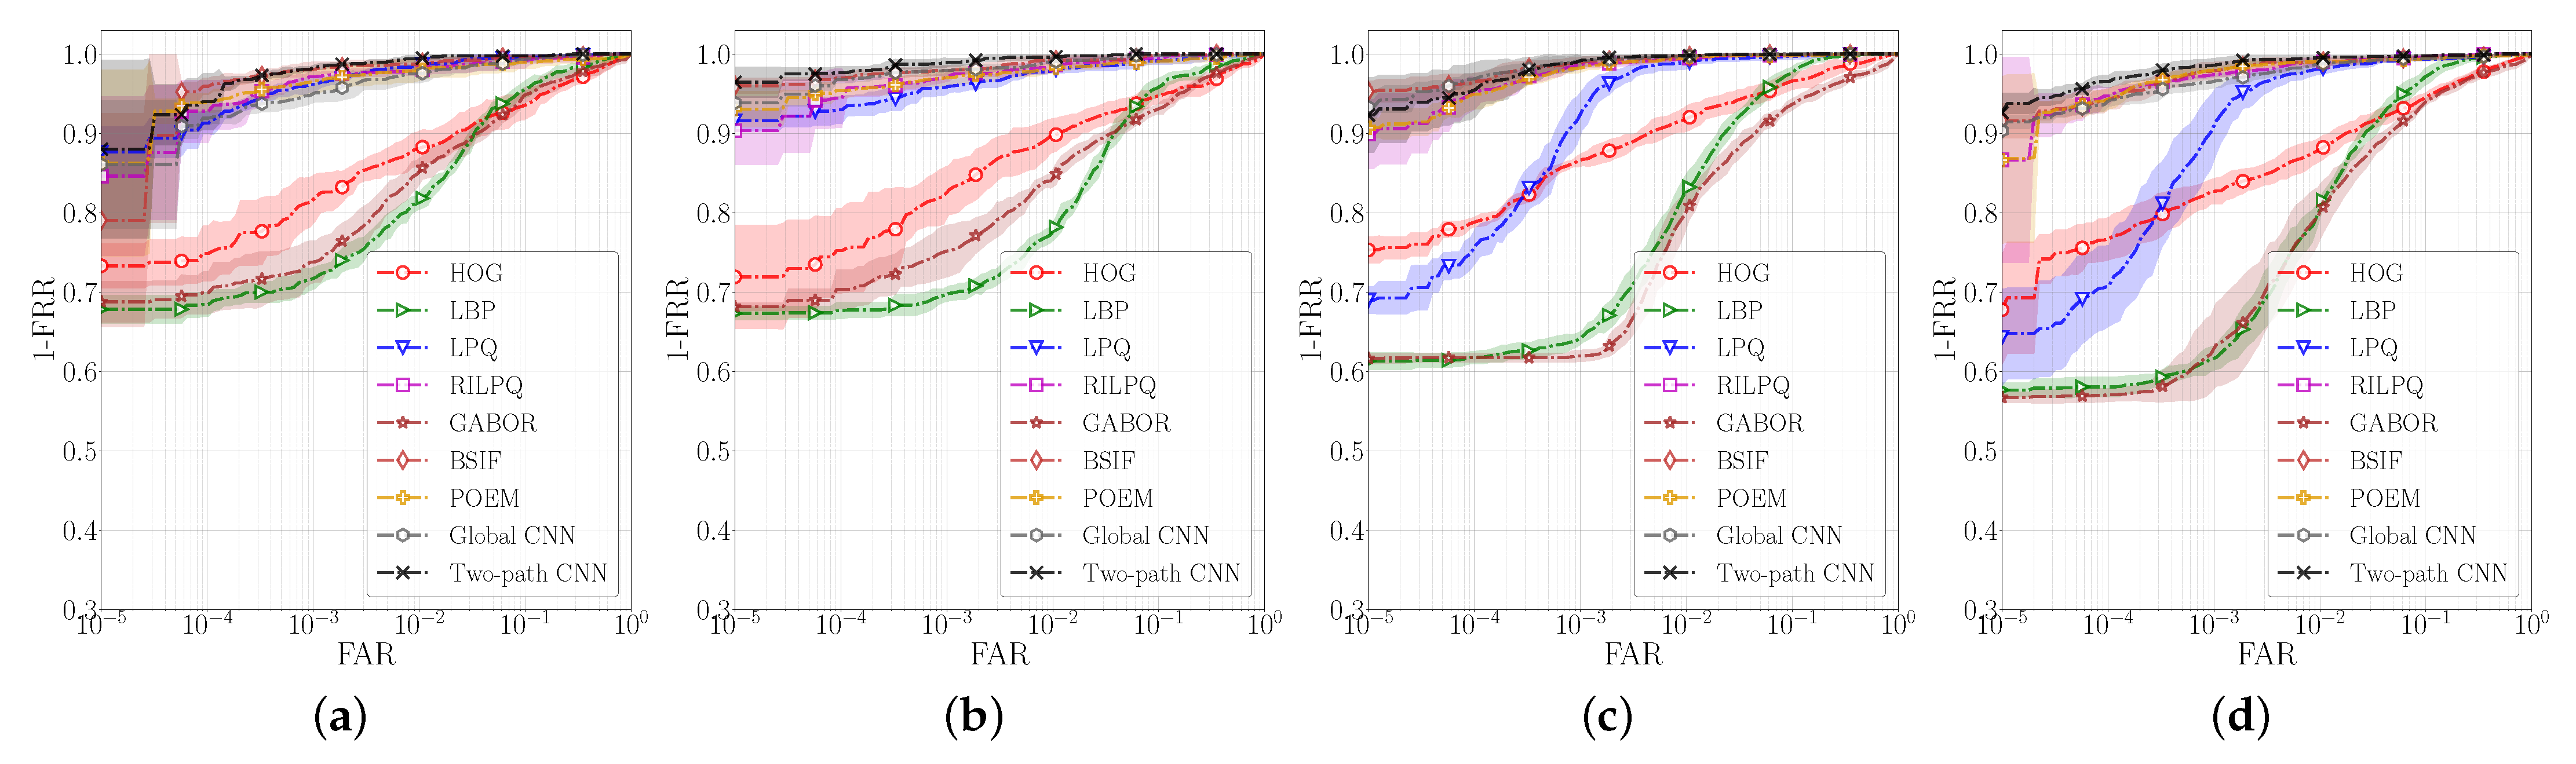
5.1. Comparison with Competing Methods
5.2. Comparison with State-of-the-Art Methods
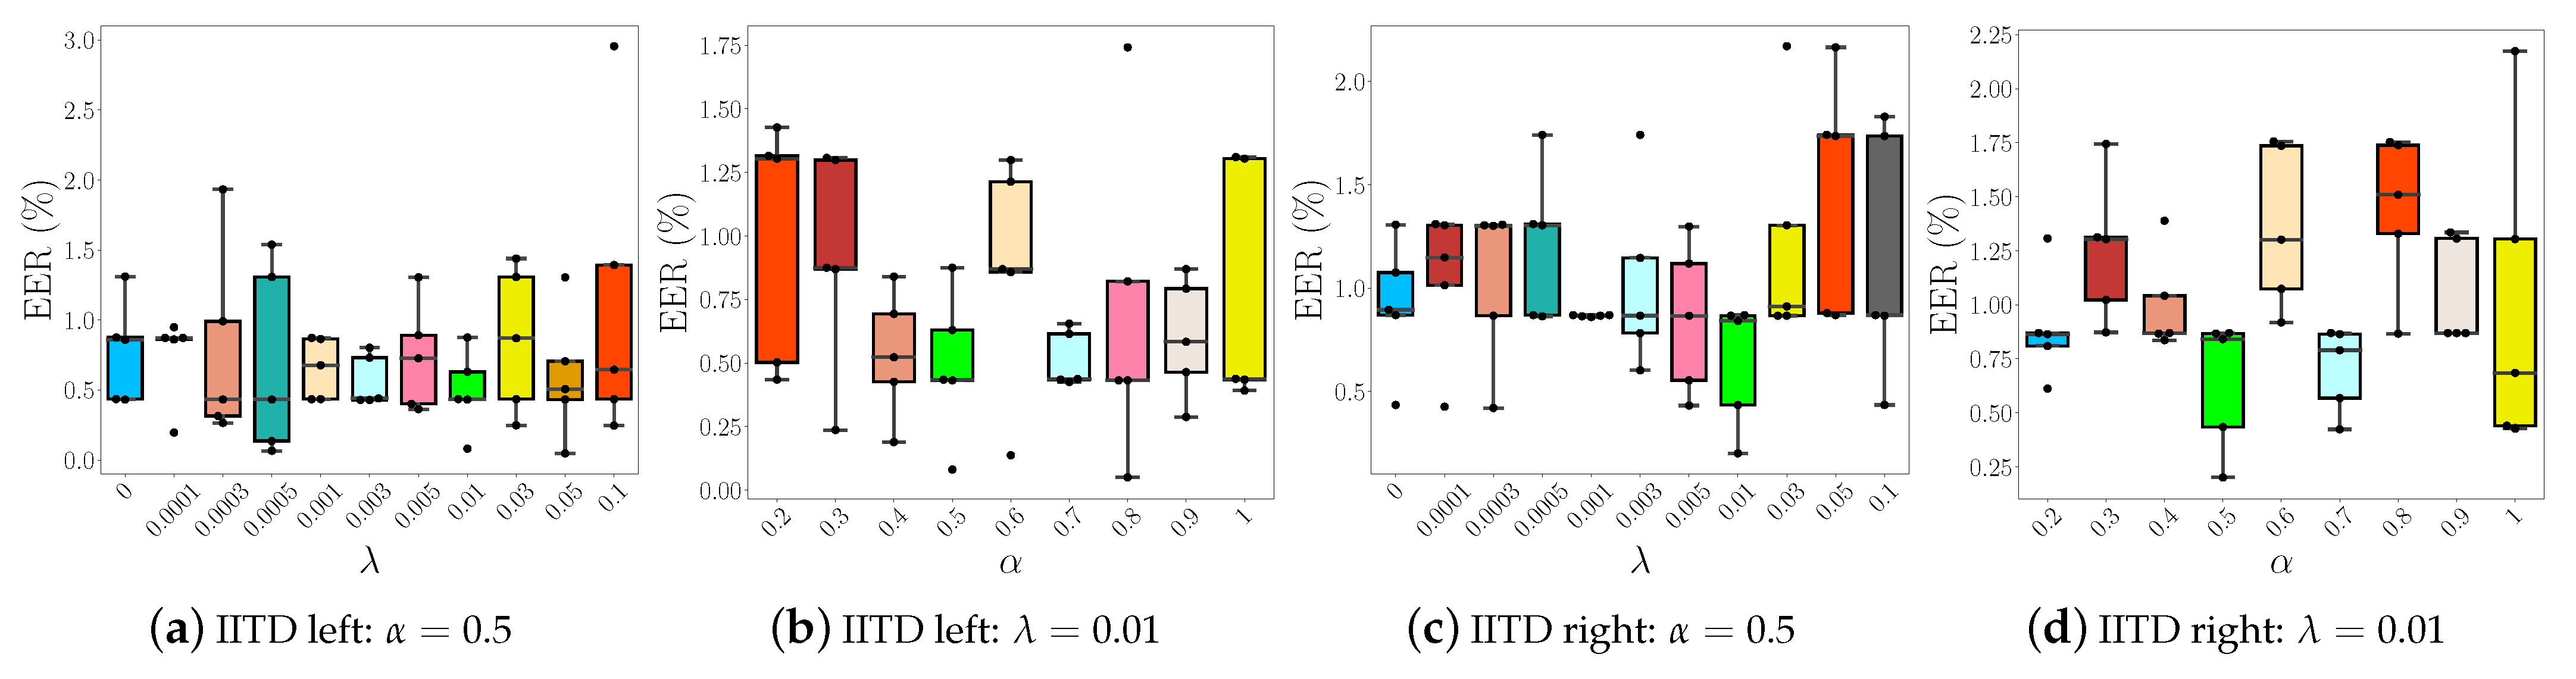
5.3. Sensitivity Analysis and Ablations
5.3.1. Impact of and Parameters
5.3.2. Contribution of Global and Local Processing Paths
5.4. Explicit Modeling of Elastic Deformations
6. Qualitative Results
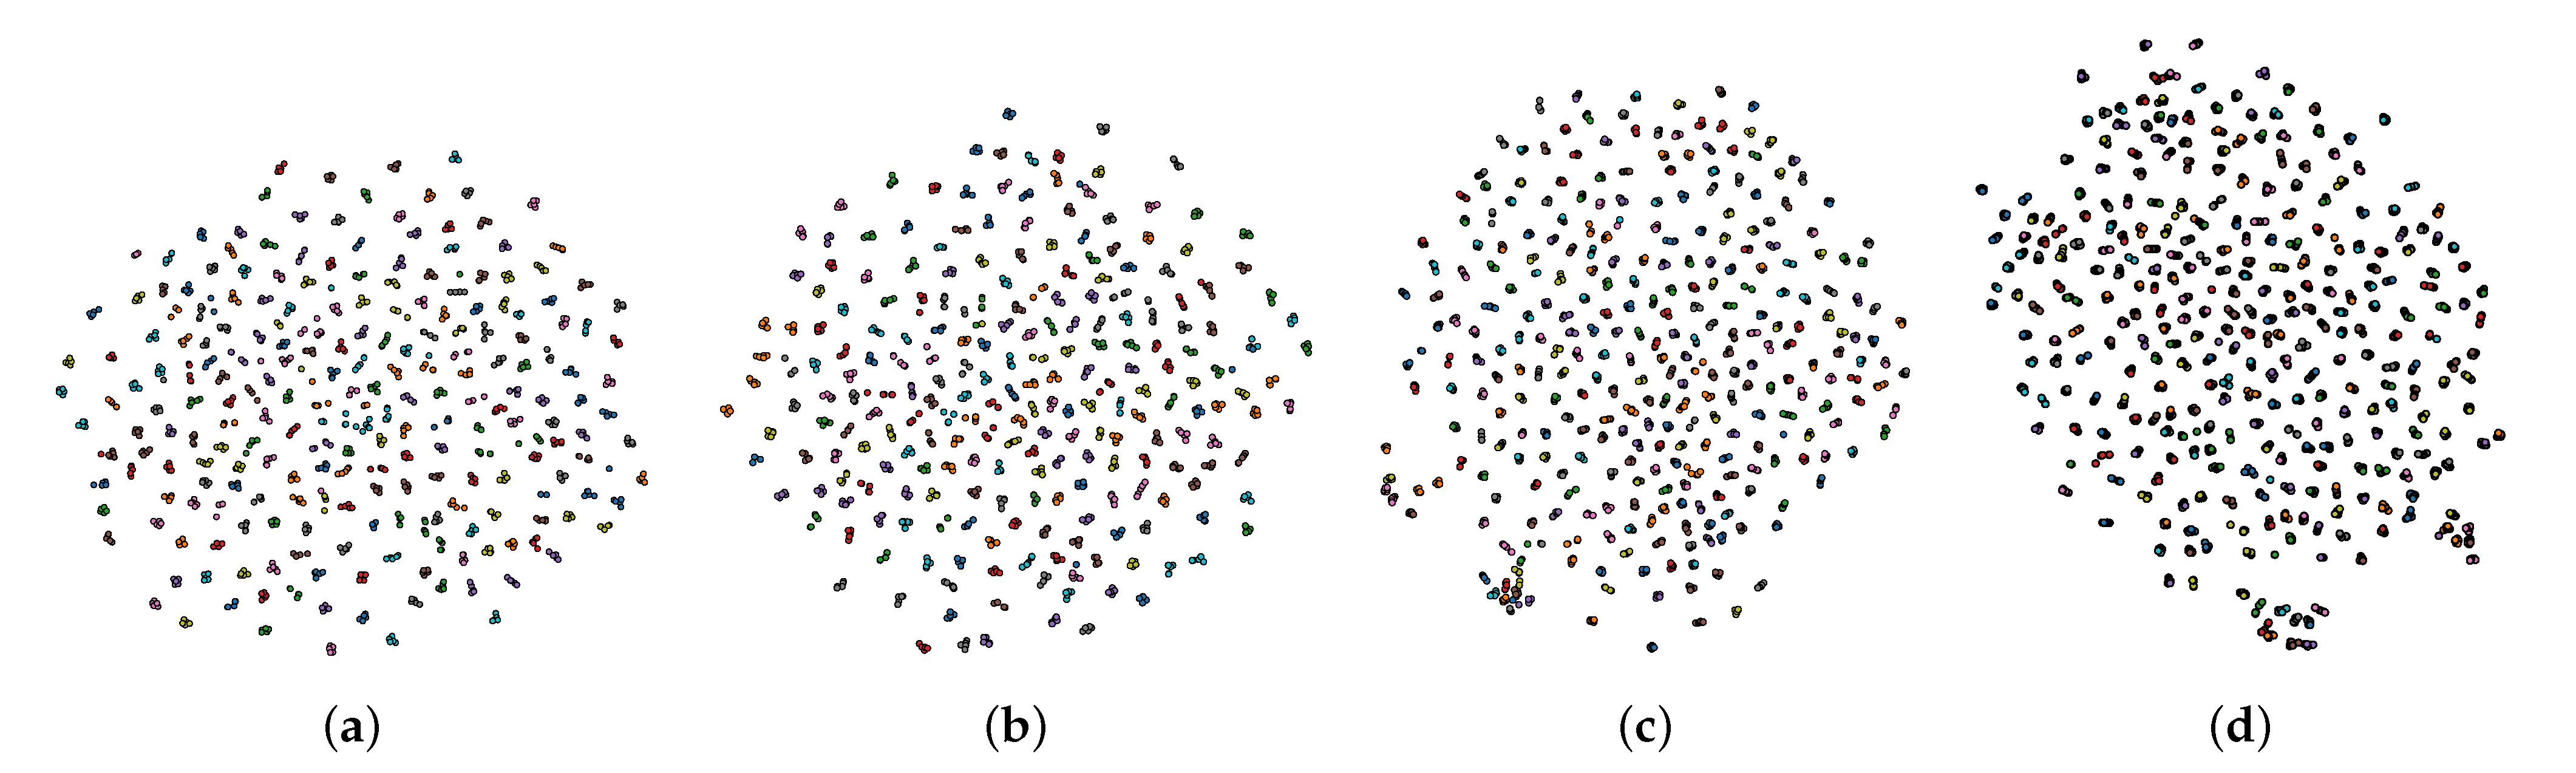
- Exploring the discriminative power of the deeply learned embeddings through the T-distributed Stochastic Neighbor Embedding (t-SNE) [54] data visualization technique,
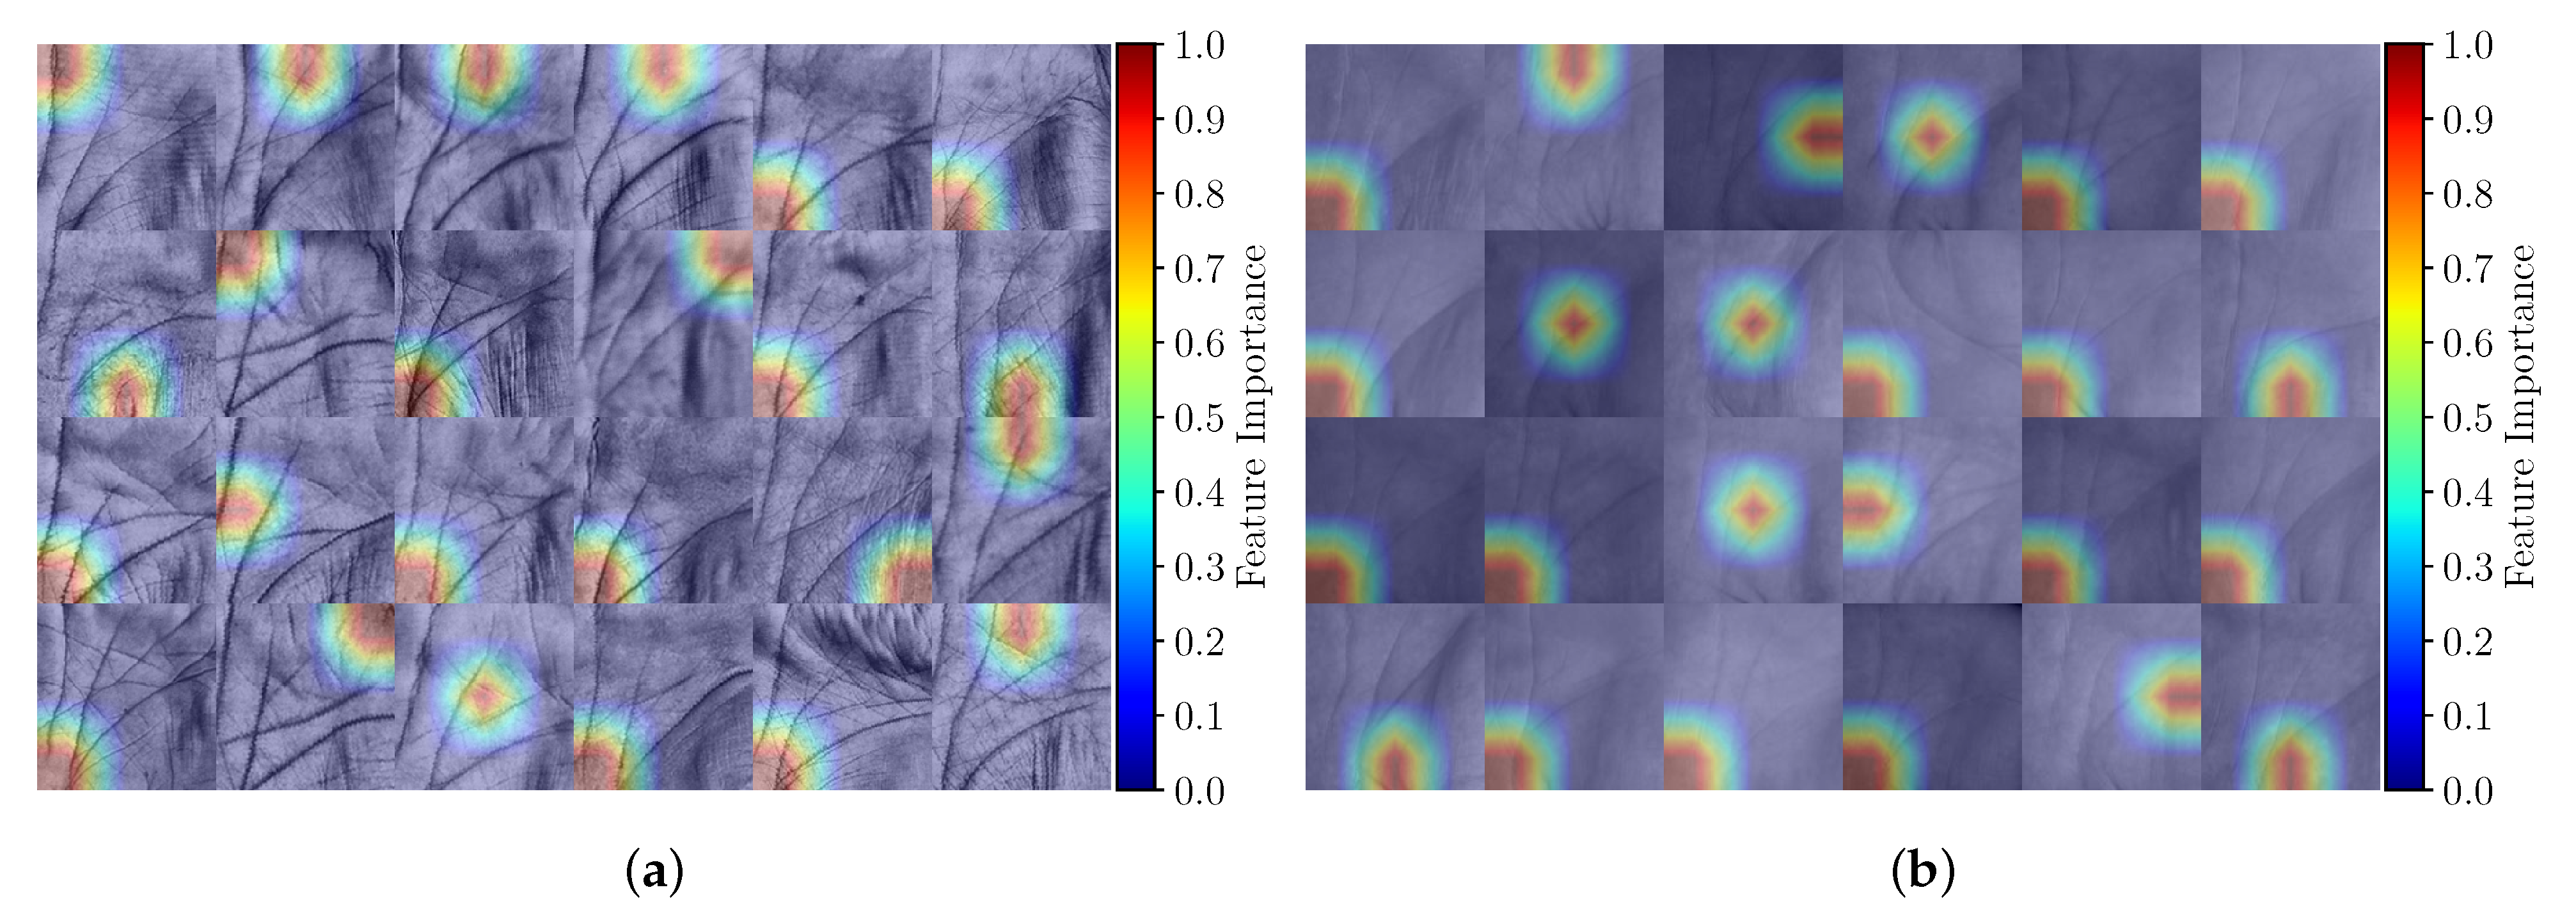
- Investigating the feature importance and attention mechanism of the Two-path architecture,
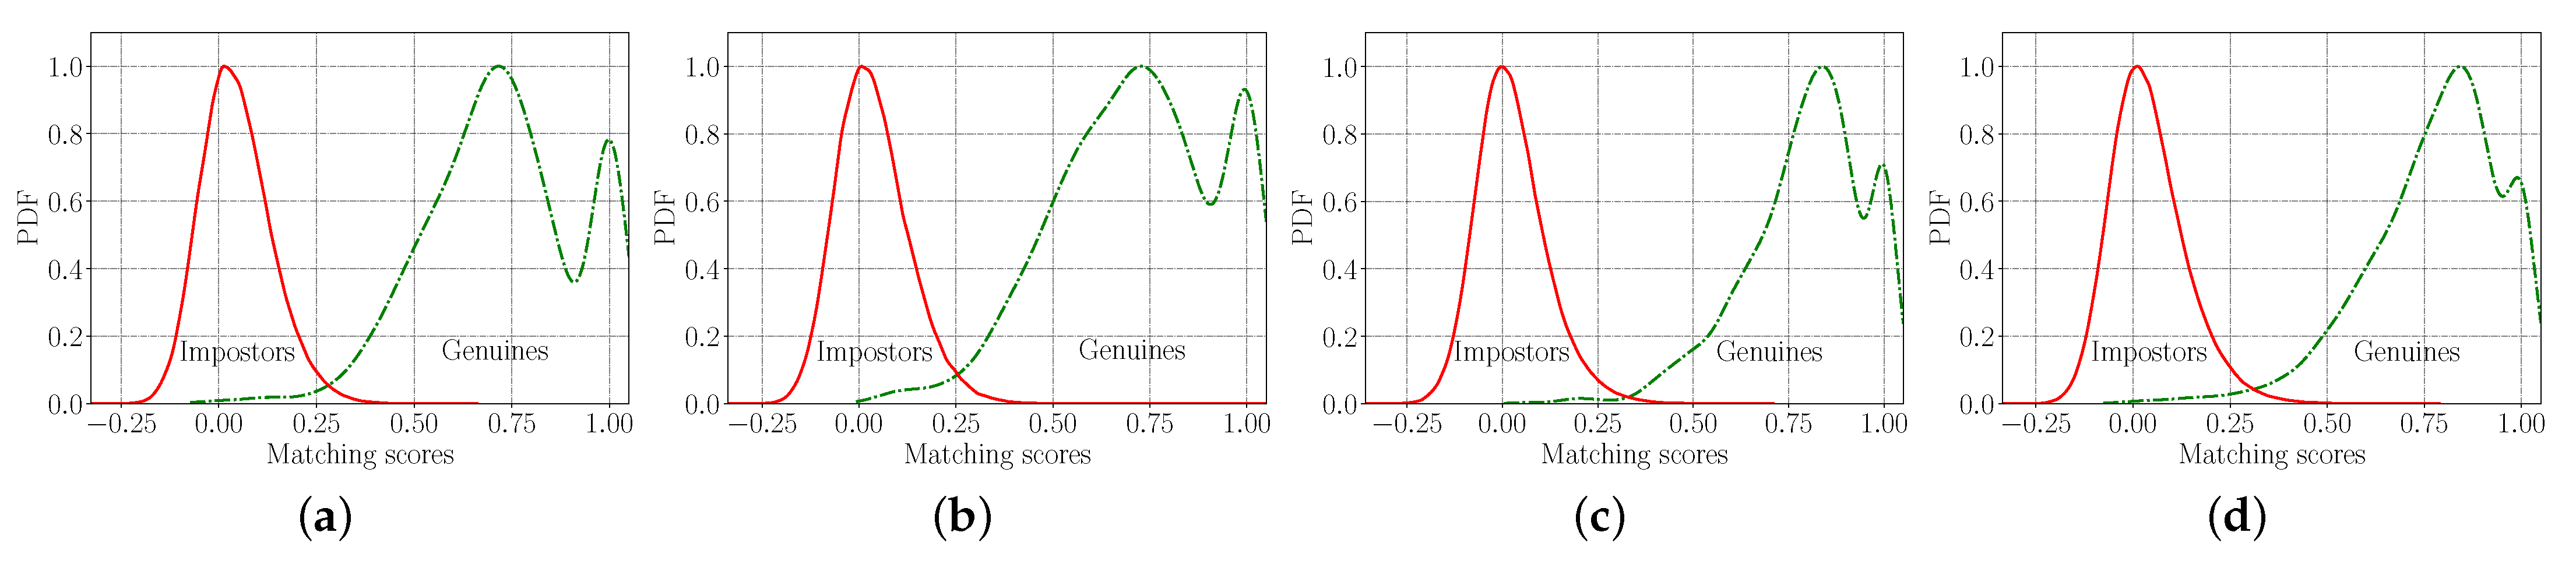
- Qualitative evaluations of edge cases generated in the verification experiments.
6.1. Embedding Visualization with t-SNE
6.2. Feature Importance and the Attention Mechanism
6.3. Verification Experiment
7. Conclusions
Author Contributions
Funding
Institutional Review Board Statement
Informed Consent Statement
Data Availability Statement
Acknowledgments
Conflicts of Interest
References
- Svoboda, J.; Masci, J.; Bronstein, M.M. Palmprint recognition via discriminative index learning. In Proceedings of the IEEE International Conference on Pattern Recognition (ICPR), Cancun, Mexico, 4–8 December 2016; pp. 4232–4237. [Google Scholar]
- Kumar, A. Toward More Accurate Matching of Contactless Palmprint Images Under Less Constrained Environments. IEEE Trans. Inf. Forensics Secur. 2019, 14, 34–47. [Google Scholar] [CrossRef]
- Štruc, V.; Pavešić, N. Phase Congruency Features for Palm-print Verification. IET Signal Process. 2009, 3, 258–268. [Google Scholar] [CrossRef] [Green Version]
- Liu, Y.; Kumar, A. Contactless Palmprint Identification Using Deeply Learned Residual Features. IEEE Trans. Biom. Behav. Identity Sci. 2020, 2, 172–181. [Google Scholar] [CrossRef]
- Zhang, L.; Li, L.; Yang, A.; Shen, Y.; Yang, M. Towards contactless palmprint recognition: A novel device, a new benchmark, and a collaborative representation based identification approach. Pattern Recognit. 2017, 69, 199–212. [Google Scholar] [CrossRef]
- Genovese, A.; Piuri, V.; Plataniotis, K.N.; Scotti, F. PalmNet: Gabor-PCA Convolutional Networks for Touchless Palmprint Recognition. IEEE Trans. Inf. Forensics Secur. 2019, 14, 3160–3174. [Google Scholar] [CrossRef] [Green Version]
- Genovese, A.; Piuri, V.; Scotti, F. Touchless Palmprint Recognition Systems; Advances in Information Security; Springer: Cham, Switzerland, 2014; Volume 60. [Google Scholar]
- Jia, W.; Hu, R.X.; Lei, Y.K.; Zhao, Y.; Gui, J. Histogram of Oriented Lines for Palmprint Recognition. IEEE Trans. Syst. Man Cybern. Syst. 2014, 44, 385–395. [Google Scholar] [CrossRef]
- Kanhangad, V.; Kumar, A.; Zhang, D. A Unified Framework for Contactless Hand Verification. IEEE Trans. Inf. Forensics Secur. 2011, 6, 1014–1027. [Google Scholar] [CrossRef]
- Michael, G.K.O.; Connie, T.; Teoh Beng Jin, A. Robust Palm Print and Knuckle Print Recognition System Using a Contactless Approach. In Proceedings of the IEEE Conference on Industrial Electronics and Applications (ICIEA), Taichung, Taiwan, 15–17 June 2010; pp. 323–329. [Google Scholar]
- Zheng, Q.; Kumar, A.; Pan, G. A 3D Feature Descriptor Recovered from a Single 2D Palmprint Image. IEEE Trans. Pattern Anal. Mach. Intell. 2016, 38, 1272–1279. [Google Scholar] [CrossRef]
- Jain, A.K.; Feng, J. Latent Palmprint Matching. IEEE Trans. Pattern Anal. Mach. Intell. 2009, 31, 1032–1047. [Google Scholar] [CrossRef] [Green Version]
- Ramachandra, R.; Raja, K.B.; Venkatesh, S.; Hegde, S.; Dandappanavar, S.D.; Busch, C. Verifying the Newborns without Infection Risks Using Contactless Palmprints. In Proceedings of the International Conference on Biometrics (ICB), Gold Coast, Australia, 20–23 February 2018; pp. 209–216. [Google Scholar]
- Zhao, S.; Zhang, B.; Philip Chen, C. Joint Deep Convolutional Feature Representation for Hyperspectral Palmprint Recognition. Inf. Sci. 2019, 489, 167–181. [Google Scholar] [CrossRef]
- Meden, B.; Rot, P.; Terhörst, P.; Damer, N.; Kuijper, A.; Scheirer, W.J.; Ross, A.; Peer, P.; Štruc, V. Privacy-Enhancing Face Biometrics: A Comprehensive Survey. IEEE Trans. Inf. Forensics Secur. 2021, 16, 4147–4183. [Google Scholar] [CrossRef]
- Rot, P.; Peer, P.; Štruc, V. PrivacyProber: Assessment and Detection of Soft—Biometric Privacy—Enhancing Techniques. IEEE Trans. Dependable Secur. Comput. 2021. under review. [Google Scholar]
- Zhong, D.; Du, X.; Zhong, K. Decade Progress of Palmprint Recognition: A Brief Survey. Neurocomputing 2019, 328, 16–28. [Google Scholar] [CrossRef]
- Fei, L.; Lu, G.; Jia, W.; Teng, S.; Zhang, D. Feature extraction methods for palmprint recognition: A survey and evaluation. IEEE Trans. Syst. Man Cybern. Syst. 2018, 49, 346–363. [Google Scholar] [CrossRef]
- Fei, L.; Zhang, B.; Jia, W.; Wen, J.; Zhang, D. Feature extraction for 3-D palmprint recognition: A survey. IEEE Trans. Instrum. Meas. 2020, 69, 645–656. [Google Scholar] [CrossRef]
- Zhang, D.; Kong, W.K.; You, J.; Wong, M. Online palmprint identification. IEEE Trans. Pattern Anal. Mach. Intell. 2003, 25, 1041–1050. [Google Scholar] [CrossRef] [Green Version]
- Zhang, D.; Guo, Z.; Lu, G.; Zhang, L.; Zuo, W. An Online System of Multispectral Palmprint Verification. IEEE Trans. Instrum. Meas. 2010, 59, 480–490. [Google Scholar] [CrossRef] [Green Version]
- Wu, X.; Zhao, Q.; Bu, W. A SIFT-Based Contactless Palmprint Verification Approach Using Iterative RANSAC and Local Palmprint Descriptors. Pattern Recognit. 2014, 47, 3314–3326. [Google Scholar] [CrossRef]
- Kumar, A. Incorporating Cohort Information for Reliable Palmprint Authentication. In Proceedings of the Indian Conference on Computer Vision, Graphics and Image Processing (ICVGIP), Bhubaneswar, India, 16–19 December 2008; pp. 583–590. [Google Scholar]
- Sun, Z.; Tan, T.; Wang, Y.; Li, S. Ordinal Palmprint Representation for Personal Identification. In Proceedings of the IEEE Conference on Computer Vision and Pattern Recognition (CVPR), San Diego, CA, USA, 20–25 June 2005; pp. 279–284. [Google Scholar]
- Charfi, N.; Trichili, H.; Alimi, A.M.; Solaiman, B. Local Invariant Representation for Multi-Instance Toucheless Palmprint Identification. In Proceedings of the IEEE International Conference on Systems, Man, and Cybernetics (SMC), Budapest, Hungary, 9–12 October 2016; pp. 3522–3527. [Google Scholar]
- Krizhevsky, A.; Sutskever, I.; Hinton, G.E. ImageNet Classification with Deep Convolutional Neural Networks. Adv. Neural Inf. Process. Syst. 2012, 25, 1106–1114. [Google Scholar] [CrossRef]
- Simonyan, K.; Zisserman, A. Very Deep Convolutional Networks for Large-Scale Image Recognition. In Proceedings of the International Conference on Learning Representations (ICLR), San Diego, CA, USA, 7–9 May 2015. [Google Scholar]
- Szegedy, C.; Liu, W.; Jia, Y.; Sermanet, P.; Reed, S.E.; Anguelov, D.; Erhan, D.; Vanhoucke, V.; Rabinovich, A. Going Deeper with Convolutions. In Proceedings of the IEEE Conference on Computer Vision and Pattern Recognition (CVPR), Boston, MA, USA, 7–12 June 2015; pp. 1–9. [Google Scholar]
- He, K.; Zhang, X.; Ren, S.; Sun, J. Deep Residual Learning for Image Recognition. In Proceedings of the IEEE Conference on Computer Vision and Pattern Recognition (CVPR), Las Vegas, NV, USA, 27–30 June 2016. [Google Scholar]
- Deng, J.; Dong, W.; Socher, R.; Li, L.J.; Li, K.; Fei-Fei, L. ImageNet: A Large-Scale Hierarchical Image Database. In Proceedings of the IEEE Conference on Computer Vision and Pattern Recognition (CVPR), Miami, FL, USA, 20–25 June 2009; pp. 248–255. [Google Scholar]
- Zhu, J.; Zhong, D.; Luo, K. Boosting Unconstrained Palmprint Recognition With Adversarial Metric Learning. IEEE Trans. Biom. Behav. Identity Sci. 2020, 2, 388–398. [Google Scholar] [CrossRef]
- Emeršič, Ž.; Meden, B.; Peer, P.; Štruc, V. Evaluation and Analysis of Ear Recognition Models: Performance, Complexity and Resource Requirements. Neural Comput. Appl. 2020, 32, 15785–15800. [Google Scholar] [CrossRef]
- Emeršič, Ž.; Štepec, D.; Štruc, V.; Peer, P. Training Convolutional Neural Networks with Limited Training Data for Ear Recognition in the Wild. In Proceedings of the IEEE International Conference on Automatic Faceand Gesture Recognition and Workshops (FG), Washington, DC, USA, 30 May–3 June 2017. [Google Scholar]
- Deng, J.; Guo, J.; Xue, N.; Zafeiriou, S. ArcFace: Additive Angular Margin Loss for Deep Face Recognition. In Proceedings of the IEEE Conference on Computer Vision and Pattern Recognition (CVPR), Long Beach, CA, USA, 15–20 June 2019; pp. 4685–4694. [Google Scholar]
- Wang, H.; Wang, Y.; Zhou, Z.; Ji, X.; Gong, D.; Zhou, J.; Li, Z.; Liu, W. CosFace: Large Margin Cosine Loss for Deep Face Recognition. In Proceedings of the IEEE Conference on Computer Vision and Pattern Recognition (CVPR), Salt Lake City, UT, USA, 18–23 June 2018; pp. 5265–5274. [Google Scholar]
- Wen, Y.; Zhang, K.; Li, Z.; Qiao, Y. A Discriminative Feature Learning Approach for Deep Face Recognition. In Proceedings of the European Conference on Computer Vision (ECCV), Amsterdam, The Netherlands, 11–14 October 2016; pp. 499–515. [Google Scholar]
- Štepec, D.; Emeršič, Ž.; Peer, P.; Štruc, V. Constellation-Based Deep Ear Recognition. In Deep Biometrics; Springer: Cham, Switzerland, 2020; pp. 161–190. [Google Scholar]
- Rot, P.; Vitek, M.; Grm, K.; Emeršič, Ž.; Peer, P.; Štruc, V. Deep Sclera Segmentation and Recognition. In Handbook of Vascular Biometrics; Springer: Cham, Switzerland, 2020; pp. 395–432. [Google Scholar]
- Vitek, M.; Rot, P.; Štruc, V.; Peer, P. A Comprehensive Investigation into Sclera Biometrics: A Novel Dataset and Performance Study. Neural Comput. Appl. 2020, 32, 17941–17955. [Google Scholar] [CrossRef]
- Emeršič, Ž.; Štruc, V.; Peer, P. Ear Recognition: More Than a Survey. Neurocomputing 2017, 255, 26–39. [Google Scholar] [CrossRef] [Green Version]
- Shao, H.; Zhong, D. Towards open-set touchless palmprint recognition via weight-based meta metric learning. Pattern Recognit. 2022, 121, 108247. [Google Scholar] [CrossRef]
- Ojala, T.; Pietikainen, M.; Harwood, D. Performance Evaluation of Texture Measures with Classification Based on Kullback Discrimination of Distributions. In Proceedings of the IEEE International Conference on Pattern Recognition (ICPR), Jerusalem, Israel, 9–13 October 1994; Volume 1, pp. 582–585. [Google Scholar]
- Ojansivu, V.; Rahtu, E.; Heikkila, J. Rotation Invariant Local Phase Quantization for Blur Insensitive Texture Analysis. In Proceedings of the IEEE International Conference on Pattern Recognition (ICPR), Tampa, FL, USA, 8–11 December 2008; pp. 1–4. [Google Scholar]
- Ojansivu, V.; Heikkilä, J. Blur Insensitive Texture Classification Using Local Phase Quantization. In Proceedings of the International Conference on Image and Signal Processing, 3rd International Conference, ICISP 2008, Cherbourg-Octeville, France, 1–3 July 2008; pp. 236–243. [Google Scholar]
- Dalal, N.; Triggs, B. Histograms of Oriented Gradients for Human Detection. In Proceedings of the IEEE Conference on Computer Vision and Pattern Recognition (CVPR), San Diego, CA, USA, 20–25 June 2005; Volume 1, pp. 886–893. [Google Scholar]
- Kannala, J.; Rahtu, E. BSIF: Binarized Statistical Image Features. In Proceedings of the IEEE International Conference on Pattern Recognition (ICPR), Tsukuba, Japan, 11–15 November 2012; pp. 1363–1366. [Google Scholar]
- Vu, N.S.; Dee, H.; Caplier, A. Face Recognition Using the POEM Descriptor. Pattern Recognit. 2012, 45, 2478–2488. [Google Scholar] [CrossRef]
- Kin Kong, W.; Zhang, D.; Wenxin, L. Palmprint Feature Extraction Using 2-D Gabor Filters. Pattern Recognit. 2003, 36, 2339–2347. [Google Scholar] [CrossRef]
- Jaderberg, M.; Simonyan, K.; Zisserman, A.; Kavukcuoglu, K. Spatial Transformer Networks. In Proceedings of the International Conference on Neural Information Processing Systems (NIPS), Montreal, QC, Canada, 7–12 December 2015; Volume 28, pp. 2017–2025. [Google Scholar]
- Dai, J.; Qi, H.; Xiong, Y.; Li, Y.; Zhang, G.; Hu, H.; Wei, Y. Deformable Convolutional Networks. In Proceedings of the IEEE International Conference on Computer Vision (ICCV), Venice, Italy, 22–29 October 2017; pp. 764–773. [Google Scholar]
- Johnson, H.J.; Christensen, G.E. Landmark and Intensity-Based, Consistent Thin-Plate Spline Image Registration. In Proceedings of the International Conference on Information Processing in Medical Imaging (IPMI), Davis, CA, USA, 18–22 June 2001; pp. 329–343. [Google Scholar]
- Ross, A.; Dass, S.; Jain, A. Fingerprint Warping Using Ridge Curve Correspondences. IEEE Trans. Pattern Anal. Mach. Intell. 2006, 28, 19–30. [Google Scholar] [CrossRef] [Green Version]
- Babich, G.; Camps, O. Weighted Parzen Windows for Pattern Classification. IEEE Trans. Pattern Anal. Mach. Intell. 1996, 18, 567–570. [Google Scholar] [CrossRef]
- van der Maaten, L.; Hinton, G. Visualizing Data Using t-SNE. J. Mach. Learn. Res. 2008, 9, 2579–2605. [Google Scholar]
- Zhong, D.; Zhu, J. Centralized Large Margin Cosine Loss for Open-Set Deep Palmprint Recognition. IEEE Trans. Circuits Syst. Video Technol. 2020, 30, 1559–1568. [Google Scholar] [CrossRef]


| Layer Abbreviation | Type of Layer | Output Dimensions |
|---|---|---|
| Input | 4096 | |
| FC | Fully Connected | 4096 |
| Bn | Batch Normalization | 2048 |
| ReLU | Activation Function | 2048 |
| FC | Fully Connected | 2048 |
| Bn | Batch Normalization | 1024 |
| Normalization | 1024 |
| Dataset | Palm | |
|---|---|---|
| Left | Right | |
| IITD (min. samples per class) | min = 5 | min = 5 |
| Initial numbers | 1300 | 1301 |
| After undersampling | 1150 | 1150 |
| CASIA (min. samples per class) | min = 6 | min = 7 |
| Initial numbers | 2728 | 2739 |
| After undersampling | 1806 | 2107 |
| Method | HOG [45] | LBP [42] | LPQ [44] | RILPQ [43] | Gabor [48] | BSIF [46] | POEM [47] | Global (Ours) | Two-Path (Ours) |
|---|---|---|---|---|---|---|---|---|---|
| Evaluated on the Left Palmprints from IITD Dataset | |||||||||
| EER | |||||||||
| AUC | |||||||||
| VER@0.1FAR | |||||||||
| VER@1FAR | |||||||||
| Evaluated on the Right Palmprints from IITD Dataset | |||||||||
| EER | |||||||||
| AUC | |||||||||
| VER@0.1FAR | |||||||||
| VER@1FAR | |||||||||
| Evaluated on the Left Palmprints from CASIA Dataset | |||||||||
| EER | |||||||||
| AUC | |||||||||
| VER@0.1FAR | |||||||||
| VER@1FAR | |||||||||
| Evaluated on the Right Palmprints from CASIA Dataset | |||||||||
| EER | |||||||||
| AUC | |||||||||
| VER@0.1FAR | |||||||||
| VER@1FAR | |||||||||
| Setting | Method | EER (in %) |
|---|---|---|
| Protocol from [4,11,41] | DoN [11] | 1.391 |
| RFN-SSTL [4] | 0.600 | |
| W2ML [41] | 2.330 | |
| Two-Path CNN (ours) | 0.701 | |
| Code from [31] | AML_N-Pair [31] | 1.690 |
| Two-Path CNN (ours) | 0.910 |
| Type of Descriptor | Global | Local | Two-Path (Combined) |
|---|---|---|---|
| Evaluated on the Left Palmprints from IITD Dataset | |||
| EER | |||
| AUC | |||
| VER@0.1FAR | |||
| VER@1FAR | |||
| Evaluated on the Right Palmprints from IITD Dataset | |||
| EER | |||
| AUC | |||
| VER@01FAR | |||
| VER@1FAR | |||
| Evaluated on the Left Palmprints from CASIA Dataset | |||
| EER | |||
| AUC | |||
| VER@0.1FAR | |||
| VER@1FAR | |||
| Evaluated on the Right Palmprints from CASIA Dataset | |||
| EER | |||
| AUC | |||
| VER@0.1FAR | |||
| VER@1FAR | |||
| TP | FN | FP | TN | TP | FN | FP | TN |
|---|---|---|---|---|---|---|---|
| IITD right palmprints, | CASIA right palmprints, | ||||||
 | 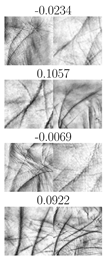 | 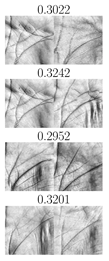 |  | 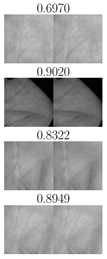 | 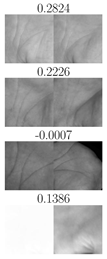 |  | 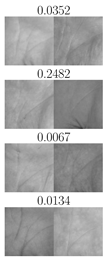 |
| IITD left palmprints, | CASIA left palmprints, | ||||||
 |  |  | 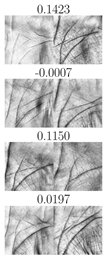 | 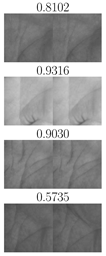 | 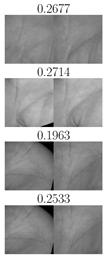 | 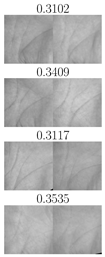 | 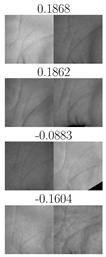 |
Publisher’s Note: MDPI stays neutral with regard to jurisdictional claims in published maps and institutional affiliations. |
© 2021 by the authors. Licensee MDPI, Basel, Switzerland. This article is an open access article distributed under the terms and conditions of the Creative Commons Attribution (CC BY) license (https://creativecommons.org/licenses/by/4.0/).
Share and Cite
Stoimchev, M.; Ivanovska, M.; Štruc, V. Learning to Combine Local and Global Image Information for Contactless Palmprint Recognition. Sensors 2022, 22, 73. https://doi.org/10.3390/s22010073
Stoimchev M, Ivanovska M, Štruc V. Learning to Combine Local and Global Image Information for Contactless Palmprint Recognition. Sensors. 2022; 22(1):73. https://doi.org/10.3390/s22010073
Chicago/Turabian StyleStoimchev, Marjan, Marija Ivanovska, and Vitomir Štruc. 2022. "Learning to Combine Local and Global Image Information for Contactless Palmprint Recognition" Sensors 22, no. 1: 73. https://doi.org/10.3390/s22010073
APA StyleStoimchev, M., Ivanovska, M., & Štruc, V. (2022). Learning to Combine Local and Global Image Information for Contactless Palmprint Recognition. Sensors, 22(1), 73. https://doi.org/10.3390/s22010073