
Thermal Face Verification through Identification


Abstract
1. Introduction
- -
- A new approach for face verification called verification through identification;
- -
- The use of VTI for thermal face verification;
- -
- Evaluation of existing state-of-the-art methods for face verification in the thermal infrared domain.
2. Related Works
3. Methodology
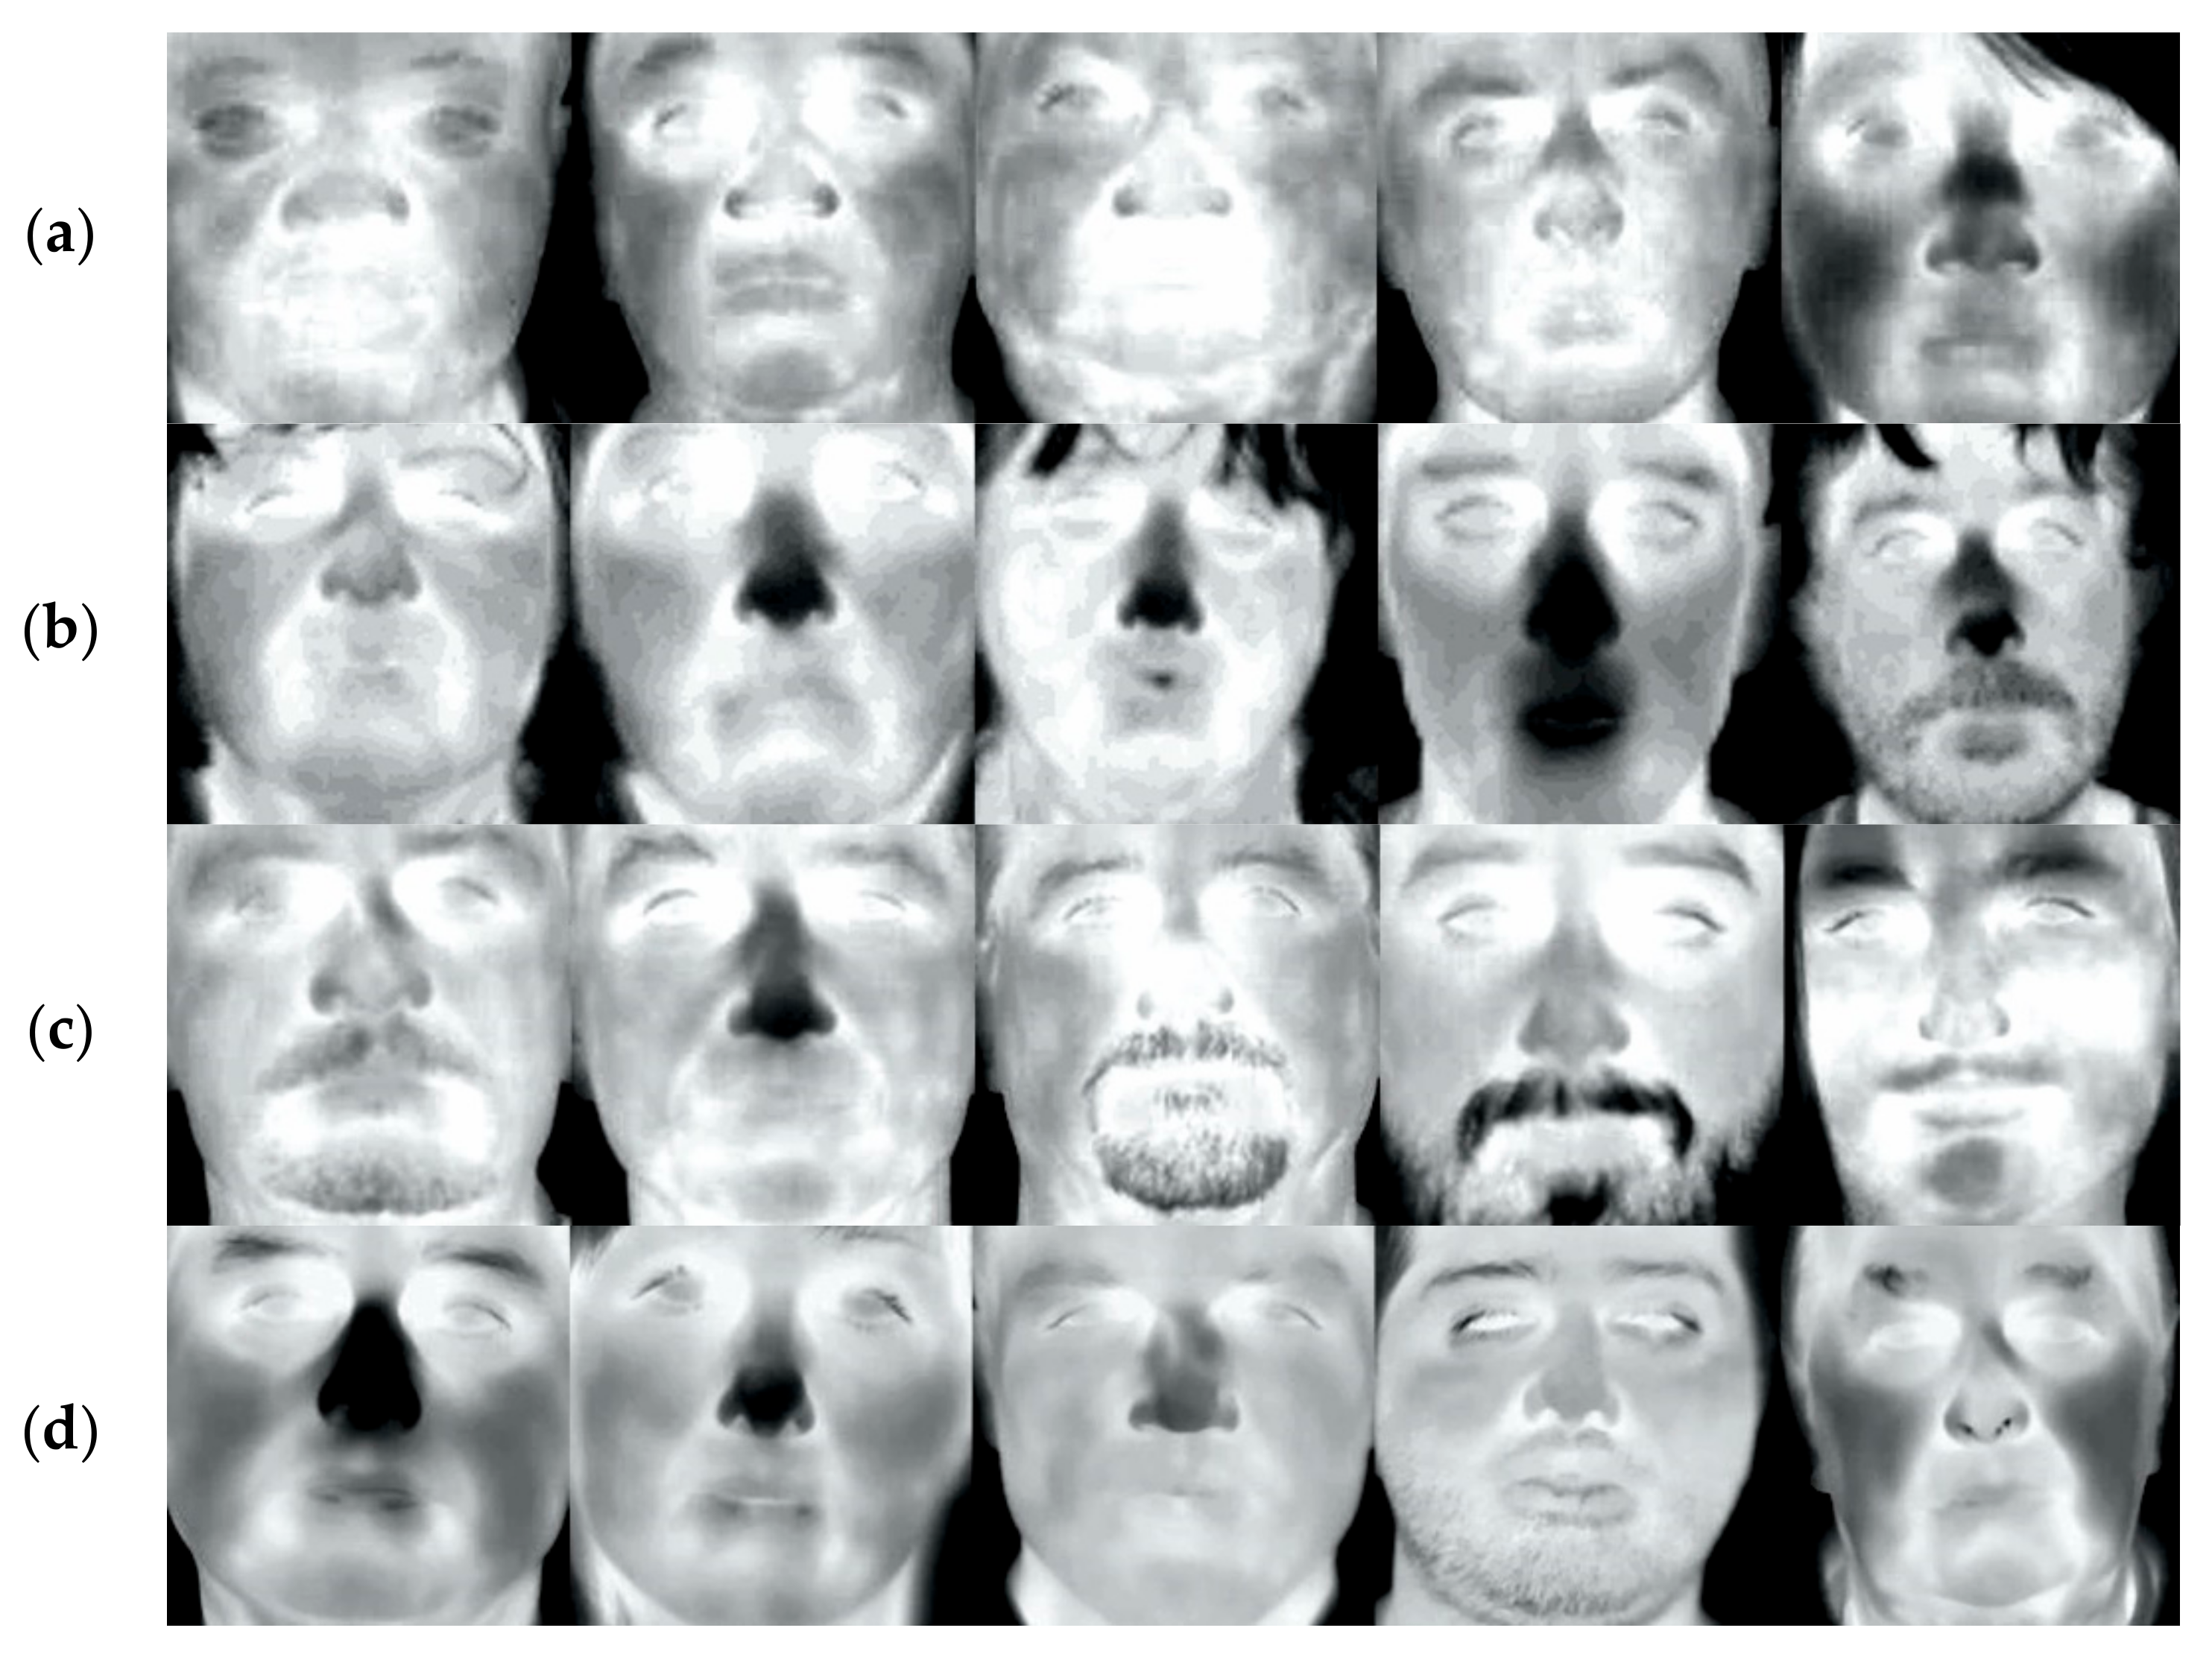
3.1. Dataset
3.1.1. In-House Database
3.1.2. CARL Database
3.1.3. PROTECT Multimodal DB
3.2. Baseline Methods
3.2.1. Feature Extraction Methods
3.2.2. Decision Functions
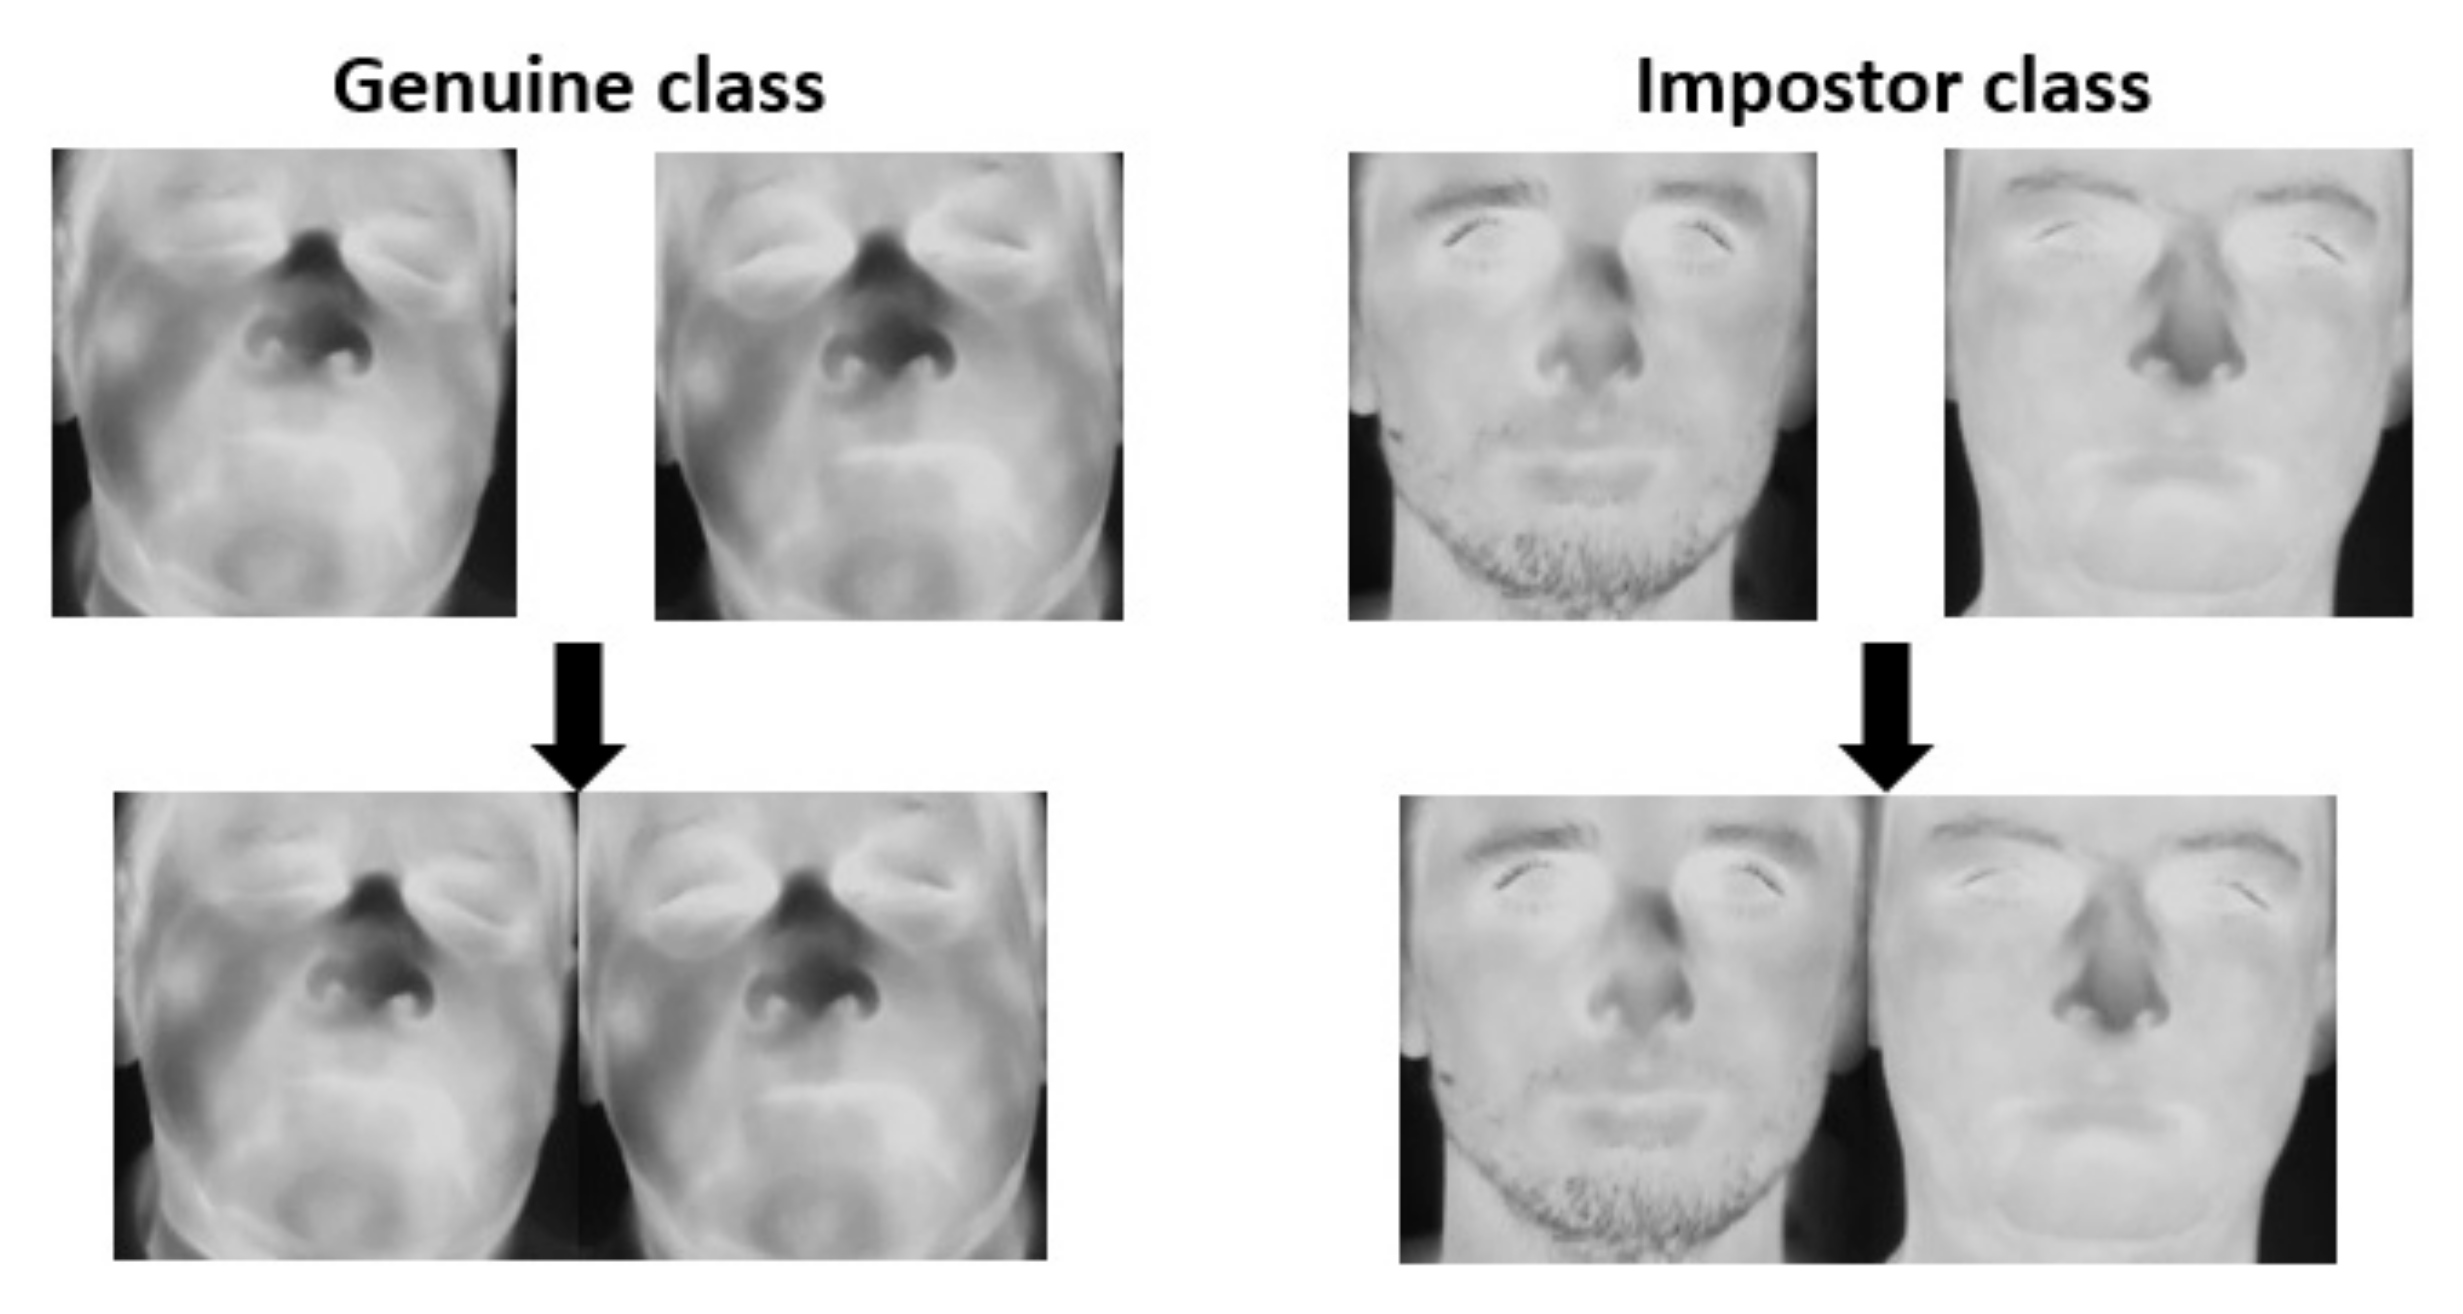
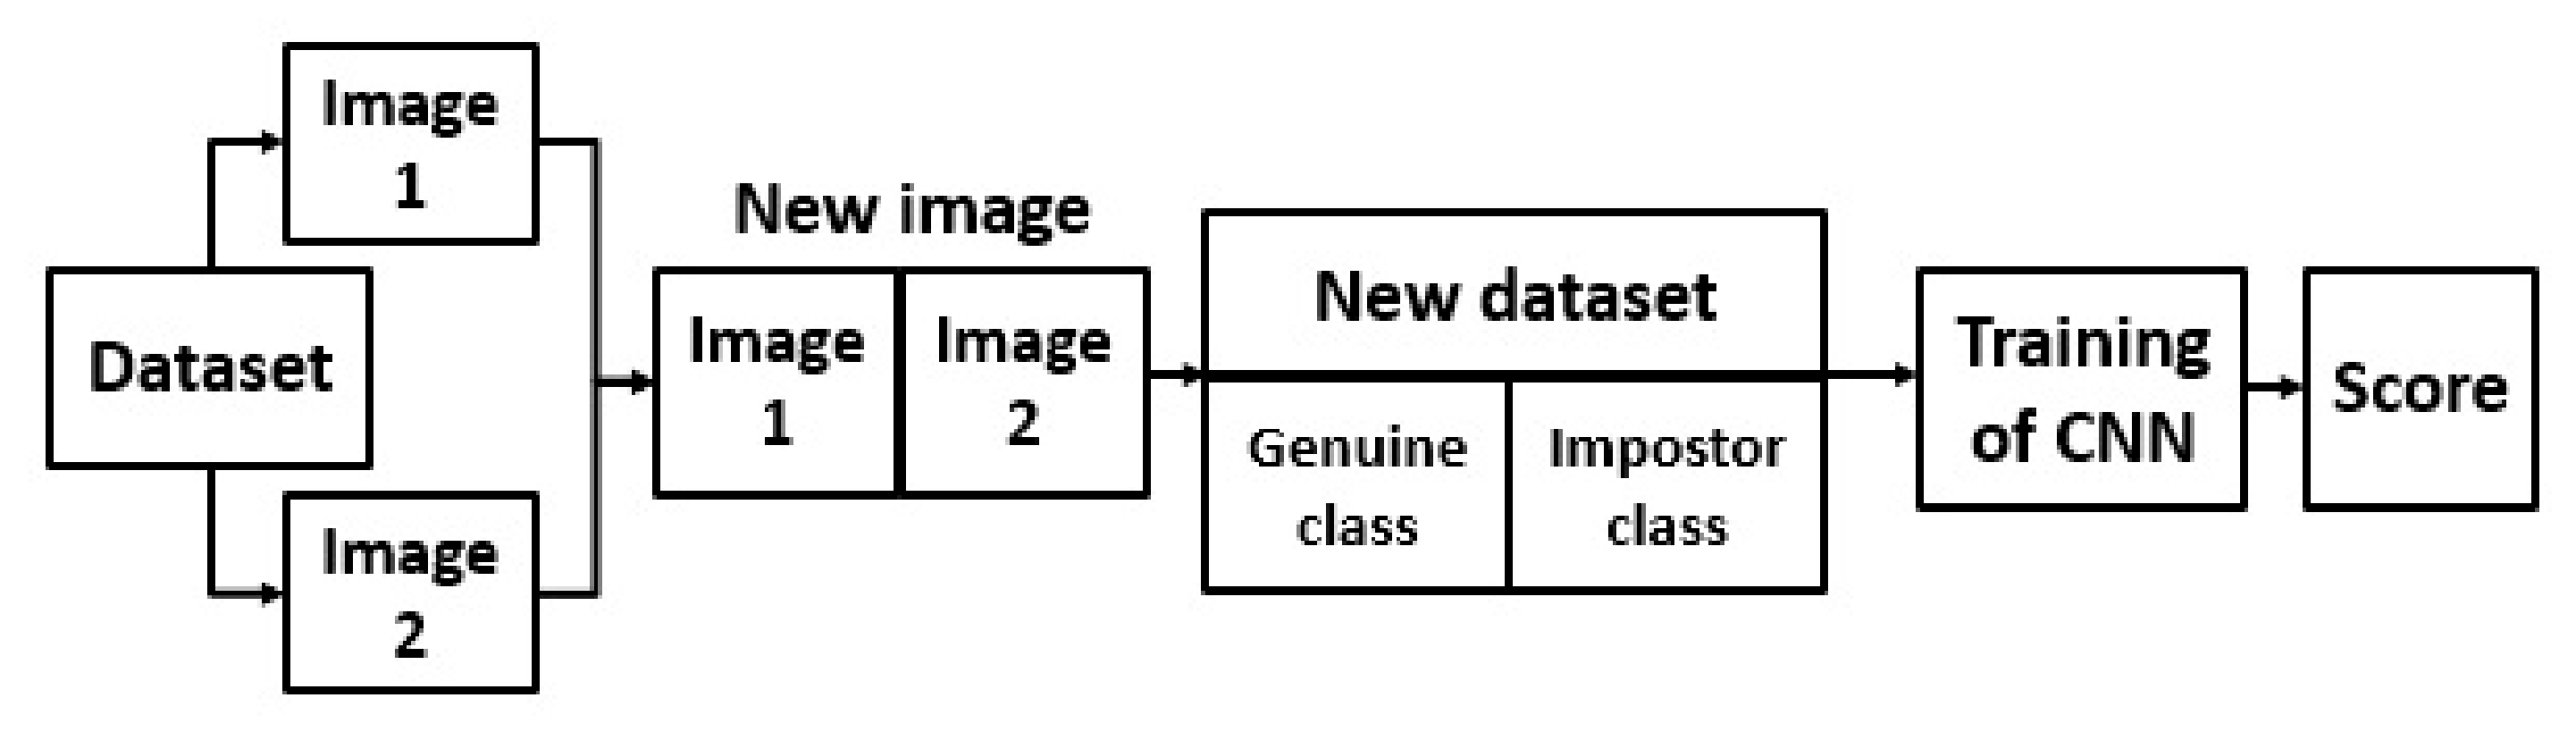
4. Verification through Identification
5. Results and Discussion
5.1. Baseline Methods
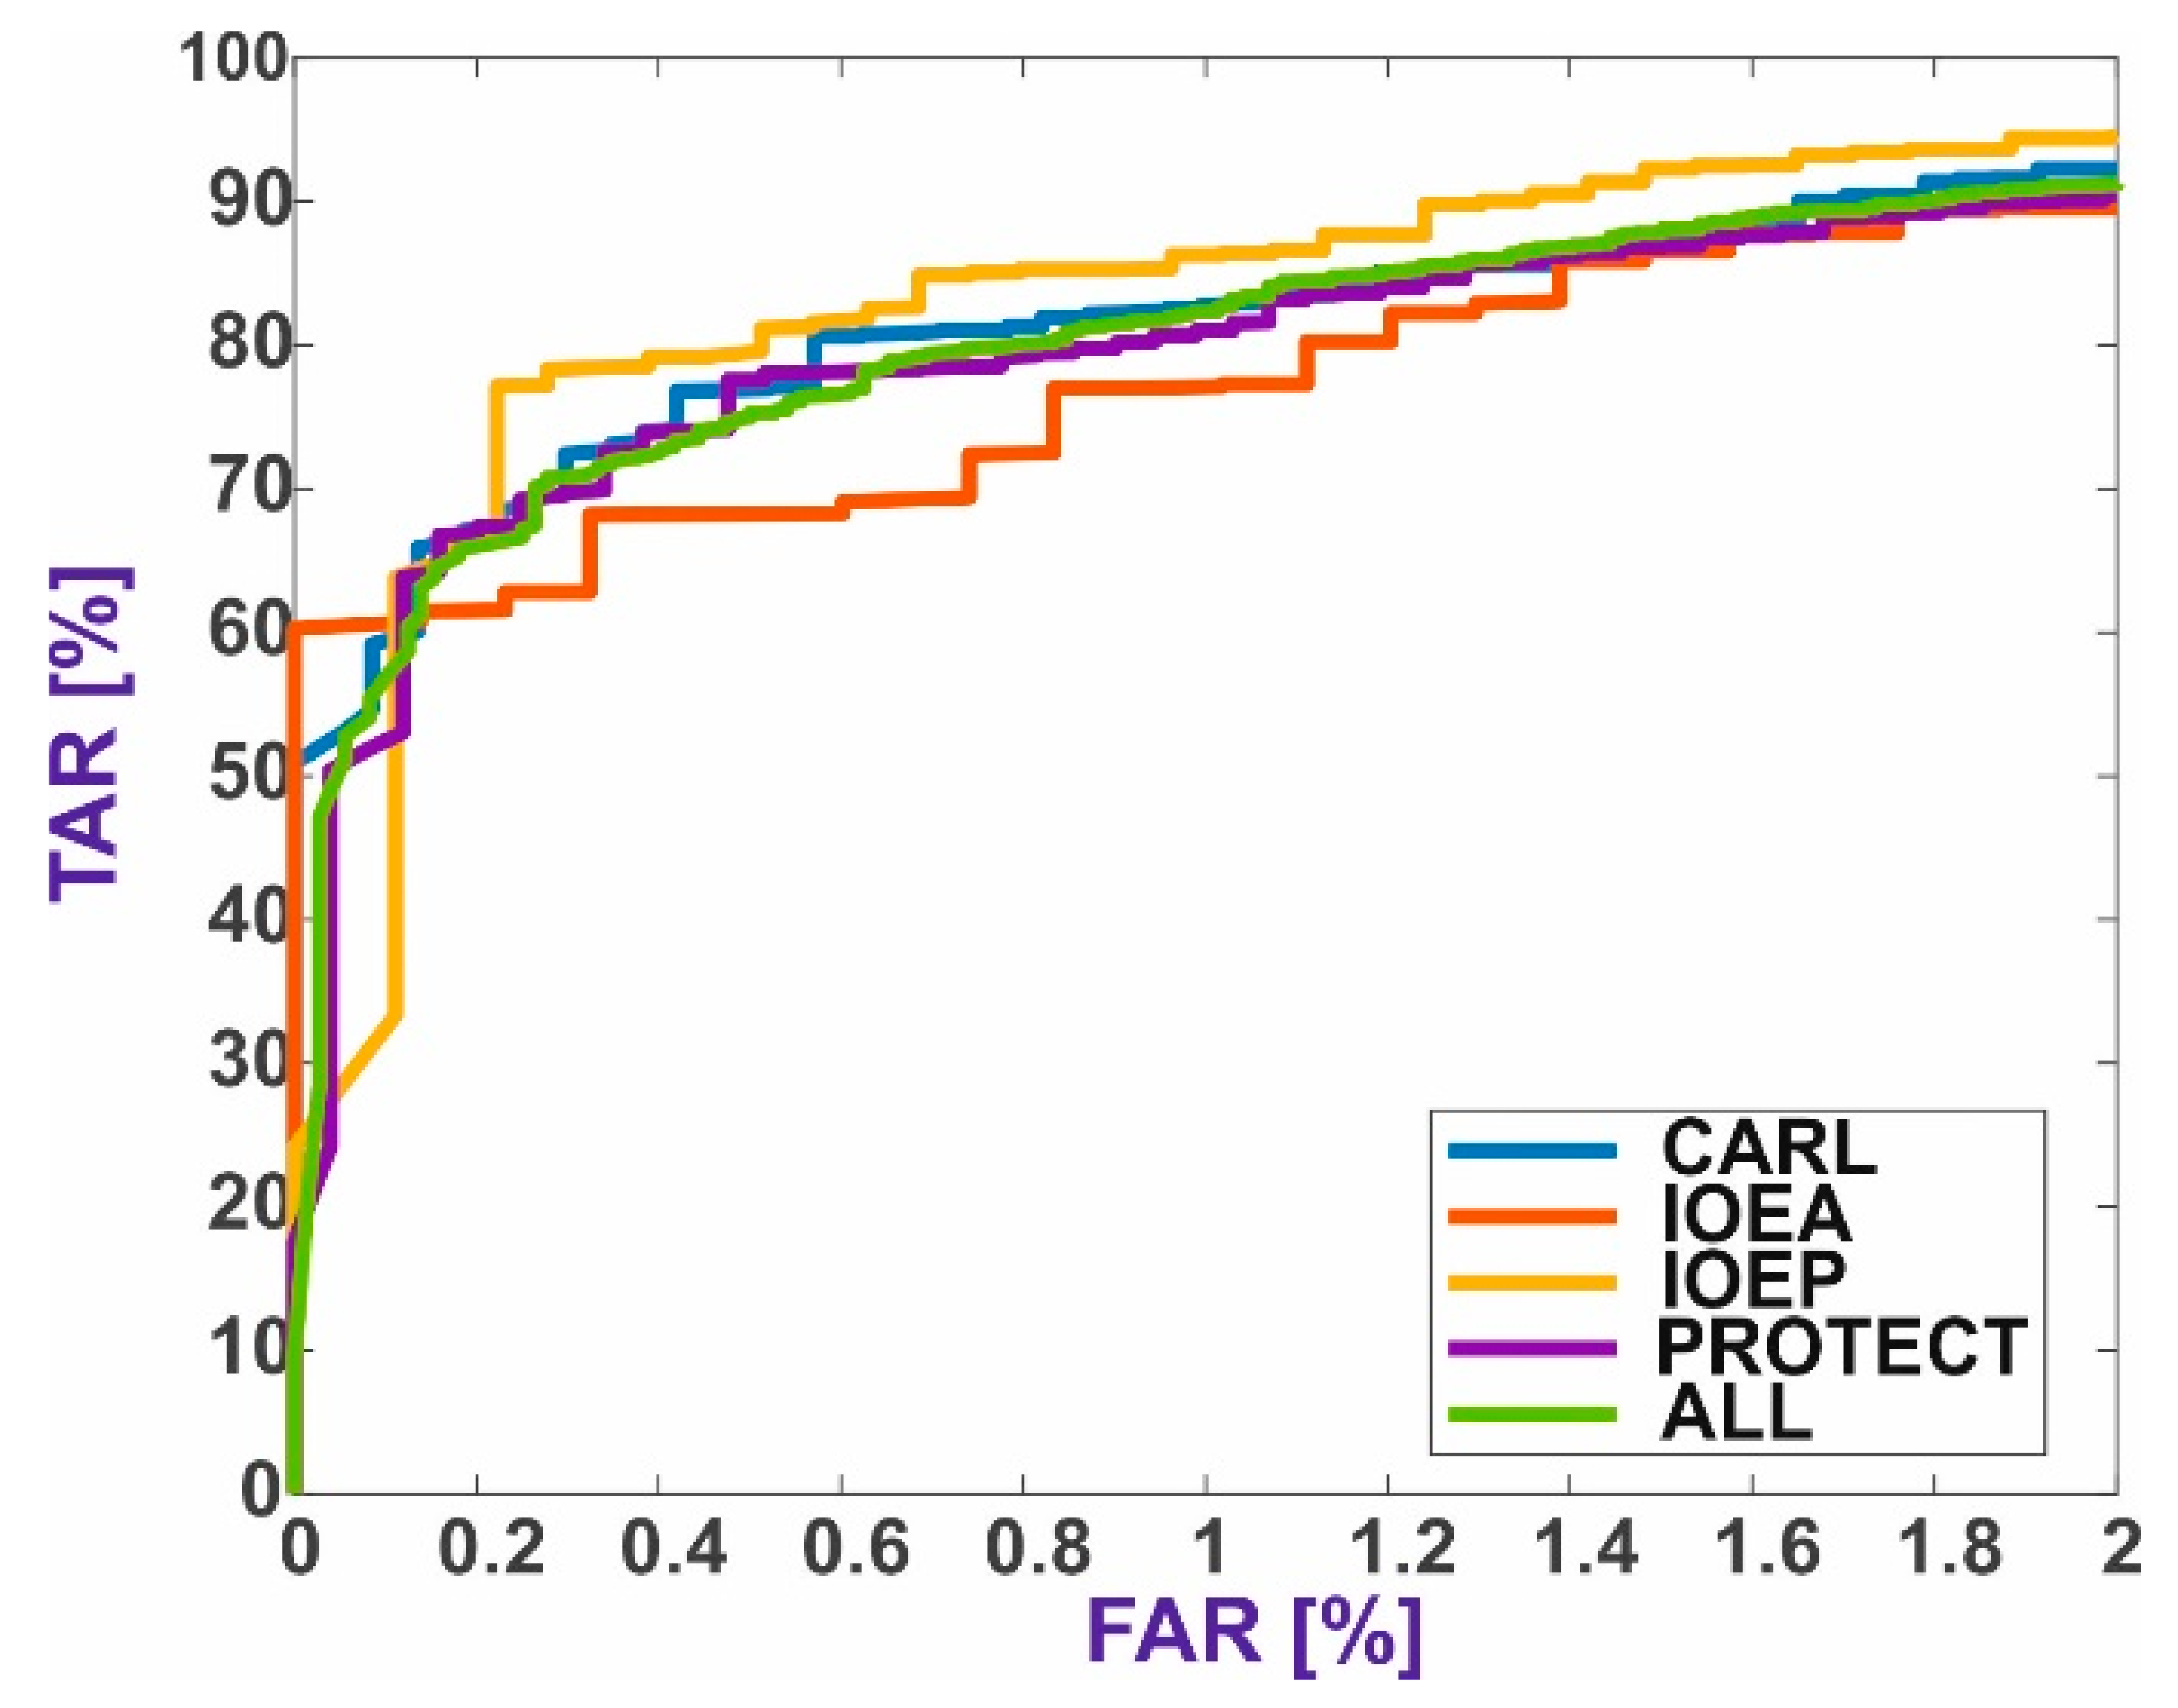
5.2. Verification through Identification
5.3. Results Summary
6. Summary
Author Contributions
Funding
Institutional Review Board Statement
Informed Consent Statement
Data Availability Statement
Conflicts of Interest
References
- Jain, A.K.; Ross, A.A.; Nandakumar, K. Introduction to Biometrics; Springer: Boston, MA, USA, 2011; pp. 97–109. [Google Scholar]
- Rodríguez-Pulecio, C.G.; Benítez-Restrepo, H.D.; Bovik, A.C. Making long-wave infrared face recognition robust against image quality degradations. Quant. Infrared Thermogr. J. 2019, 16, 218–242. [Google Scholar] [CrossRef]
- Bourlai, T.; Cukic, B. Multi-spectral face recognition: Identification of people in difficult environments. In Proceedings of the ISI 2012—2012 IEEE International Conference on Intelligence and Security Informatics: Cyberspace, Border, and Immigration Securities, Washington, DC, USA, 11–14 June 2012; pp. 196–201. [Google Scholar]
- Kowalski, M. A Study on Presentation Attack Detection in Thermal Infrared. Sensors 2020, 20, 3988. [Google Scholar] [CrossRef] [PubMed]
- Blanz, V.; Vetter, T. Face recognition based on fitting a 3D morphable model. IEEE Trans. Pattern Anal. Mach. Intell. 2003, 25, 1063–1074. [Google Scholar] [CrossRef]
- Edwards, G.J.; Cootes, T.E.; Taylor, C.J. Face recognition using active appearance models. In Lecture Notes in Computer Science (Including Subseries Lecture Notes in Artificial Intelligence and Lecture Notes in Bioinformatics); Springer: Berlin/Heidelberg, Germany, 1998; Volume 1407, pp. 581–595. [Google Scholar]
- Wiskott, L.; Fellous, J.-M.; Kruger, N.; Von Der Malsburg, C. Face recognition by elastic bunch graph matching. In Proceedings of the 2003 International Conference on Image Processing (Cat. No.03CH37429), Santa Barbara, CA, USA, 26–29 October 1997; Volume 1, pp. 129–132. [Google Scholar]
- Lowe, D. Object Recognition from Local Scale-Invariant Features. In Proceedings of the Seventh IEEE International Conference on Computer Vision, Corfu, Greece, 20–25 September 1999; IEEE Computer Society: Washington, DC, USA, 1999; Volume 2, pp. 1150–1157. [Google Scholar]
- Ahonen, T.; Hadid, A.; Pietikäinen, M. Face Description with Local Binary Patterns: Application to Face Recognition. IEEE Trans. Pattern Anal. Mach. Intell. 2006, 28, 2037–2041. [Google Scholar] [CrossRef]
- Déniz, O.; Bueno, G.; Salido, J.; De la Torre, F. Face recognition using Histograms of Oriented Gradients. Pattern Recognit. Lett. 2011, 32, 1598–1603. [Google Scholar] [CrossRef]
- Ren, H.; Sun, J.; Hao, Y.; Yan, X.; Liu, Y. Uniform Local Derivative Patterns and Their Application in Face Recognition. J. Signal Process. Syst. 2013, 74, 405–416. [Google Scholar] [CrossRef]
- Phillips, P.J. Support vector machines applied to face recognition. In Support Vector Machines Applied to Face Recognition; National Institute of Standards and Technology (NIST): Washington, DC, USA, 1998; pp. 803–809. [Google Scholar] [CrossRef]
- Yu, H.; Yang, J. A direct LDA algorithm for high-dimensional data—With application to face recognition. Pattern Recognit. 2001, 34, 2067–2070. [Google Scholar] [CrossRef]
- Kirby, M.; Sirovich, L. Application of the Karhunen-Loeve procedure for the characterization of human faces. IEEE Trans. Pattern Anal. Mach. Intell. 1990, 12, 103–108. [Google Scholar] [CrossRef]
- Comon, P. Independent component analysis, a new concept? Signal Process. 1994, 36, 287–314. [Google Scholar] [CrossRef]
- Alom, M.Z.; Taha, T.M.; Yakopcic, C.; Westberg, S.; Sidike, P.; Nasrin, M.S.; Hasan, M.; Van Essen, B.C.; Awwal, A.A.S.; Asari, V.K. A State-of-the-Art Survey on Deep Learning Theory and Architectures. Electronics 2019, 8, 292. [Google Scholar] [CrossRef]
- Mantecon, T.; Del-Blanco, C.R.; Jaureguizar, F.; Garcia, N. Visual Face Recognition Using Bag of Dense Derivative Depth Patterns. IEEE Signal Process. Lett. 2016, 23, 771–775. [Google Scholar] [CrossRef]
- You, Z.; Yang, T.; Jin, M. Multi-channel Deep 3D Face Recognition. arXiv 2020, arXiv:2009.14743. [Google Scholar]
- Pini, S.; Borghi, G.; Vezzani, R.; Maltoni, D.; Cucchiara, R. A Systematic Comparison of Depth Map Representations for Face Recognition. Sensors 2021, 21, 944. [Google Scholar] [CrossRef]
- Chopra, S.; Hadsell, R.; LeCun, Y. Learning a Similarity Metric Discriminatively, with Application to Face Verification. In Proceedings of the 2005 IEEE Computer Society Conference on Computer Vision and Pattern Recognition (CVPR’05), San Diego, CA, USA, 20–25 June 2005; Volume I, pp. 539–546. [Google Scholar]
- Lu, J.; Hu, J.; Tan, Y.-P. Discriminative Deep Metric Learning for Face and Kinship Verification. IEEE Trans. Image Process. 2017, 26, 4269–4282. [Google Scholar] [CrossRef] [PubMed]
- Shnain, N.A.; Hussain, Z.M.; Lu, S.F. A Feature-Based Structural Measure: An Image Similarity Measure for Face Recognition. Appl. Sci. 2017, 7, 786. [Google Scholar] [CrossRef]
- Schroff, F.; Kalenichenko, D.; Philbin, J. FaceNet: A unified embedding for face recognition and clustering. In Proceedings of the 2015 IEEE Conference on Computer Vision and Pattern Recognition (CVPR), Boston, MA, USA, 8–12 June 2015; pp. 815–823. [Google Scholar]
- Ranjan, R.; Castillo, C.D.; Chellappa, R. L2-constrained Softmax Loss for Discriminative Face Verification. arXiv 2017, arXiv:1703.09507. [Google Scholar]
- Taigman, Y.; Yang, M.; Ranzato, M.; Wolf, L. DeepFace: Closing the Gap to Human-Level Performance in Face Verification. In Proceedings of the 2014 IEEE Conference on Computer Vision and Pattern Recognition, Columbus, OH, USA, 23–28 June 2014; pp. 1701–1708. [Google Scholar]
- Chen, W.; Chen, X.; Zhang, J.; Huang, K. Beyond Triplet Loss: A Deep Quadruplet Network for Person Re-identification. In Proceedings of the 2017 IEEE Conference on Computer Vision and Pattern Recognition (CVPR), Honolulu, HI, USA, 21–26 July 2017; pp. 1320–1329. [Google Scholar] [CrossRef]
- Bi, Y.; Lv, M.; Wei, Y.; Guan, N.; Yi, W. Multi-feature fusion for thermal face recognition. Infrared Phys. Technol. 2016, 77, 366–374. [Google Scholar] [CrossRef]
- Espinosa-Duró, V.; Faundez-Zanuy, M.; Mekyska, J. A New Face Database Simultaneously Acquired in Visible, Near-Infrared and Thermal Spectrums. Cogn. Comput. 2012, 5, 119–135. [Google Scholar] [CrossRef]
- Sequeira, A.F.; Chen, L.; Ferryman, J.; Galdi, C.; Chiesa, V.; Dugelay, J.-L.; Maik, P.; Gmitrowicz, P.; Szklarski, L.; Prommegger, B.; et al. PROTECT Multimodal DB: Fusion evaluation on a novel multimodal biometrics dataset envisaging Border Control. In Proceedings of the 2018 International Conference of the Biometrics Special Interest Group (BIOSIG), Darmstadt, Germany, 26–28 September 2018; pp. 1–5. [Google Scholar]
- Kowalski, M.; Grudzień, A. High-resolution thermal face dataset for face and expression recognition. Metrol. Meas. Syst. 2018, 25, 403–415. [Google Scholar] [CrossRef]
- Ren, S.; He, K.; Girshick, R.; Sun, J. Faster R-CNN: Towards Real-Time Object Detection with Region Proposal Networks. IEEE Trans. Pattern Anal. Mach. Intell. 2017, 39, 1137–1149. [Google Scholar] [CrossRef] [PubMed]
- Kowalski, M.; Grudzień, A.; Ciurapiński, W. Detection of human faces in thermal infrared images. Metrol. Meas. Syst. 2021, 28. [Google Scholar] [CrossRef]
- Krizhevsky, A.; Sutskever, I.; Hinton, G.E. Imagenet classification with deep convolutional neural networks. Commun. ACM 2012, 60, 1097–1105. [Google Scholar] [CrossRef]
- Huang, G.; Liu, Z.; Van Der Maaten, L.; Weinberger, K.Q. Densely Connected Convolutional Networks. In Proceedings of the IEEE Conference on Computer Vision and Pattern Recognition (CVPR), Honolulu, HI, USA, 21–26 July 2017; pp. 2261–2269. [Google Scholar]
- Szegedy, C.; Liu, W.; Jia, Y.; Sermanet, P.; Reed, S.; Anguelov, D.; Erhan, D.; Vanhoucke, V.; Rabinovich, A. Going Deeper with Convolutions. In Proceedings of the 2015 IEEE Conference on Computer Vision and Pattern Recognition (CVPR), Boston, MA, USA, 7–12 June 2015; pp. 1–9. [Google Scholar]
- Szegedy, C.; Ioffe, S.; Vanhoucke, V.; Alemi, A.A. Inception-v4, inception-ResNet and the impact of residual connections on learning. In Proceedings of the 31st AAAI Conference on Artificial Intelligence, San Francisco, CA, USA, 4–9 February 2017; pp. 4278–4284. [Google Scholar]
- He, K.; Zhang, X.; Ren, S.; Sun, J. Deep residual learning for image recognition. In Proceedings of the IEEE conference on computer vision and pattern recognition, Las Vegas, NV, USA, 27–30 June 2016; pp. 770–778. [Google Scholar]
- Simonyan, K.; Zisserman, A. Very deep convolutional networks for large-scale image recognition. arXiv 2014, arXiv:1409.1556. [Google Scholar]
- Duchi, J.C.; Bartlett, P.L.; Wainwright, M.J. Randomized smoothing for (parallel) stochastic optimization. In Proceedings of the 2012 IEEE 51st IEEE Conference on Decision and Control (CDC), Maui, HI, USA, 10–13 December 2012; Volume 12, pp. 5442–5444. [Google Scholar]


| Name of Method | Parameters |
|---|---|
| Histogram of Oriented Gradients | cell size: 30 × 30 pixels number of cells in a block: 2 × 2 overlapping of a block: 1 × 1 |
| Local Binary Pattern | cell size: 30 × 30 pixels number of neighboring pixels: 8 L2 normalization with a linear interpolation |
| Local Derivative Pattern | cell size: 30 × 30 pixels L2 normalization |
| Training Datasets | ||||
|---|---|---|---|---|
| Number of Datasets | IOEA [%] | IOEP [%] | PROT [%] | CARL [%] |
| 1 | 13.04 | 23.91 | 34.78 | 28.27 |
| 2 | 9.78 | 22.83 | 31.52 | 35.87 |
| 3 | 11.96 | 19.57 | 36.96 | 31.51 |
| 4 | 11.96 | 23.91 | 36.96 | 27.17 |
| 5 | 10.87 | 26.09 | 34.78 | 28.26 |
| Testing Datasets | ||||
| Number of Datasets | IOEA [%] | IOEP [%] | PROT [%] | CARL [%] |
| 1 | 10.00 | 17.50 | 35.00 | 37.50 |
| 2 | 17.50 | 20.00 | 42.50 | 20.00 |
| 3 | 12.50 | 27.50 | 30.00 | 30.00 |
| 4 | 12.50 | 17.50 | 30.00 | 40.00 |
| 5 | 15.00 | 12.50 | 35.00 | 37.50 |
| Local Descriptor Methods | |||
|---|---|---|---|
| Algorithm of Feature Extraction | Distance Function | TAR @ FAR 1% | TAR @ FAR 0.1% |
| HOG | Spearman | 48.46 ± 4.11 | 36.22 ± 4.50 |
| LBP | Spearman | 56.90 ± 3.13 | 40.33 ± 5.65 |
| LDP | Spearman | 35.25 ± 1.83 | 17.88 ± 2.51 |
| Models of CNNs | |||
| AlexNet | Spearman | 53.36 ± 2.31 | 35.32 ± 3.83 |
| DenseNet-201 | Spearman | 53.15 ± 4.67 | 34.13 ± 6.16 |
| GoogLeNet | Euclidean | 48.18 ± 2.51 | 26.85 ± 2.97 |
| InceptionResNet-v2 | Spearman | 45.01 ± 4.86 | 26.49 ± 5.19 |
| Inception-v3 | Spearman | 46.33 ± 3.97 | 29.71 ± 4.08 |
| ResNet-18 | Euclidean | 53.60 ± 2.04 | 33.04 ± 2.49 |
| ResNet-50 | Euclidean | 49.56 ± 4.01 | 29.92 ± 3.48 |
| ResNet-101 | Spearman | 49.50 ± 4.73 | 30.73 ± 5.51 |
| VGG16 | Euclidean | 44.08 ± 2.06 | 26.19 ± 2.55 |
| VGG19 | Euclidean | 48.68 ± 3.27 | 28.69 ± 6.17 |
| Local Descriptors Methods | ||
|---|---|---|
| Algorithm of Feature Extraction | TAR @ FAR 1% | TAR @ FAR 0.1% |
| HOG | 8.94 ± 1.88 | 1.99 ± 1.34 |
| LBP | 5.08 ± 6.81 | 0.86 ± 1.21 |
| LDP | 5.95 ± 3.16 | 1.65 ± 1.19 |
| Models of CNNs | ||
| AlexNet | 6.35 ± 3.12 | 0.36 ± 0.18 |
| DenseNet-201 | 4.03 ± 0.72 | 0.10 ± 0.10 |
| GoogLeNet | 9.12 ± 2.02 | 1.44 ± 0.43 |
| InceptionResNet-v2 | 2.72 ± 1.09 | 0.25 ± 0.25 |
| Inception-v3 | 5.15 ± 2.96 | 0.32 ± 0.38 |
| ResNet-18 | 6.42 ± 1.74 | 1.01 ± 0.55 |
| ResNet-50 | 4.39 ± 2.45 | 0.32 ± 0.26 |
| ResNet-101 | 4.90 ± 1.95 | 0.44 ± 0.92 |
| VGG16 | 5.74 ± 3.27 | 0.99 ± 0.95 |
| VGG19 | 5.85 ± 2.50 | 1.24 ± 1.15 |
| Training Datasets | ||||
|---|---|---|---|---|
| Number of Datasets | IOEA [%] | IOEP [%] | PROT [%] | CARL [%] |
| 1 | 11.96 | 20.65 | 34.78 | 32.61 |
| 2 | 13.04 | 21.74 | 36.96 | 28.26 |
| 3 | 10.87 | 20.65 | 35.87 | 32.61 |
| 4 | 10.87 | 26.09 | 34.78 | 28.26 |
| 5 | 15.22 | 20.65 | 36.96 | 27.17 |
| Testing Datasets | ||||
| Number of Datasets | IOEA [%] | IOEP [%] | PROT [%] | CARL [%] |
| 1 | 12.50 | 25.00 | 35.00 | 27.50 |
| 2 | 10.00 | 22.50 | 30.00 | 37.50 |
| 3 | 15.00 | 25.00 | 32.50 | 27.50 |
| 4 | 15.00 | 12.50 | 35.00 | 37.50 |
| 5 | 5.00 | 25.00 | 30.00 | 40.00 |
| Neural Network Model | TAR @ FAR 1% | TAR @ FAR 0.1% |
|---|---|---|
| AlexNet | 61.57 ± 14.89 | 21.14 ± 10.09 |
| DenseNet-201 | 78.16 ± 7.29 | 11.01 ± 24.63 |
| GoogLeNet | 58.00 ± 12.06 | 4.71 ± 10.53 |
| InceptionResNet-v2 | 64.66 ± 9.81 | 9.76 ± 21.83 |
| Inception-v3 | 83.54 ± 7.04 | 60.22 ± 14.26 |
| ResNet-18 | 59.92 ± 9.06 | 20.51 ± 13.44 |
| ResNet-50 | 57.89 ± 9.01 | 8.24 ± 11.46 |
| ResNet-101 | 58.28 ± 10.23 | 15.42 ± 14.91 |
| VGG16 | 63.64 ± 11.57 | 17.23 ± 15.91 |
| VGG19 | 60.25 ± 6.76 | 19.82 ± 18.33 |
| Full Augmentation | ||
|---|---|---|
| Location of Images | TAR @ FAR 1% | TAR @ FAR 0.1% |
| “12” | 83.92 ± 6.96 | 49.24 ± 19.08 |
| “21” | 85.33 ± 11.53 | 52.81 ± 15.69 |
| Random augmentation | ||
| “12” | 83.54 ± 7.04 | 60.22 ± 14.26 |
| “21” | 83.39 ± 8.94 | 51.46 ± 13.04 |
Publisher’s Note: MDPI stays neutral with regard to jurisdictional claims in published maps and institutional affiliations. |
© 2021 by the authors. Licensee MDPI, Basel, Switzerland. This article is an open access article distributed under the terms and conditions of the Creative Commons Attribution (CC BY) license (https://creativecommons.org/licenses/by/4.0/).
Share and Cite
Grudzień, A.; Kowalski, M.; Pałka, N. Thermal Face Verification through Identification. Sensors 2021, 21, 3301. https://doi.org/10.3390/s21093301
Grudzień A, Kowalski M, Pałka N. Thermal Face Verification through Identification. Sensors. 2021; 21(9):3301. https://doi.org/10.3390/s21093301
Chicago/Turabian StyleGrudzień, Artur, Marcin Kowalski, and Norbert Pałka. 2021. "Thermal Face Verification through Identification" Sensors 21, no. 9: 3301. https://doi.org/10.3390/s21093301
APA StyleGrudzień, A., Kowalski, M., & Pałka, N. (2021). Thermal Face Verification through Identification. Sensors, 21(9), 3301. https://doi.org/10.3390/s21093301