
Detecting Effects of Low Levels of FCCP on Stem Cell Micromotion and Wound-Healing Migration by Time-Series Capacitance Measurement

 , , and
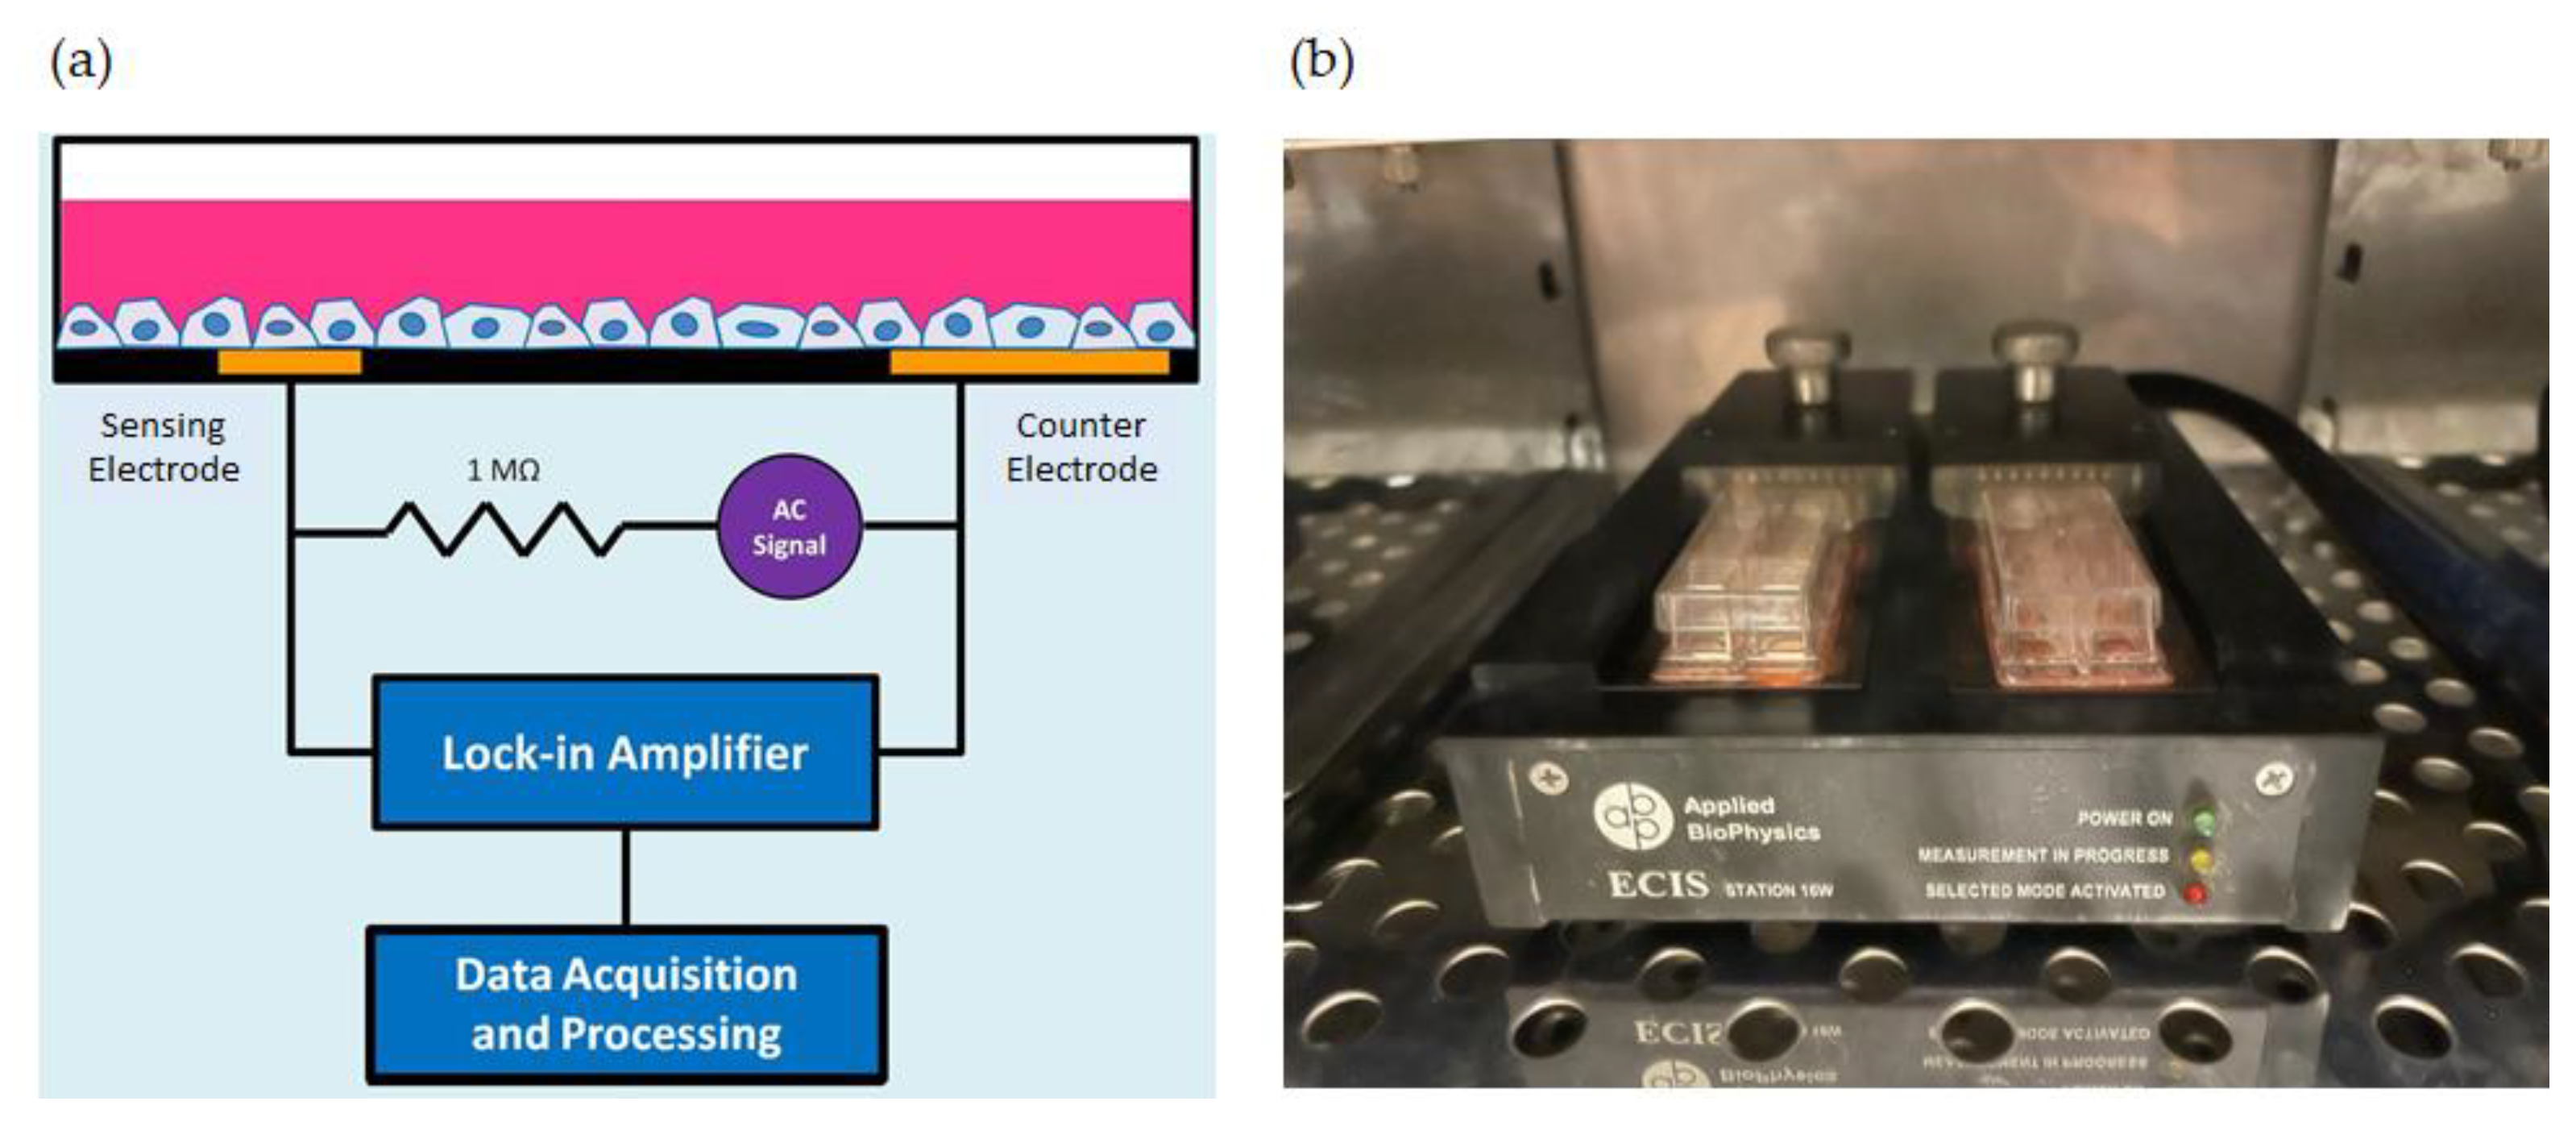
Abstract
1. Introduction
2. Materials and Methods
2.1. Cell Culture
2.2. Monitoring of Cell Attachment and Spreading
2.3. Detection and Analysis of Micromotion
2.4. ECIS Wound-Healing Assay
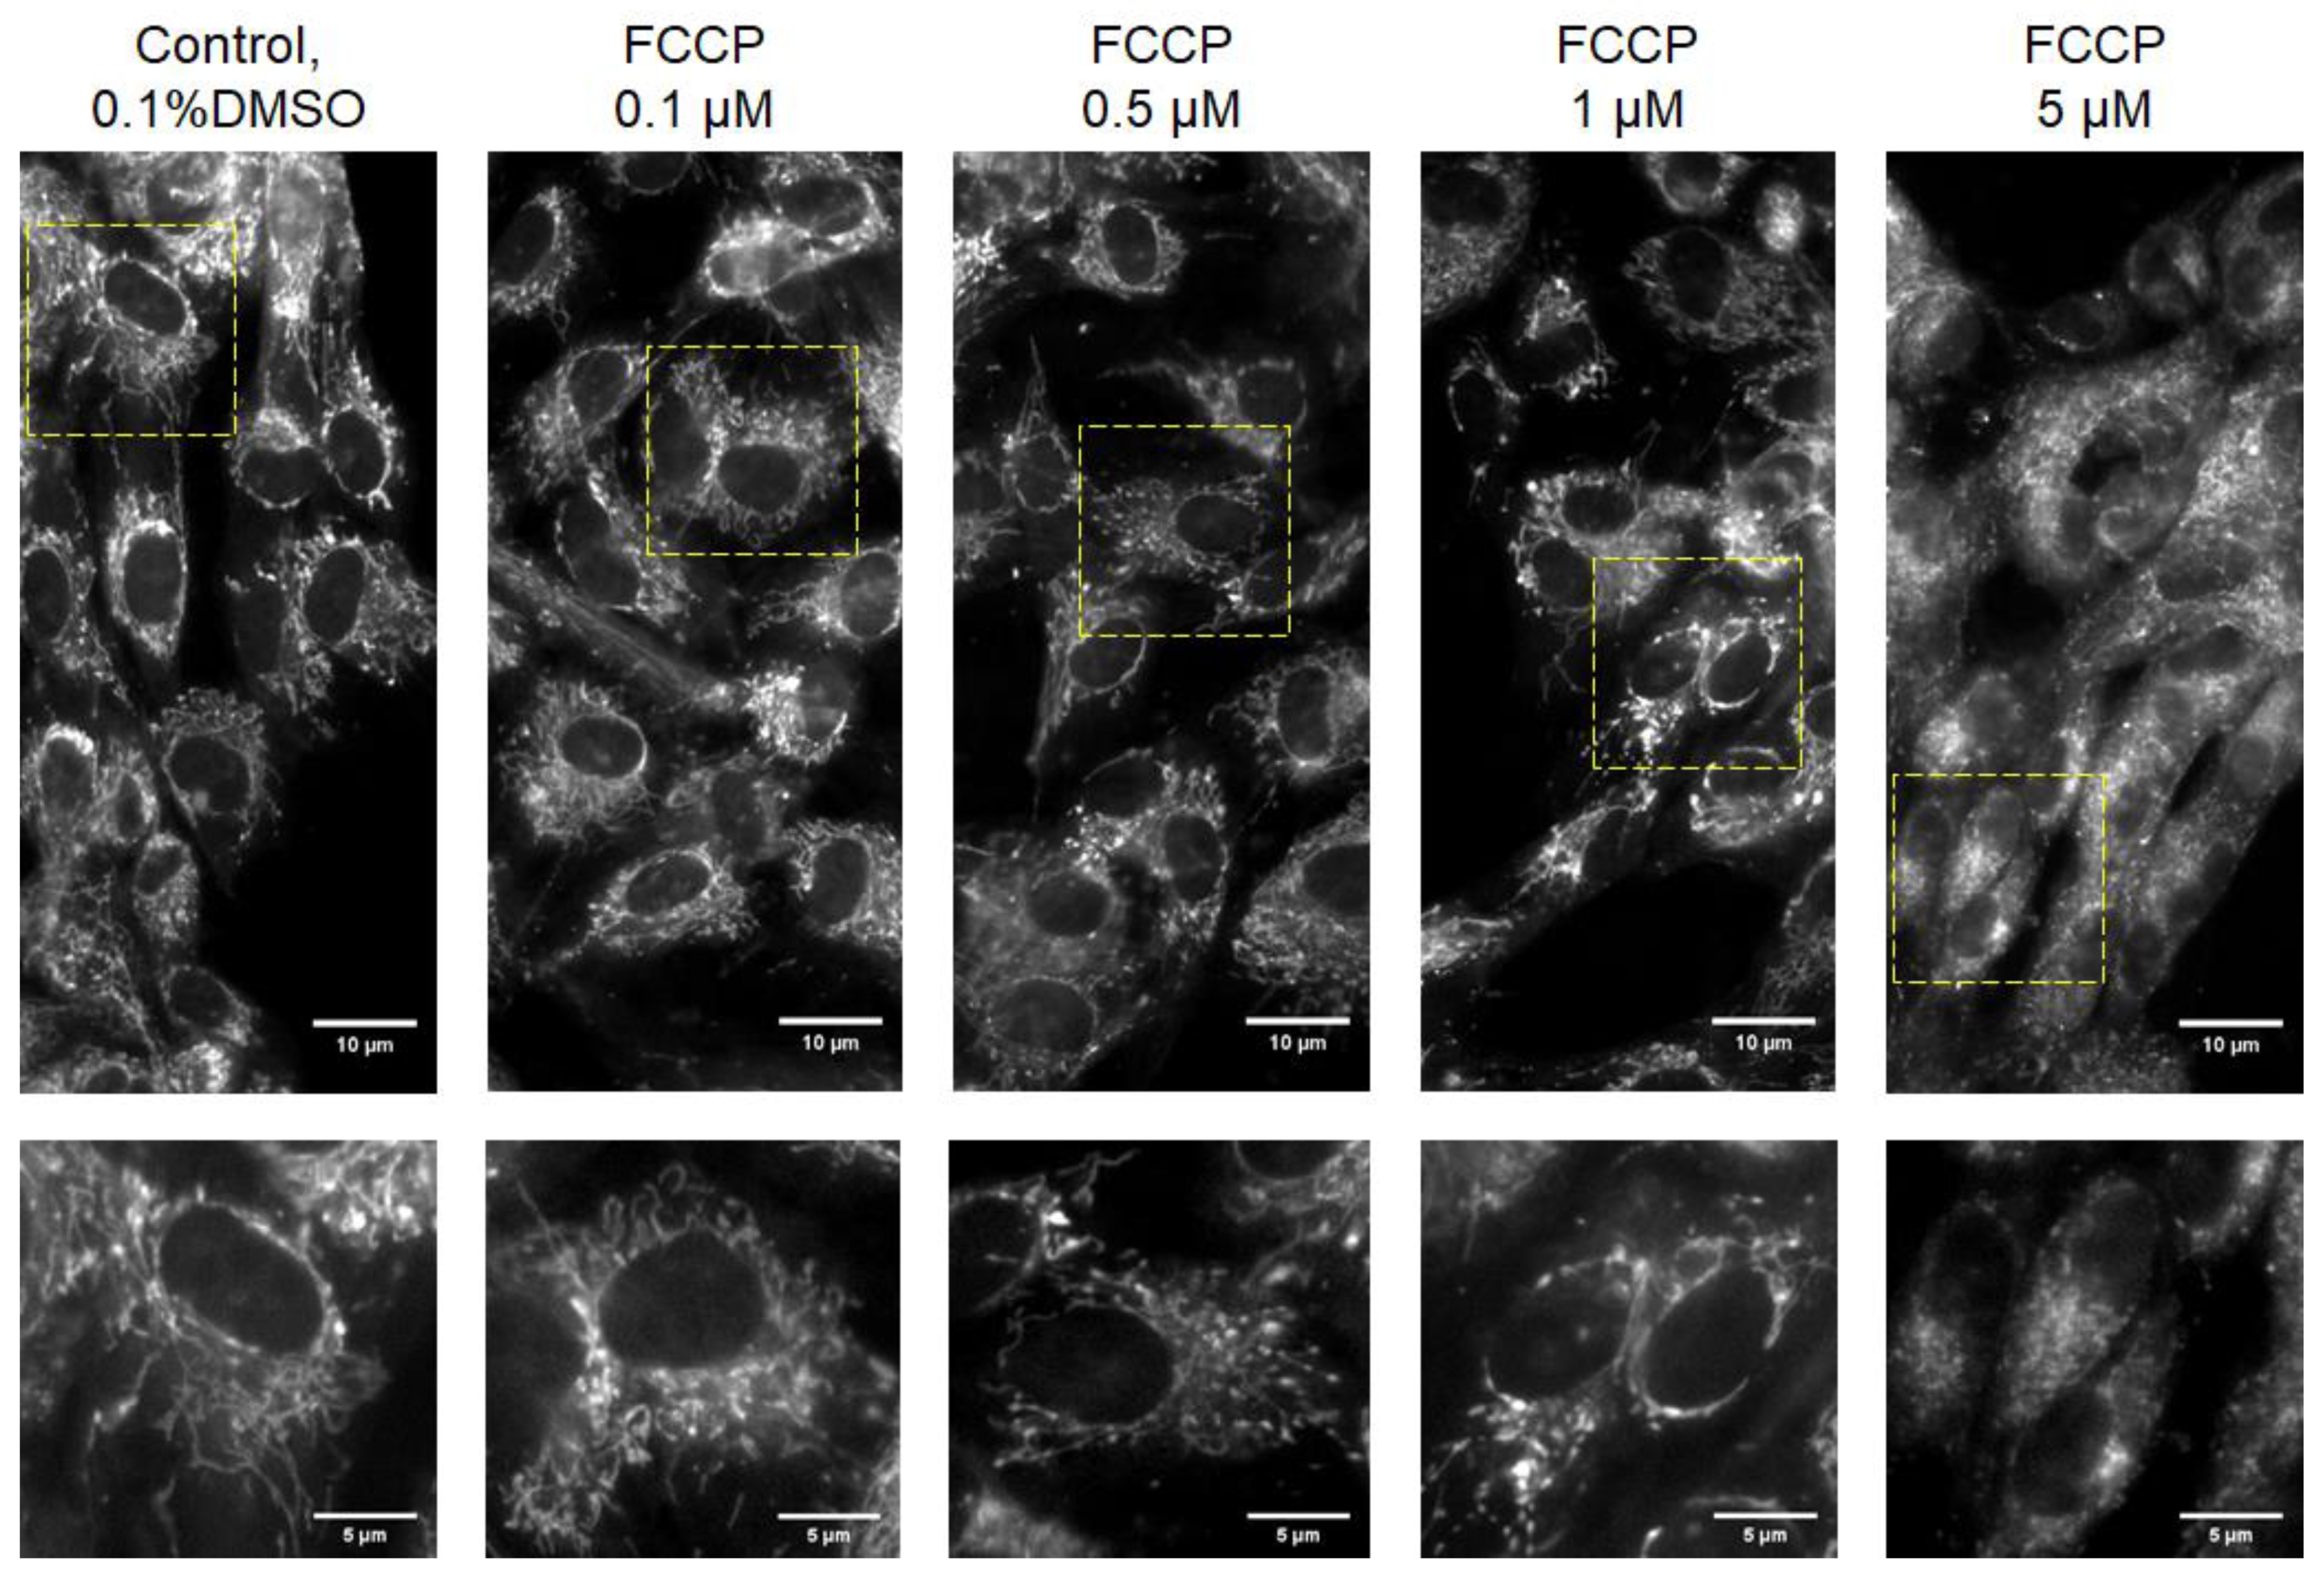
2.5. Mitochondrial Staining and Fluorescence Imaging
2.6. Statistical Analysis
3. Results and Discussion
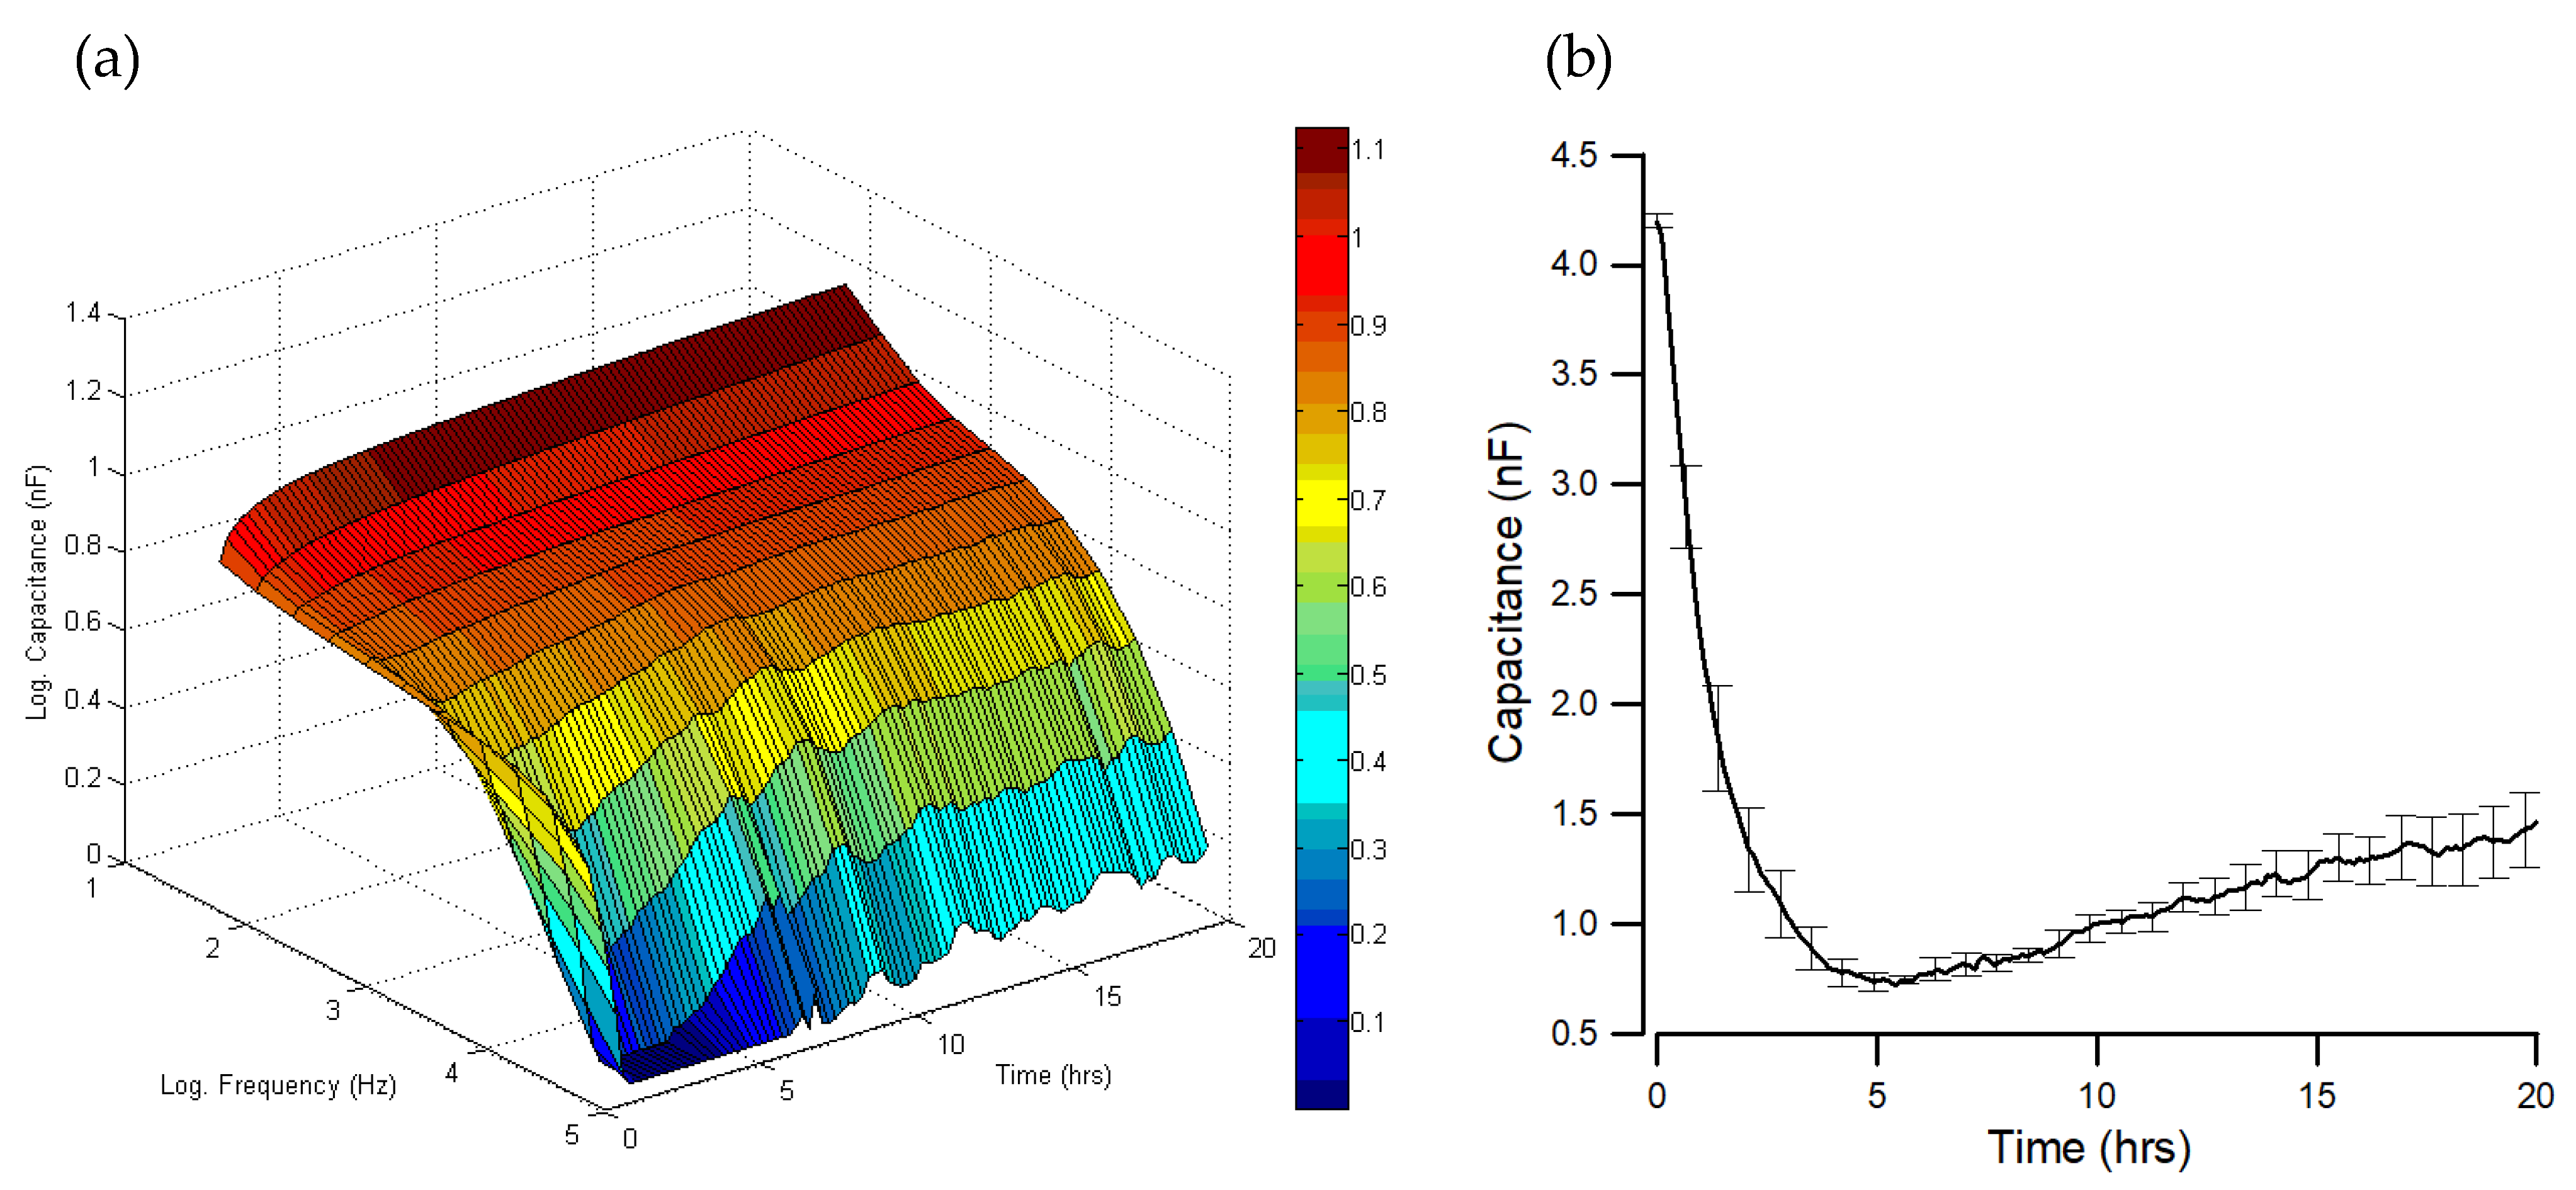
3.1. Monitoring of hMSC Attachment and Spreading
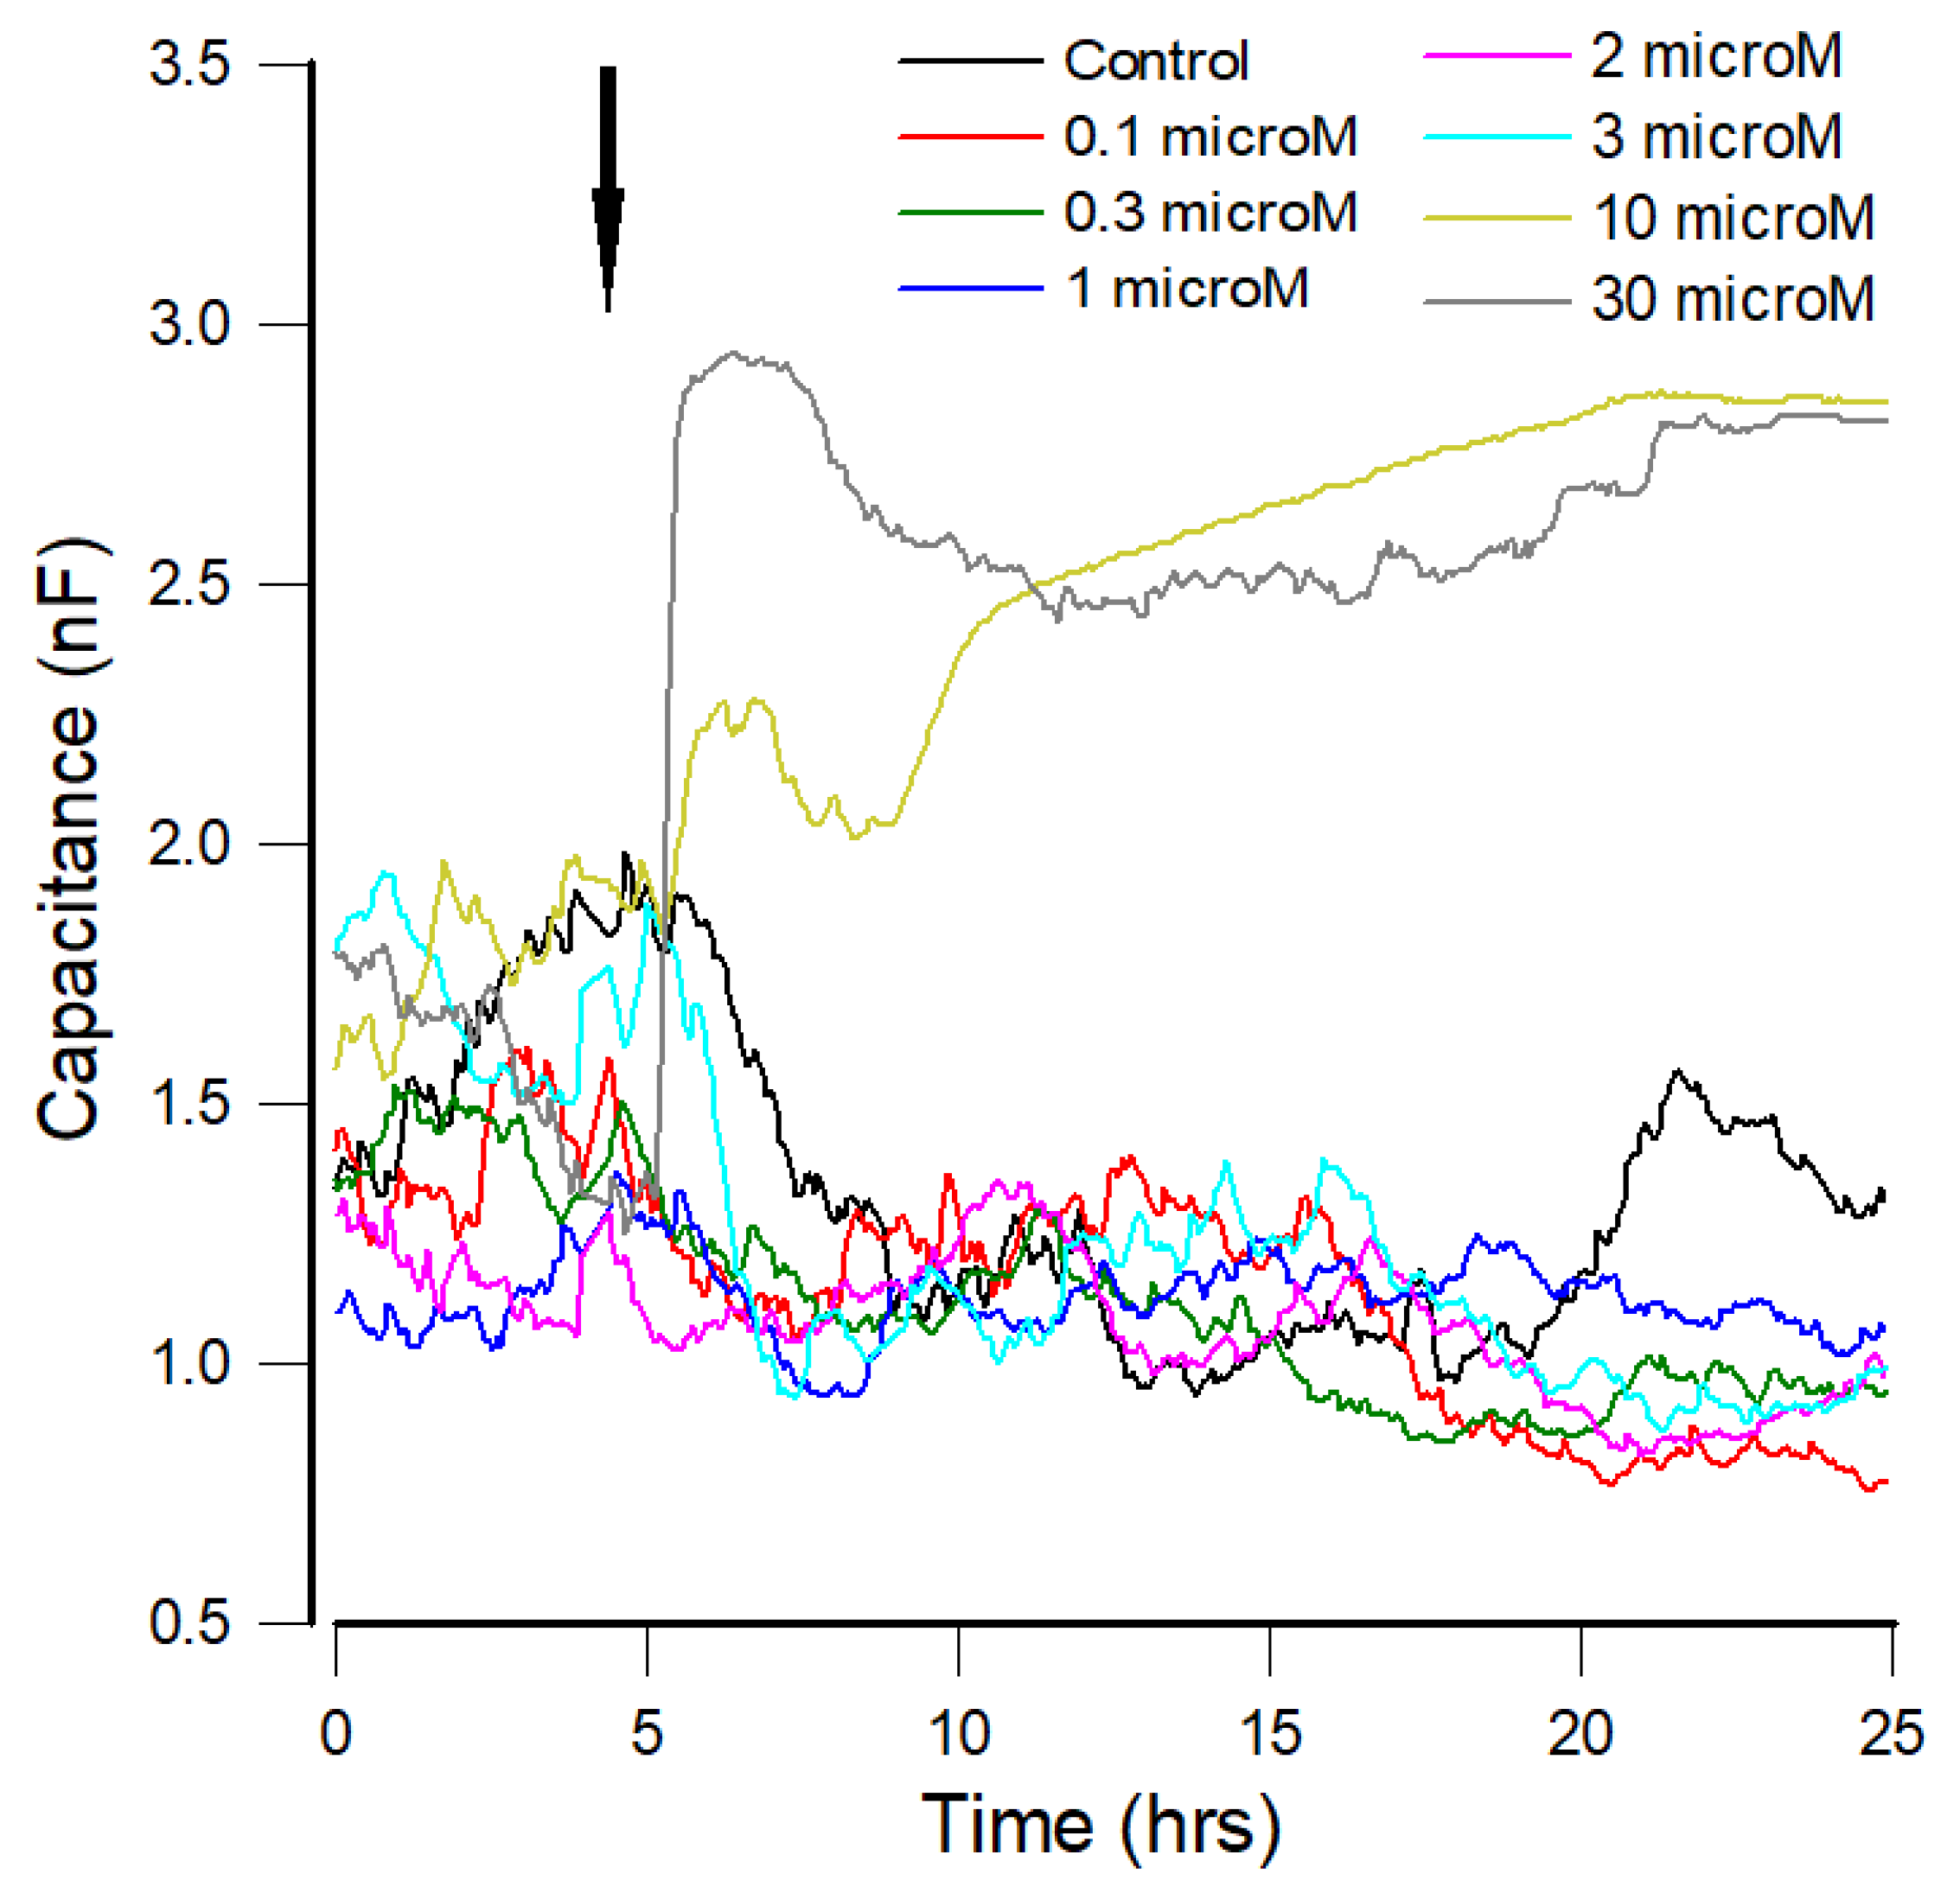
3.2. Capacitance Time Series of hMSCs upon the Challenge of FCCP
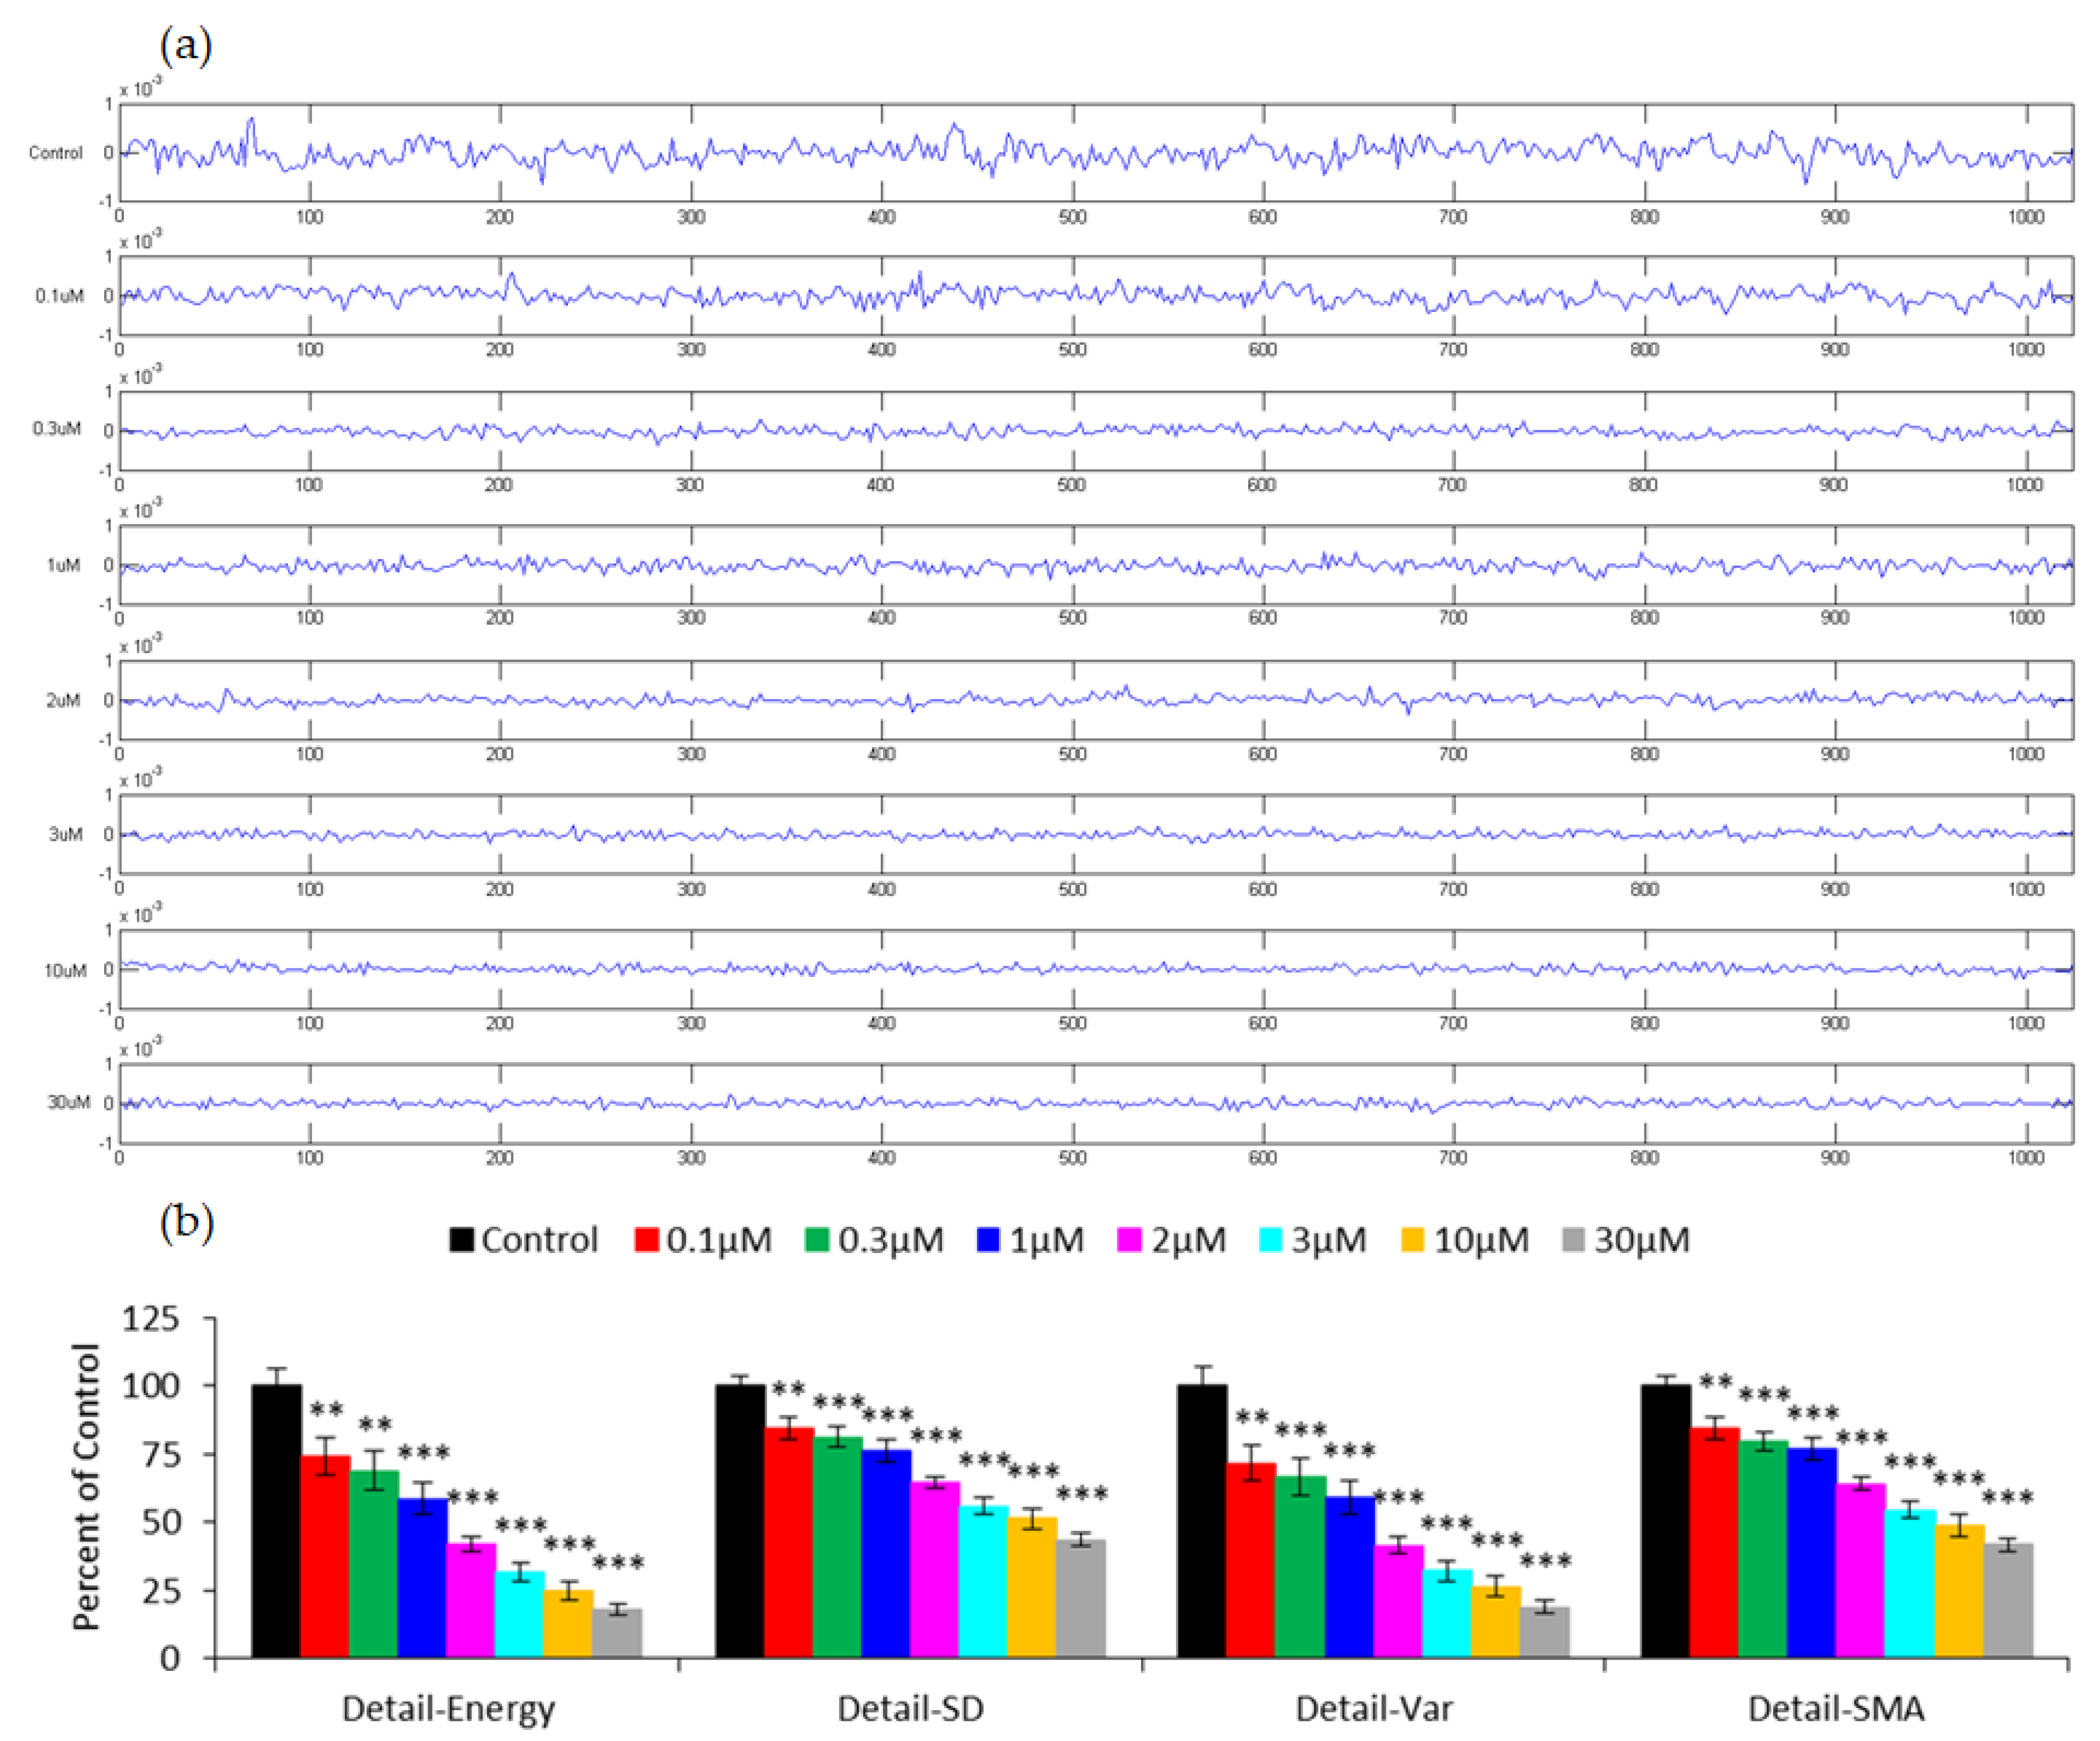
3.3. Capacitance Time Series of hMSC Micromotion upon the Challenge of FCCP
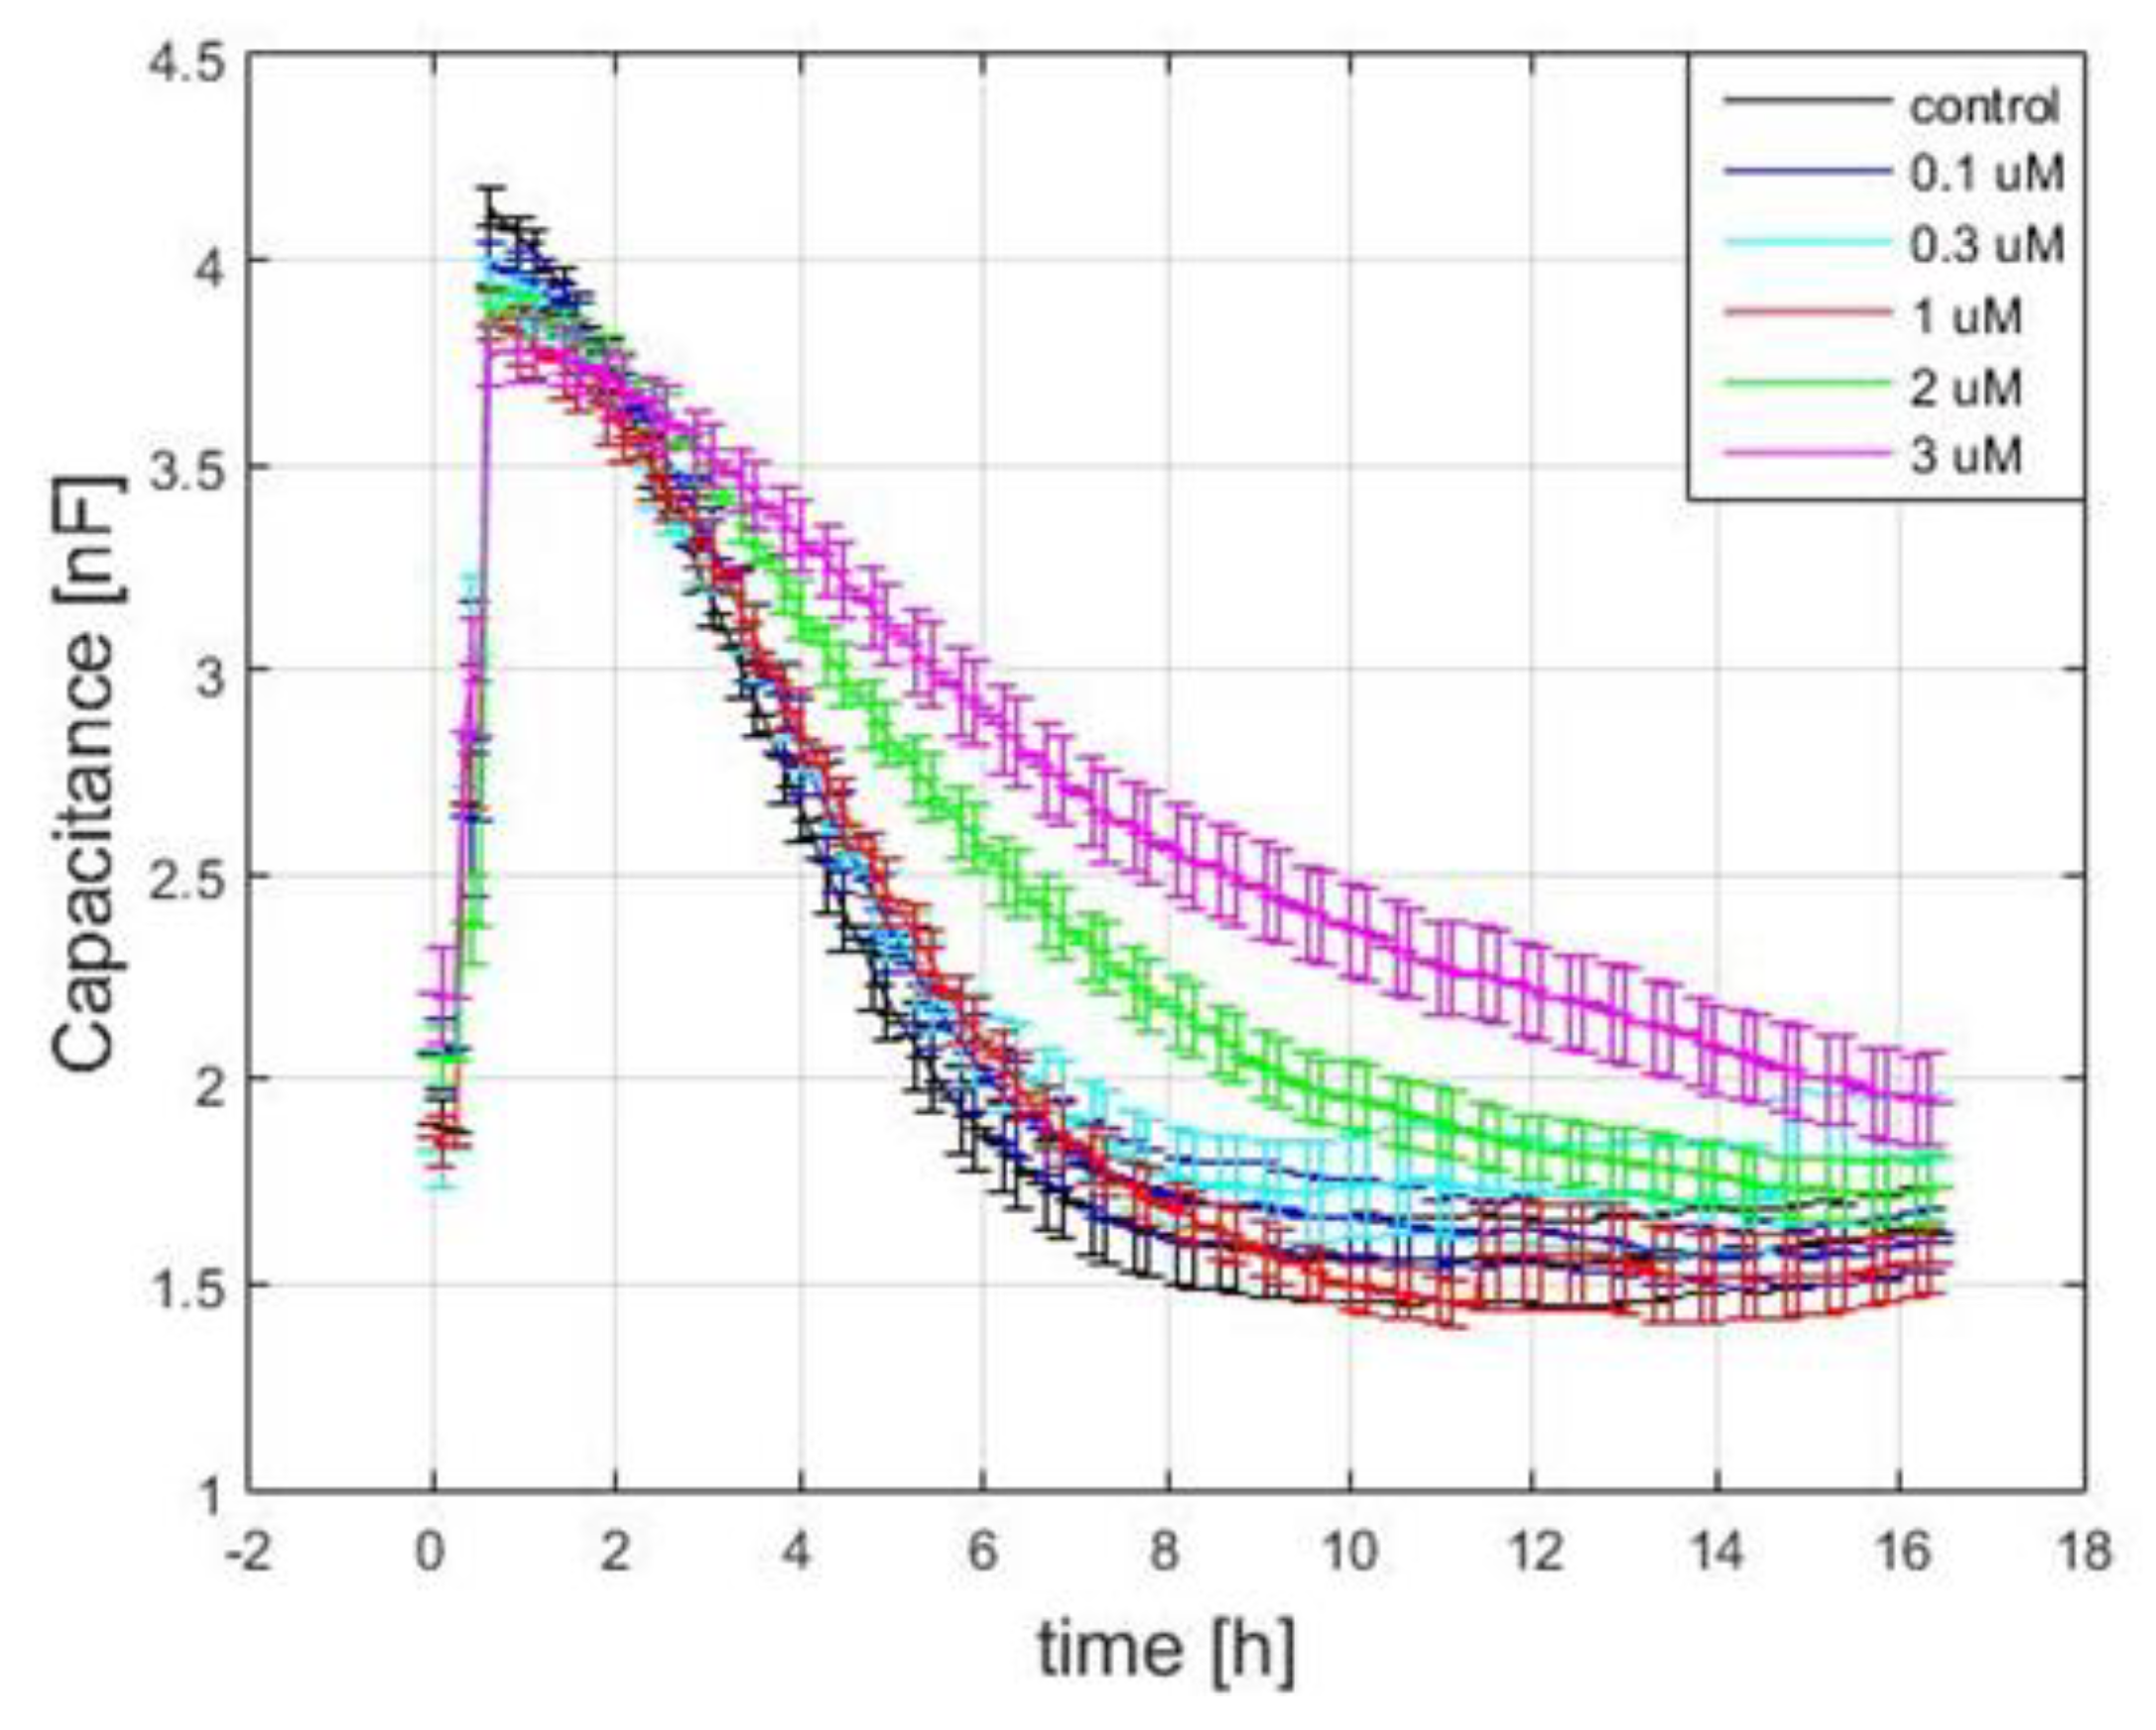
3.4. Capacitance Time Series of hMSC Wound-Healing Migration upon the Challenge of FCCP
4. Conclusions
Author Contributions
Funding
Institutional Review Board Statement
Informed Consent Statement
Data Availability Statement
Conflicts of Interest
References
- Reig, G.; Pulgar, E.; Concha, M.L. Cell migration: From tissue culture to embryos. Development 2014, 141, 1999–2013. [Google Scholar] [CrossRef] [PubMed]
- Friedl, P.; Gilmour, D. Collective cell migration in morphogenesis, regeneration and cancer. Nat. Rev. Mol. Cell Biol. 2009, 10, 445–457. [Google Scholar] [CrossRef] [PubMed]
- Stuelten, C.H.; Parent, C.A.; Montell, D.J. Cell motility in cancer invasion and metastasis: Insights from simple model organisms. Nat. Rev. Cancer 2018, 18, 296–312. [Google Scholar] [CrossRef]
- Luster, A.D.; Alon, R.; von Andrian, U.H. Immune cell migration in inflammation: Present and future therapeutic targets. Nat. Immunol. 2005, 6, 1182–1190. [Google Scholar] [CrossRef]
- Mitchison, T.J.; Cramer, L.P. Actin-based cell motility and cell locomotion. Cell 1996, 84, 371–379. [Google Scholar] [CrossRef]
- Jonkman, J.E.; Cathcart, J.A.; Xu, F.; Bartolini, M.E.; Amon, J.E.; Stevens, K.M.; Colarusso, P. An introduction to the wound healing assay using live-cell microscopy. Cell Adhes. Migr. 2014, 8, 440–451. [Google Scholar] [CrossRef] [PubMed]
- Keese, C.R.; Wegener, J.; Walker, S.R.; Giaever, I. Electrical wound-healing assay for cells in vitro. Proc. Natl. Acad. Sci. USA 2004, 101, 1554–1559. [Google Scholar] [CrossRef]
- Gu, A.Y.; Kho, D.T.; Johnson, R.H.; Graham, E.S.; O’Carroll, S.J. In Vitro Wounding Models Using the Electric Cell-Substrate Impedance Sensing (ECIS)-Zθ Technology. Biosensors 2018, 8, 90. [Google Scholar] [CrossRef]
- Yang, J.M.; Chen, S.W.; Yang, J.H.; Hsu, C.C.; Wang, J.S. A quantitative cell modeling and wound-healing analysis based on the Electric Cell-substrate Impedance Sensing (ECIS) method. Comput. Biol. Med. 2016, 69, 134–143. [Google Scholar] [CrossRef]
- Chiu, S.P.; Lee, Y.W.; Wu, L.Y.; Tung, T.H.; Gomez, S.; Lo, C.M.; Wang, J.Y. Application of ECIS to Assess FCCP-Induced Changes of MSC Micromotion and Wound Healing Migration. Sensors 2019, 19, 3210. [Google Scholar] [CrossRef]
- Stolwijk, J.A.; Wegener, J. Impedance-Based Assays Along the Life Span of Adherent Mammalian Cells In Vitro: From Initial Adhesion to Cell Death. In Label-Free Monitoring of Cells In Vitro; Wegener, J., Ed.; Springer International Publishing: Cham, Switzerland, 2019; pp. 1–75. [Google Scholar]
- Giaever, I.; Keese, C.R. Micromotion of mammalian cells measured electrically. Proc. Natl. Acad. Sci. USA 1991, 88, 7896–7900. [Google Scholar] [CrossRef]
- Giaever, I.; Keese, C.R. A morphological biosensor for mammalian cells. Nature 1993, 366, 591–592. [Google Scholar] [CrossRef]
- Wegener, J.; Keese, C.R.; Giaever, I. Electric cell–substrate impedance sensing (ECIS) as a noninvasive means to monitor the kinetics of cell spreading to artificial surfaces. Exp. Cell Res. 2000, 259, 158–166. [Google Scholar] [CrossRef] [PubMed]
- Balasubramanian, L.; Yip, K.P.; Hsu, T.H.; Lo, C.M. Impedance analysis of renal vascular smooth muscle cells. Am. J. Physiol. Cell Physiol. 2008, 295, C954–C965. [Google Scholar] [CrossRef]
- Lai, Y.-T.; Chu, Y.-S.; Lo, J.-C.; Hung, Y.-H.; Lo, C.-M. Effects of electrode diameter on the detection sensitivity and frequency characteristics of electric cell-substrate impedance sensing. Sens. Actuators B Chem. 2019, 288, 707–715. [Google Scholar] [CrossRef]
- Stolwijk, J.A.; Matrougui, K.; Renken, C.W.; Trebak, M. Impedance analysis of GPCR-mediated changes in endothelial barrier function: Overview and fundamental considerations for stable and reproducible measurements. Pflugers Arch. 2015, 467, 2193–2218. [Google Scholar] [CrossRef] [PubMed]
- Yang, C.T.; Mejard, R.; Griesser, H.J.; Bagnaninchi, P.O.; Thierry, B. Cellular micromotion monitored by long-range surface plasmon resonance with optical fluctuation analysis. Anal. Chem. 2015, 87, 1456–1461. [Google Scholar] [CrossRef]
- Láng, O.; Kőhidai, L.; Wegener, J. Label-free profiling of cell dynamics: A sequence of impedance-based assays to estimate tumor cell invasiveness in vitro. Exp. Cell Res. 2017, 359, 243–250. [Google Scholar] [CrossRef] [PubMed]
- Zinkl, M.; Wegener, J. Using animal cells as sensors for xenobiotics: Monitoring phenotypic changes by multimodal impedance assays. Curr. Opin. Environ. Sci. Health 2019, 10, 30–37. [Google Scholar] [CrossRef]
- Sapper, A.; Wegener, J.; Janshoff, A. Cell motility probed by noise analysis of thickness shear mode resonators. Anal. Chem. 2006, 78, 5184–5191. [Google Scholar] [CrossRef]
- Lo, C.-M.; Keese, C.R.; Giaever, I. Monitoring motion of confluent cells in tissue culture. Exp. Cell Res. 1993, 204, 102–109. [Google Scholar] [CrossRef]
- Huang, C.C.; Tung, T.H.; Huang, C.C.; Lin, S.Y.; Chao, S.C.; Chiu, S.P.; Lee, S.P.; Lo, C.M. Electrochemical Assessment of Anticancer Compounds on the Human Tongue Squamous Carcinoma Cells. Sensors 2020, 20, 2632. [Google Scholar] [CrossRef]
- Tung, T.H.; Wang, S.H.; Huang, C.C.; Su, T.Y.; Lo, C.M. Use of Discrete Wavelet Transform to Assess Impedance Fluctuations Obtained from Cellular Micromotion. Sensors 2020, 20, 3250. [Google Scholar] [CrossRef]
- Lovelady, D.C.; Friedman, J.; Patel, S.; Rabson, D.A.; Lo, C.-M. Detecting effects of low levels of cytochalasin B in 3T3 fibroblast cultures by analysis of electrical noise obtained from cellular micromotion. Biosens. Bioelectron. 2009, 24, 2250–2254. [Google Scholar] [CrossRef] [PubMed]
- Kuruvilla, S.; Qualls, C.W., Jr.; Tyler, R.D.; Witherspoon, S.M.; Benavides, G.R.; Yoon, L.W.; Dold, K.; Brown, R.H.; Sangiah, S.; Morgan, K.T. Effects of minimally toxic levels of carbonyl cyanide P-(trifluoromethoxy) phenylhydrazone (FCCP), elucidated through differential gene expression with biochemical and morphological correlations. Toxicol. Sci. 2003, 73, 348–361. [Google Scholar] [CrossRef] [PubMed]
- Anwer, S.; Szászi, K. Measuring Cell Growth and Junction Development in Epithelial Cells Using Electric Cell-Substrate Impedance Sensing (ECIS). Bio-Protocol 2020, 10, e3729. [Google Scholar] [CrossRef] [PubMed]
- Évora, A.; de Freitas, V.; Mateus, N.; Fernandes, I. The effect of anthocyanins from red wine and blackberry on the integrity of a keratinocyte model using ECIS. Food Funct. 2017, 8, 3989–3998. [Google Scholar] [CrossRef] [PubMed]
- Wu, T.Y.; Liang, Y.H.; Wu, J.C.; Wang, H.S. Interleukin-1beta Enhances Umbilical Cord Mesenchymal Stem Cell Adhesion Ability on Human Umbilical Vein Endothelial Cells via LFA-1/ICAM-1 Interaction. Stem Cells Int. 2019, 2019, 7267142. [Google Scholar] [CrossRef]
- Gamal, W.; Borooah, S.; Smith, S.; Underwood, I.; Srsen, V.; Chandran, S.; Bagnaninchi, P.O.; Dhillon, B. Real-time quantitative monitoring of hiPSC-based model of macular degeneration on Electric Cell-substrate Impedance Sensing microelectrodes. Biosens. Bioelectron. 2015, 71, 445–455. [Google Scholar] [CrossRef]
- Demine, S.; Renard, P.; Arnould, T. Mitochondrial Uncoupling: A Key Controller of Biological Processes in Physiology and Diseases. Cells 2019, 8, 795. [Google Scholar] [CrossRef]
- Brennan, J.P.; Southworth, R.; Medina, R.A.; Davidson, S.M.; Duchen, M.R.; Shattock, M.J. Mitochondrial uncoupling, with low concentration FCCP, induces ROS-dependent cardioprotection independent of KATP channel activation. Cardiovasc. Res. 2006, 72, 313–321. [Google Scholar] [CrossRef]
- Brennan, J.P.; Berry, R.G.; Baghai, M.; Duchen, M.R.; Shattock, M.J. FCCP is cardioprotective at concentrations that cause mitochondrial oxidation without detectable depolarisation. Cardiovasc. Res. 2006, 72, 322–330. [Google Scholar] [CrossRef] [PubMed]
- Demine, S.; Tejerina, S.; Bihin, B.; Thiry, M.; Reddy, N.; Renard, P.; Raes, M.; Jadot, M.; Arnould, T. Mild mitochondrial uncoupling induces HSL/ATGL-independent lipolysis relying on a form of autophagy in 3T3-L1 adipocytes. J. Cell Physiol. 2018, 233, 1247–1265. [Google Scholar] [CrossRef] [PubMed]
- Starkov, A.A. “Mild” uncoupling of mitochondria. Biosci. Rep. 1997, 17, 273–279. [Google Scholar] [CrossRef]
- Berezhnov, A.V.; Soutar, M.P.; Fedotova, E.I.; Frolova, M.S.; Plun-Favreau, H.; Zinchenko, V.P.; Abramov, A.Y. Intracellular pH Modulates Autophagy and Mitophagy. J. Biol. Chem. 2016, 291, 8701–8708. [Google Scholar] [CrossRef] [PubMed]
- Stoetzer, O.J.; Pogrebniak, A.; Pelka-Fleischer, R.; Hasmann, M.; Hiddemann, W.; Nuessler, V. Modulation of apoptosis by mitochondrial uncouplers: Apoptosis-delaying features despite intrinsic cytotoxicity. Biochem. Pharmacol. 2002, 63, 471–483. [Google Scholar] [CrossRef]
- Dispersyn, G.; Nuydens, R.; Connors, R.; Borgers, M.; Geerts, H. Bcl-2 protects against FCCP-induced apoptosis and mitochondrial membrane potential depolarization in PC12 cells. Biochim. Biophys. Acta 1999, 1428, 357–371. [Google Scholar] [CrossRef]
- Han, Y.H.; Yang, Y.M.; Park, W.H. Carbonyl cyanide p-(trifluoromethoxy) phenylhydroazone induces caspase-independent apoptosis in As4.1 juxtaglomerular cells. Anticancer Res. 2010, 30, 2863–2868. [Google Scholar]
- Mlejnek, P.; Dolezel, P. Loss of mitochondrial transmembrane potential and glutathione depletion are not sufficient to account for induction of apoptosis by carbonyl cyanide 4-(trifluoromethoxy)phenylhydrazone in human leukemia K562 cells. Chem. Biol. Interact. 2015, 239, 100–110. [Google Scholar] [CrossRef]
- Maro, B.; Bornens, M. Reorganization of HeLa cell cytoskeleton induced by an uncoupler of oxidative phosphorylation. Nature 1982, 295, 334–336. [Google Scholar] [CrossRef]
- Kadi, A.; Pichard, V.; Lehmann, M.; Briand, C.; Braguer, D.; Marvaldi, J.; Rognoni, J.B.; Luis, J. Effect of microtubule disruption on cell adhesion and spreading. Biochem. Biophys. Res. Commun. 1998, 246, 690–695. [Google Scholar] [CrossRef]
- Liu, X.; Hajnoczky, G. Altered fusion dynamics underlie unique morphological changes in mitochondria during hypoxia-reoxygenation stress. Cell Death Differ. 2011, 18, 1561–1572. [Google Scholar] [CrossRef]
- Legros, F.; Lombes, A.; Frachon, P.; Rojo, M. Mitochondrial fusion in human cells is efficient, requires the inner membrane potential, and is mediated by mitofusins. Mol. Biol. Cell 2002, 13, 4343–4354. [Google Scholar] [CrossRef] [PubMed]
- Mishra, P.; Chan, D.C. Metabolic regulation of mitochondrial dynamics. J. Cell Biol. 2016, 212, 379–387. [Google Scholar] [CrossRef] [PubMed]
- Picard, M.; Shirihai, O.S.; Gentil, B.J.; Burelle, Y. Mitochondrial morphology transitions and functions: Implications for retrograde signaling? Am. J. Physiol. Regul. Integr. Comp. Physiol. 2013, 304, R393–R406. [Google Scholar] [CrossRef] [PubMed]
- Wai, T.; Langer, T. Mitochondrial Dynamics and Metabolic Regulation. Trends Endocrinol. Metab. 2016, 27, 105–117. [Google Scholar] [CrossRef] [PubMed]
- Opp, D.; Wafula, B.; Lim, J.; Huang, E.; Lo, J.-C.; Lo, C.-M. Use of electric cell–substrate impedance sensing to assess in vitro cytotoxicity. Biosens. Bioelectron. 2009, 24, 2625–2629. [Google Scholar] [CrossRef] [PubMed]
- Hollenbeck, P.J.; Bray, D.; Adams, R.J. Effects of the uncoupling agents FCCP and CCCP on the saltatory movements of cytoplasmic organelles. Cell Biol. Int. Rep. 1985, 9, 193–199. [Google Scholar] [CrossRef]
- Padhi, A.; Thomson, A.H.; Perry, J.B.; Davis, G.N.; McMillan, R.P.; Loesgen, S.; Kaweesa, E.N.; Kapania, R.; Nain, A.S.; Brown, D.A. Bioenergetics underlying single-cell migration on aligned nanofiber scaffolds. Am. J. Physiol. Cell Physiol. 2020, 318, C476–C485. [Google Scholar] [CrossRef]


Publisher’s Note: MDPI stays neutral with regard to jurisdictional claims in published maps and institutional affiliations. |
© 2021 by the authors. Licensee MDPI, Basel, Switzerland. This article is an open access article distributed under the terms and conditions of the Creative Commons Attribution (CC BY) license (https://creativecommons.org/licenses/by/4.0/).
Share and Cite
Wang, S.-H.; Tung, T.-H.; Chiu, S.-P.; Chou, H.-Y.; Hung, Y.-H.; Lai, Y.-T.; Lee, Y.-W.; Lee, S.-P.; Lo, C.-M. Detecting Effects of Low Levels of FCCP on Stem Cell Micromotion and Wound-Healing Migration by Time-Series Capacitance Measurement. Sensors 2021, 21, 3017. https://doi.org/10.3390/s21093017
Wang S-H, Tung T-H, Chiu S-P, Chou H-Y, Hung Y-H, Lai Y-T, Lee Y-W, Lee S-P, Lo C-M. Detecting Effects of Low Levels of FCCP on Stem Cell Micromotion and Wound-Healing Migration by Time-Series Capacitance Measurement. Sensors. 2021; 21(9):3017. https://doi.org/10.3390/s21093017
Chicago/Turabian StyleWang, Si-Han, Tse-Hua Tung, Sheng-Po Chiu, Hsin-Yi Chou, Yu-Han Hung, Yi-Ting Lai, Yu-Wei Lee, Shiao-Pieng Lee, and Chun-Min Lo. 2021. "Detecting Effects of Low Levels of FCCP on Stem Cell Micromotion and Wound-Healing Migration by Time-Series Capacitance Measurement" Sensors 21, no. 9: 3017. https://doi.org/10.3390/s21093017
APA StyleWang, S.-H., Tung, T.-H., Chiu, S.-P., Chou, H.-Y., Hung, Y.-H., Lai, Y.-T., Lee, Y.-W., Lee, S.-P., & Lo, C.-M. (2021). Detecting Effects of Low Levels of FCCP on Stem Cell Micromotion and Wound-Healing Migration by Time-Series Capacitance Measurement. Sensors, 21(9), 3017. https://doi.org/10.3390/s21093017