
Diagnostic Interpretation of Non-Uniformly Sampled Electrocardiogram


Abstract
1. Introduction
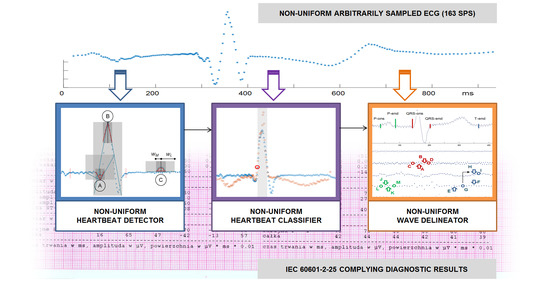
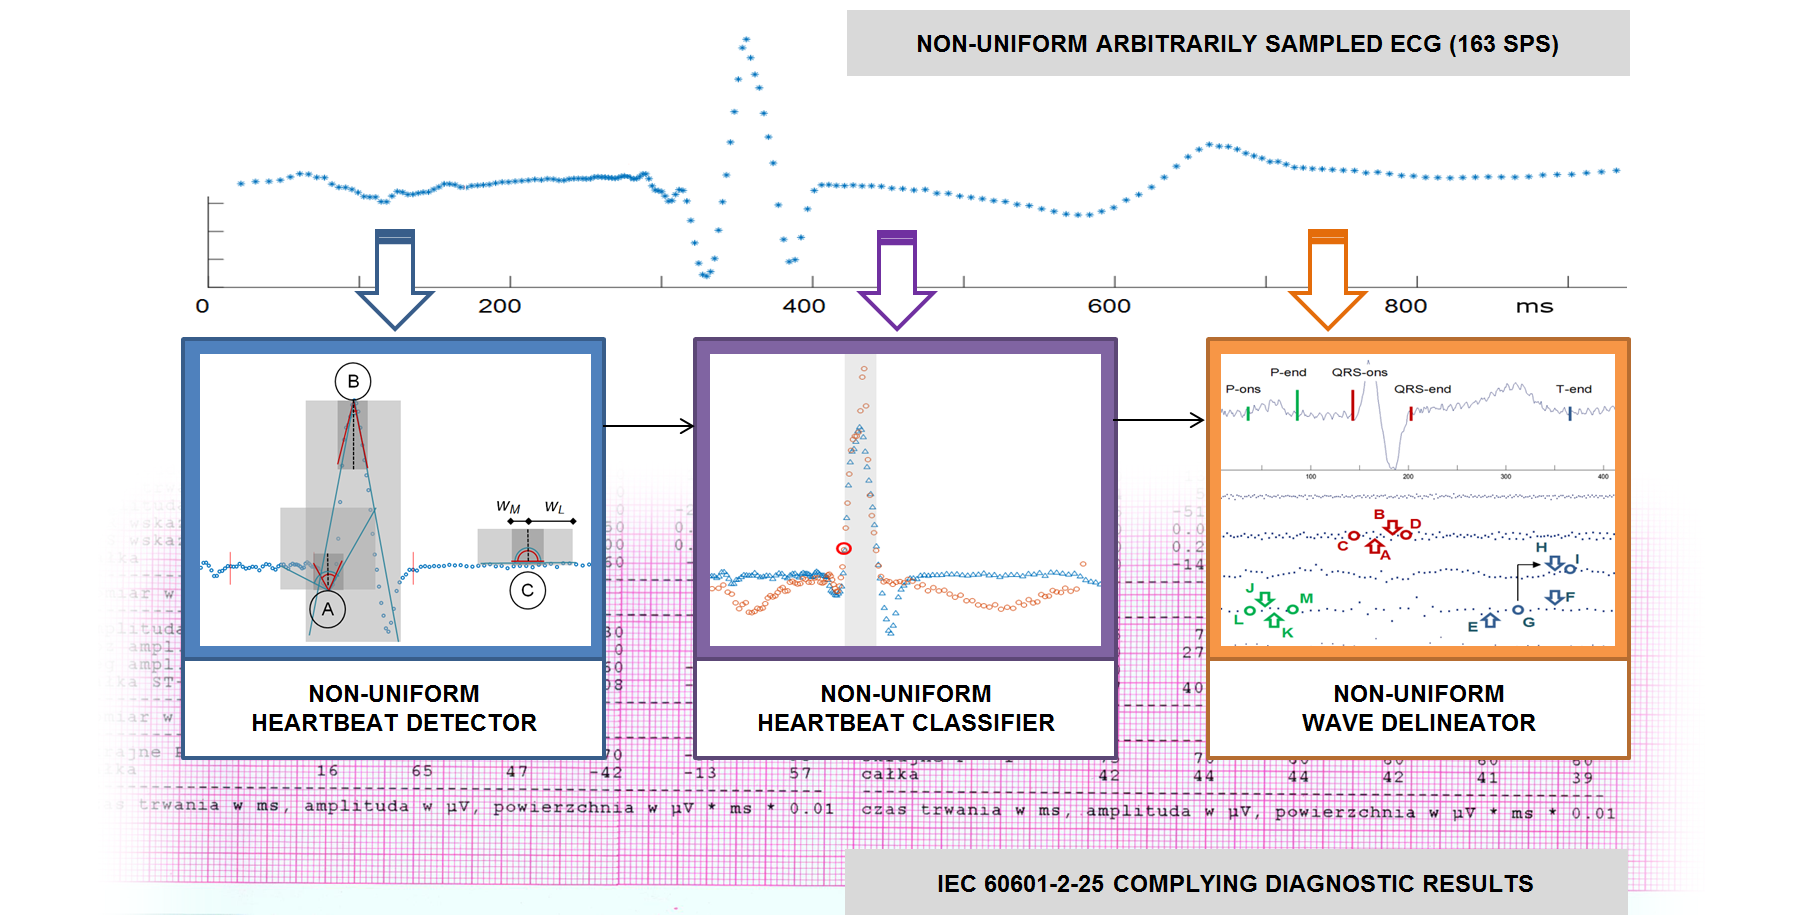
2. ECG Diagnostic Procedures
- Beat-to-beat variations of selected heartbeat parameters such as RR interval, beat types (arrhythmia), ST-segment, T-wave alternans etc., also known as sequence analysis.
- Details of the conduction path functionality, expressed in parameters of most typical heartbeat or group representative, also known as contour analysis.
- a heartbeat detector,
- a heartbeat classifier, and
- a wave border delineator.
3. Non-Uniform Sampling
- Uniform signals with occasionally missing samples, e.g., being results of data transmission or storage errors, where outliers are usually interpolated from the neighbor values.
- Partially decimated signals, where local sampling interval is a multiple of given basic interval, being usually a result of compressed sensing or time-domain reconstruction from incomplete dyadic wavelet representation; in these signals we assume the sampling interval to be given by a discrete-time function with discrete values.
- Signals with random sampling intervals; in these signals we assume the sampling interval to be given by a continuous time domain discrete value function.
- (1)
- Given a generator φ, one need to find conditions on X, in the form of a density, such that for cp and Cp being positive constants independent of f the norm equivalence holds:Then, at least in principle, is uniquely and stably determined by .
- (2)
- One needs to design reconstruction procedures which are useful in practical applications to recover f from its samples , when the norm equivalence (above) is satisfied. The numerical algorithm has to be efficient and fast, therefore first approaches useful for arbitrary sampling used adaptive weights to compensate for the local variations of the sampling density.
4. Proposed Methodology of Non-Uniform ECG Interpretation
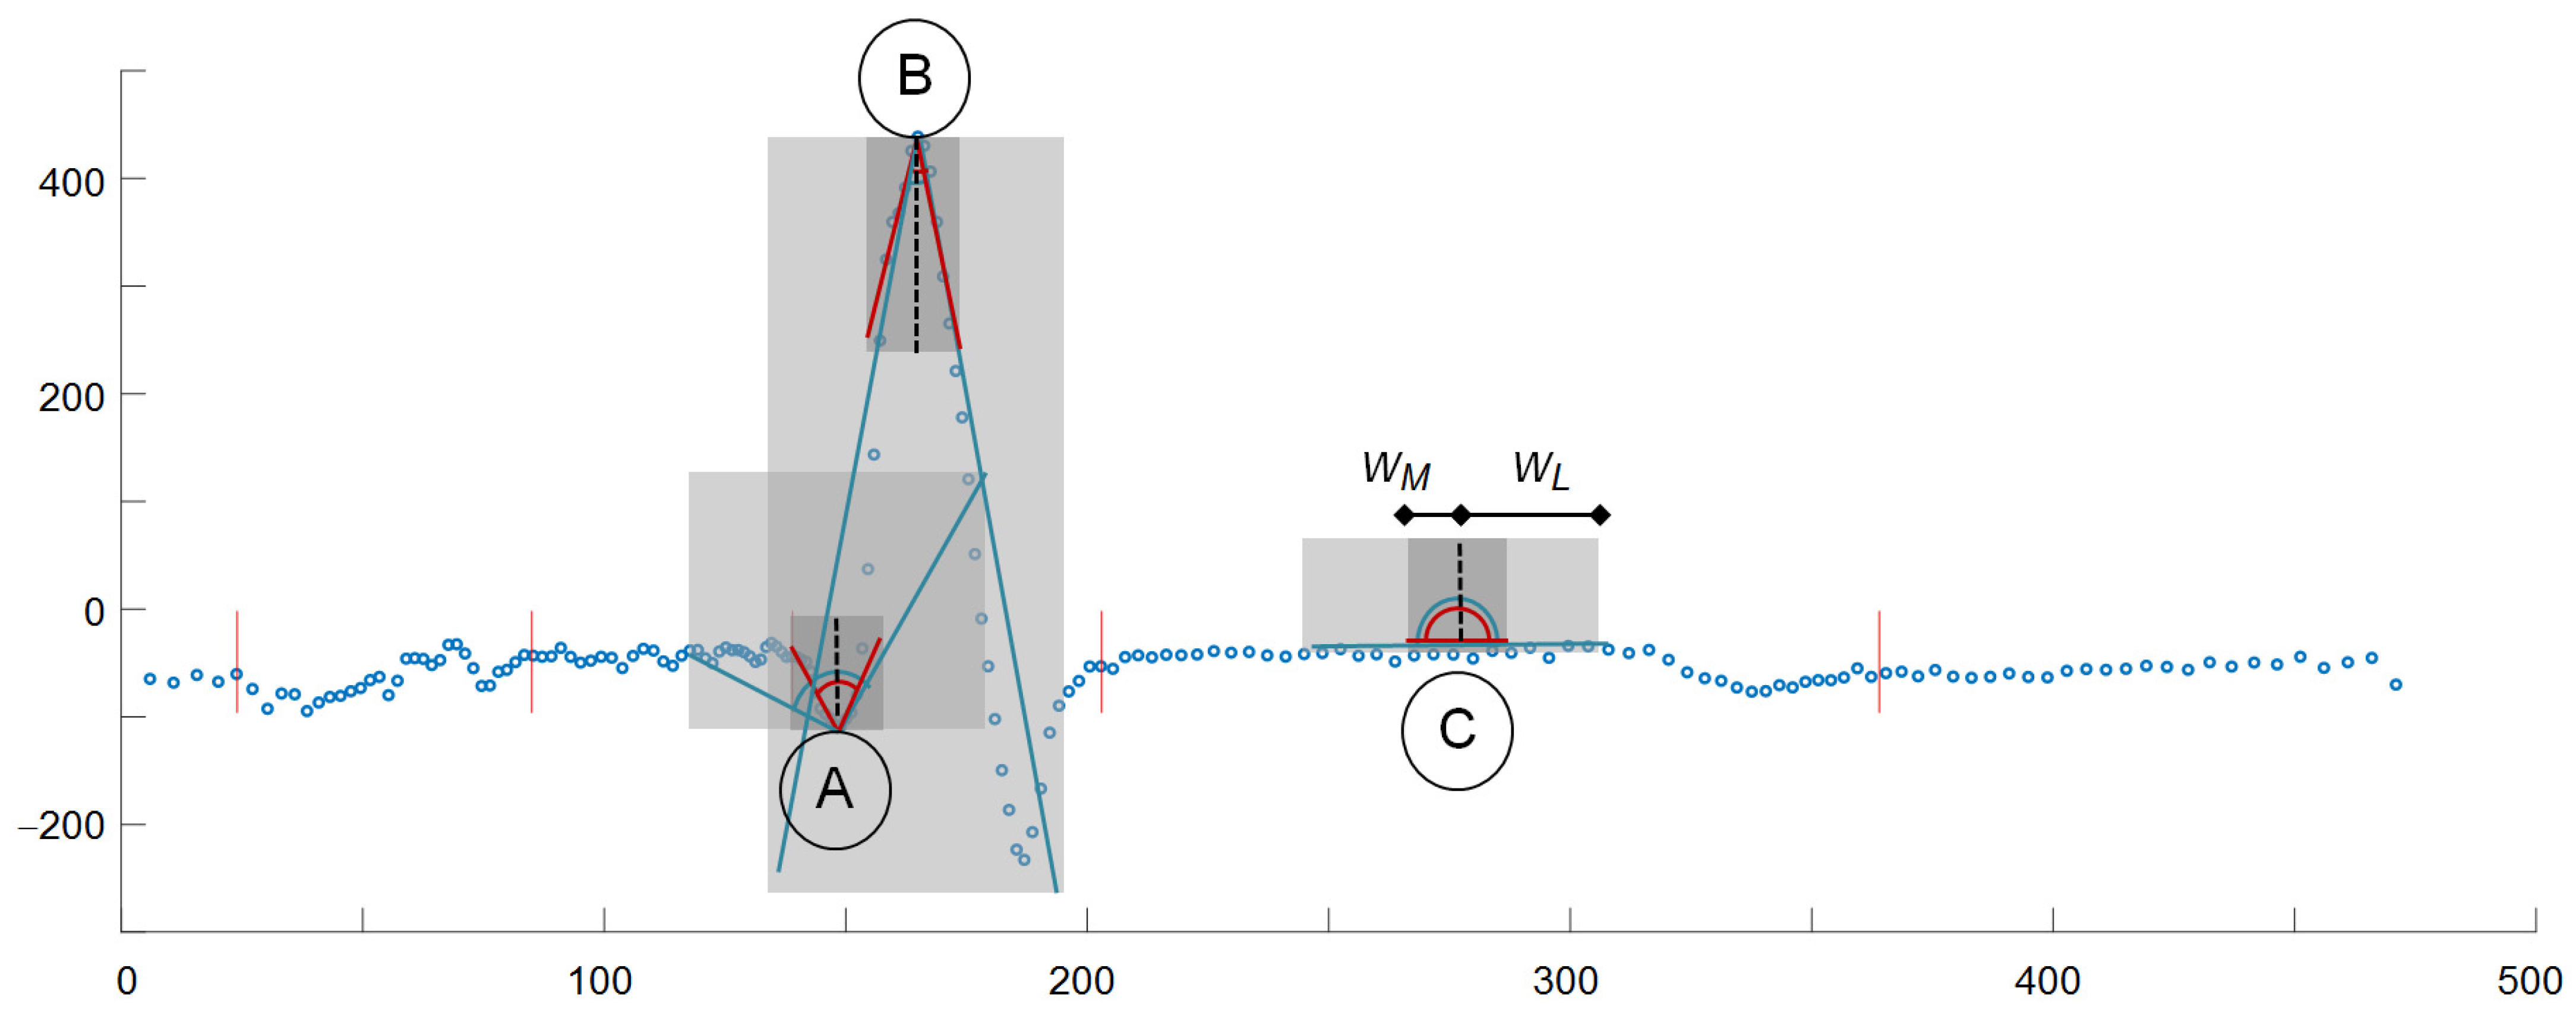
4.1. QRS Detection in Non-Uniform Ecg Signal
- (1)
- We build two pairs: (1) a long time (ΔtL = 61 ms) and (2) a short time (ΔtM = 20 ms) of triangle legs with ends wL−, wL+:and wM−, wM+:
- (2)
- We determine the slope coefficients mL−(t) and mL+(t) (and respectively mM−(t) and mM+(t)) of segments y = m·t best fitted to the selected samples as:where J is the total number of samples in the window, j is the current sample number relative to the window onset, and K are weighting window coefficients. The weighting coefficients are used to differentiate the influence of samples depending on their distance to the cloud center. In the experiments initially we used flat window (i.e., all points equally important), but finally applied Gaussian window of type .
- (3)
- We calculate the angle L(t) of best fitted triangle legs wL− and wL+ adjacent to the time point t (Equation (8)) as in [26]:and reuse (Equation (8)) to similarly determine the angle M(t) of best fitted triangle legs wM− and wM+.
- (4)
- Since the heartbeat peak is characterized by significant turn of activity represented in small values of angles between long time triangle legs and concurrently between short time triangle legs, we simply take the inverse of product of these values:or, in case of a multilead record:where C is the total number of leads and c stands for the current lead number.
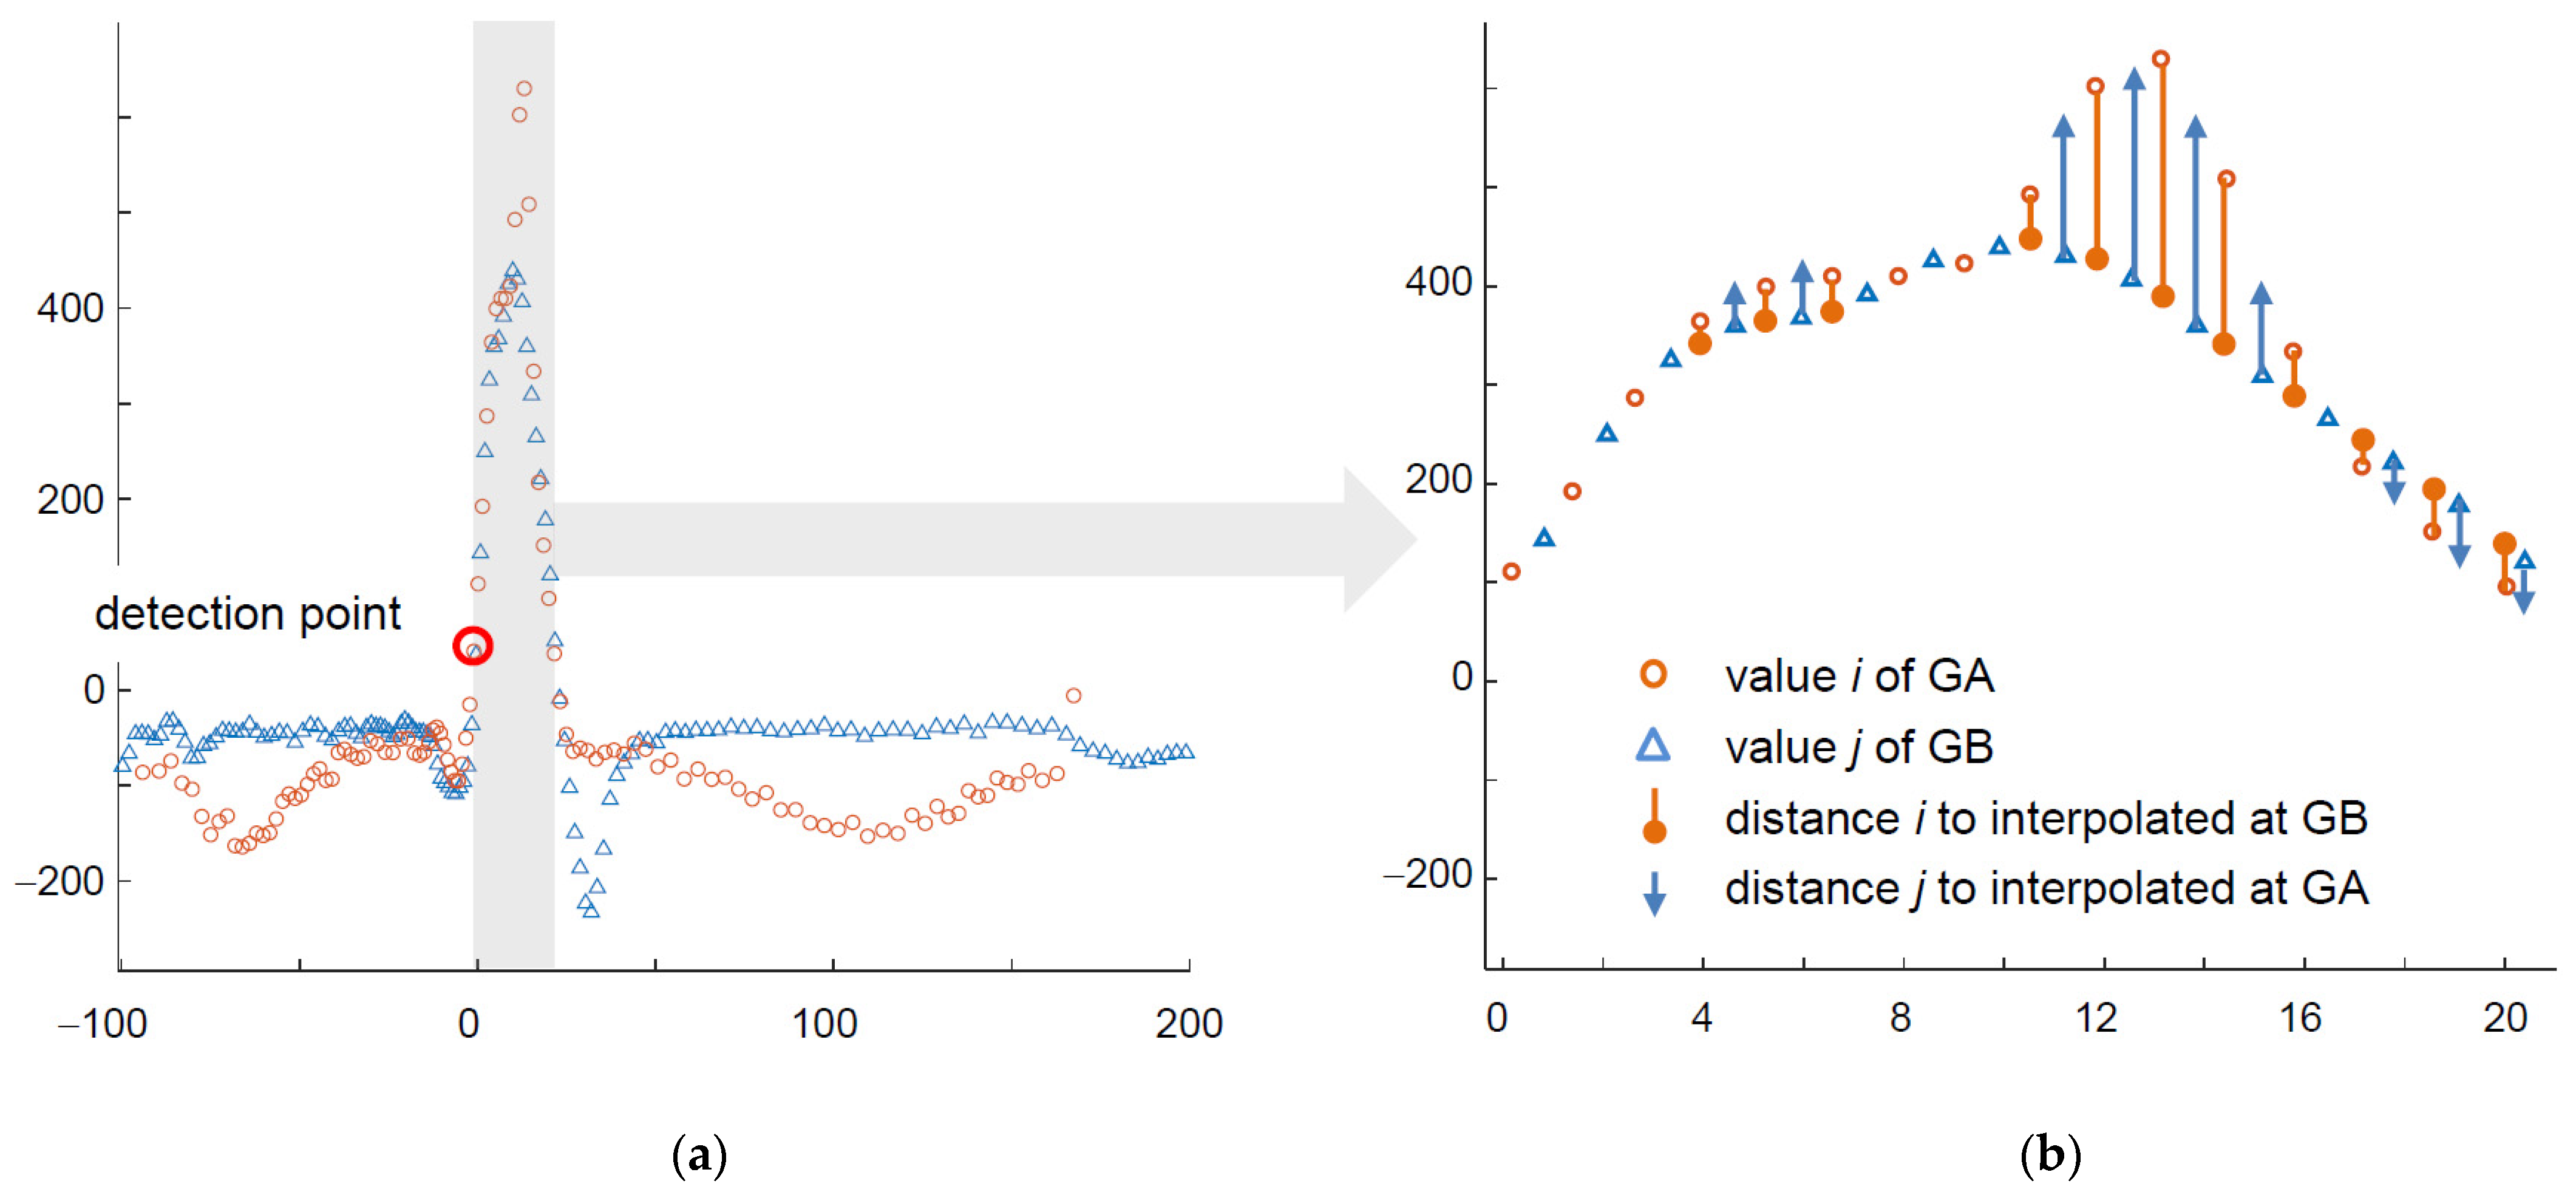
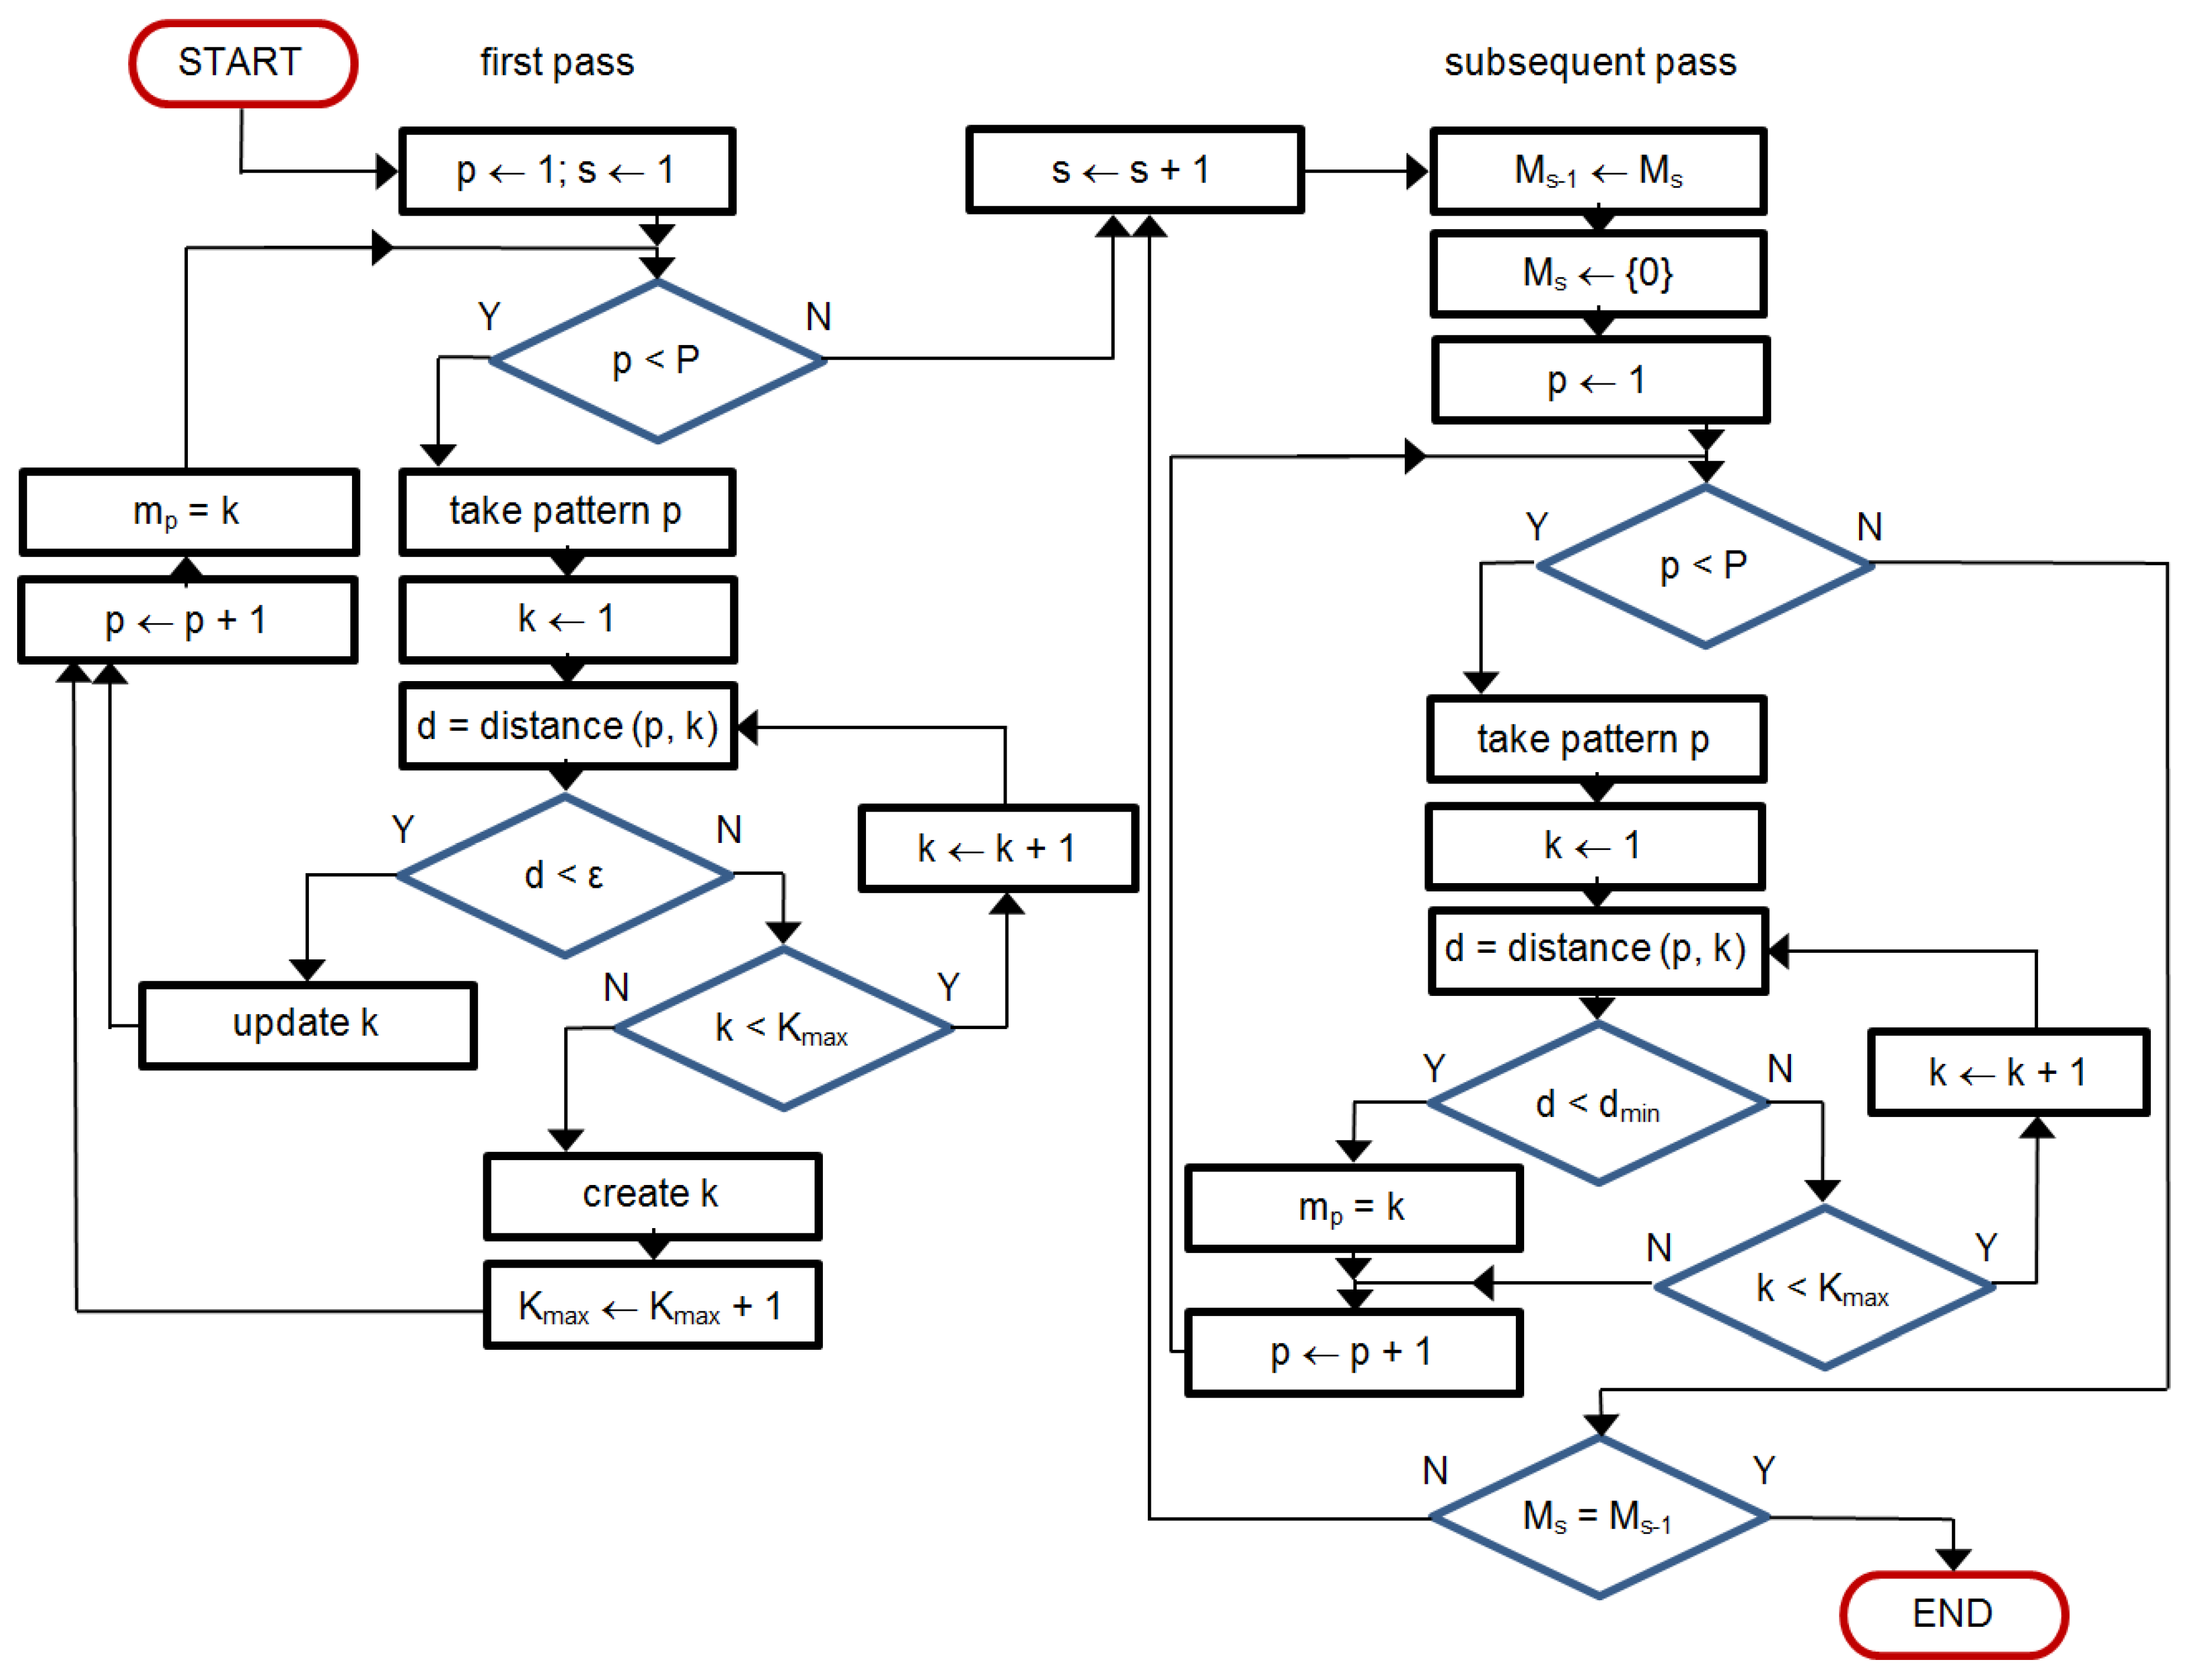
4.2. QRS/Beat Classification for Non-Uniform Patterns
- In the first step, for each node in GA corresponding node(s) in GB are found so as they have most similar time attribute; similar correspondence is reciprocally built for GB nodes.
- The GA node at the detection point is aligned to its counterpart at the GB detection point.
- For each other node the node of minimum absolute time is selected and the value of its counterpart node (i.e., with the same time attribute) is interpolated in the other graph.
- Similarity score is then calculated as cumulative sum of absolute differences of values at subsequent nodes modulated by a time-dependent weighting factor.
- Dividing of the similarity score by the average amplitude ends calculation of the distance.
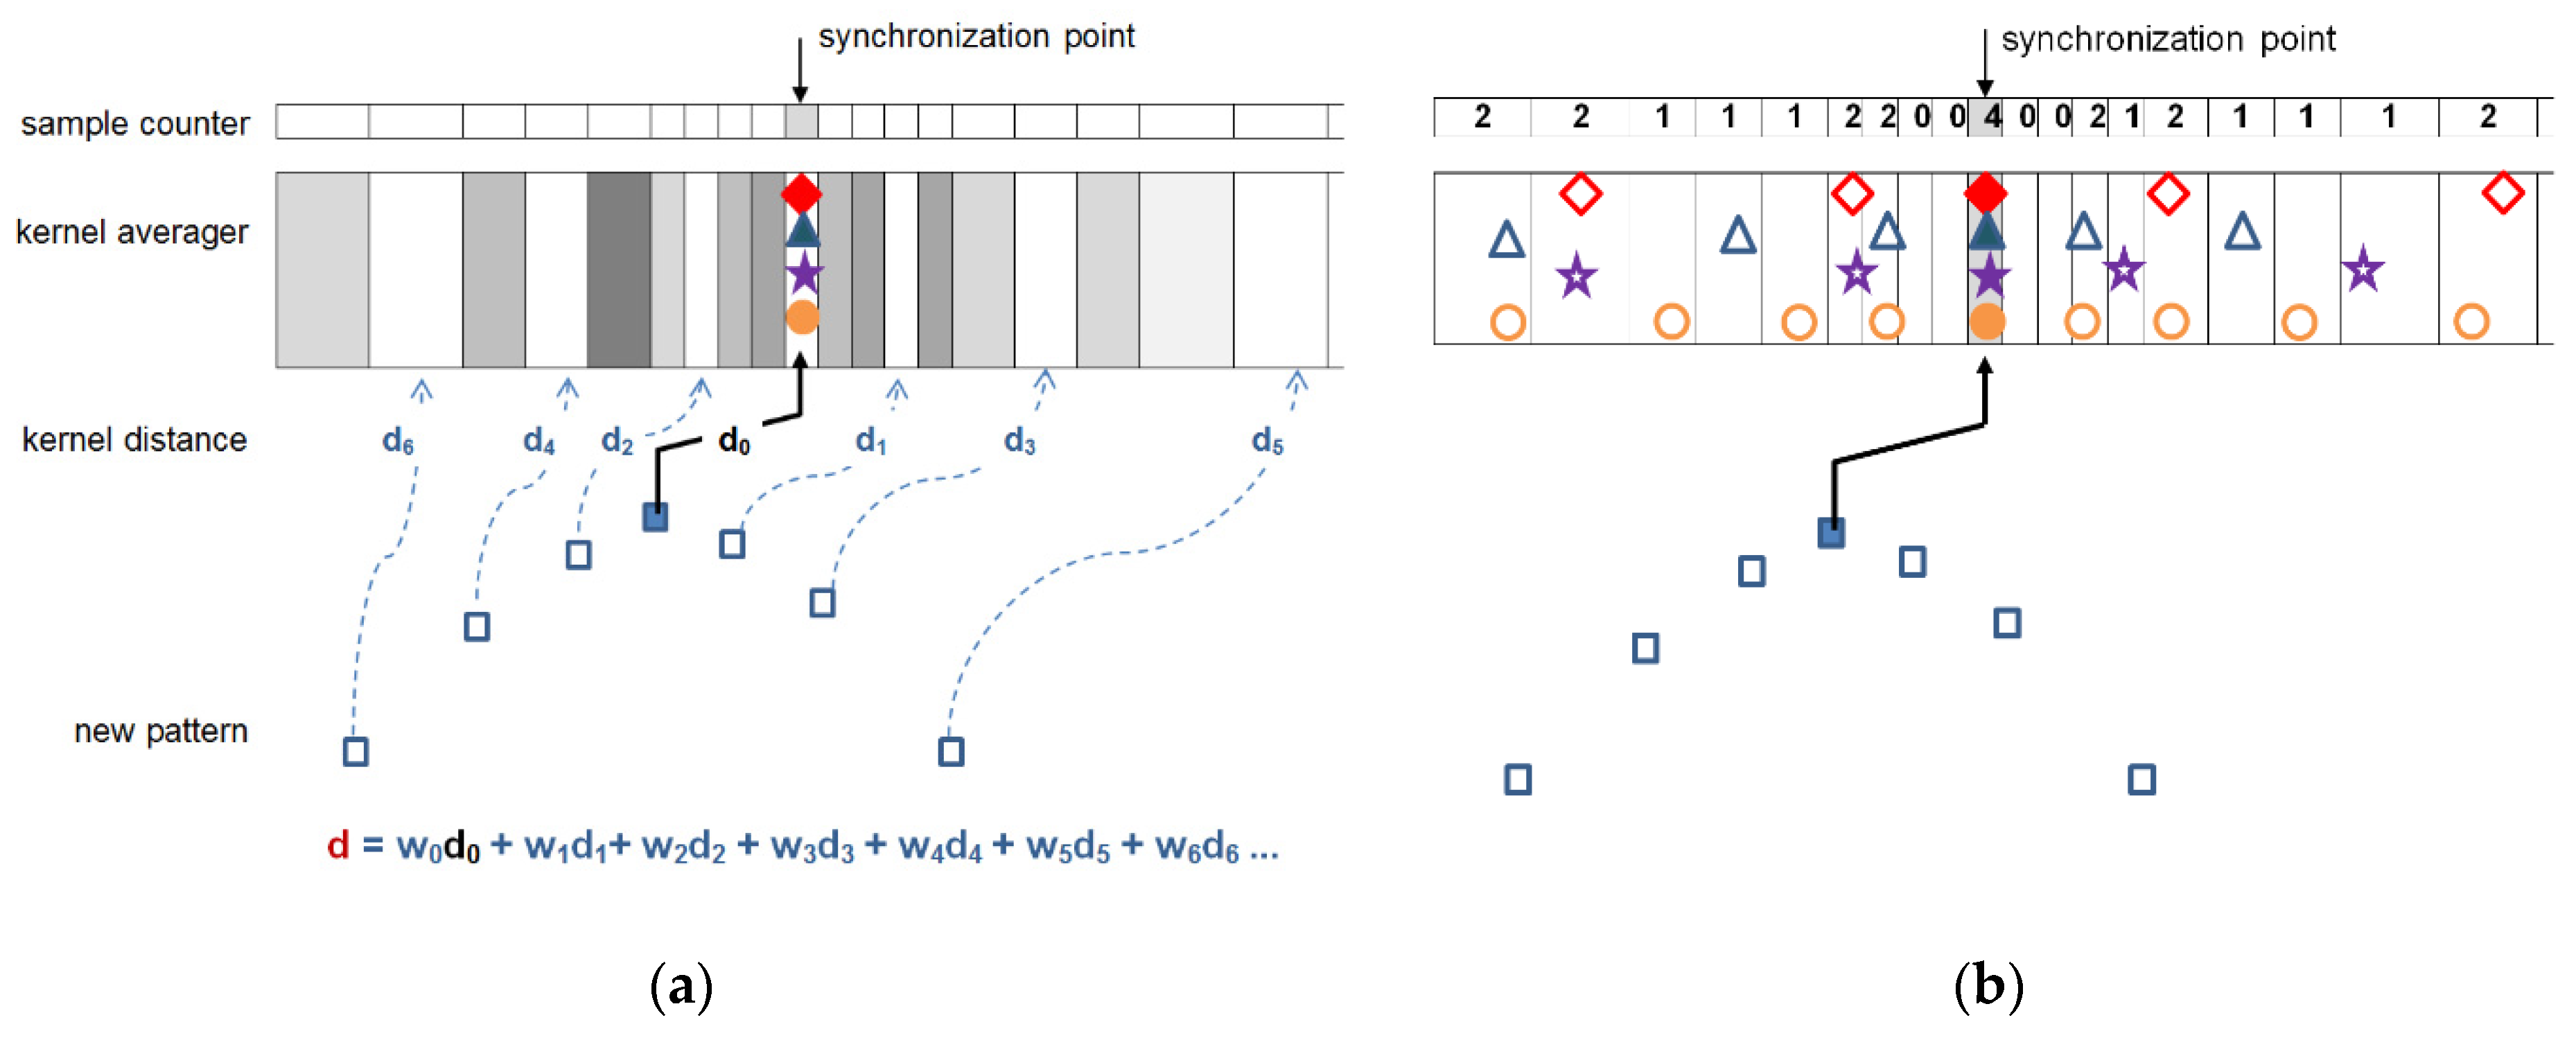
- In a multilead record common wave border values are used to determine arbitrary sampling grid at signal source, therefore time attributes of graph signal representation in particular leads are the same.
- In arbitrary sampling shorter sampling interval was applied to more informative parts of the ECG (e.g., within the confines of QRS), consequently the information on sampling interval may be used as modulator of the similarity score.
- In threshold-based decision making the beat-to-kernel comparison can be stopped immediately when the cumulative dissimilarity exceeds the threshold value; doing so helps to avoid unnecessary calculations.
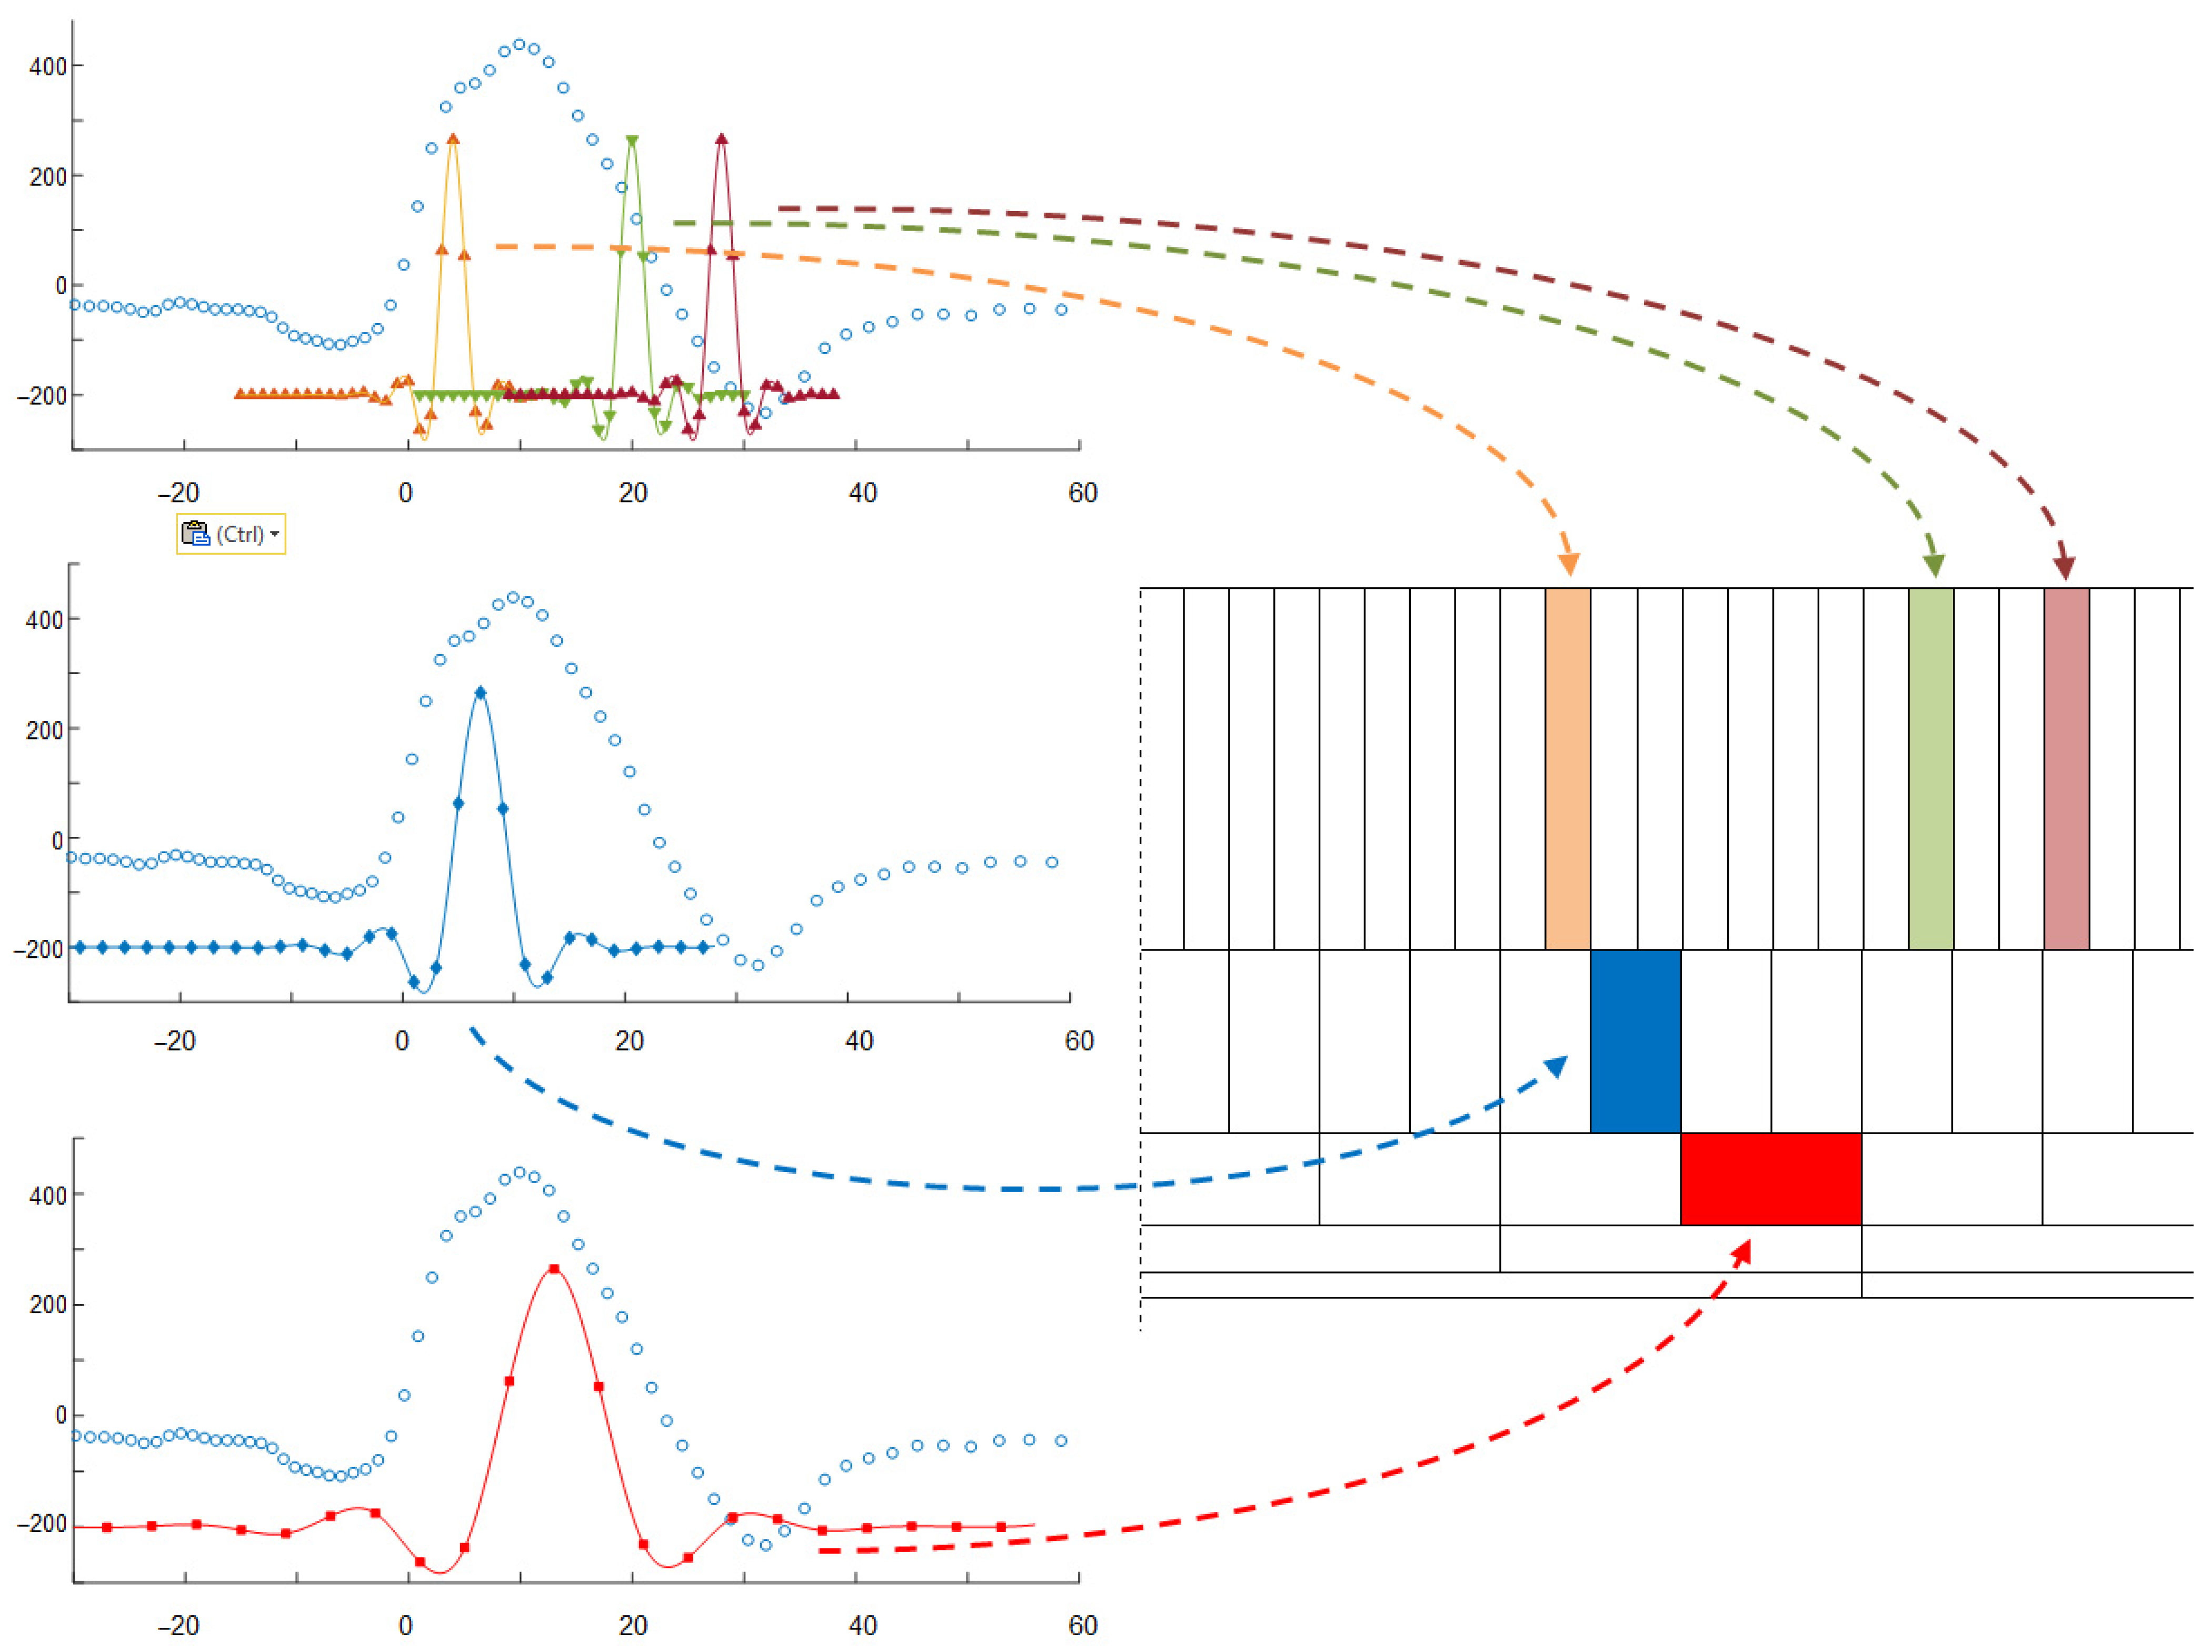
- While in uniform case updating of the kernel may be done by averaging of respective samples, arbitrarily sampled beats may update the kernel either by updating the values existing near to respective time coordinates, or by contributing with new data falling between the existing samples. Therefore, for class kernel representations we adopt a beat-independent arbitrary quantization pattern (Figure 4). It increases local sampling density (i.e., decreases the sampling interval) near the fiducial point to a value 8-times higher than maximum signal sampling density and decreases it respectively with the distance from the fiducial point. Consequently, amplitude values next to the fiducial point (i.e., in central part of the pattern) contribute more significantly to the likelihood assessment than the peripheral part of the beat or kernel. This significantly limits the count of required interpolations and saves much of the computation burden at the price of classification accuracy.
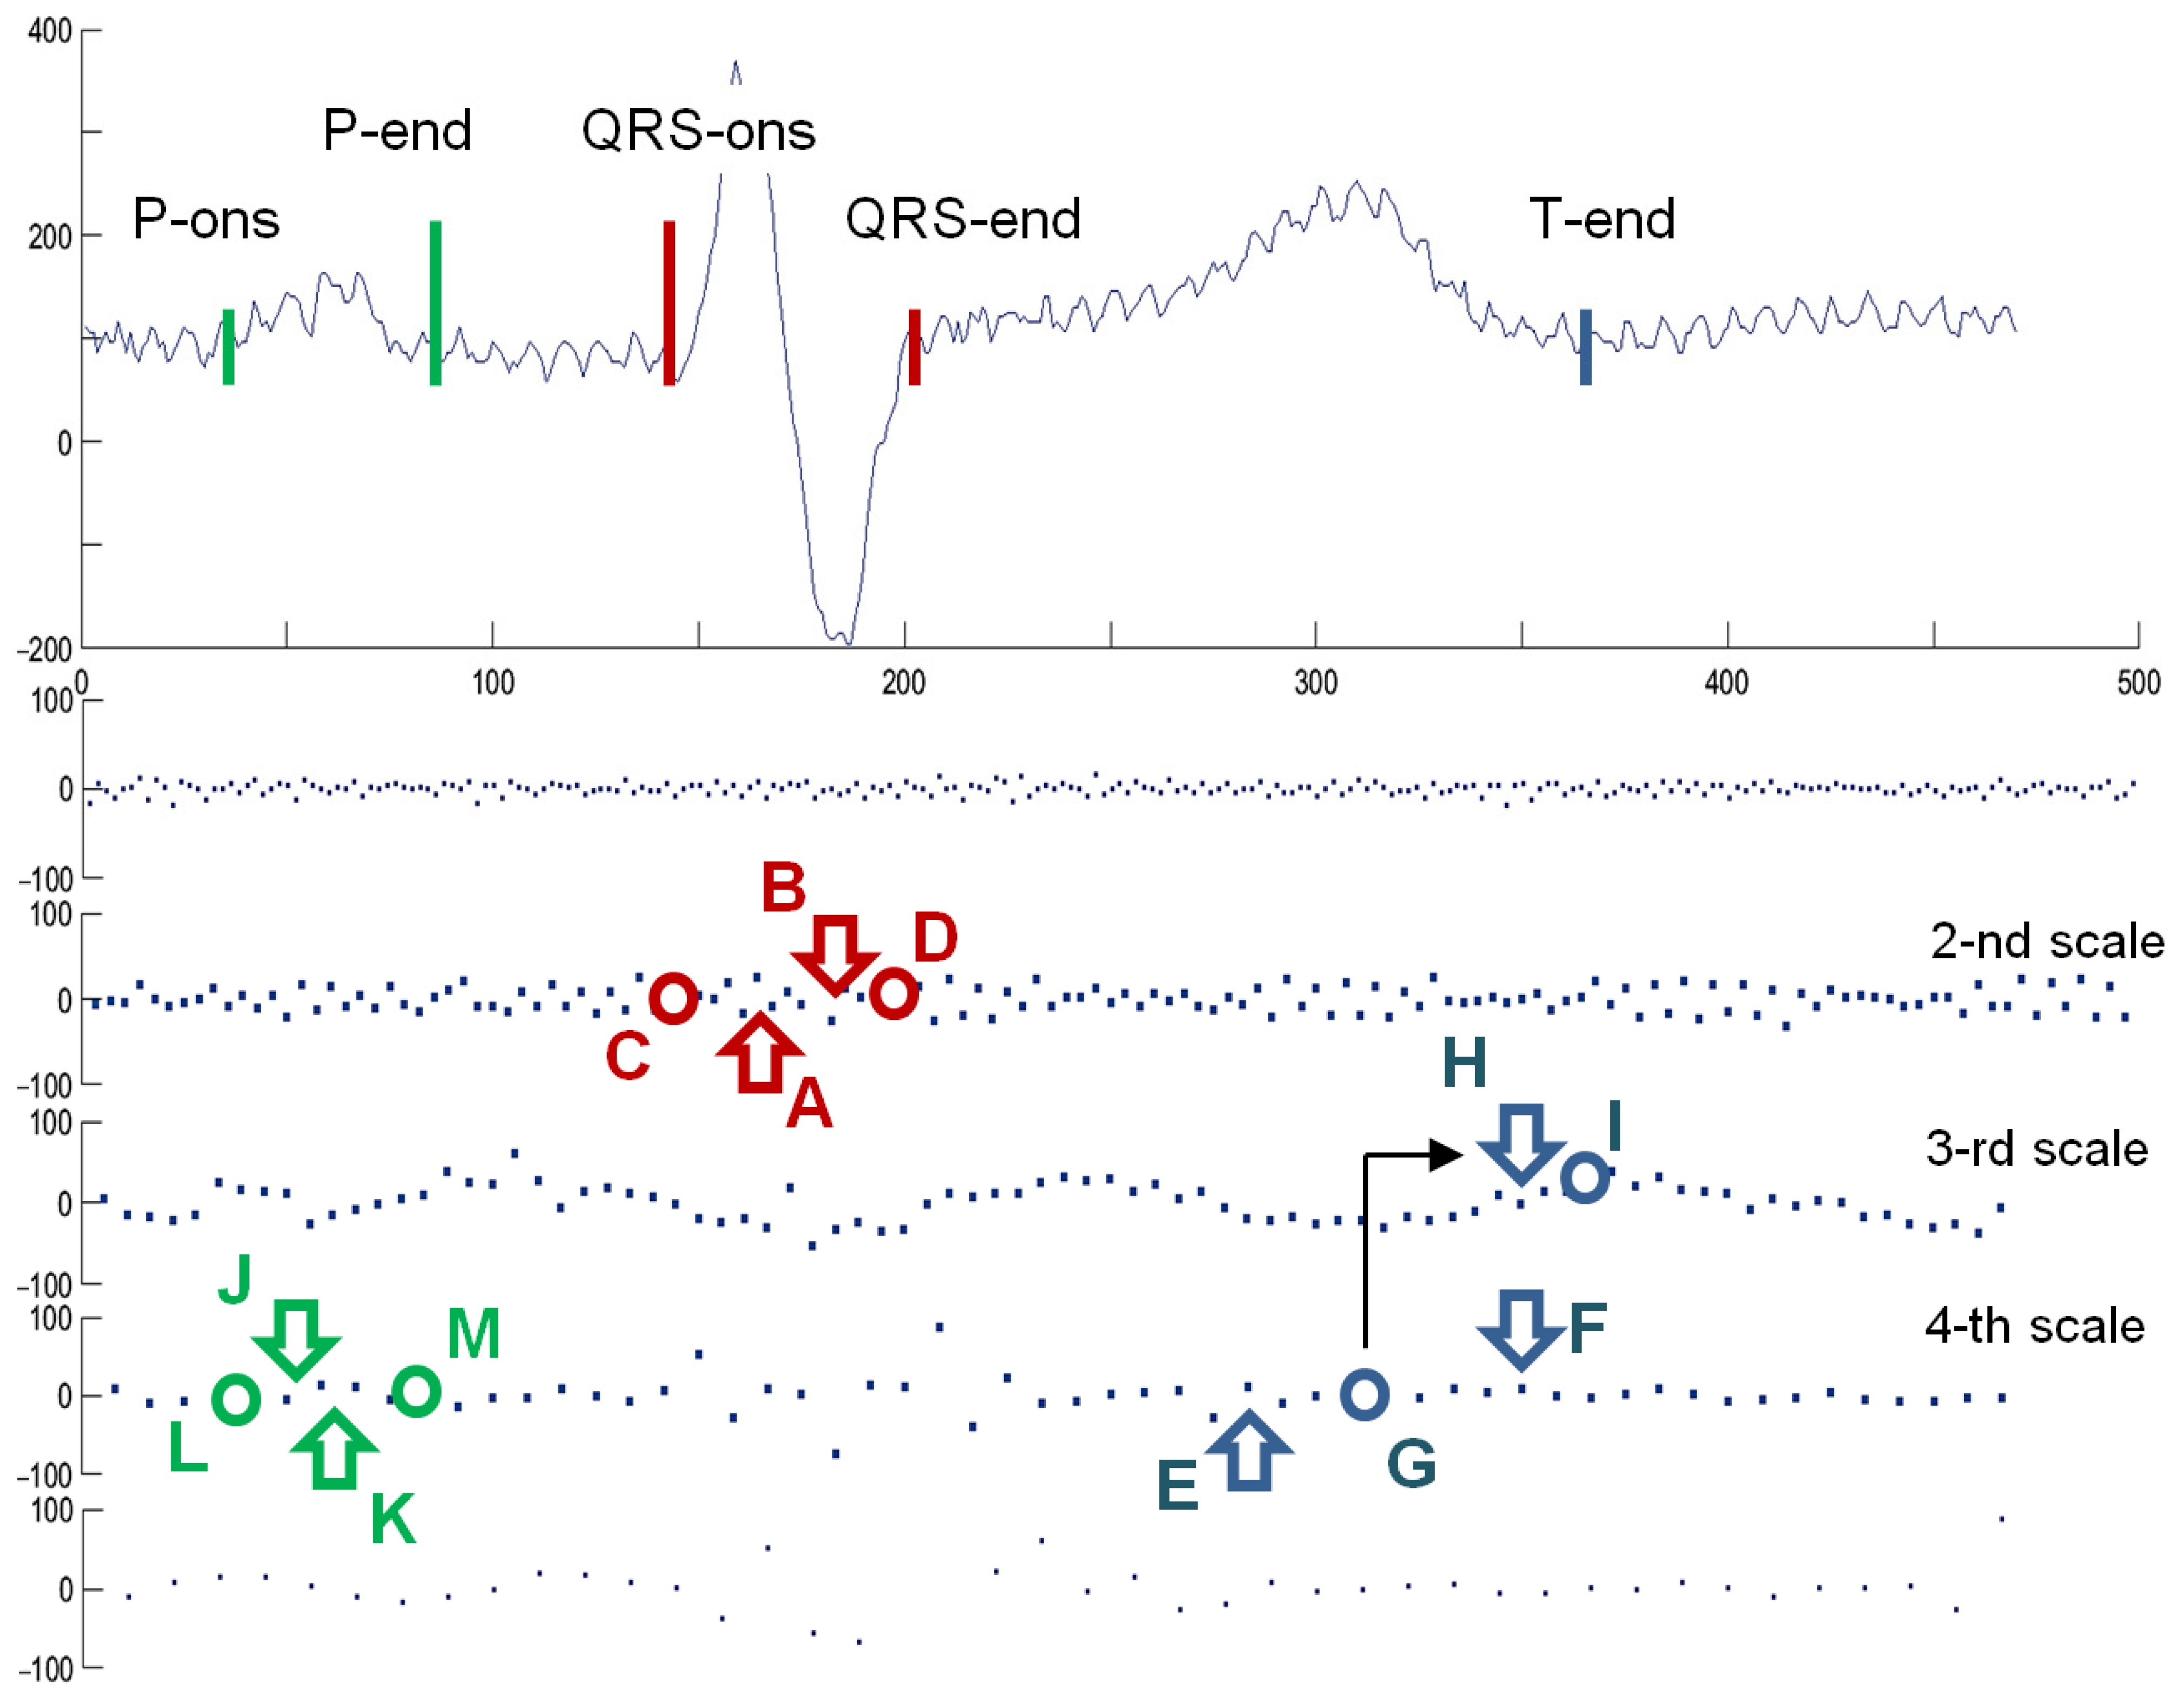
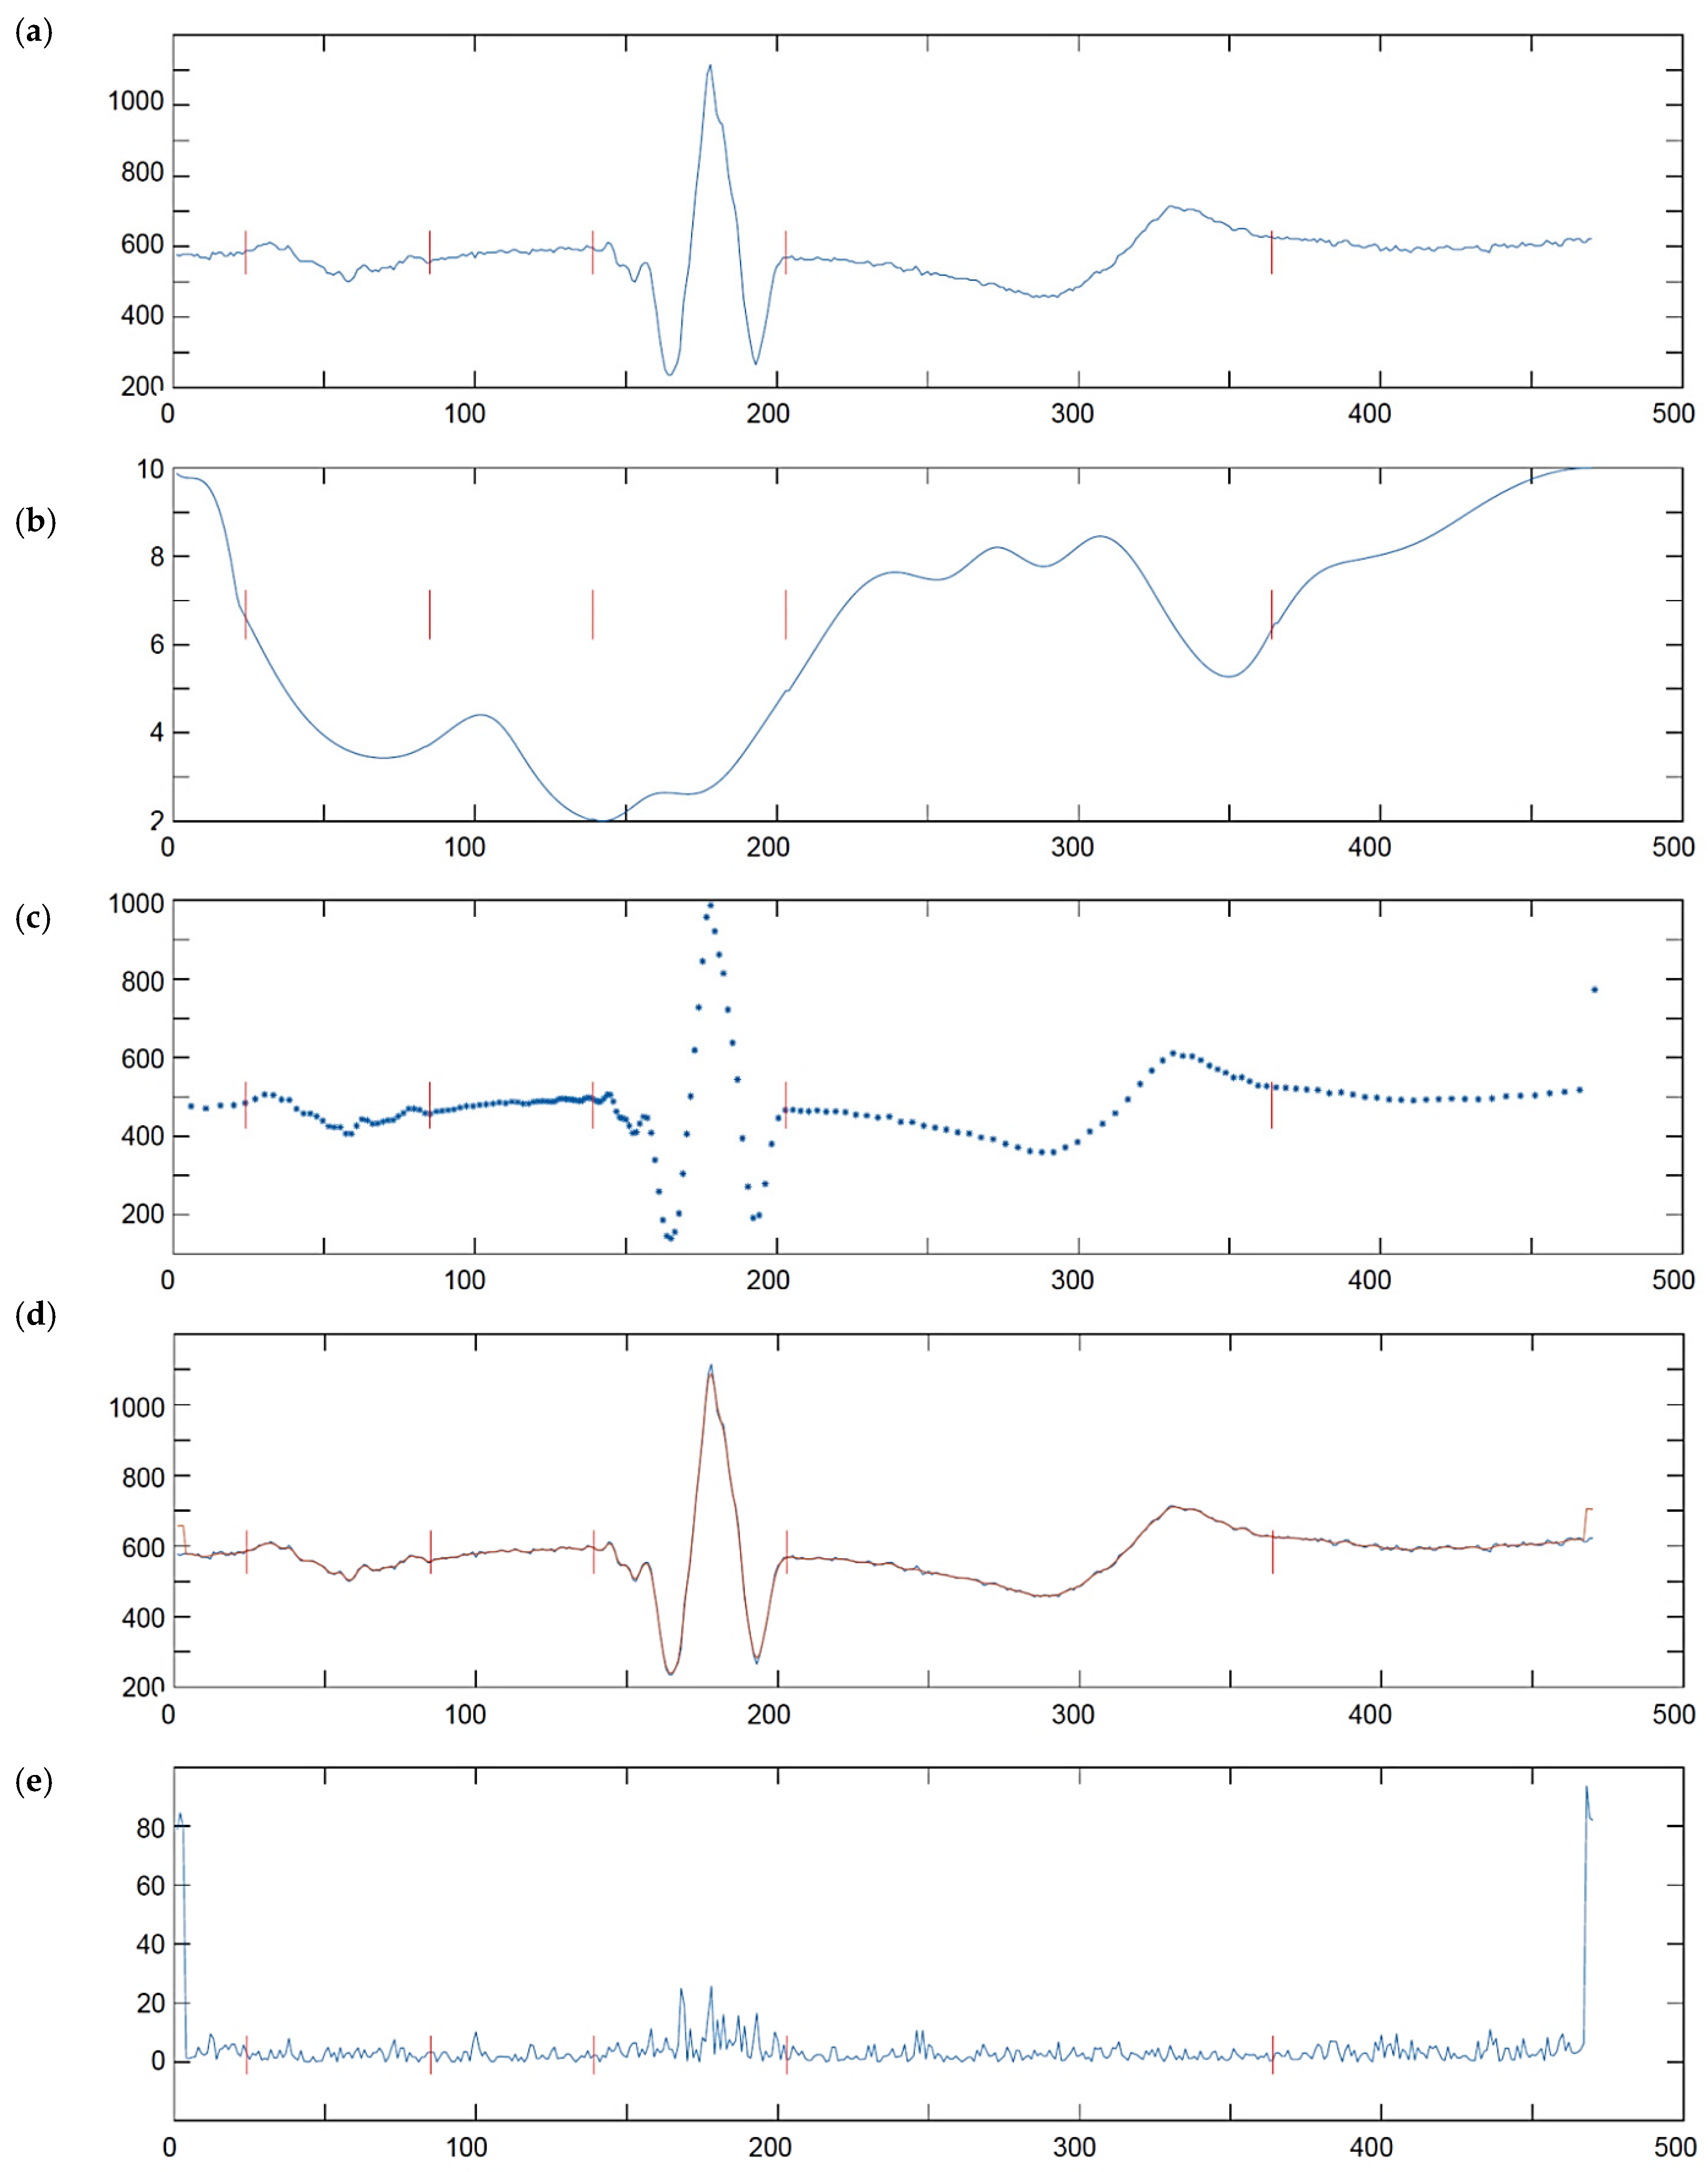
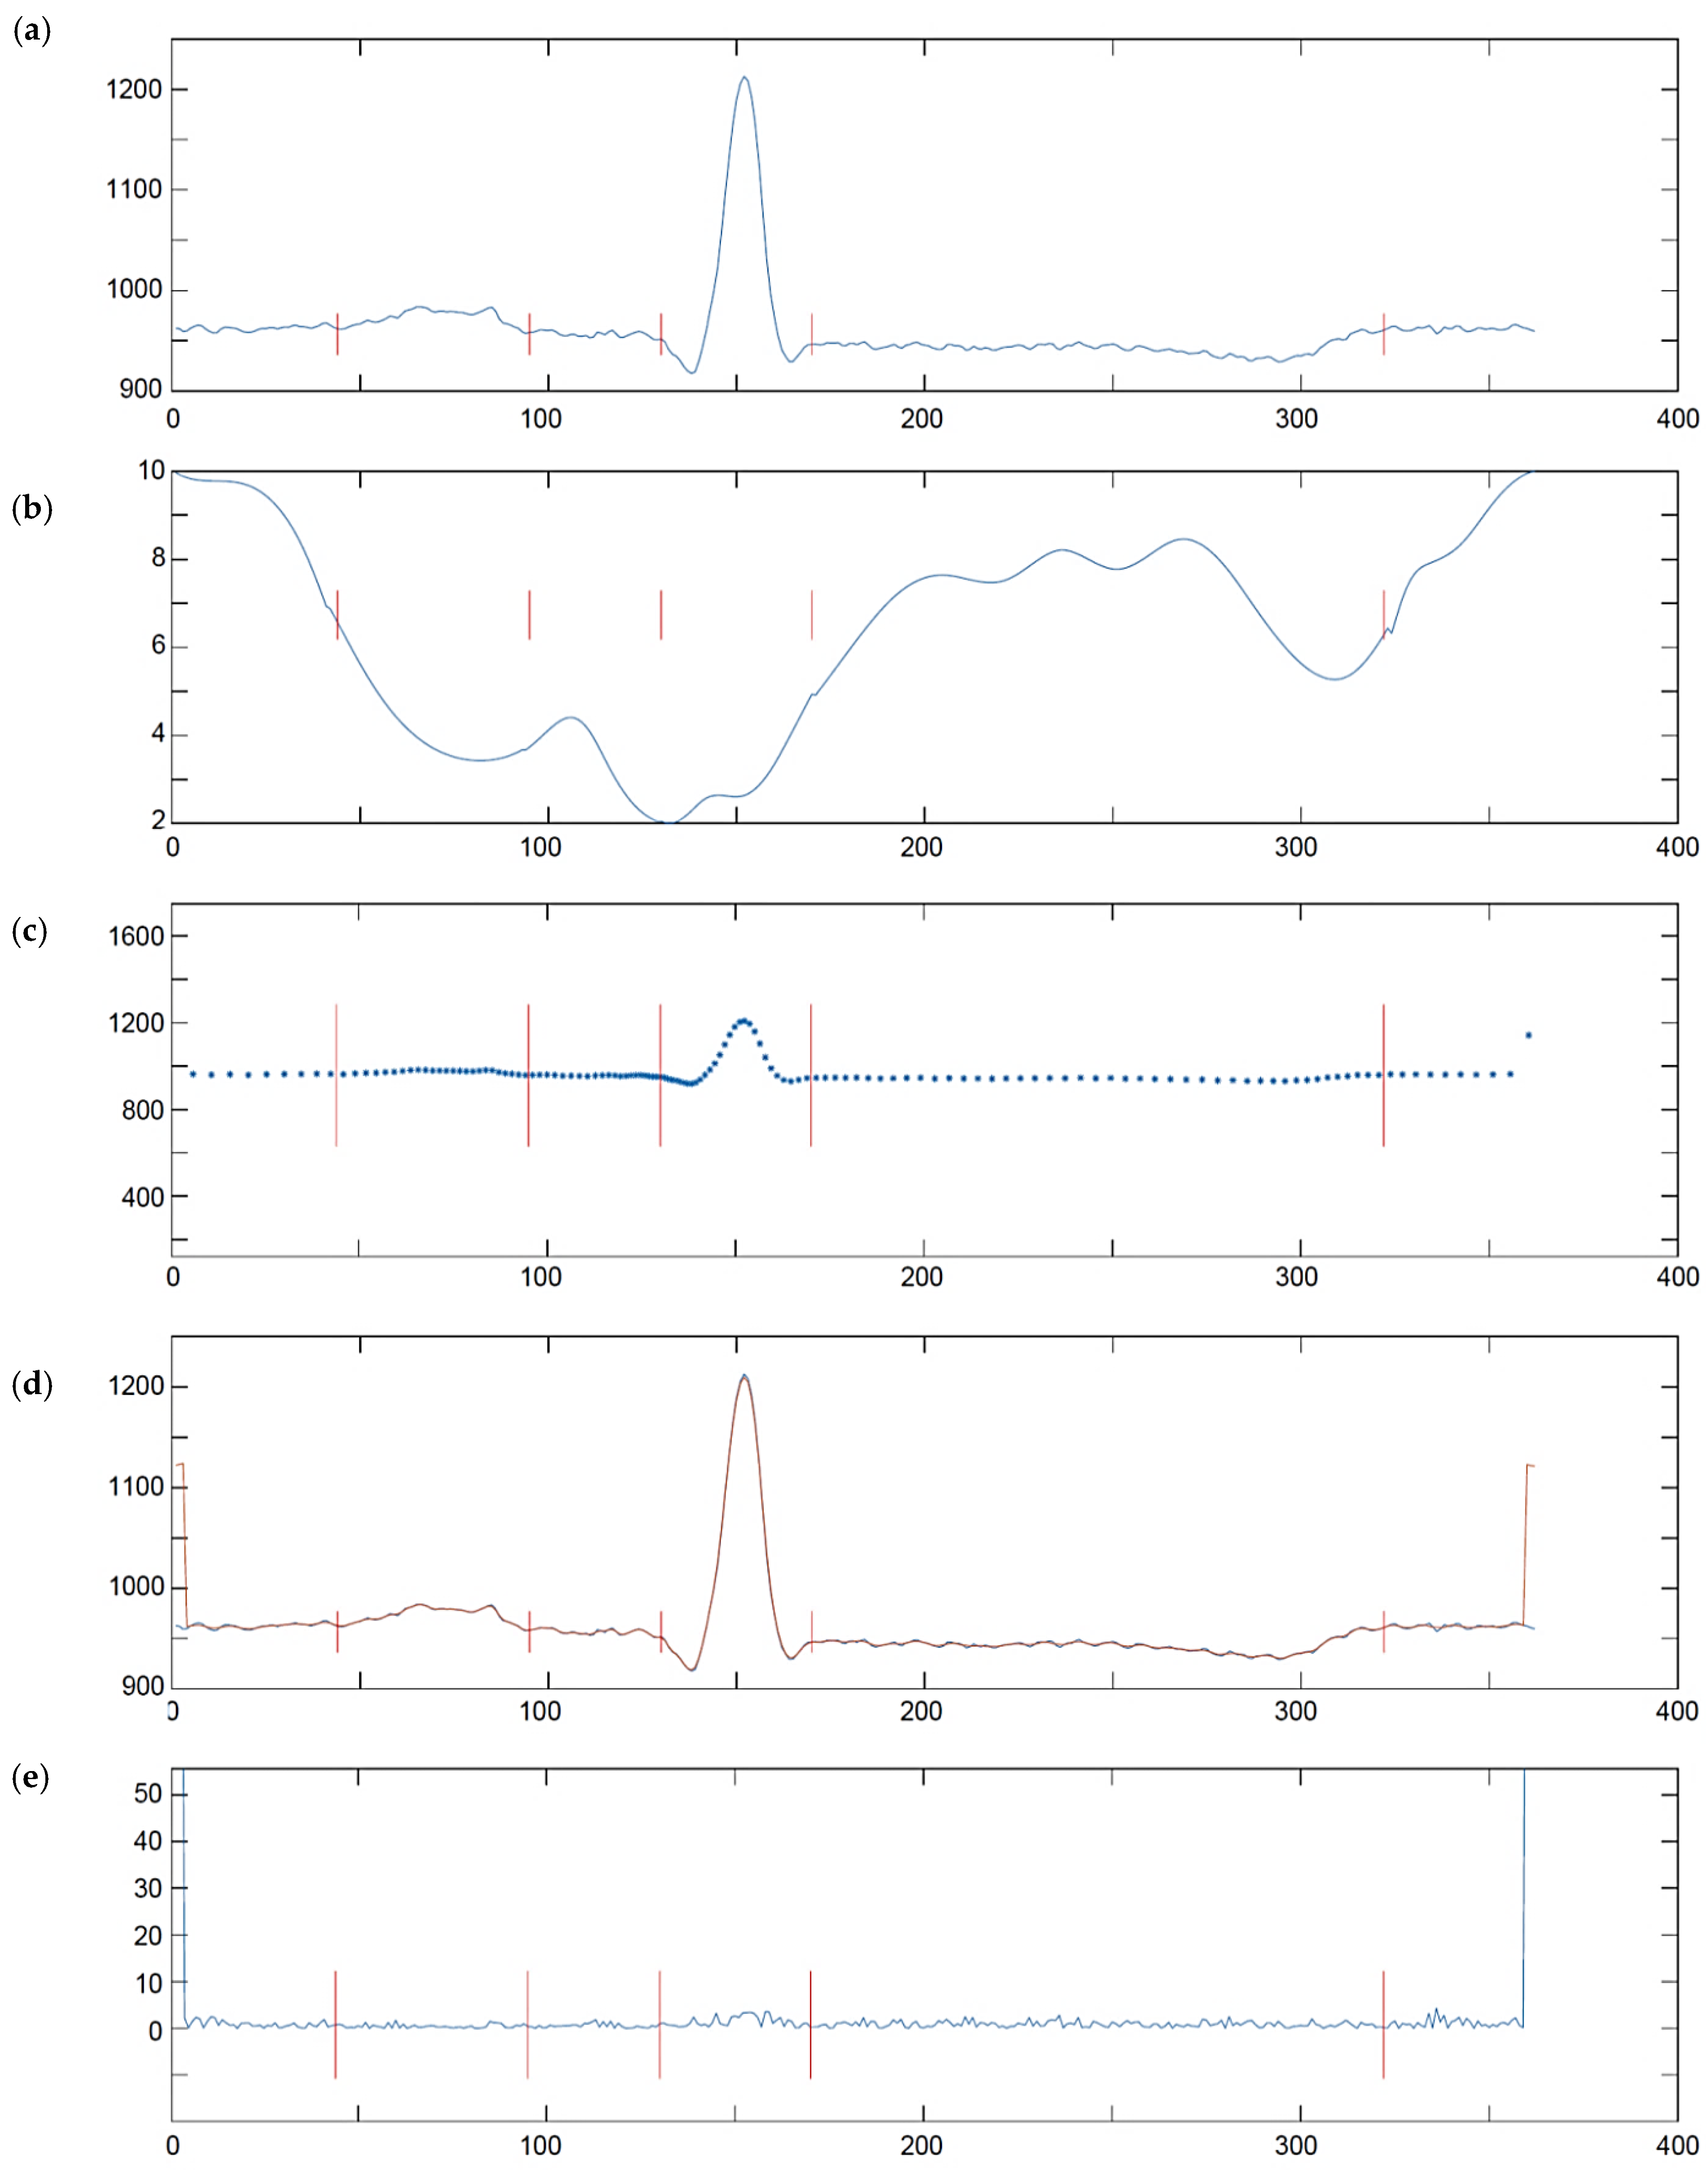
4.3. Delineation of QRS Waves in Non-Uniform Representation
- Discrete regularly sampled analyzing wavelets are located in a time-scale decomposition grid accordingly to their values of scale a and shift b corresponding to the position of the atom in a pyramid decomposition scheme.
- The correlation coefficient c between the non-uniform signal and the analyzing wavelet is calculated and attributed to the atom at a given position (a, b) in the grid:where e(t) is the electrocardiogram, w(t) is the analyzing wavelet, b is the shift coefficient of the wavelet, s is the length of the wavelet support, is the kernel that selects products with time lag not further than half of the length of the wavelet support from its central position:
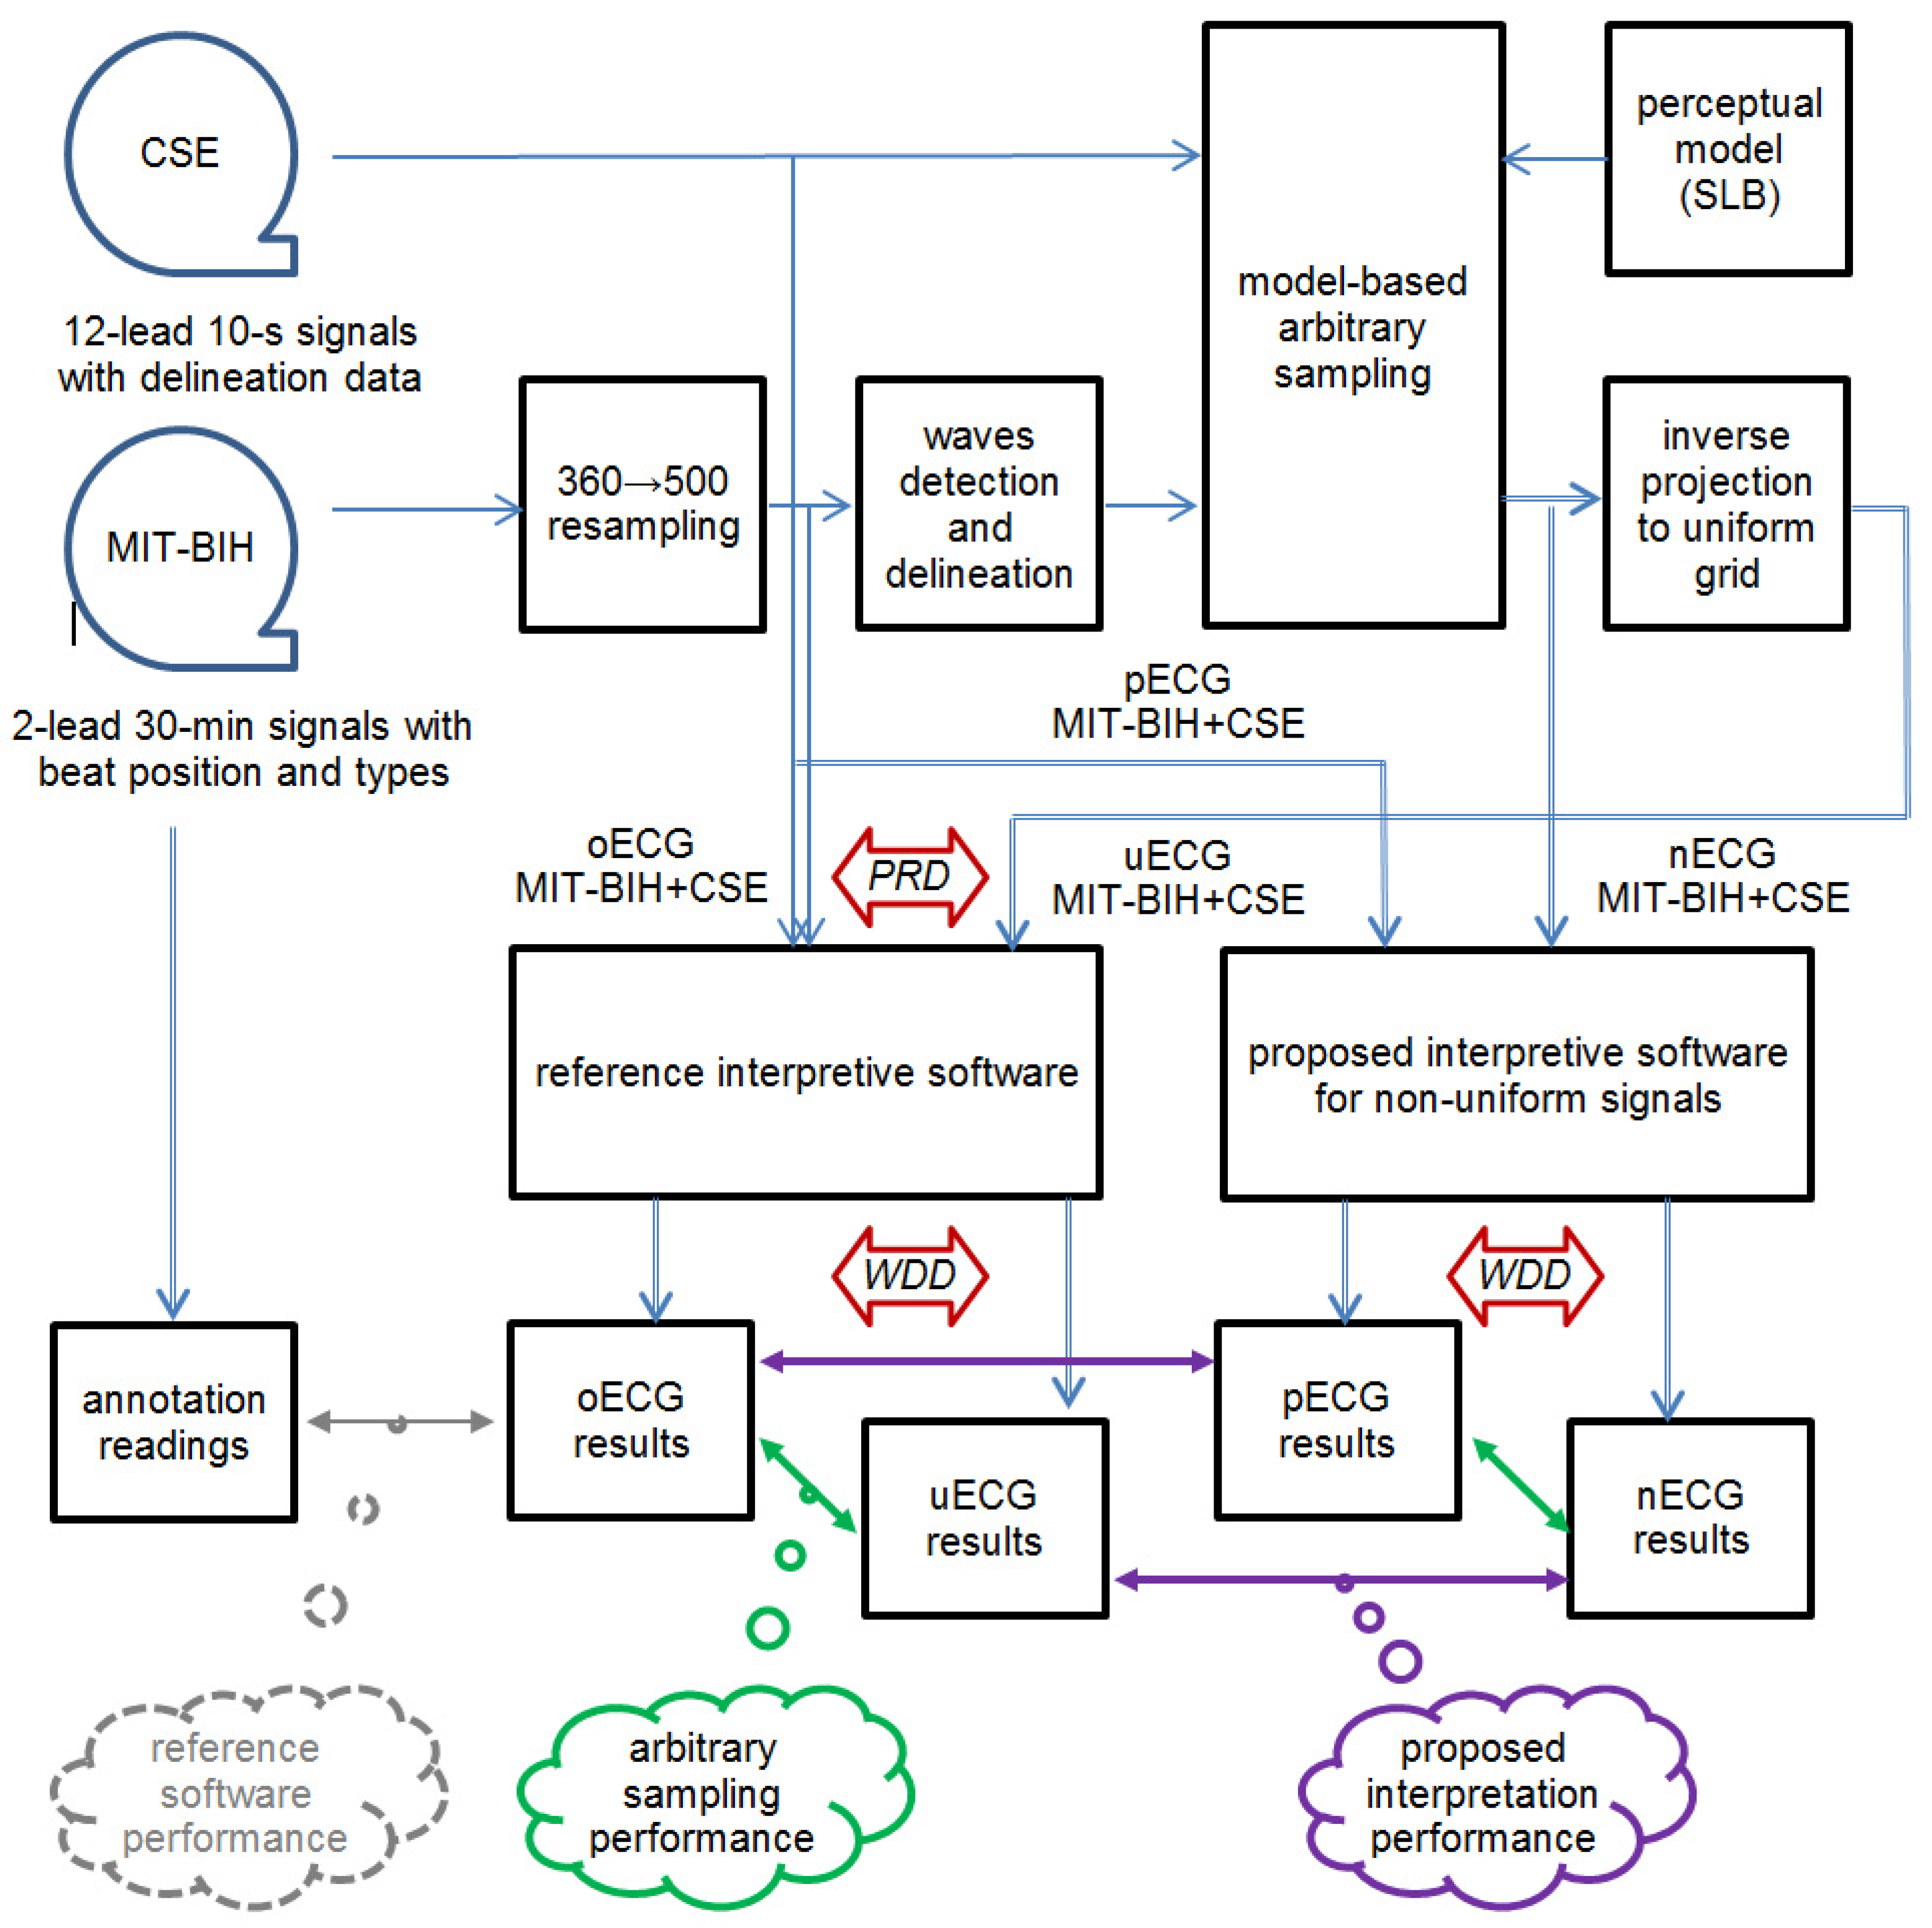
5. Test Procedure, Signals, and Conditions
5.1. Test Procedure
- reference (i.e., uniform) interpretation of uniform signal oECG,
- uniform interpretation of uniformized signal uECG,
- non-uniform interpretation of non-uniform signal nECG, and
- non-uniform interpretation of pseudo-non-uniform signal pECG.
5.2. Error Metrics
5.3. Test Signals
5.4. Perceptual Information Distribution as Arbitrary Sampling Model of the ECG
- local bandwidth of ECG waves [113],
- susceptibility of diagnostic result to signal distortion caused by a local data loss, and
5.5. Processing of Test Signals Accordingly to the Arbitrary Sampling Model
6. Test Results
6.1. Results of QRS Detection Test
6.2. Results of QRS/Beat Classification Test
6.3. Results of QRS Waves Delineator Test
- Average position of the fiducial point, being an approximate of the ground truth.
- Standard deviation of the results, being an approximate of difficulty level in getting a consistent result; it is noteworthy that due to various medical content and recording conditions, particular records pose different challenges to the interpretive software making the results more or less reliable; consequently, absolute values of position difference cannot be directly collected from all files.
- Rank of the delineator under test given accordingly to ascending absolute difference of calculated or provided and ground truth result; the rank R displayed in Table 6 for four proposed testing scenarios was calculated among 19 reference interpretive software from CSE database.
- Original signal (oECG) results, in which the delineation accuracy was affected by limited precision of reference interpretive software,
- Uniformized signal (uECG) results, in which the delineation accuracy was affected by limited precision of reference interpretive software and non-uniform representation of the signal (however the use of reference software required transforming the nECG back to the uniform sampling space),
- Non-uniform signal (nECG) results, in which the delineation accuracy was affected by limited precision of proposed delineator under test and non-uniform representation of the signal.
- Pseudo-non-uniform signal (pECG) results, in which the delineation accuracy was affected only by limited precision of proposed delineator under test.
7. Discussion
Funding
Acknowledgments
Conflicts of Interest
References
- Macfarlane, P.W. A brief history of computer-assisted electrocardiography. Methods Inf. Med. 1990, 29, 272–281. [Google Scholar] [CrossRef]
- Electrocardiograph (ECG) Market Overview. Available online: https://www.alliedmarketresearch.com/electrocardiograph-ECG-market (accessed on 12 February 2021).
- Serhani, M.A.; El Kasabi, H.T.; Ismail, H.; Navaz, A.M. ECG Monitoring Systems: Review, Architecture, Processes, and Key Challenges. Sensors 2020, 20, 1796. [Google Scholar] [CrossRef] [PubMed]
- Mason, J.W.; Hancock, W.; Gettes, L.; Bailey, J.; Childers, R.; Deal, B.; Josephson, M.; Kligfield, P.; Jan, K.; Macfarlane, P.; et al. Standardization and Interpretation of the ECG, Part II: Electrocardiography Diagnostic Statement List. J. Am. Coll. Cardiol. 2007, 49, 1128–1135. [Google Scholar] [CrossRef]
- Moody, G.B.; Mark, R.G. The MIT-BIH arrhythmia database on CD-ROM and software for use with it. IEEE Comput. Cardiol. Proceed. 1990, 2, 185–188. [Google Scholar]
- Willems, J.L.; van Bemmel, J.H.; Degani, R.; Macfarlane, P.W.; Zywietz, C.; CSE Working Party. Common standards for quantitative electrocardiography: Goals and main results. Methods Inf. Med. 1990, 29, 263–271. [Google Scholar] [PubMed]
- Unser, M.; Aldroubi, A. A general sampling theory for non-ideal acquisition devices. IEEE Trans. Signal Process. 1994, 42, 2915–2925. [Google Scholar] [CrossRef]
- Beurling, A. The Collected Works of Arne Beurling. Vol. 1, Complex Analysis; Carleson, L., Malliavin, P., Neuberger, J., Wermer, J., Eds.; Birkhauser: Boston, MA, USA, 1989. [Google Scholar]
- Landau, H. Necessary density conditions for sampling and interpolation of certain entire functions. Acta Math. 1967, 117, 37–52. [Google Scholar] [CrossRef]
- Aldroubi, A.; Gröchenig, K. Non-uniform sampling in shift invariant spaces. Siam Rev. 2001, 43. [Google Scholar] [CrossRef]
- Gröchenig, K.; Razafinjatovo, H. On Landau’s necessary density conditions for sampling and interpolation of bandlimited function. J. Lond. Math. Soc. 1996, 54, 557–567. [Google Scholar] [CrossRef]
- Chen, W.; Itoh, S.; Shiki, J. Irregular Sampling Theorems for Wavelet Subspaces. IEEE Trans. Inf. Theory 1998, 44, 1131–1142. [Google Scholar] [CrossRef]
- Benedetto, J.; Wu, H.-C. A multidimensional irregular sampling algorithm and applications. Proc. ICASSP 1999, 4, 2039–2042. [Google Scholar] [CrossRef]
- Xian, J.; Sun, W. Local Sampling and Reconstruction in Shift-Invariant Spaces and Their Applications in Spline Subspaces. Numer. Funct. Anal. Optim. 2010, 31, 366–386. [Google Scholar] [CrossRef]
- Kumar, A.; Sampath, S. Sampling and Average Sampling in Quasi Shift-Invariant Spaces. Numer. Funct. Anal. Optim. 2020, 41, 1246–1271. [Google Scholar] [CrossRef]
- Feichtinger, H.G.; Gröchenig, K. Iterative reconstruction of multivariate band-limited functions from irregular sampling values. Siam J. Math. Anal. 1992, 23, 244–261. [Google Scholar] [CrossRef]
- Aldroubi, A.; Feichtinger, H. Exact iterative reconstruction algorithm for multivariate irregularly sampled functions in spline-like spaces: The Lp theory. Proc. Am. Math. Soc. 1998, 126, 2677–2686. [Google Scholar] [CrossRef]
- Feichtinger, H.; Gröchenig, K. Theory and practice of irregular sampling. In Wavelets: Mathematics and Applications; Benedetto, J., Frazier, M., Eds.; CRC: Boca Raton, FL, USA, 1993. [Google Scholar]
- Pahlm, O.; Sörnmo, L. Software QRS detection in ambulatory monitoring—A review. Med. Biol. Eng. Comp. 1984, 22, 289–297. [Google Scholar] [CrossRef] [PubMed]
- Köhler, B.-U.; Hennig, C.; Orglmeister, R. The principles of software QRS detection. IEEE Eng. Med. Biol. Mag. 2002, 21, 42–57. [Google Scholar] [CrossRef]
- Pan, J.; Tompkins, W.J. A real-time QRS detection algorithm. IEEE Trans. Biomed. Eng. 1985, 32, 230–236. [Google Scholar] [CrossRef]
- Liu, F.; Liu, C.; Jiang, X.; Zhang, Z.; Zhang, Y.; Li, J.; Wei, S. Performance Analysis of Ten Common QRS Detectors on Different ECG Application Cases. J. Healthc. Eng. 2018, 9050812. [Google Scholar] [CrossRef]
- Gritzali, F. Toward a generalized scheme for QRS detection in ECG waveforms. Signal Process. 1988, 15, 183–192. [Google Scholar] [CrossRef]
- Martínez, A.; Alcaraz, R.; Rieta, J.J. Application of the phasor transform for automatic delineation of single-lead ECG fiducial points. Physiol. Meas. 2010, 31, 1467–1485. [Google Scholar] [CrossRef]
- Romero, D.; Ringborn, M.; Laguna, P.; Pueyo, E. Detection and quantification of acute myocardial ischemia by morphologic evaluation of QRS changes by an angle-based method. J. Electrocardiol. 2013, 46, 204–214. [Google Scholar] [CrossRef] [PubMed]
- Song, M.-H.; Cho, S.-P.; Kim, W.; Lee, K.-J. New real-time heartbeat detection method using the angle of a single-lead electrocardiogram. Comput. Biol. Med. 2015, 59, 73–79. [Google Scholar] [CrossRef] [PubMed]
- Augustyniak, P. A Robust Heartbeat Detector not Depending on ECG Sampling Rate. In Proceedings of the 37th Annual Conference of IEEE_EMBS, Milan, Italy, 25–29 August 2015; pp. 7861–7864. [Google Scholar]
- Nadaraya, E.A. On Estimating Regression, Theory of Probability & Its Applications. Soc. Ind. Appl. Math. 1964, 9, 141–142. [Google Scholar]
- Watson, G.S. Smooth Regression Analysis. Indian J. Stat. Ser. A 1964, 5, 359–372. [Google Scholar]
- Augustyniak, P. Optimizing the Short- and Long Term Regression for QRS Detection in Presence of Missing Data. Proc. Comput. Cardiol. 2015, 42, 201–204. [Google Scholar]
- Zhang, Z.; Dong, J.; Luo, X.; Choi, K.S.; Wu, X. Heartbeat classification using disease-specific feature selection. Comput. Biol. Med. 2014, 46 (Suppl. C), 79–89. [Google Scholar] [CrossRef]
- Li, H.; Feng, X.; Cao, L.; Li, E.; Liang, H.; Chen, X. A new ECG signal classification based on WPD and open feature extraction. Circ. Syst. Signal Process. 2016, 35, 339–352. [Google Scholar] [CrossRef]
- Li, H.; Liang, H.; Miao, C.; Cao, L.; Feng, X.; Tang, C. Novel ECG signal classification based on KICA nonlinear feature extraction. Circ. Syst. Signal Process. 2016, 35, 1187–1197. [Google Scholar] [CrossRef]
- Jekova, I.; Bortolan, G.; Christov, I. Assessment and comparison of different methods for heartbeat classification. Med. Eng. Phys. 2008, 30, 248–257. [Google Scholar] [CrossRef]
- Martis, R.J.; Krishnan, M.M.R.; Chakraborty, C.; Pal, S.; Sarkar, D.; Mandana, K.; Ray, A.K. Automated screening of arrhythmia using wavelet based machine learning techniques. J. Med. Syst. 2012, 36, 677–688. [Google Scholar] [CrossRef] [PubMed]
- Arif, M. Robust electrocardiogram (ECG) beat classification using discrete wavelet transform. Physiol. Meas. 2008, 29, 555. [Google Scholar]
- Zhao, Q.B.; Zhang, L.Q. ECG feature extraction and classification using wavelet transform and support vector machines. In Proceedings of the 2005 International Conference on Neural Networks and Brain, Beijing, China, 13–15 October 2005; Volume 1–3, pp. 1089–1092. [Google Scholar]
- Martis, R.J.; Acharya, U.R.; Lim, C.M.; Suri, J.S. Characterization of ECG beats from cardiac arrhythmia using discrete cosine transform in PCA framework. Know.-Based Syst. 2013, 45, 76–82. [Google Scholar] [CrossRef]
- Gunes, P. Detection of ECG Arrhythmia using a differential expert system approach based on principal component analysis and least square support vector machine. Appl. Math. Comput. 2007, 186, 898–906. [Google Scholar]
- Sarfraz, M.; Khan, A.A.; Li, F.F. Using independent component analysis to obtain feature space for reliable ECG Arrhythmia classification. In Proceedings of the Bioinformatics and Biomedicine (BIBM), Belfast, UK, 2–5 November 2014; pp. 62–67. [Google Scholar]
- Prasad, H.; Martis, R.J.; Acharya, U.R.; Min, L.C.; Suri, J.S. Application of higher order spectra for accurate delineation of atrial arrhythmia. In Proceedings of the Engineering in Medicine and Biology Society (EMBC), Osaka, Japan, 3–7 July 2013; pp. 57–60. [Google Scholar]
- Martis, R.J.; Acharya, U.R.; Lim, C.M.; Mandana, K.M.; Ray, A.K.; Chakraborty, C. Application of higher order cumulant features for cardiac health diagnosis using ECG signals. Int. J. Neural Syst. 2013, 23, 1350014. [Google Scholar] [CrossRef] [PubMed]
- De Chazal, P.; O’Dwyer, M.; Reilly, R.B. Automatic classification of heartbeatsusing ECG morphology and heartbeat interval features. IEEE Trans. Biomed. Eng. 2004, 51, 1196–1206. [Google Scholar] [CrossRef] [PubMed]
- Rajesh, K.N.; Dhuli, R. Classification of imbalanced ECG beats using re-sampling techniques and AdaBoost ensemble classifier. Biomed. Signal Process. Control 2018, 41, 242–254. [Google Scholar] [CrossRef]
- Mar, T.; Zaunseder, S.; Martinez, J.P.; Llamedo, M.; Poll, R. Optimization of ECG classification by means of feature selection. IEEE Trans. Biomed. Eng. 2011, 58, 2168–2177. [Google Scholar] [CrossRef] [PubMed]
- Martis, R.J.; Acharya, U.R.; Mandana, K.; Ray, A.; Chakraborty, C. Application of principal component analysis to ECG signals for automated diagnosis of cardiac health. Expert Syst. Appl. 2012, 39, 11792–11800. [Google Scholar] [CrossRef]
- Li, H.; Yuan, D.; Ma, X.; Cui, D.; Cao, L. Genetic algorithm for the optimization of features and neural networks in ECG signals classification. Sci. Rep. 2017. [Google Scholar] [CrossRef]
- Lu, W.; Hou, H.; Chu, J. Feature fusion for imbalanced ECG data analysis. Biomed. Signal Process. Control 2018, 41, 152–160. [Google Scholar] [CrossRef]
- Guo, L.; Sim, G.; Matuszewski, B. Inter-patient ECG classification with convolutional and recurrent neural networks. Biocybern. Biomed. Eng. 2019, 39, 868–879. [Google Scholar] [CrossRef]
- Melgani, F.; Bazi, Y. Classification of electrocardiogram signals with Support Vector Machines and Particle Swarm Optimization. IEEE Trans. Inf. Technol. Biomed. 2008, 12, 667–677. [Google Scholar] [CrossRef] [PubMed]
- Dietterich, T.G. Ensemble Methods in Machine Learning; Springer: Berlin/Heidelberg, Germany, 2000; pp. 1–15. ISBN 978-3-540-45014-6. [Google Scholar] [CrossRef]
- Pławiak, P.; Acharya, U.R. Novel deep genetic ensemble of classifiers for arrhythmia detection using ECG signals. Neural Comput. Appl. 2019, 4, 1–25. [Google Scholar] [CrossRef]
- Shi, H.; Wang, H.; Zhang, F.; Huang, Y.; Zhao, L.; Liu, C. Inter-patient heartbeat classification based on region feature extraction and ensemble classifier. Biomed. Signal Process. Control 2019, 51, 97–105. [Google Scholar] [CrossRef]
- Jambukia, S.H.; Dabhi, V.K.; Prajapati, H.B. Classification of ECG signals using machine learning techniques: A survey. In Proceedings of the 2015 IEEE International Conference on Advances in Computer Engineering and Applications, Ghaziabad, India, 19–20 March 2015; pp. 714–721. [Google Scholar]
- Kleinberg, J.M. Authoritative sources in a hyperlinked environment. J. ACM 1999, 46, 614–632. [Google Scholar] [CrossRef]
- Melnik, S.; Garcia-Molina, H.; Rahm, A. Similarity flooding: A versatile graph matching algorithm and its application to schema matching. In Proceedings of the 18th International Conference on Data Engineering, San Jose, CA, USA, 26 February–1 March 2002. [Google Scholar]
- Jeh, G.; Widom, J. SimRank: A measure of structural-context similarity. In Proceedings of the Eighth International Conference on Knowledge Discovery and Data Mining, Edmonton, Alberta, 23–26 July 2002. [Google Scholar]
- Zager, L.A.; Verghese, G.C. Graph similarity scoring and matching. Appl. Math. Lett. 2008, 21, 86–94. [Google Scholar] [CrossRef]
- Khuê Lê-Huu, D. Nonconvex Alternating Direction Optimization for Graphs: Inference and Learning. Computer Vision and Pattern Recognition [cs.CV]; Centrale Supélec, Université Paris-Saclay: Paris, France, 2019. [Google Scholar]
- Davenport, M.A.; Boufounos, P.T.; Wakin MB Baraniuk, R.G. Signal Processing With Compressive Measurements. IEEE J. Sel. Topics Signal Process. 2010, 4, 445–460. [Google Scholar] [CrossRef]
- Wimalajeewa, T.; Chen, H.; Varshney, P.K. Performance Limits of Compressive Sensing-Based Signal Classification. IEEE Trans. Signal Proc. 2012, 60, 2758–2770. [Google Scholar] [CrossRef]
- Chernoff, H. A Measure of Asymptotic Efficiency for Tests of a Hypothesis Based on the Sum of Observations. Ann. Math. Statist. 1952, 23, 493–507. [Google Scholar] [CrossRef]
- Wimalajeewa, T.; Varshney, P.K. Compressive Sensing Based Classification in the Presence of Intra- and Inter-Signal Correlation. IEEE Signal Process. Lett. 2018. [Google Scholar] [CrossRef]
- Kailath, T. The Divergence and Bhattacharyya Distance Measures in Signal Selection. IEEE Trans. Commun. Technol. 1967, COM-15, 52–60. [Google Scholar] [CrossRef]
- Cleju, N. Optimized projections for compressed sensing via rank-constrained nearest correlation matrix. Appl. Comput. Harmon. Anal. 2014, 36, 495–507. [Google Scholar] [CrossRef]
- Sörnmo, L. A model-based approach to QRS delineation. Comput. Biomed. Res. 1987, 20, 526–542. [Google Scholar] [CrossRef]
- Murthy, I.; Prasad, G.D. Analysis of ECG from pole-zero models. IEEE Trans. Biomed. Eng. 1992, 39, 741–751. [Google Scholar] [CrossRef] [PubMed]
- de Chazal, P.; Celler, B. Automatic measurement of the QRS onset and offset in individual ECG leads. In Proceedings of the 18th Annual International Conference of the IEEE Engineering in Medicine and Biology Society, Amsterdam, The Netherlands, 31 October–3 November 1996. [Google Scholar]
- Daskalov, I.K.; Dotsinsky, I.A.; Christov, I.I. Developments in ECG acquisition, preprocessing, parameter measurement and recording. IEEE Eng. Med. Biol. Mag. 1998, 17, 50–58. [Google Scholar] [CrossRef] [PubMed]
- Kemmelings, J.G.C.; Linnenbank, A.C.; Muilwijk, S.L.C.; Sippens-Groenewegen, A.; Peper, A.; Grimbergen, C.A. Automatic QRS onset and offset detection for body surface QRS integral mapping of ventricular tachycardia. IEEE Trans. Biomed. Eng. 1994, 41, 830–836. [Google Scholar] [CrossRef]
- Laguna, P.; Jané, R.; Caminal, P. Automatic detection of wave boundaries in multilead ECG signals: Validation with the CSE database. Comput. Biomed. Res. 1994, 27, 45–60. [Google Scholar] [CrossRef] [PubMed]
- Koeleman, A.S.M.; Ros, H.H.; van den Akker, T.J. Beat-to-beat interval measurement in the electrocardiogram. Med. Biol. Eng. Comput. 1985, 23, 213–219. [Google Scholar] [CrossRef]
- Soria-Olivas, E.; Martínez-Sober, M.; Calpe-Maravilla, J.; Guerrero-Martínez, J.F.; Chorro-Gascó, J.; Espí-López, J. Application of adaptive signal processing for determining the limits of P and T waves in an ECG. IEEE Trans. Biomed. Eng. 1998, 45, 1077–1080. [Google Scholar] [CrossRef]
- Bystricky, W.; Safer, A. Modelling T-end in Holter ECG’s by 2-layer perceptrons. In Computers in Cardiology; IEEE Computer Society Press: Los Alamitos, CA, USA, 2002; Volume 29, pp. 105–108. [Google Scholar]
- Vullings, H.; Verhaegen, M.; Verbruggen, H. Automated ECG segmentation with dynamic time warping. In Proceedings of the 20th Annual International Conference of the IEEE Engineering in Medicine and Biology Society, Hong Kong, China, 29 October–1 November 1998; pp. 163–166. [Google Scholar]
- Lin, C.; Mailhes, C.; Tourneret, J.-Y. P-and T-wave delineation in ECG signals using a Bayesian approach and a partially collapsed Gibbs sampler. IEEE Trans. Biomed. Eng. 2010, 57, 2840–2849. [Google Scholar]
- Lin, C.; Kail, G.; Giremus, A.; Mailhes, C.; Tourneret, J.-Y.; Hlawatsch, F. Sequential beat-to-beat P and T wave delineation and waveform estimation in ECG signals: Block Gibbs sampler and marginalized particle filter. Signal Process. 2014, 104, 174–187. [Google Scholar] [CrossRef]
- Gao, P.; Zhao, J.; Wang, G.; Guo, H. Real time ECG characteristic point detection with randomly selected signal pair difference (RSSPD) feature and random forest classifier. In Proceedings of the 38th Annual International Conference of the IEEE Engineering in Medicine and Biology Society (EMBC), Orlando, FL, USA, 16–20 August 2016; pp. 732–735. [Google Scholar]
- Li, C.; Zheng, C.; Tai, C. Detection of ECG characteristic points using wavelet transforms. IEEE Trans. Biomed. Eng. 1995, 42, 21–28. [Google Scholar] [PubMed]
- Sahambi, J.S.; Tandon, S.; Bhatt, R.K.P. Using wavelet transform for ECG characterization. IEEE Eng. Med. Biol. 1997, 16, 77–83. [Google Scholar]
- Martinez, J.P.; Almeida, R.; Olmos, S.; Rocha, A.P.; Laguna, P. A wavelet-based ECG delineator: Evaluation on standard databases. IEEE Trans. Biomed. Eng. 2004, 51, 570–581. [Google Scholar] [CrossRef]
- Llamedo Soria, M.; Martınez, J.P.; Laguna, P. A Multilead Wavelet-based ECG Delineator based on the RMS Signal. Comput. Cardiol. 2006, 33, 153–156. [Google Scholar]
- Lenis, G.; Pilia, N.; Oesterlein, T.; Luik, A.; Schmitt, C.; Doessel, O. P wave detection and delineation in the ECG based on the phase free stationary wavelet transform and using intracardiac atrial electrograms as reference. Biomed. Eng. Biomed. Tech. 2016, 61, 37–56. [Google Scholar] [CrossRef]
- Cesari, M.; Mehlsen, J.; Mehlsen, A.-B.; Sørensen, H.B.D. A New Wavelet-Based ECG Delineator for the Evaluation of the Ventricular Innervation. IEEE J. Transl. Eng. Health Med. 2017, 5. [Google Scholar] [CrossRef] [PubMed]
- Xia, Z.; Wang, G.; Fu, D.; Wang, H.; Chen, M.; Xie, P.; Yang, H. Real-Time ECG Delineation with Randomly Selected Wavelet Transform Feature and Random Walk Estimation. In Proceedings of the 40th Annual International Conference of the IEEE Engineering in Medicine and Biology Society (EMBC), Honolulu, HI, USA, 17–21 July 2018; pp. 1–4. [Google Scholar] [CrossRef]
- Mallat, S.G. A theory for multiresolution signal decomposition: The wavelet representation. IEEE Trans. Pattern Anal. Mach. Intellignece 1989, 2, 674–693. [Google Scholar] [CrossRef]
- Liu, Y.; Walter, G.G. Irregular sampling in wavelet subspaces. J. Fourier Anal. Appl. 1995, 2, 181–189. [Google Scholar] [CrossRef]
- Pelissier, M.; Studer, C. Non-uniform wavelet sampling for RF analog-to-information conversion. IEEE Trans. Circuits Syst. 2018, 65, 471–484. [Google Scholar] [CrossRef]
- Gröchenig, K.-H. Irregular Sampling of Wavelet and Short-Time Fourier Transforms. Constr. Approx. 1993, 9, 283–297. [Google Scholar] [CrossRef]
- Zergainoh, A.; Duhamel, P. Compactly Supported Non-Uniform Spline Wavelet for Irregularly Sub-Sampled Image Representation. ICIP 2006, 1621–1624. [Google Scholar] [CrossRef]
- Daubechies, I. Ten Lectures on Wavelets; SIAM Publications: Philadelphia, PA, USA, 1992. [Google Scholar]
- Lomb, N.R. Least-squares frequency analysis of unequally spaced data. Astrophys. Space Sci. 1976, 39, 447–462. [Google Scholar] [CrossRef]
- Grossman, A.; Morlet, J. Decomposition of Hardy Functions into Square Integrable Wavelets of Constant Shape. SIAM J. Math. Anal. 1984, 15, 723–736. [Google Scholar] [CrossRef]
- Rehfeld, K.; Marwan, N.; Heitzig, J.; Kurths, J. Comparison of correlation analysis techniques for irregularly sampled time series. Nonlin. Processes Geophys. 2011, 18, 389–404. [Google Scholar] [CrossRef]
- Edelson, R.; Krolik, J. The discrete correlation function–A new method for analyzing unevenly sampled variability data. Astrophys. J. 1988, 333, 646–659. [Google Scholar] [CrossRef]
- Bjoernstad, O.N.; Falck, W. Nonparametric spatial covariance functions: Estimation and testing. Environ. Ecol. Stat. 2001, 8, 53–70. [Google Scholar] [CrossRef]
- Stoica, P.; Sandgren, N. Spectral analysis of irregularly sampled data: Paralleling the regularly-sampled data approaches. Digit. Signal Process. 2006, 16, 712–734. [Google Scholar] [CrossRef]
- Foster, G. Wavelets for period analysis of unevenly sampled time series. Astron. J. 1996, 112, 1709–1729. [Google Scholar] [CrossRef]
- Cai, X.; Li, D.; Wang, A. Study on Nonuniform Sampling Signals Based on Wavelet Transform. In Proceedings of the IEEE International Conference on Computer, Mechatronics, Control and Electronic Engineering (CMCE), Changchun, China, 24–26 August 2010; pp. 21–24. [Google Scholar]
- Fira, M.; Goras, L. Basis pursuit for ECG compression. In Proceedings of the International Symposium on Signals, Circuits and Systems, Iasi, Romania, 11–12 July 2019; pp. 1–4. [Google Scholar]
- Mallat, S.; Zhong, S. Characterization of signals from multiscale edge. IEEE Trans. Pattern Anal. Mach. Intell. 1992, 14, 710–732. [Google Scholar] [CrossRef]
- IEC 60601-2-51. Medical Electrical Equipment Part 2-51: Particular Requirements for Safety, Including Essential Performance, of Recording and Analyzing Single Channel and Multichannel Electrocardiographs; IEC: Geneva, Switzerland, 2003; ISBN 2-8318-6880-7. [Google Scholar]
- BS EN 60601-2-25:2015. Medical Electrical Equipment. Particular Requirements for the Basic Safety and Essential Performance of Electrocardiograph; European Committee for Electrotechnical Standardization (CENELEC): Brussels, Belgium, 2015; ISBN 978-2-88912-719-1. [Google Scholar]
- Zigel, Y.; Cohen, A.; Katz, A. The weighted diagnostic distortion (WDD) measure for ECG signal compression. IEEE Trans. Biomed. Eng. 2000, 47, 1422–1430. [Google Scholar]
- Sayadi, O.; Shamsollahi, M.-B. ECG Denoising and Compression Using a Modified Extended Kalman Filter Structure. IEEE Trans. Biomed. Eng. 2008, 55, 2240–2248. [Google Scholar] [CrossRef] [PubMed]
- Standard, A.E. Testing and Reporting Performance Results of Cardiac Rhythm and ST Segment Measurement Algorithms, ANSI/AAMI EC57:1998 Standard; Association for the Advancement of Medical Instrumentation: Arlington, VA, USA, 1998. [Google Scholar]
- Polanía, L.F.; Carrillo, R.E.; Blanco-Velasco, M.; Barner, K.E. Exploiting Prior Knowledge in Compressed Sensing Wireless ECG Systems. IEEE J. Biomed. Health Inform. 2015, 19, 508–519. [Google Scholar] [CrossRef] [PubMed]
- Craven, D.; McGinley, B.; Kilmartin, L.; Glavin, M.; Jones, E. Adaptive Dictionary Reconstruction for Compressed Sensing of ECG Signals. IEEE J. Biomed. Health Inform. 2017, 21, 645–654. [Google Scholar] [CrossRef]
- Rieger, R.; Taylor, J.T. An adaptive sampling system for sensor nodes in body area networks. IEEE Trans. Neural Syst. Rehabil. Eng. 2009, 17, 183–189. [Google Scholar] [CrossRef]
- Yazicioglu, R.F.; Kim, S.; Torfs, T.; Kim, H.; van Hoof, C. A 30 µW analog signal processor ASIC for portable biopotential signal monitoring. IEEE J. Solid-State Circuits 2011, 46, 209–223. [Google Scholar] [CrossRef]
- Zhang, X.; Lian, Y. A 300-mV 220-nW Event-Driven ADC with Real-Time QRS Detection for Wearable ECG Sensors. IEEE Trans. Biomed. Circuits Syst. 2014, 8, 834–843. [Google Scholar] [CrossRef]
- Ravanshad, N.; Rezaee-Dehsorkh, H.; Lotfi, R.; Lian, Y. A Level-Crossing Based QRS-Detection Algorithm for Wearable ECG Sensors. IEEE J. Biomed. Health Inform. 2014, 18, 183–192. [Google Scholar] [CrossRef]
- Augustyniak, P. Moving window signal concatenation for spectral analysis of ECG waves. Comput. Cardiol. 2010, 37, 665–668. [Google Scholar]
- Augustyniak, P. How a Human Perceives the Electrocardiogram. Comput. Cardiol. 2003, 30, 601–604. [Google Scholar]
- Augustyniak, P. Tadeusiewicz, R. Assessment of electrocardiogram visual interpretation strategy based on scanpath analysis. Physiol. Meas. 2006, 27, 597–608. [Google Scholar] [CrossRef]
- Augustyniak, P. Adaptive Sampling of the Electrocardiogram Based on Generalized Perceptual Features. Sensors 2020, 20, 373. [Google Scholar] [CrossRef] [PubMed]
- Augustyniak, P. Time-Frequency Integration of Variable-Bandwidth Signals and Supplementary Data Packets. Int. J. Biol. Biomed. Eng. 2018, 12, 114–123. [Google Scholar]
- Yeh, Y.C.; Wang, W.J. QRS complexes detection for ECG signal: The Difference Operation Method. Comput. Method. Program. Biomed. 2008, 91, 245–254. [Google Scholar] [CrossRef] [PubMed]
- Zidelmal, Z.; Amirou, A.; Adnane, M.; Belouchrani, A. QRS detection based on wavelet coefficients. Comput. Method. Program. Biomed. 2012, 107, 490–496. [Google Scholar] [CrossRef]


| AAMI Type | AAMI Label | MITDB Type and Label | Total |
|---|---|---|---|
| Normal | N | Normal (NOR)—N Left Bundle Branch Block (LBBB)—L Right Bundle Branch Block (RBBB)—R | 89,838 |
| Supraventricular ectopic | S | Atrial Premature Contraction (APC)—A Nodal (Junctional Escape Beat)—j Blocked Atrial Premature Beat (BAP)—x Aberrant Atrial Premature Beat (AP)—a Nodal (Junctional) Premature Beat (NP)—J Atrial Escape Beat (AE)—e | 3217 |
| Ventricular ectopic | V | Premature Ventricular Contraction (PVC)—V Ventricular Flutter (VF)—! Ventricular Escape Beat (VE)—E | 7480 |
| Fusion | F | Fusion of Ventricular and Normal Beat (VFN)—F | 802 |
| Unknown | Q | Unclassificable Beat (UN)—Q | 15 |
| MITDB File ID | Results | ||||||
|---|---|---|---|---|---|---|---|
| Beats | TP | FP | FN | Se [%] | PPV [%] | Fd [%] | |
| 100 | 2273 | 2272 | 0 | 1 | 99.96 | 100.00 | 0.04 |
| 101 | 1865 | 1864 | 3 | 1 | 99.95 | 99.84 | 0.21 |
| 103 | 2084 | 2083 | 0 | 1 | 99.95 | 100.00 | 0.05 |
| 105 | 2572 | 2568 | 13 | 4 | 99.84 | 99.50 | 0.66 |
| 106 | 2027 | 2026 | 0 | 1 | 99.95 | 100.00 | 0.05 |
| 108 | 1774 | 1773 | 28 | 1 | 99.94 | 98.45 | 1.61 |
| 109 | 2532 | 2532 | 0 | 0 | 100.00 | 100.00 | 0.00 |
| 111 | 2124 | 2124 | 1 | 0 | 100.00 | 99.95 | 0.05 |
| 112 | 2539 | 2539 | 0 | 0 | 100.00 | 100.00 | 0.00 |
| 113 | 1795 | 1795 | 0 | 0 | 100.00 | 100.00 | 0.00 |
| 114 | 1873 | 1871 | 9 | 2 | 99.89 | 99.52 | 0.58 |
| 115 | 1953 | 1953 | 0 | 0 | 100.00 | 100.00 | 0.00 |
| 116 | 2412 | 2396 | 1 | 16 | 99.34 | 99.96 | 0.70 |
| 117 | 1535 | 1535 | 0 | 0 | 100.00 | 100.00 | 0.00 |
| 118 | 2288 | 2288 | 1 | 0 | 100.00 | 99.96 | 0.04 |
| 119 | 1987 | 1987 | 1 | 0 | 100.00 | 99.95 | 0.05 |
| 121 | 1863 | 1862 | 0 | 1 | 99.95 | 100.00 | 0.05 |
| 122 | 2476 | 2476 | 0 | 0 | 100.00 | 100.00 | 0.00 |
| 123 | 1518 | 1518 | 0 | 0 | 100.00 | 100.00 | 0.00 |
| 124 | 1619 | 1619 | 0 | 0 | 100.00 | 100.00 | 0.00 |
| 200 | 2601 | 2600 | 1 | 1 | 99.96 | 99.96 | 0.08 |
| 201 | 2000 | 1998 | 0 | 2 | 99.90 | 100.00 | 0.10 |
| 202 | 2136 | 2136 | 1 | 0 | 100.00 | 99.95 | 0.05 |
| 203 | 2980 | 2969 | 16 | 11 | 99.63 | 99.46 | 0.90 |
| 205 | 2656 | 2655 | 0 | 1 | 99.96 | 100.00 | 0.04 |
| 207 | 2332 | 2332 | 3 | 0 | 100.00 | 99.87 | 0.13 |
| 208 | 2955 | 2946 | 1 | 9 | 99.70 | 99.97 | 0.34 |
| 209 | 3005 | 3005 | 1 | 0 | 100.00 | 99.97 | 0.03 |
| 210 | 2650 | 2633 | 3 | 17 | 99.36 | 99.89 | 0.75 |
| 212 | 1825 | 1825 | 1 | 0 | 100.00 | 99.95 | 0.05 |
| 213 | 3251 | 3250 | 0 | 1 | 99.97 | 100.00 | 0.03 |
| 214 | 2262 | 2261 | 0 | 1 | 99.96 | 100.00 | 0.04 |
| 215 | 3363 | 3360 | 0 | 3 | 99.91 | 100.00 | 0.09 |
| 219 | 2287 | 2287 | 0 | 0 | 100.00 | 100.00 | 0.00 |
| 220 | 2048 | 2048 | 0 | 0 | 100.00 | 100.00 | 0.00 |
| 221 | 2427 | 2426 | 0 | 1 | 99.96 | 100.00 | 0.04 |
| 222 | 2483 | 2483 | 3 | 0 | 100.00 | 99.88 | 0.12 |
| 223 | 2605 | 2604 | 0 | 1 | 99.96 | 100.00 | 0.04 |
| 228 | 2053 | 2452 | 13 | 1 | 99.96 | 99.47 | 0.57 |
| 230 | 2256 | 2256 | 0 | 0 | 100.00 | 100.00 | 0.00 |
| 231 | 1573 | 1573 | 0 | 0 | 100.00 | 100.00 | 0.00 |
| 232 | 1780 | 1780 | 3 | 0 | 100.00 | 99.83 | 0.17 |
| 233 | 3079 | 3078 | 0 | 1 | 99.97 | 100.00 | 0.03 |
| 234 | 2753 | 2753 | 1 | 0 | 100.00 | 99.96 | 0.04 |
| Sum: | 100,469 | 100,791 | 104 | 78 | |||
| Average: | 99.9309 | 99.8928 | 0.1761 | ||||
| Algorithm | Results | ||||||
|---|---|---|---|---|---|---|---|
| Total | TP | FN | FP | Se [%] | PPV [%] | Fd [%] | |
| Pan and Tompkins (1985) [21] | 109,809 | 109,532 | 277 | 507 | 99.75 | 99.54 | 0.71 |
| Martínez et al. (2004) [81] | 109,428 | 109,208 | 220 | 153 | 99.80 | 99.86 | 0.34 |
| Yeh and Wang (2008) [118] | 109,809 | 109,643 | 166 | 58 | 99,85 | 99,95 | 0.20 |
| Martínez et al. (2010) [24] | 109,428 | 109,111 | 317 | 35 | 99.71 | 99.97 | 0.32 |
| Zidelmal et al. (2012) [119] | 109,494 | 109,101 | 393 | 193 | 99,64 | 99,82 | 0,54 |
| Song et al. (2015) [26] | 109,494 | 109,398 | 96 | 103 | 99.91 | 99.91 | 0.18 |
| proposed algorithm * | 100,469 | 100,791 | 104 | 78 | 99.93 | 99.89 | 0.18 |
| Ref. Class | Determined Class | Total * | |||||||||||||
|---|---|---|---|---|---|---|---|---|---|---|---|---|---|---|---|
| N | L | R | A | j | x | a | J | e | V | ! | E | F | Q | ||
| N | 73,980 | 32 | 0 | 253 | 37 | 7 | 35 | 0 | 13 | 73 | 27 | 0 | 47 | 7 | 74,511 |
| L | 12 | 8053 | 0 | 0 | 0 | 0 | 0 | 0 | 0 | 7 | 0 | 0 | 0 | 0 | 8072 |
| R | 27 | 0 | 7197 | 15 | 0 | 0 | 9 | 3 | 4 | 0 | 0 | 0 | 0 | 7255 | |
| A | 5 | 5 | 0 | 2518 | 0 | 0 | 0 | 0 | 0 | 5 | 3 | 0 | 10 | 0 | 2546 |
| j | 4 | 0 | 0 | 5 | 217 | 0 | 0 | 3 | 0 | 0 | 0 | 0 | 0 | 0 | 229 |
| x | 7 | 0 | 0 | 2 | 1 | 180 | 0 | 0 | 0 | 0 | 3 | 0 | 0 | 0 | 193 |
| a | 4 | 0 | 1 | 1 | 0 | 0 | 144 | 0 | 0 | 0 | 0 | 0 | 0 | 0 | 150 |
| J | 2 | 0 | 0 | 2 | 0 | 0 | 0 | 79 | 0 | 0 | 0 | 0 | 0 | 0 | 83 |
| e | 3 | 1 | 0 | 0 | 0 | 0 | 0 | 0 | 12 | 0 | 0 | 0 | 0 | 0 | 16 |
| V | 11 | 5 | 0 | 0 | 0 | 0 | 0 | 0 | 0 | 6878 | 7 | 0 | 1 | 0 | 6902 |
| ! | 0 | 8 | 0 | 0 | 0 | 0 | 0 | 0 | 0 | 11 | 453 | 0 | 0 | 0 | 472 |
| E | 5 | 0 | 0 | 0 | 0 | 0 | 0 | 0 | 0 | 0 | 0 | 101 | 0 | 0 | 106 |
| F | 7 | 0 | 0 | 0 | 0 | 0 | 0 | 0 | 0 | 2 | 0 | 1 | 792 | 0 | 802 |
| Q | 2 | 1 | 0 | 0 | 0 | 0 | 0 | 0 | 0 | 3 | 0 | 1 | 0 | 8 | 15 |
| Total | 74,069 | 8105 | 7198 | 2796 | 255 | 187 | 188 | 85 | 25 | 6983 | 493 | 103 | 850 | 15 | 101,352 |
| Reference | Determined Beat Type | Total | ||||
|---|---|---|---|---|---|---|
| N | S | V | F | Q | ||
| N | 89,301 | 372 | 111 | 47 | 7 | 89,838 |
| S | 32 | 3164 | 11 | 10 | 0 | 3217 |
| V | 29 | 0 | 7450 | 1 | 0 | 7480 |
| F | 7 | 0 | 3 | 792 | 0 | 802 |
| Q | 3 | 0 | 4 | 0 | 8 | 15 |
| Total | 89,372 | 3536 | 7579 | 850 | 15 | 101,352 |
| CSE NR | Fiducial Point | CSE-Reference | oECG | uECG | nECG | pECG | |||||
|---|---|---|---|---|---|---|---|---|---|---|---|
| Mean | std. | ∆T | R | ∆T | R | ∆T | R | ∆T | R | ||
| 001 | P-ons | 51.26 | 13.99 | 4.26 | 3 | 5.26 | 4 | 5.71 | 5 | 4.51 | 3 |
| P-end | 170.6 | 19.98 | −3.63 | 3 | -3.63 | 3 | −2.28 | 2 | −2.61 | 2 | |
| QRS-ons | 277.6 | 5.57 | 1.58 | 2 | 2.58 | 5 | 2.77 | 6 | 1.91 | 3 | |
| QRS-end | 407.6 | 4.48 | 1.58 | 3 | 2.58 | 6 | 2.80 | 6 | 1.88 | 4 | |
| T-end | 723.5 | 12.50 | 3.47 | 3 | 4.47 | 5 | 5.11 | 6 | 3.85 | 3 | |
| 002 | P-ons | 20.89 | 9.34 | 3.89 | 4 | 3.89 | 4 | 4.41 | 5 | 4.06 | 4 |
| P-end | 135.8 | 7.51 | −2.78 | 3 | −2.78 | 3 | −4.11 | 5 | −3.50 | 4 | |
| QRS-ons | 178.2 | 2.82 | 0.21 | 1 | 1.21 | 6 | 1.57 | 8 | 0.59 | 2 | |
| QRS-end | 264.1 | 5.33 | −1.11 | 2 | −1.11 | 2 | −1.93 | 5 | −1.31 | 2 | |
| T-end | 523.1 | 54.70 | 7.11 | 4 | 8.11 | 4 | 8.51 | 4 | 7.91 | 4 | |
| …120 files… | |||||||||||
| 125 | P-ons | 96.63 | 6.62 | 2.62 | 4 | 2.62 | 4 | 2.97 | 5 | 2.91 | 5 |
| P-end | 186.0 | 4.86 | 2.0 | 3 | 2.0 | 3 | 2.57 | 5 | 2.13 | 3 | |
| QRS-ons | 206.8 | 2.31 | 0.84 | 2 | 0.84 | 2 | 1.12 | 3 | 0.99 | 3 | |
| QRS-end | 314,2 | 4.53 | −1.21 | 3 | −1.21 | 3 | −1.85 | 5 | −1.02 | 2 | |
| T-end | 612.6 | 6.56 | 1.63 | 3 | 2.63 | 5 | 2.90 | 5 | 2.83 | 5 | |
| Average rank (out of 19 packages): | 2.87 | 3.93 | 5.0 | 3.37 | |||||||
| ECG Section | oECG | uECG | nECG | pECG | IEC Allowed Tolerance | |||||
|---|---|---|---|---|---|---|---|---|---|---|
| Mean | std. | Mean | std. | Mean | std. | Mean | std. | Mean | std. | |
| P | ±4.3 | 3.5 | ±7.7 | 6.8 | ±9.7 | 8.1 | ±5.7 | 4.1 | ±10 | 15 |
| QRS | ±2.1 | 1.8 | ±2.8 | 3.7 | ±3.4 | 5.1 | ±2.8 | 3.2 | ±10 | 10 |
| P-Q | ±3.7 | 4.5 | ±5.4 | 6.7 | ±6.7 | 8.4 | ±4.1 | 4.9 | ±10 | 10 |
| Q-T | ±11.1 | 7.1 | ±12.8 | 8.8 | ±17.7 | 10.9 | ±11.7 | 8.1 | ±25 | 30 |
| CSE-NR | uECG—oECG | WDD | |||||||
|---|---|---|---|---|---|---|---|---|---|
| PRD | PRD P | PRD QRS | PRD T | oECG- uECG | pECG- nECG | uECG- nECG | oECG- pECG | nECG- oECG | |
| Column | 1 | 2 | 3 | 4 | 5 | 6 | 7 | 8 | 9 |
| 001 | 3.18 | 0.11 | 0.34 | 0.46 | 0.27 | 0.25 | 0.41 | 0.27 | 0.51 |
| 002 | 2.67 | 0.18 | 0.19 | 0.26 | 0.19 | 0.17 | 0.24 | 0.20 | 0.36 |
| …120 files… | |||||||||
| 125 | 3.46 | 0.21 | 0.31 | 0.34 | 0.27 | 0.28 | 0.44 | 0.33 | 0.60 |
| Mean | 3.11 | 0.16 | 0.22 | 0.37 | 0.21 | 0.23 | 0.33 | 0.27 | 0.47 |
| Std. | 0.327 | 0.042 | 0.065 | 0.082 | 0.038 | 0.046 | 0.088 | 0.053 | 0.099 |
| Diagnostic Outcome | oECG | uECG | nECG | pECG |
|---|---|---|---|---|
| correct | 121 | 117 | 115 | 117 |
| incorrect statement | 1 | 2 | 3 | 3 |
| incorrect modifier | 1 | 4 | 5 | 3 |
| total | 123 | 123 | 123 | 123 |
Publisher’s Note: MDPI stays neutral with regard to jurisdictional claims in published maps and institutional affiliations. |
© 2021 by the author. Licensee MDPI, Basel, Switzerland. This article is an open access article distributed under the terms and conditions of the Creative Commons Attribution (CC BY) license (https://creativecommons.org/licenses/by/4.0/).
Share and Cite
Augustyniak, P. Diagnostic Interpretation of Non-Uniformly Sampled Electrocardiogram. Sensors 2021, 21, 2969. https://doi.org/10.3390/s21092969
Augustyniak P. Diagnostic Interpretation of Non-Uniformly Sampled Electrocardiogram. Sensors. 2021; 21(9):2969. https://doi.org/10.3390/s21092969
Chicago/Turabian StyleAugustyniak, Piotr. 2021. "Diagnostic Interpretation of Non-Uniformly Sampled Electrocardiogram" Sensors 21, no. 9: 2969. https://doi.org/10.3390/s21092969
APA StyleAugustyniak, P. (2021). Diagnostic Interpretation of Non-Uniformly Sampled Electrocardiogram. Sensors, 21(9), 2969. https://doi.org/10.3390/s21092969