
Simulation and Optimization of SNAP-Taper Coupling System in Displacement Sensing

Abstract
1. Introduction
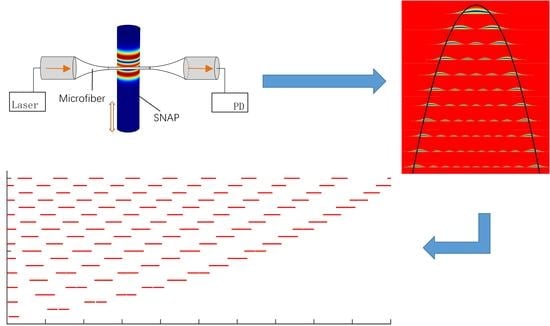
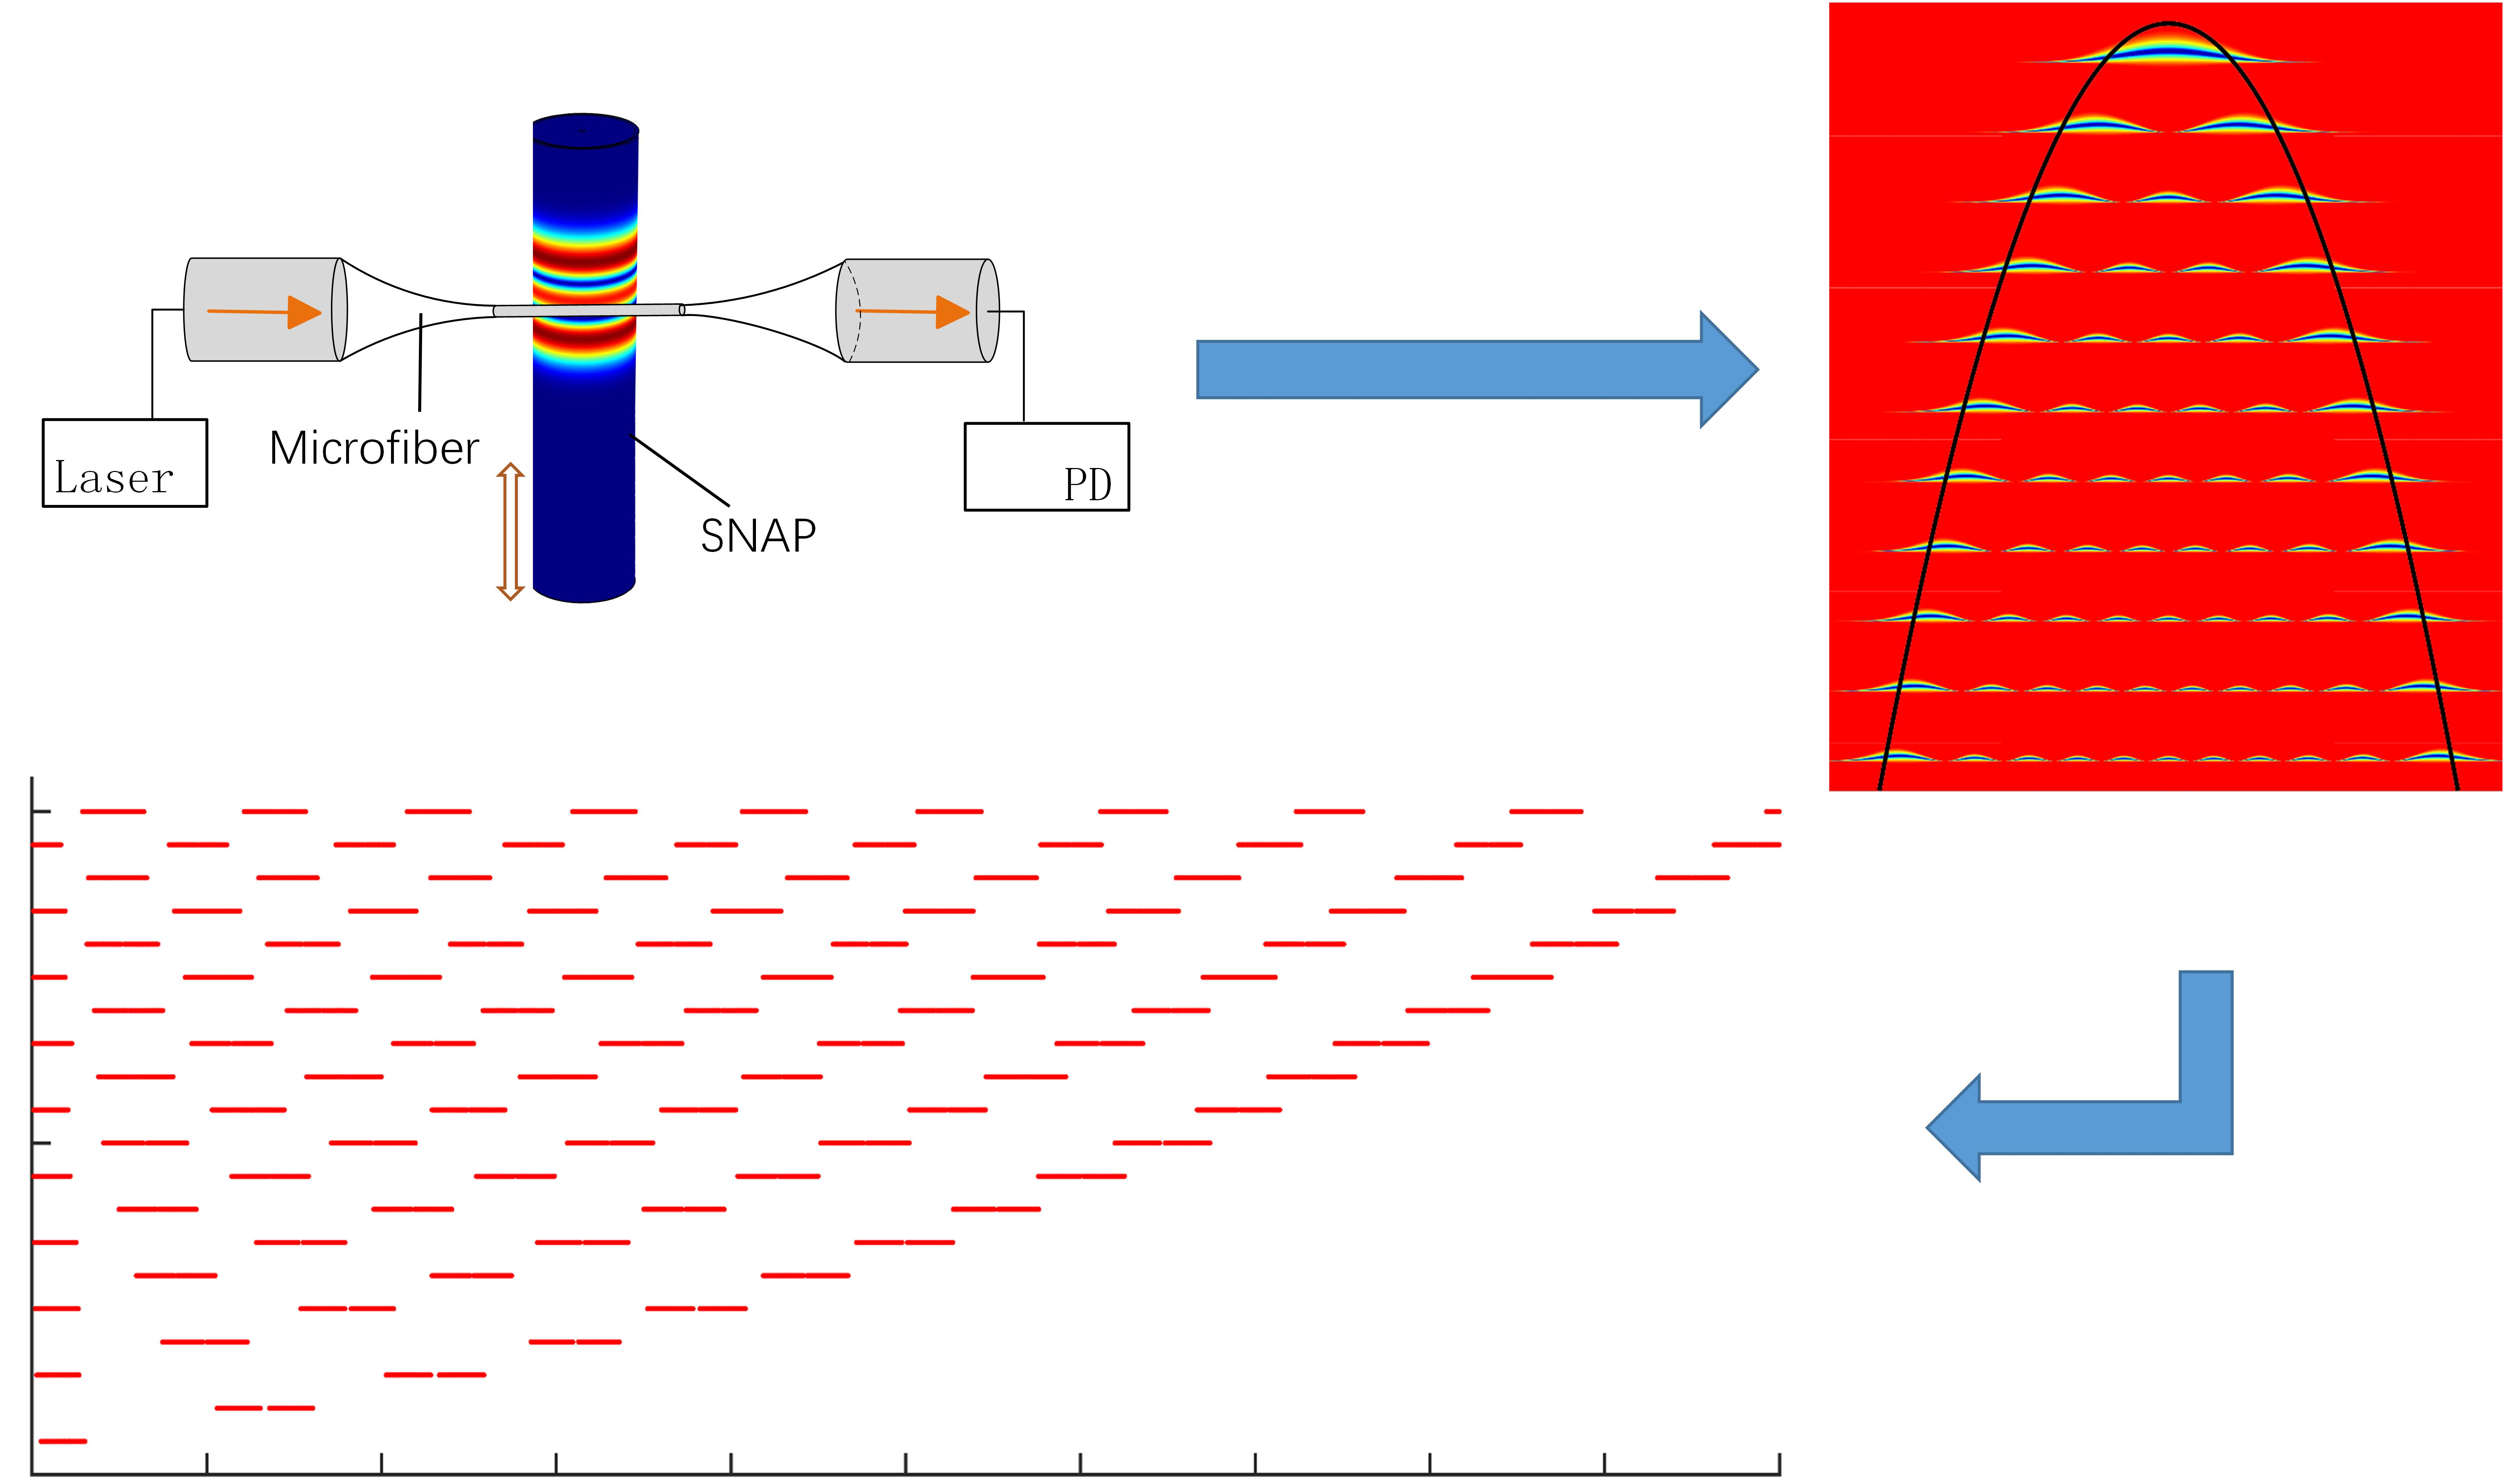
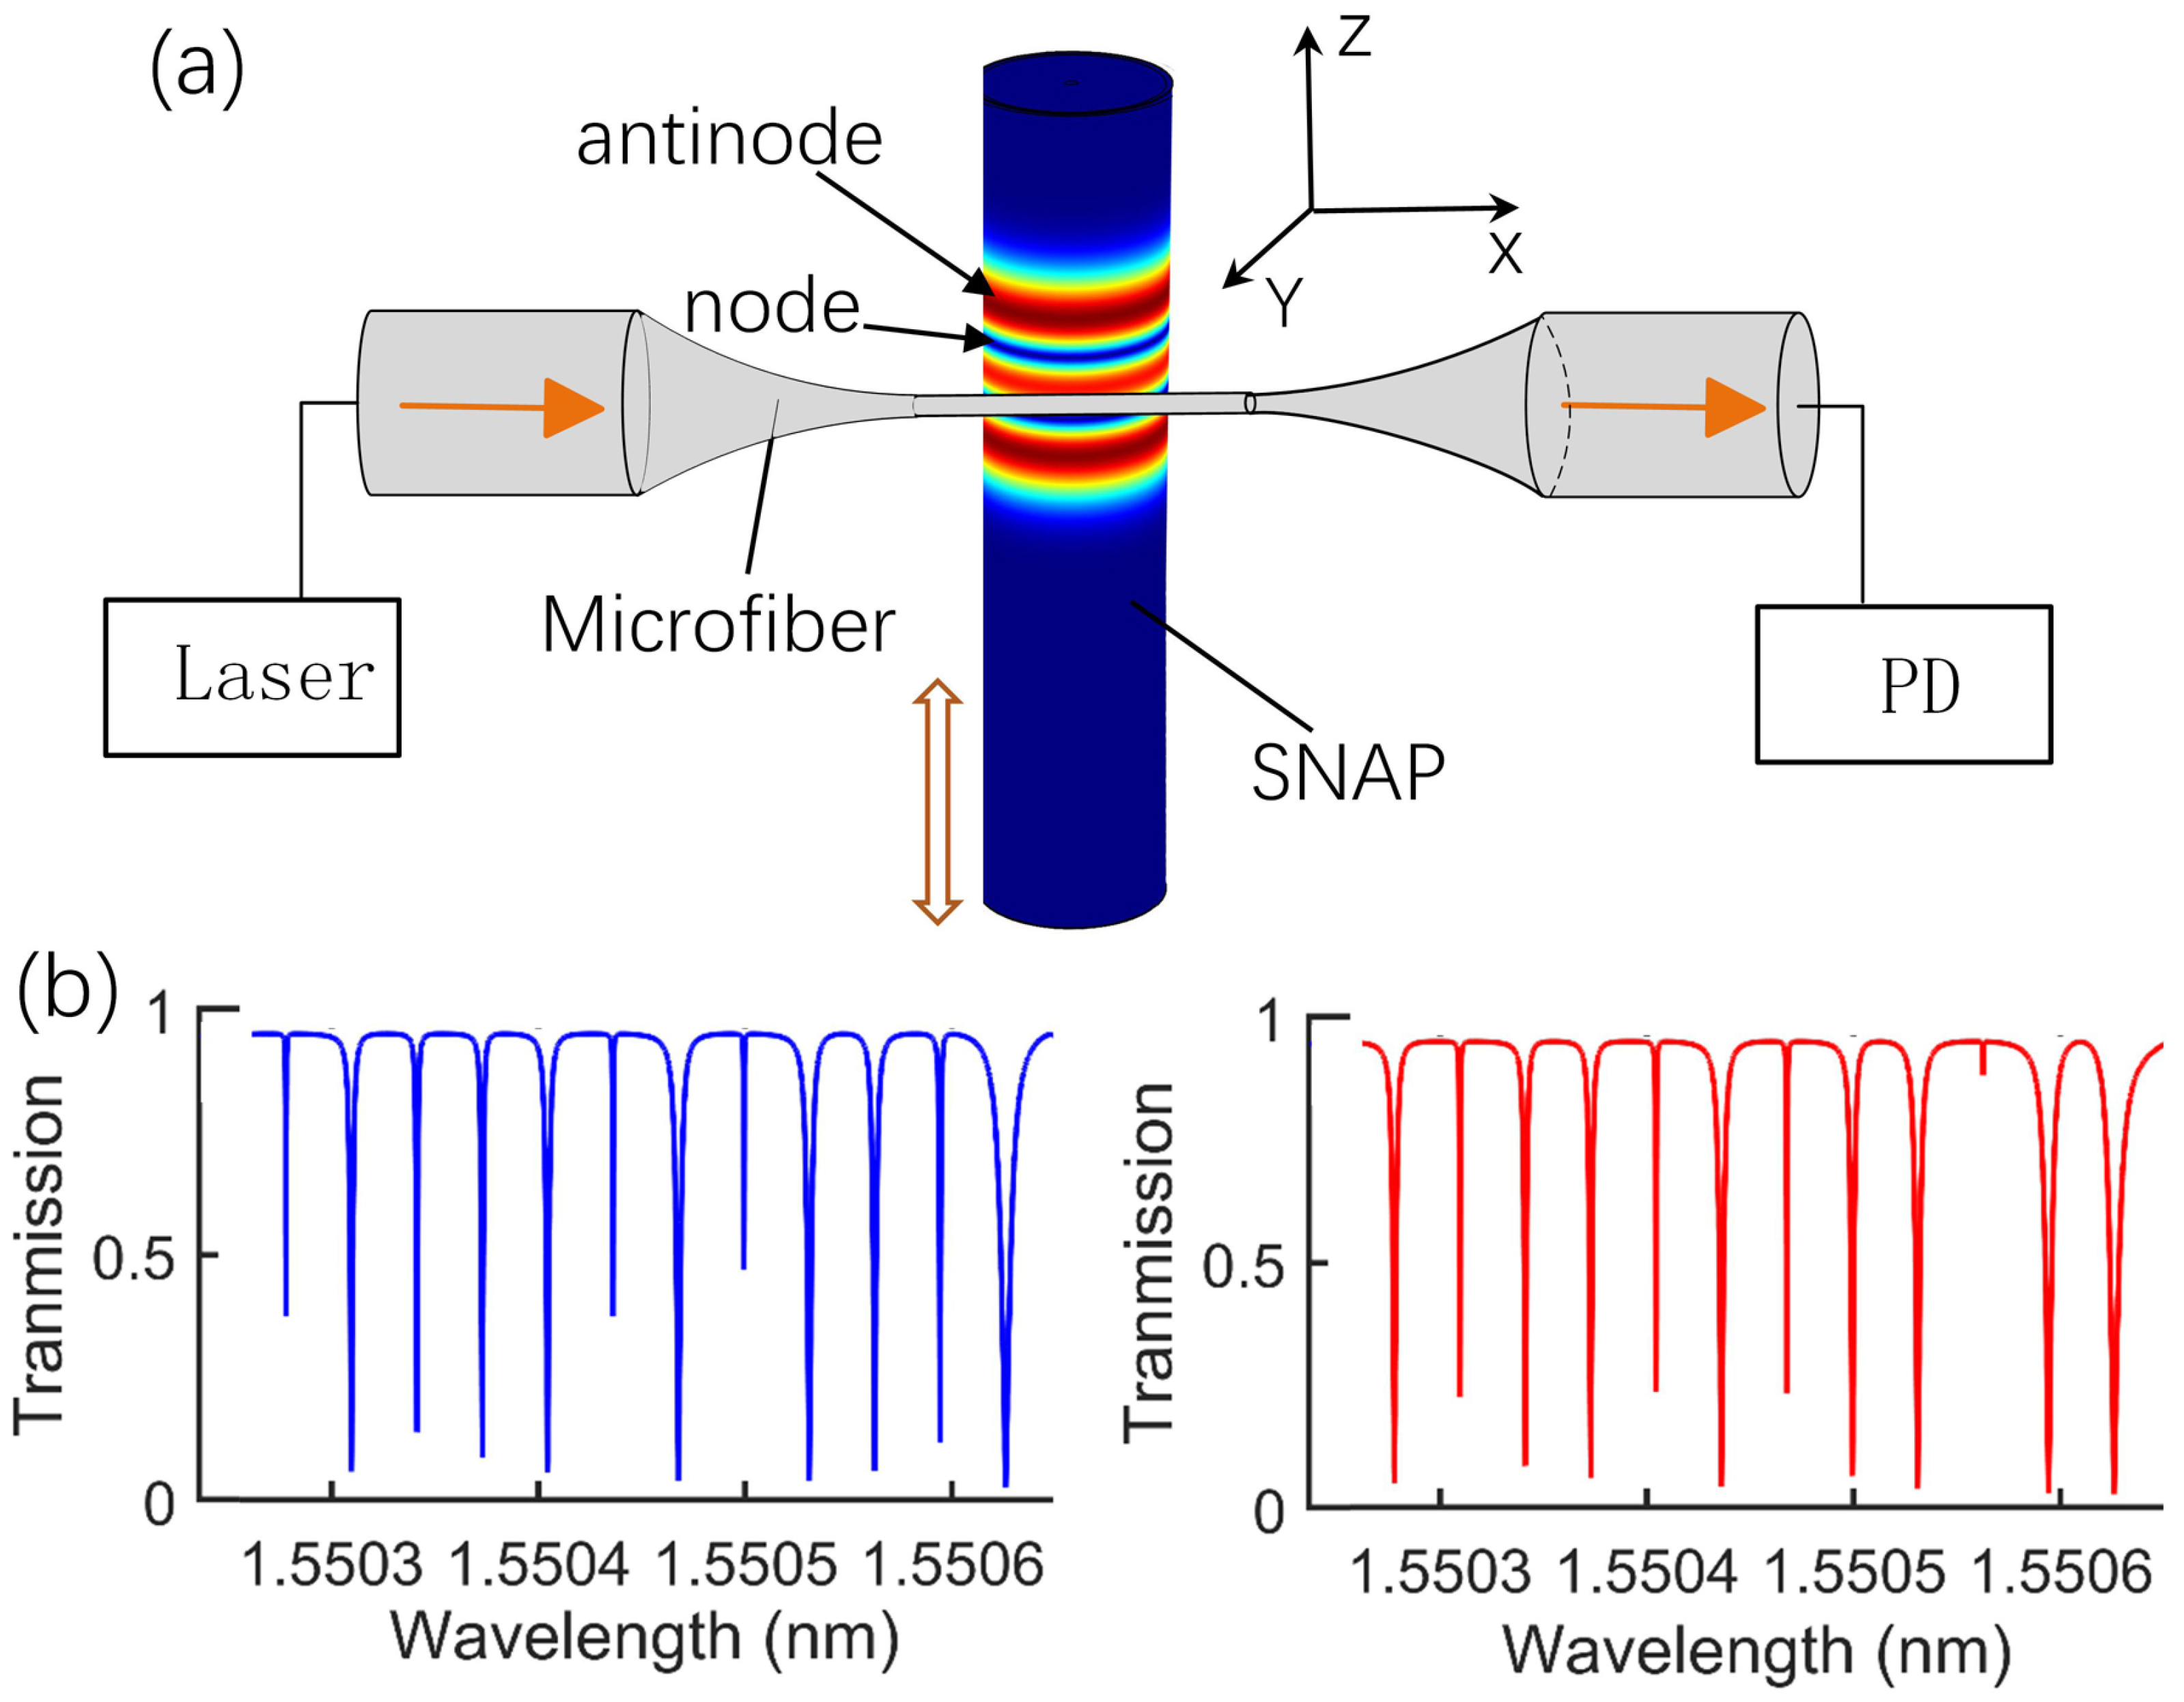
2. Sensor Concept
3. Theory
3.1. WGM in SNAP
3.2. Theory of a SNAP-Taper Coupling System
3.3. Simulation Parameters
4. Results and Discussion
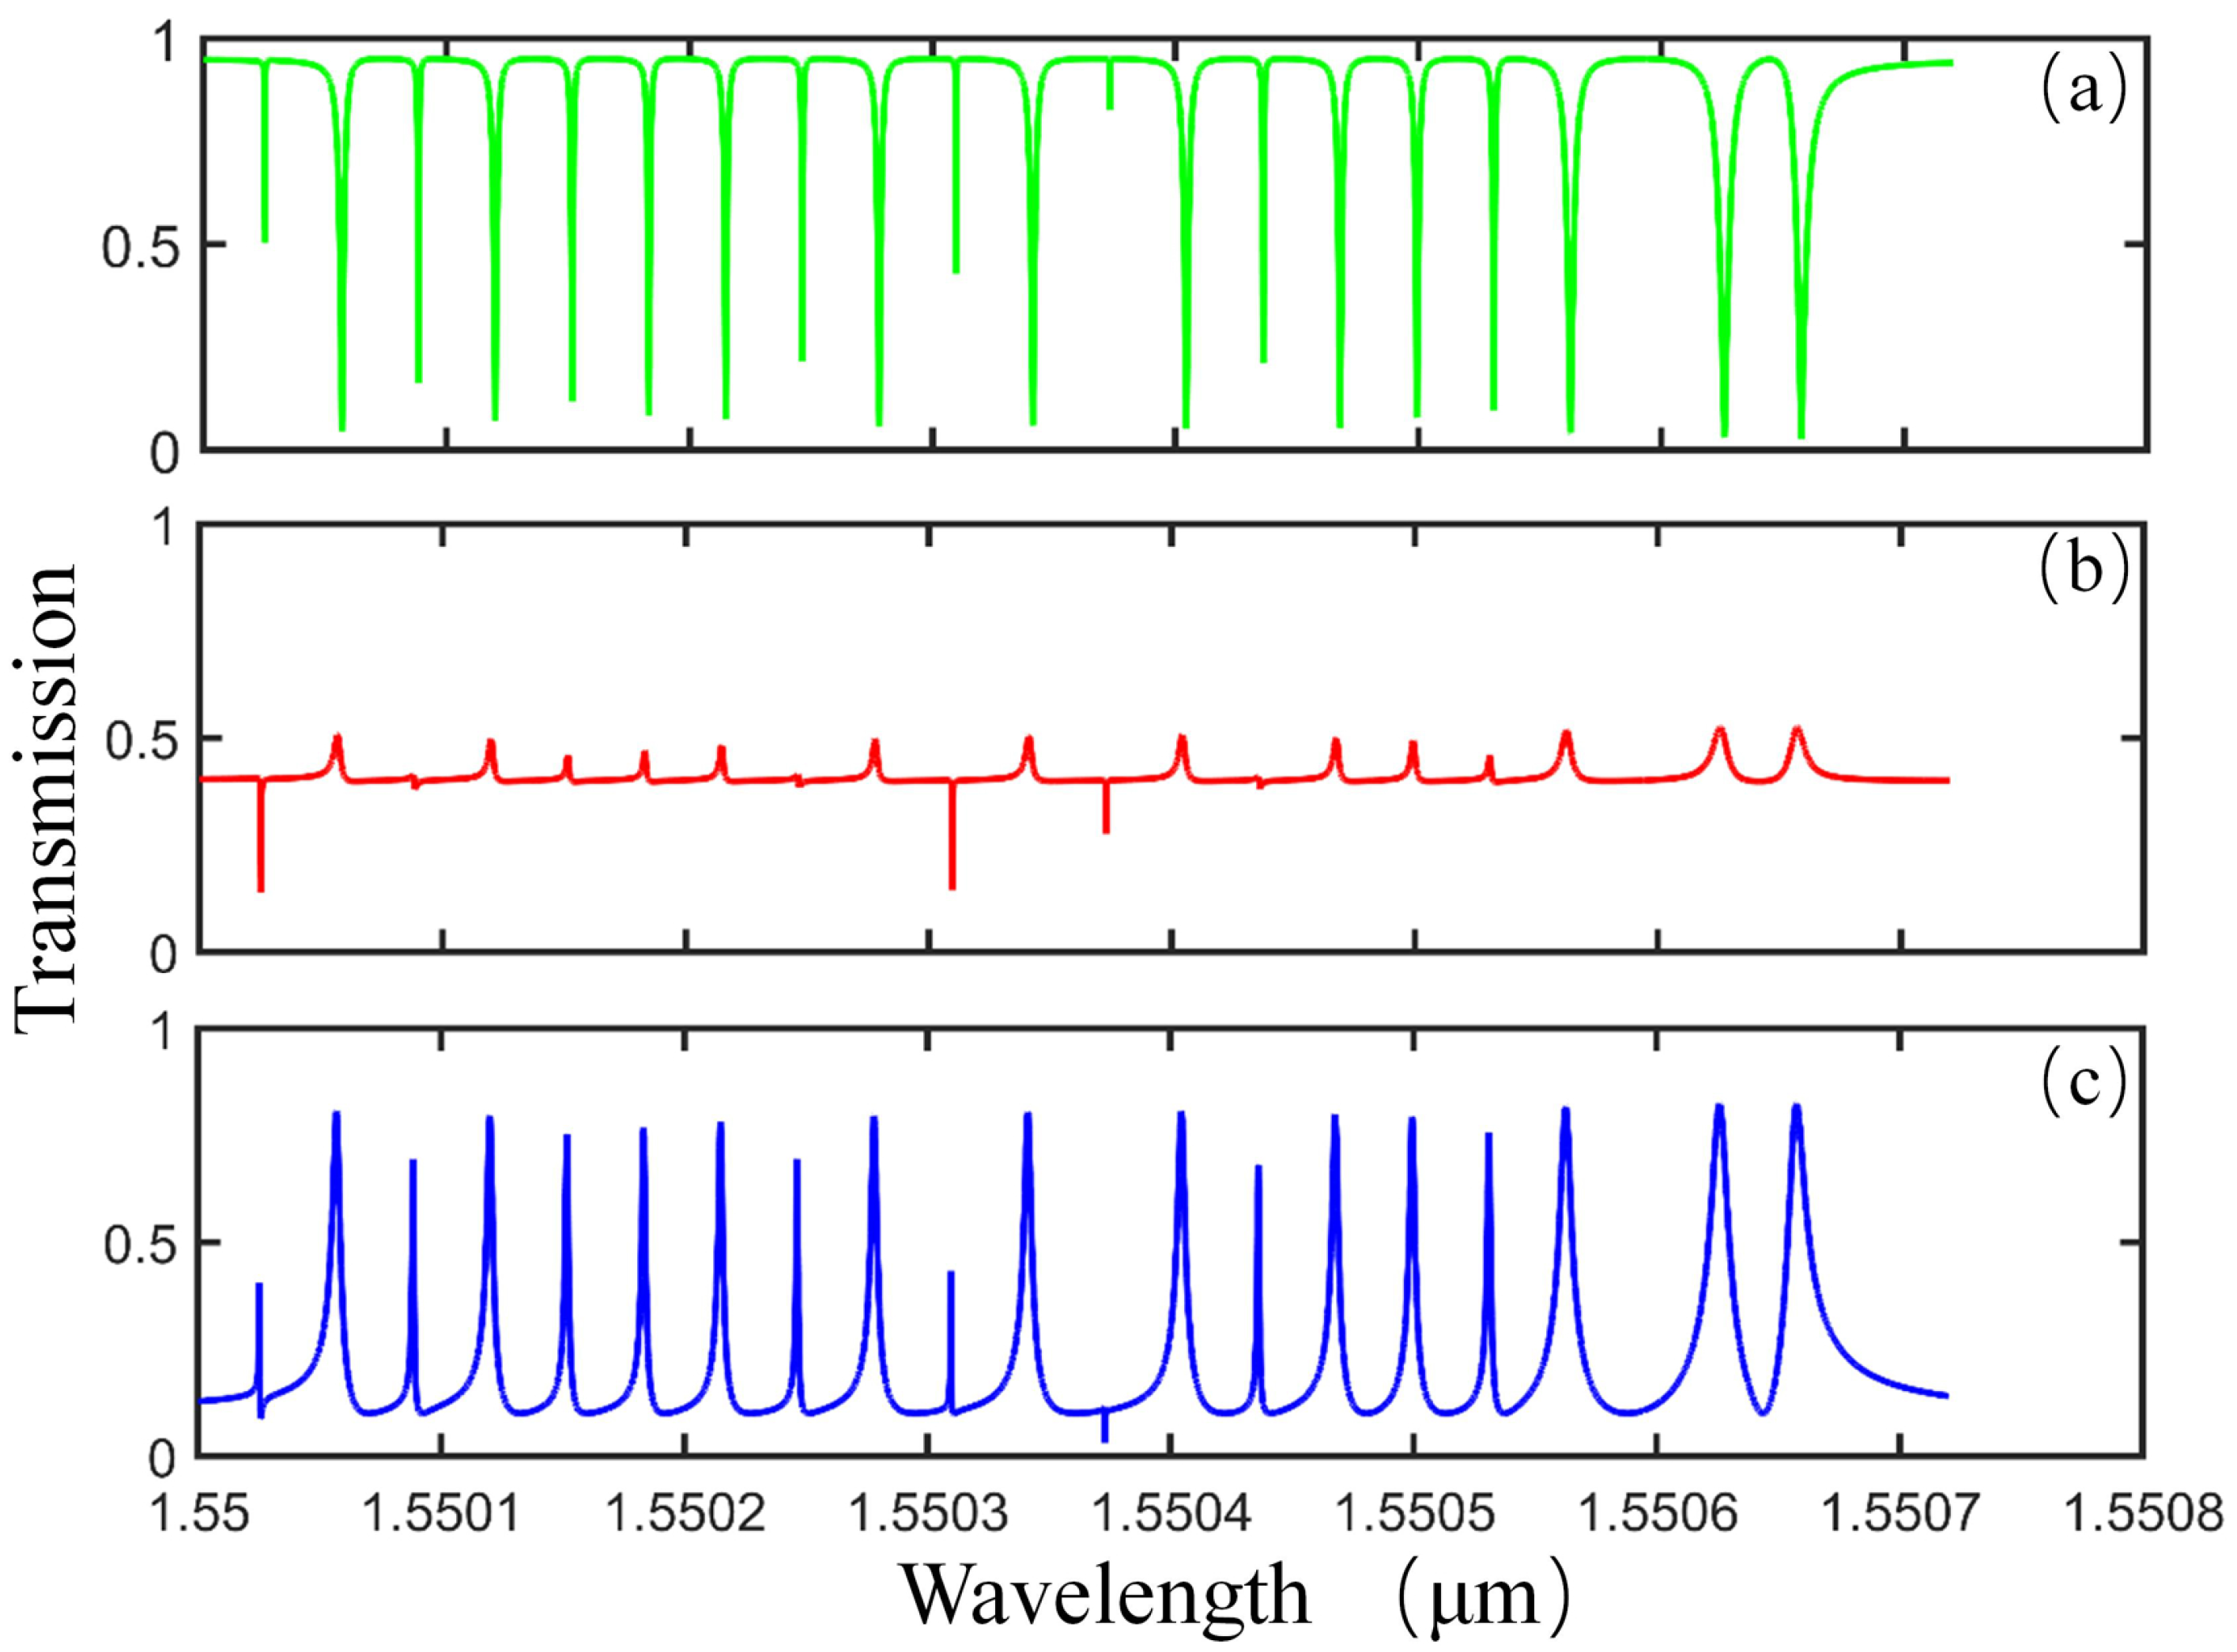
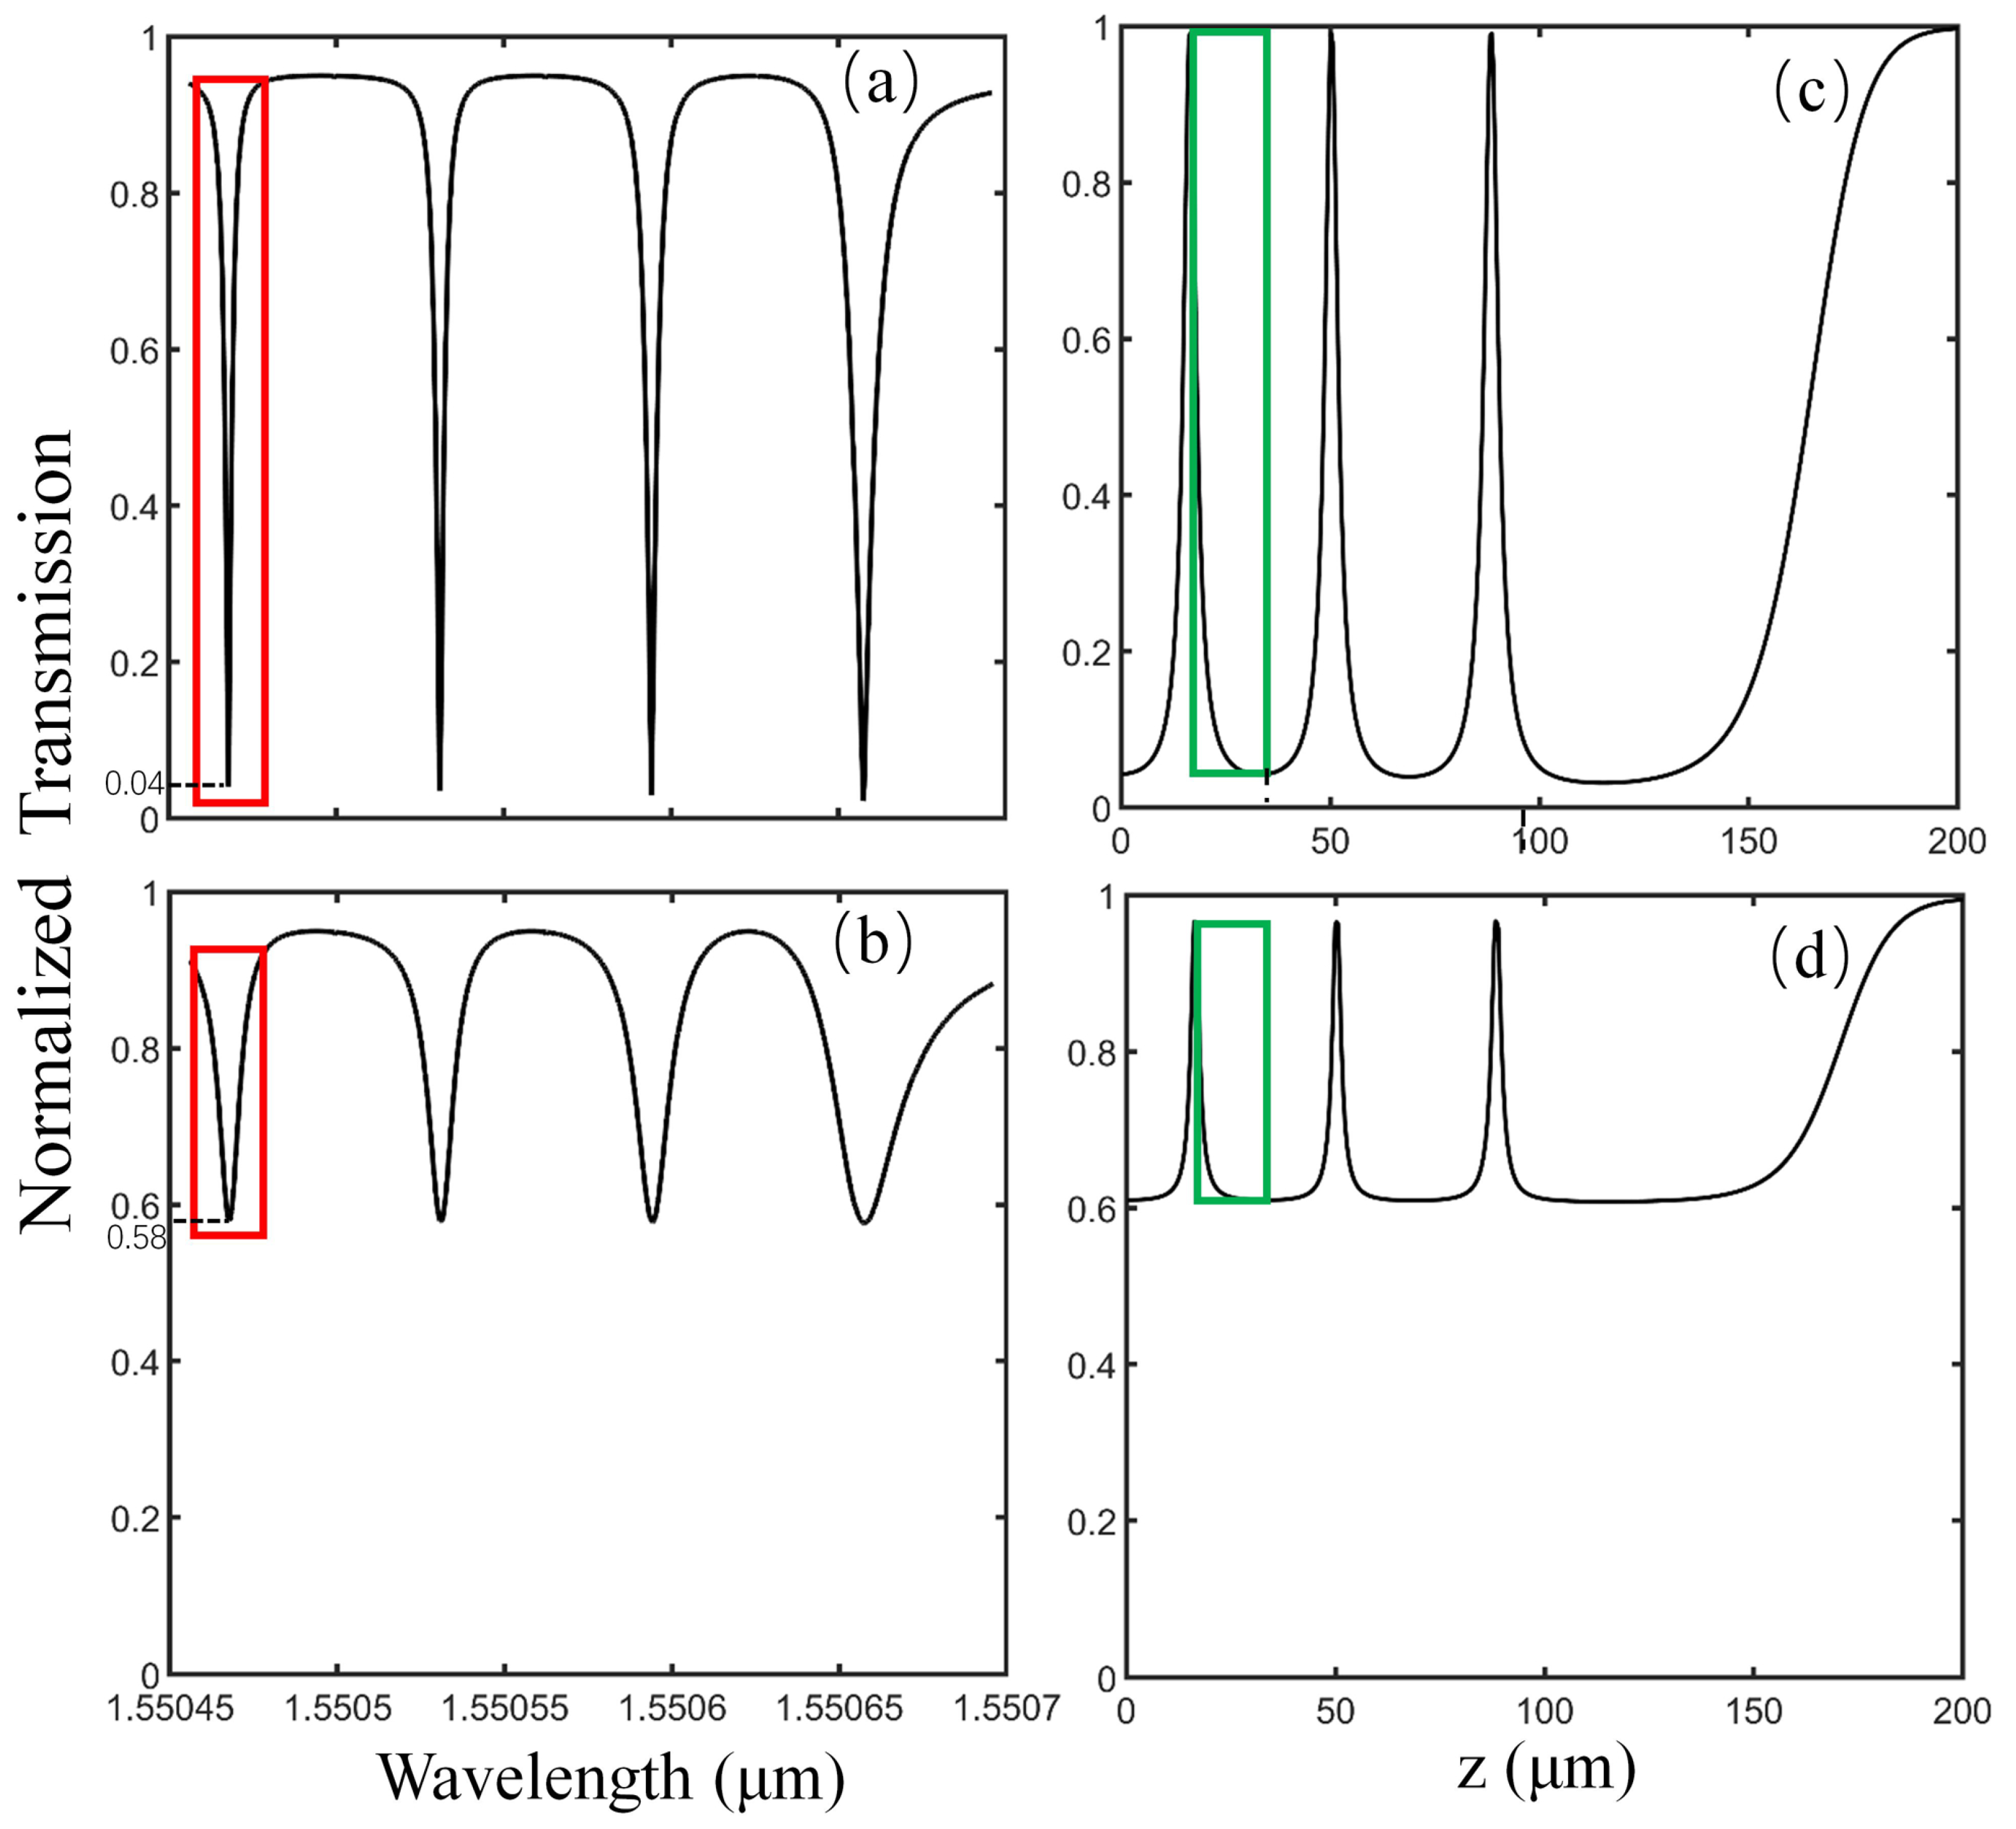
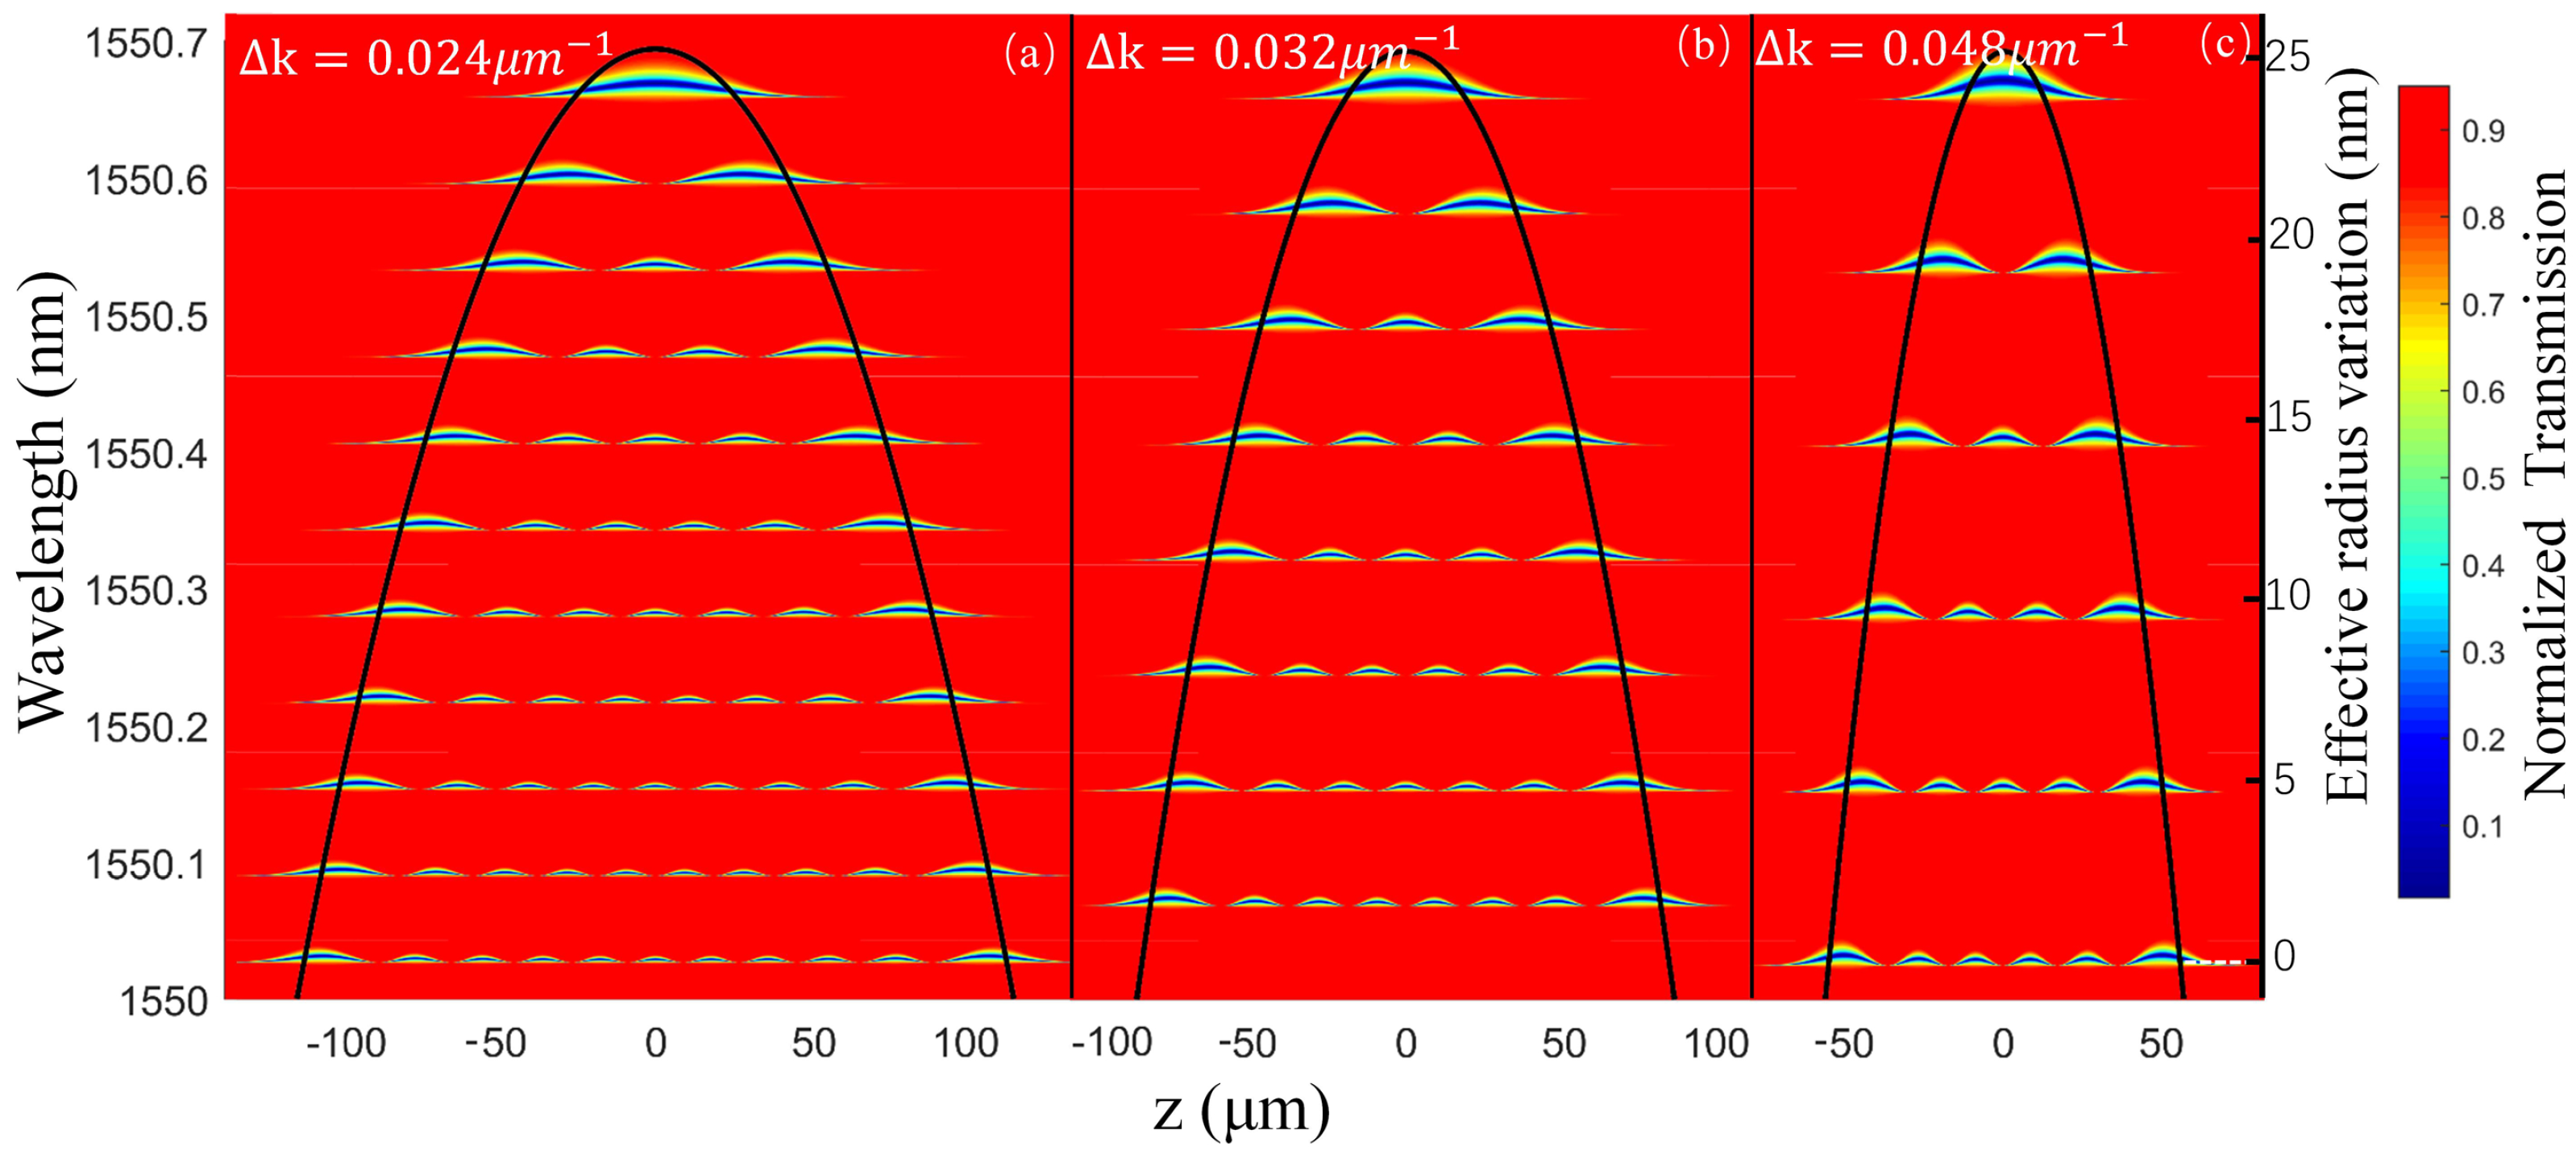
4.1. Influence of Coupling Parameters and ERV on the Resonance Spectrum
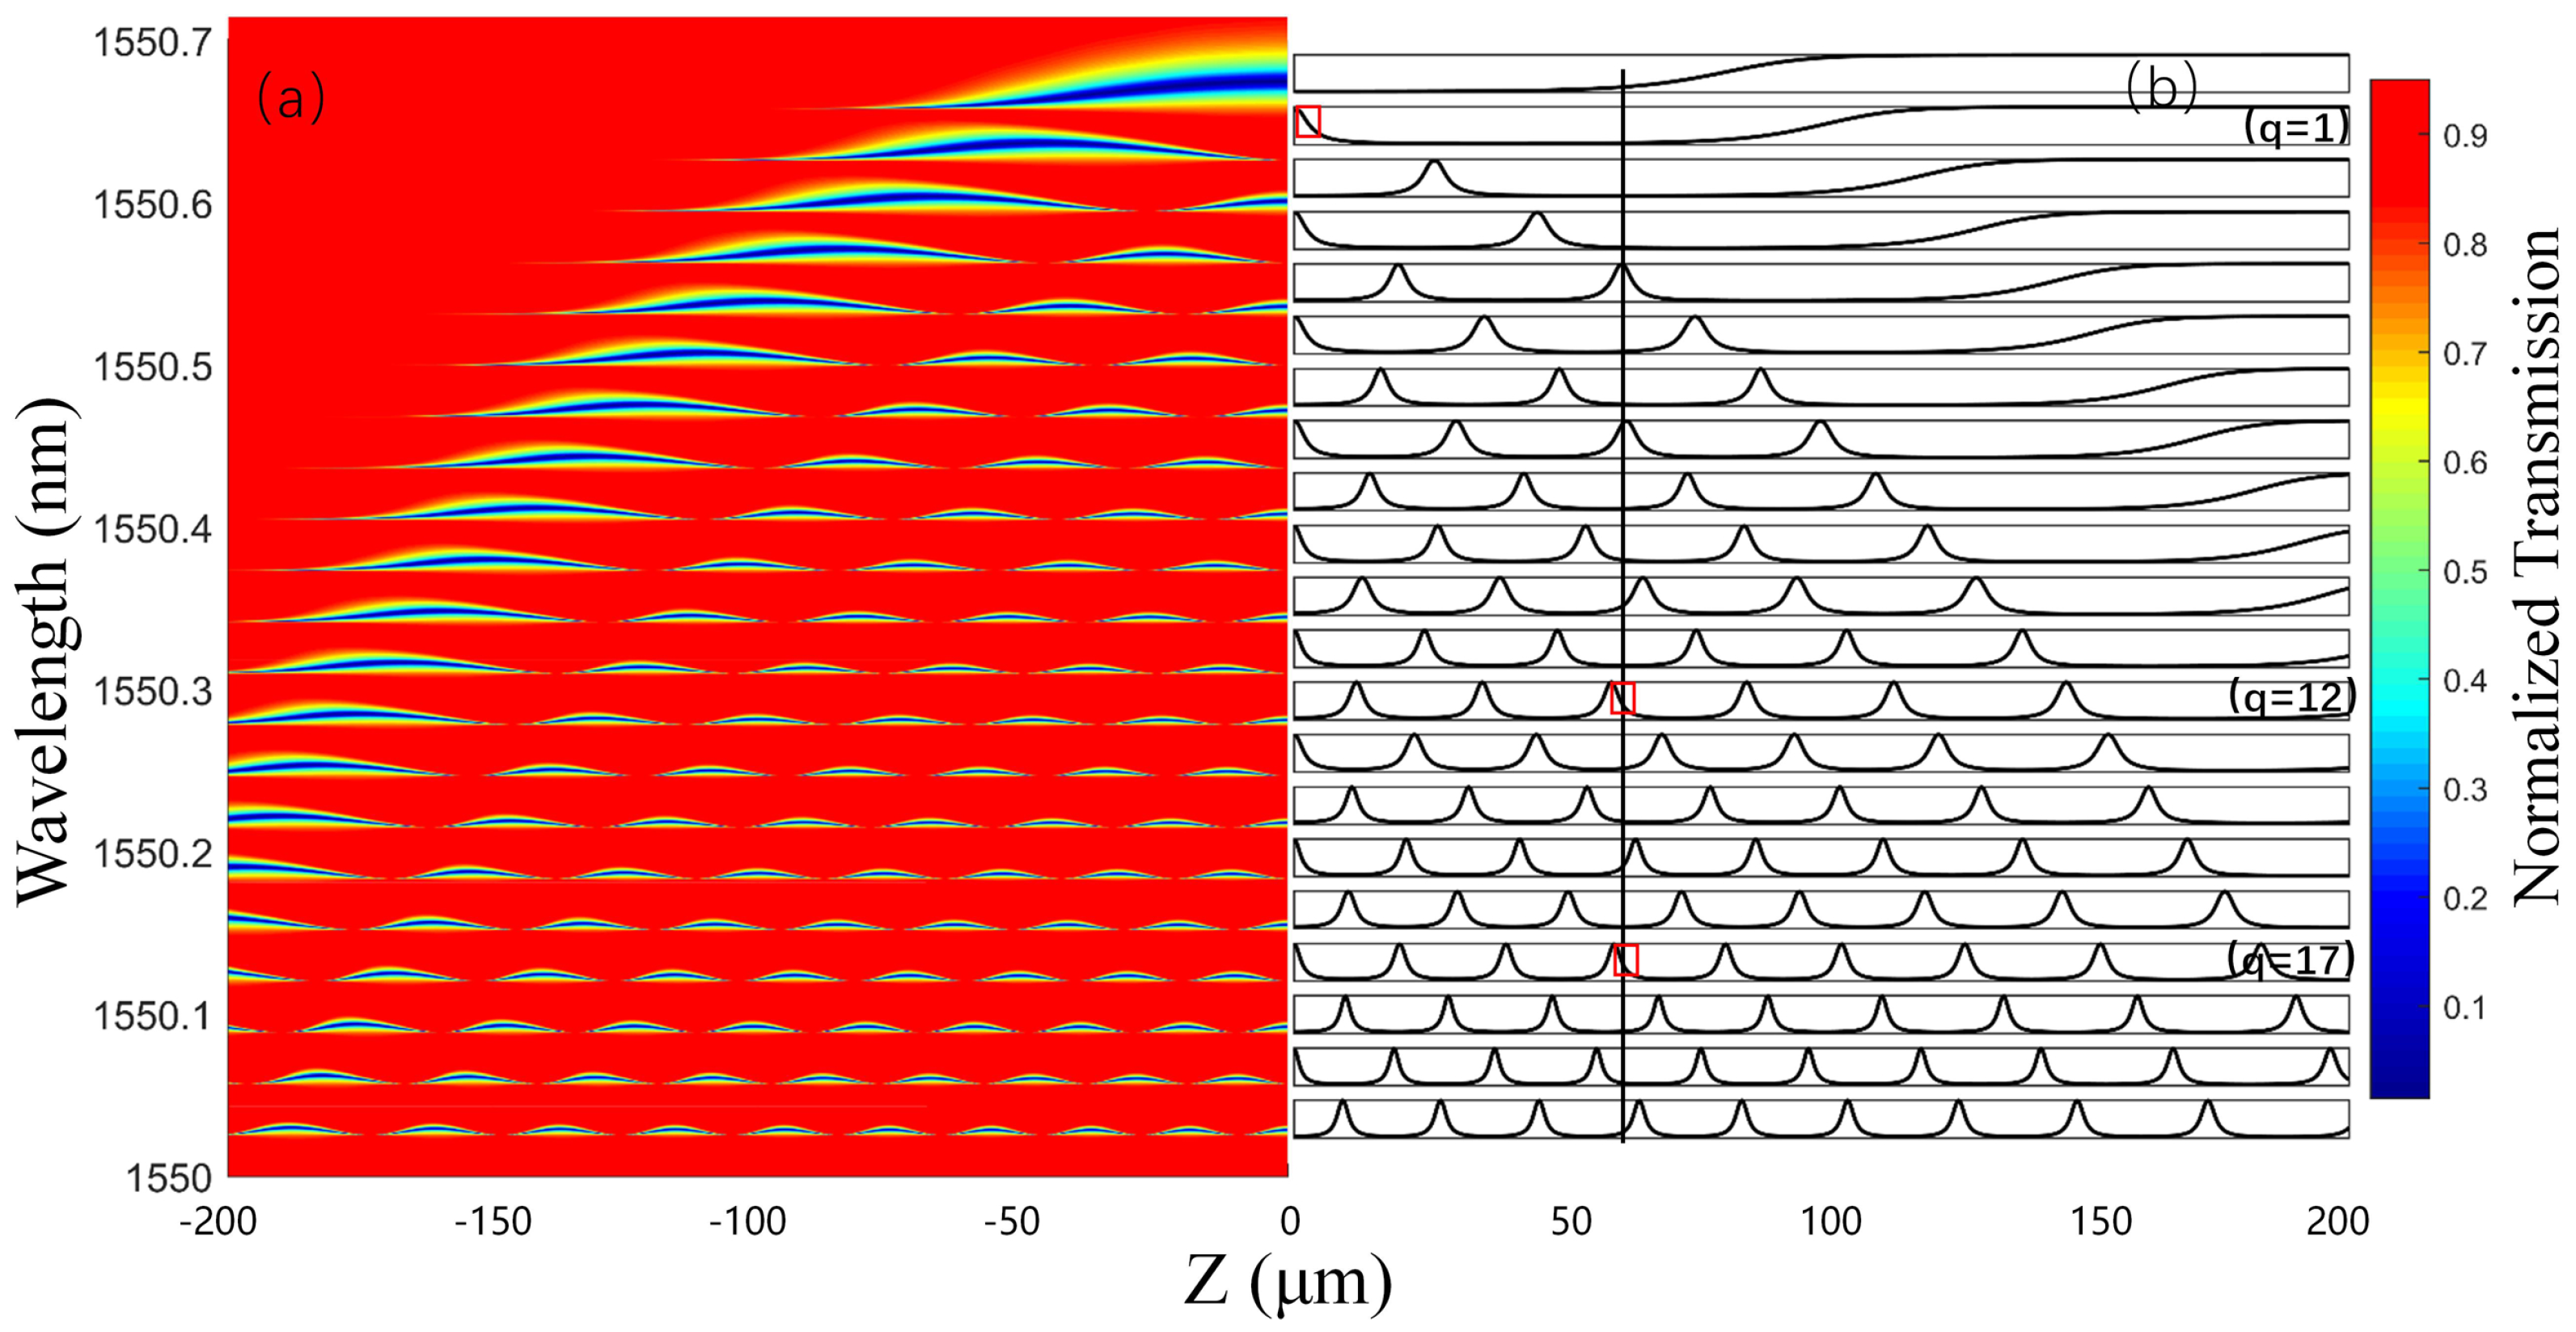
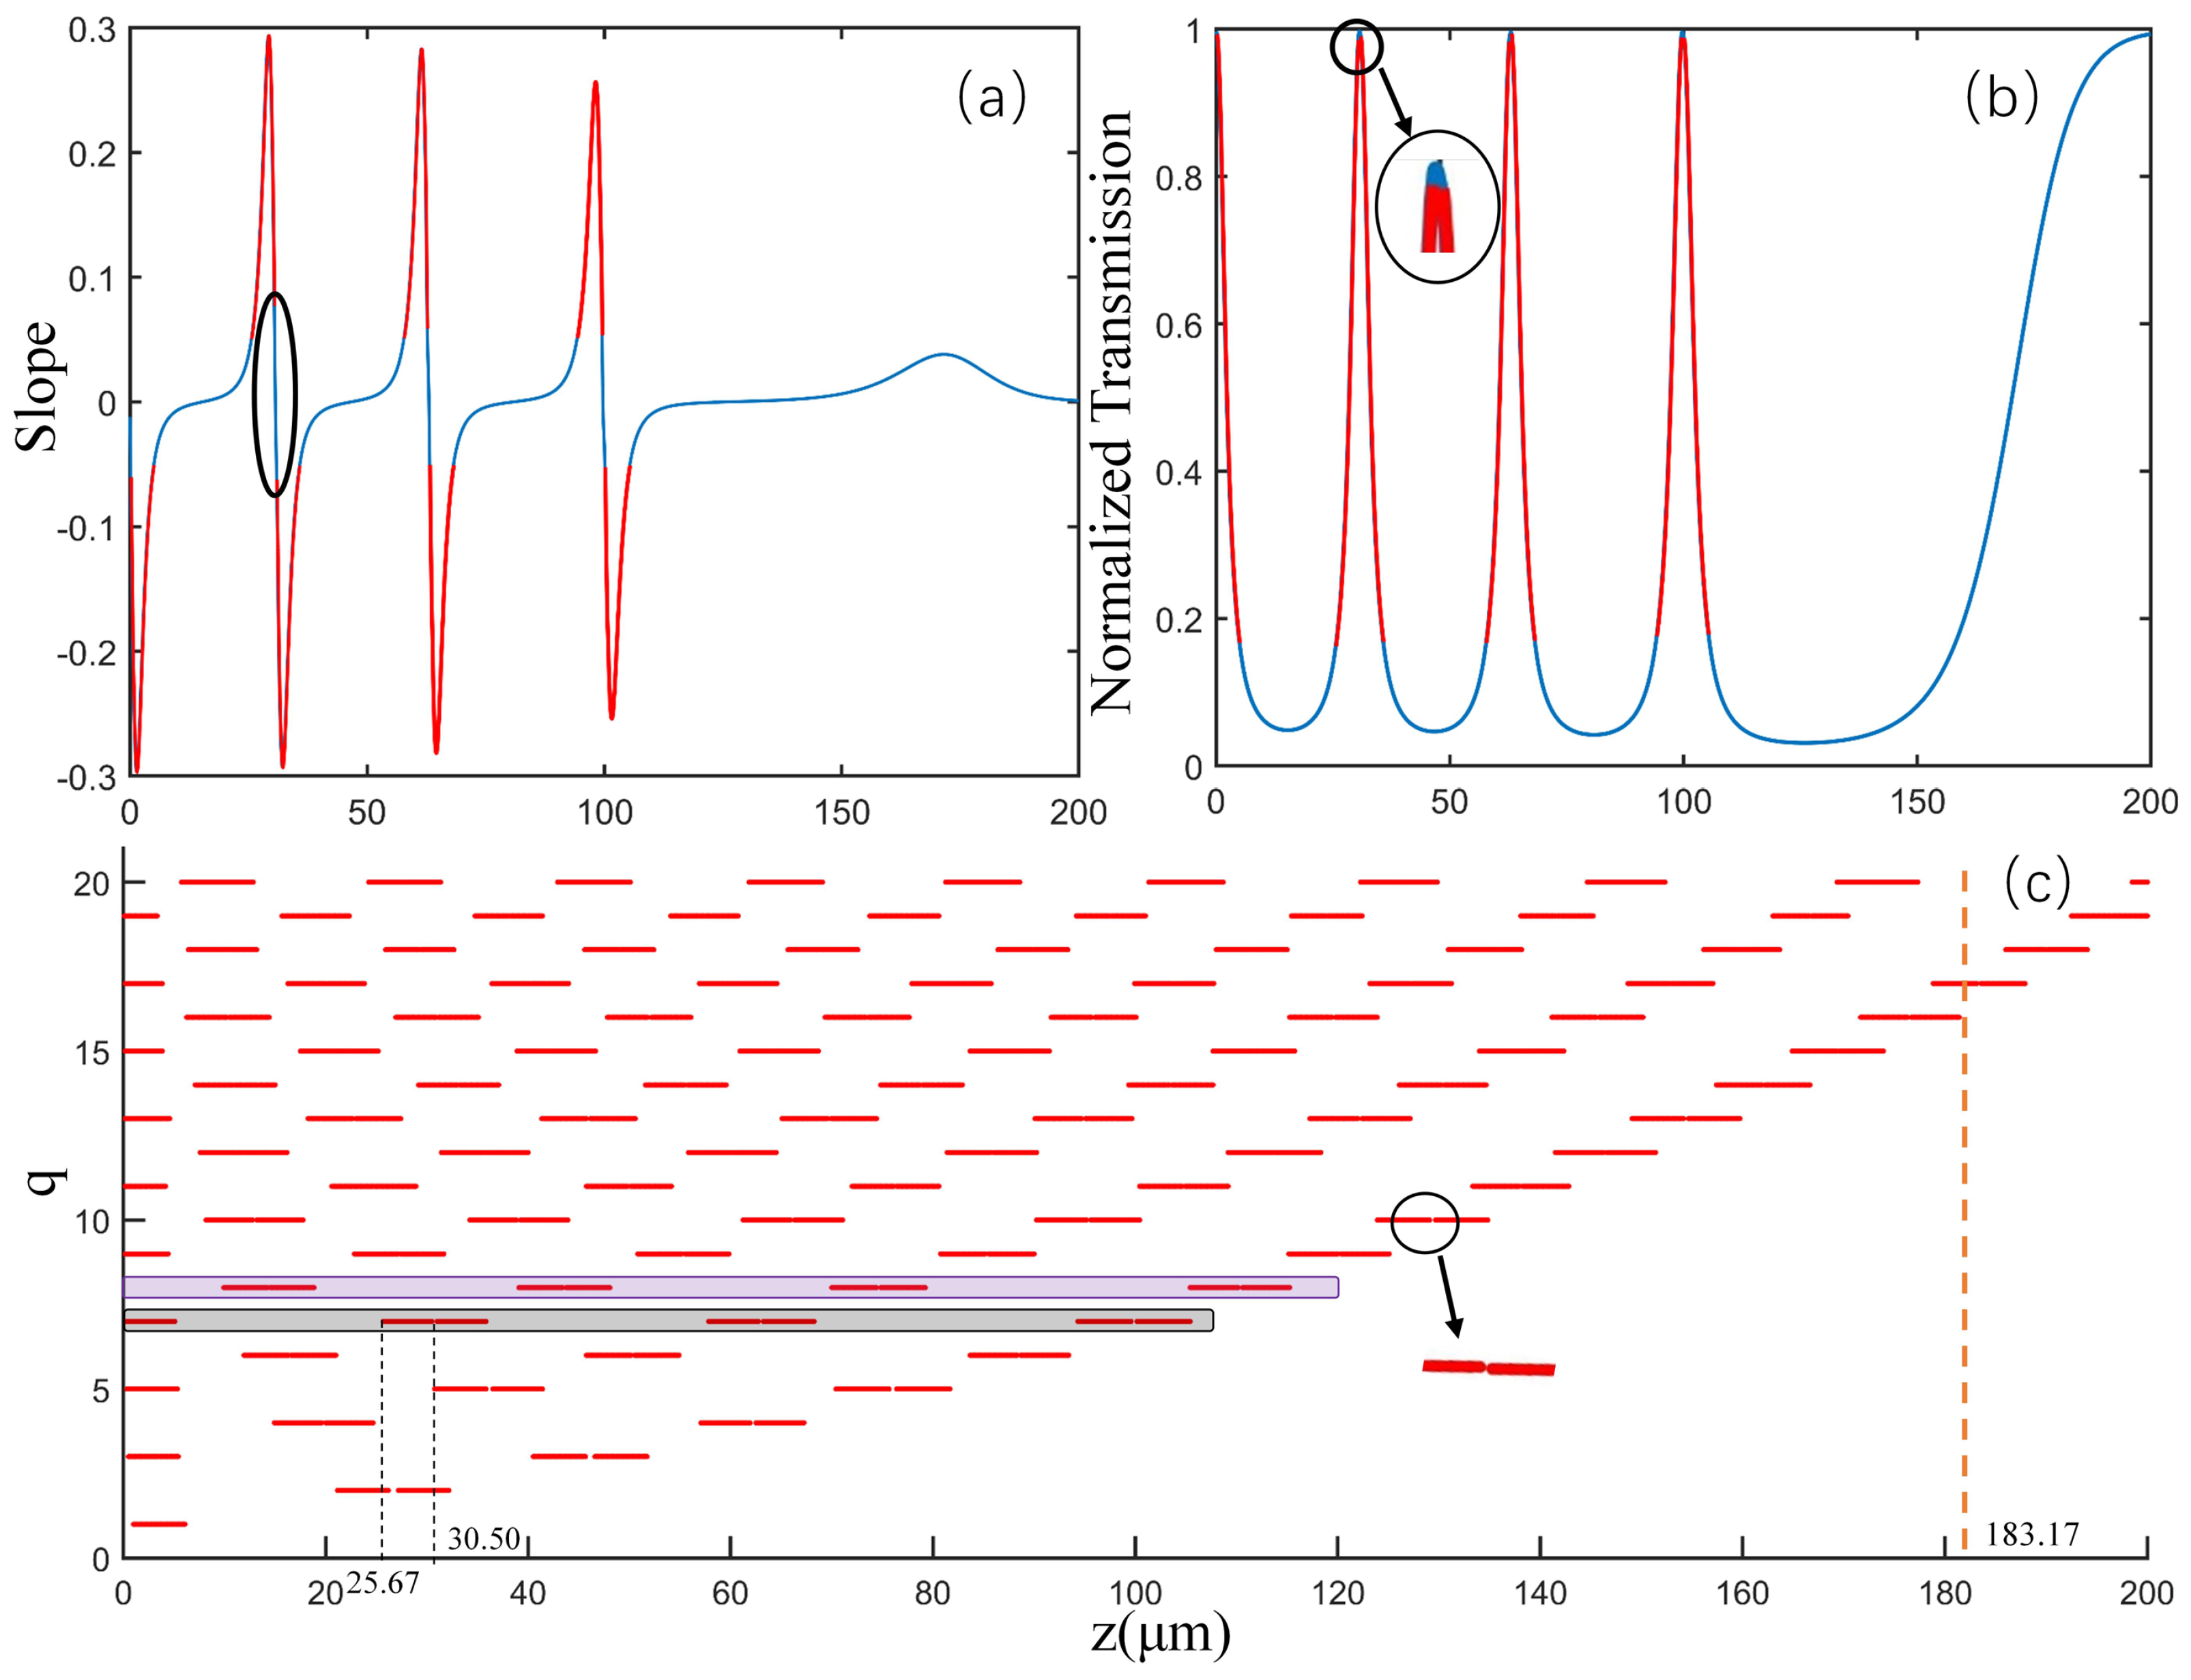
4.2. Displacement Sensing Analysis
5. Conclusions
Author Contributions
Funding
Institutional Review Board Statement
Informed Consent Statement
Data Availability Statement
Conflicts of Interest
References
- Vahala, K.J. Optical microcavities. Nature 2003, 424, 839–846. [Google Scholar] [CrossRef] [PubMed]
- He, L.; Özdemir, Ş.K.; Yang, L. Whispering gallery microcavity lasers. Laser Photonics Rev. 2013, 7, 60–82. [Google Scholar] [CrossRef]
- Bianucci, P. Optical microbottle resonators for sensing. Sensors 2016, 16, 1841. [Google Scholar] [CrossRef] [PubMed]
- Cho, H.K.; Han, J. Numerical study of opto-fluidic ring resonators for biosensor applications. Sensors 2012, 12, 14144–14157. [Google Scholar] [CrossRef] [PubMed]
- Righini, G.C.; Soria, S. Biosensing by WGM microspherical resonators. Sensors 2016, 16, 905. [Google Scholar] [CrossRef] [PubMed]
- Dong, Y.; Wang, K.; Jin, X. Simulation and optimization of multilayer-coated microsphere in temperature and refractive index sensing. Opt. Commun. 2015, 344, 92–99. [Google Scholar] [CrossRef]
- Yan, S.; Zhang, M.; Zhao, X.; Zhang, Y.; Wang, J.; Jin, W. Refractive index sensor based on a metal–insulator–metal waveguide coupled with a symmetric structure. Sensors 2017, 17, 2879. [Google Scholar] [CrossRef]
- Schliesser, A.; Anetsberger, G.; Rivière, R.; Arcizet, O.; Kippenberg, T.J. High-sensitivity monitoring of micromechanical vibration using optical whispering gallery mode resonators. New J. Phys. 2008, 10, 095015. [Google Scholar] [CrossRef]
- Zhang, P.; He, D.; Zhang, C.; Yan, Z. FDTD Simulation: Simultaneous Measurement of the Refractive Index and the Pressure Using Microdisk Resonator with Two Whispering-Gallery Modes. Sensors 2020, 20, 3955. [Google Scholar] [CrossRef] [PubMed]
- Zhu, S.; Liu, Y.; Shi, L.; Xu, X.; Zhang, X. Extinction ratio and resonant wavelength tuning using three dimensions of silica microresonators. Photonics Res. 2016, 4, 191–196. [Google Scholar] [CrossRef]
- Ying, G.A.; Yz, A.; Guo, Y.B. Displacement and temperature sensor based on whispering gallery effect within unsymmetrical U-type fiber structure. Optik 2021. [Google Scholar] [CrossRef]
- Jang, Y.S.; Lim, J.; Wang, W.; Flores, J.F.; Wong, C.W. Sub-fm/Hz1/2 displacement measurement on MgF2 whispering gallery mode microcavity. CLEO Appl. Technol. 2020. [Google Scholar] [CrossRef]
- Liu, N.; Shi, L.; Zhu, S.; Xu, X.; Yuan, S.; Zhang, X. Whispering gallery modes in a single silica microparticle attached to an optical microfiber and their application for highly sensitive displacement sensing. Opt. Express 2018, 26, 195–203. [Google Scholar] [CrossRef] [PubMed]
- Madugani, R.; Yang, Y.; Ward, J.M.; Riordan, J.D.; Coppola, S.; Vespini, V.; Grilli, S.; Finizio, A.; Ferraro, P.; Chormaic, S.N. Terahertz tuning of whispering gallery modes in a PDMS stand-alone, stretchable microsphere. Opt. Lett. 2012, 37, 4762–4764. [Google Scholar] [CrossRef] [PubMed]
- Ilchenko, V.; Volikov, P.; Velichansky, V.; Treussart, F.; Lefevre-Seguin, V.; Raimond, J.M.; Haroche, S. Strain-tunable high-Q optical microsphere resonator. Opt. Commun. 1998, 145, 86–90. [Google Scholar] [CrossRef]
- Sumetsky, M.; Dulashko, Y.; Windeler, R. Super free spectral range tunable optical microbubble resonator. Opt. Lett. 2010, 35, 1866–1868. [Google Scholar] [CrossRef]
- Yin, C.; Gu, J.; Li, M.; Song, Y. Tunable high-Q tapered silica microcylinder filter. Chin. Opt. Lett. 2013, 11, 082302. [Google Scholar]
- Sumetsky, M.; Fini, J. Surface nanoscale axial photonics. Opt. Express 2011, 19, 26470–26485. [Google Scholar] [CrossRef]
- Jin, X.; Dong, Y.; Wang, K. Selective excitation of axial modes in a high-Q microcylindrical resonator for controlled and robust coupling. Appl. Opt. 2015, 54, 8100–8107. [Google Scholar] [CrossRef]
- Dong, Y.; Jin, X.; Wang, K. Packaged and robust microcavity device based on a microcylinder–taper coupling system. Appl. Opt. 2015, 54, 4016–4022. [Google Scholar] [CrossRef]
- Sumetsky, M. Theory of SNAP devices: Basic equations and comparison with the experiment. Opt. Express 2012, 20, 22537–22554. [Google Scholar] [CrossRef] [PubMed]
- Sumetsky, M. Whispering-gallery-bottle microcavities: The three-dimensional etalon. Opt. Lett. 2004, 29, 8–10. [Google Scholar] [CrossRef] [PubMed]
- Pöllinger, M.; O’Shea, D.; Warken, F.; Rauschenbeutel, A. Ultrahigh-Q tunable whispering-gallery-mode microresonator. Phys. Rev. Lett. 2009, 103, 053901. [Google Scholar] [CrossRef]
- Miao, Y.; Peng, Y.; Xiang, Y.; Li, M.; Lu, Y.; Song, Y. Dynamic Fano resonance in thin fiber taper coupled cylindrical microcavity. IEEE Photonics J. 2016, 8, 1–6. [Google Scholar] [CrossRef]
- Wang, Y.; Zhang, K.; Zhou, S.; Wu, Y.H.; Chi, M.B.; Hao, P. Coupled-mode induced transparency in a bottle whispering-gallery-mode resonator. Opt. Lett. 2016, 41, 1825–1828. [Google Scholar] [CrossRef]
- Wang, B.; Liu, Z.X.; Kong, C.; Xiong, H.; Wu, Y. Mechanical exceptional-point-induced transparency and slow light. Opt. Express 2019, 27, 8069–8080. [Google Scholar] [CrossRef]
- Shang, Y.L.; Ye, M.Y.; Lin, X.M. Experimental observation of Fano-like resonance in a whispering-gallery-mode microresonator in aqueous environment. Photonics Res. 2017, 5, 119–123. [Google Scholar] [CrossRef]
- Louyer, Y.; Meschede, D.; Rauschenbeutel, A. Tunable whispering-gallery-mode resonators for cavity quantum electrodynamics. Phys. Rev. A 2005, 72, 031801. [Google Scholar] [CrossRef]
- Yariv, A. Optical Electronics: Saunders College; California Institute of Technology: Pasadena, CA, USA, 1991; pp. 519–524. [Google Scholar]
- Jin, X.; Wang, K.; Dong, Y.; Wang, M.; Gao, H.; Yu, L. Multiple-channel dynamic bandpass filter via radiation modes-assisted transparency in a side-coupled SNAP microcavity. Appl. Phys. Express 2019, 12, 092001. [Google Scholar] [CrossRef]
- Dong, Y.; Jin, X.; Wang, K. Simulation of internally referenced resonance in a three-layer-coated microsphere resonator. In Proceedings of the 7th International Symposium on Advanced Optical Manufacturing and Testing Technologies (AOMATT 2014), Harbin, China, 26 April 2014; Volume 9283, p. 928307. [Google Scholar]
- Vitullo, D.L.; Zaki, S.; Jones, D.; Sumetsky, M.; Brodsky, M. Coupling between waveguides and microresonators: The local approach. Opt. Express 2020, 28, 25908–25914. [Google Scholar] [CrossRef]


Publisher’s Note: MDPI stays neutral with regard to jurisdictional claims in published maps and institutional affiliations. |
© 2021 by the authors. Licensee MDPI, Basel, Switzerland. This article is an open access article distributed under the terms and conditions of the Creative Commons Attribution (CC BY) license (https://creativecommons.org/licenses/by/4.0/).
Share and Cite
Chen, J.; Dong, Y.; Wang, H.; Sun, P.; Zeng, X. Simulation and Optimization of SNAP-Taper Coupling System in Displacement Sensing. Sensors 2021, 21, 2947. https://doi.org/10.3390/s21092947
Chen J, Dong Y, Wang H, Sun P, Zeng X. Simulation and Optimization of SNAP-Taper Coupling System in Displacement Sensing. Sensors. 2021; 21(9):2947. https://doi.org/10.3390/s21092947
Chicago/Turabian StyleChen, Jian, Yongchao Dong, Han Wang, Penghui Sun, and Xueliang Zeng. 2021. "Simulation and Optimization of SNAP-Taper Coupling System in Displacement Sensing" Sensors 21, no. 9: 2947. https://doi.org/10.3390/s21092947
APA StyleChen, J., Dong, Y., Wang, H., Sun, P., & Zeng, X. (2021). Simulation and Optimization of SNAP-Taper Coupling System in Displacement Sensing. Sensors, 21(9), 2947. https://doi.org/10.3390/s21092947