Ultra-Light Airborne Measurement System for Investigation of Urban Boundary Layer Dynamics
Abstract
1. Introduction
2. Materials and Methods
2.1. AirDust Measurement System
2.2. TriSonica Wind Sensor
2.3. Sensors Calibration
2.4. Smoothing Procedure
2.5. Correction of Sensors’ Response Time
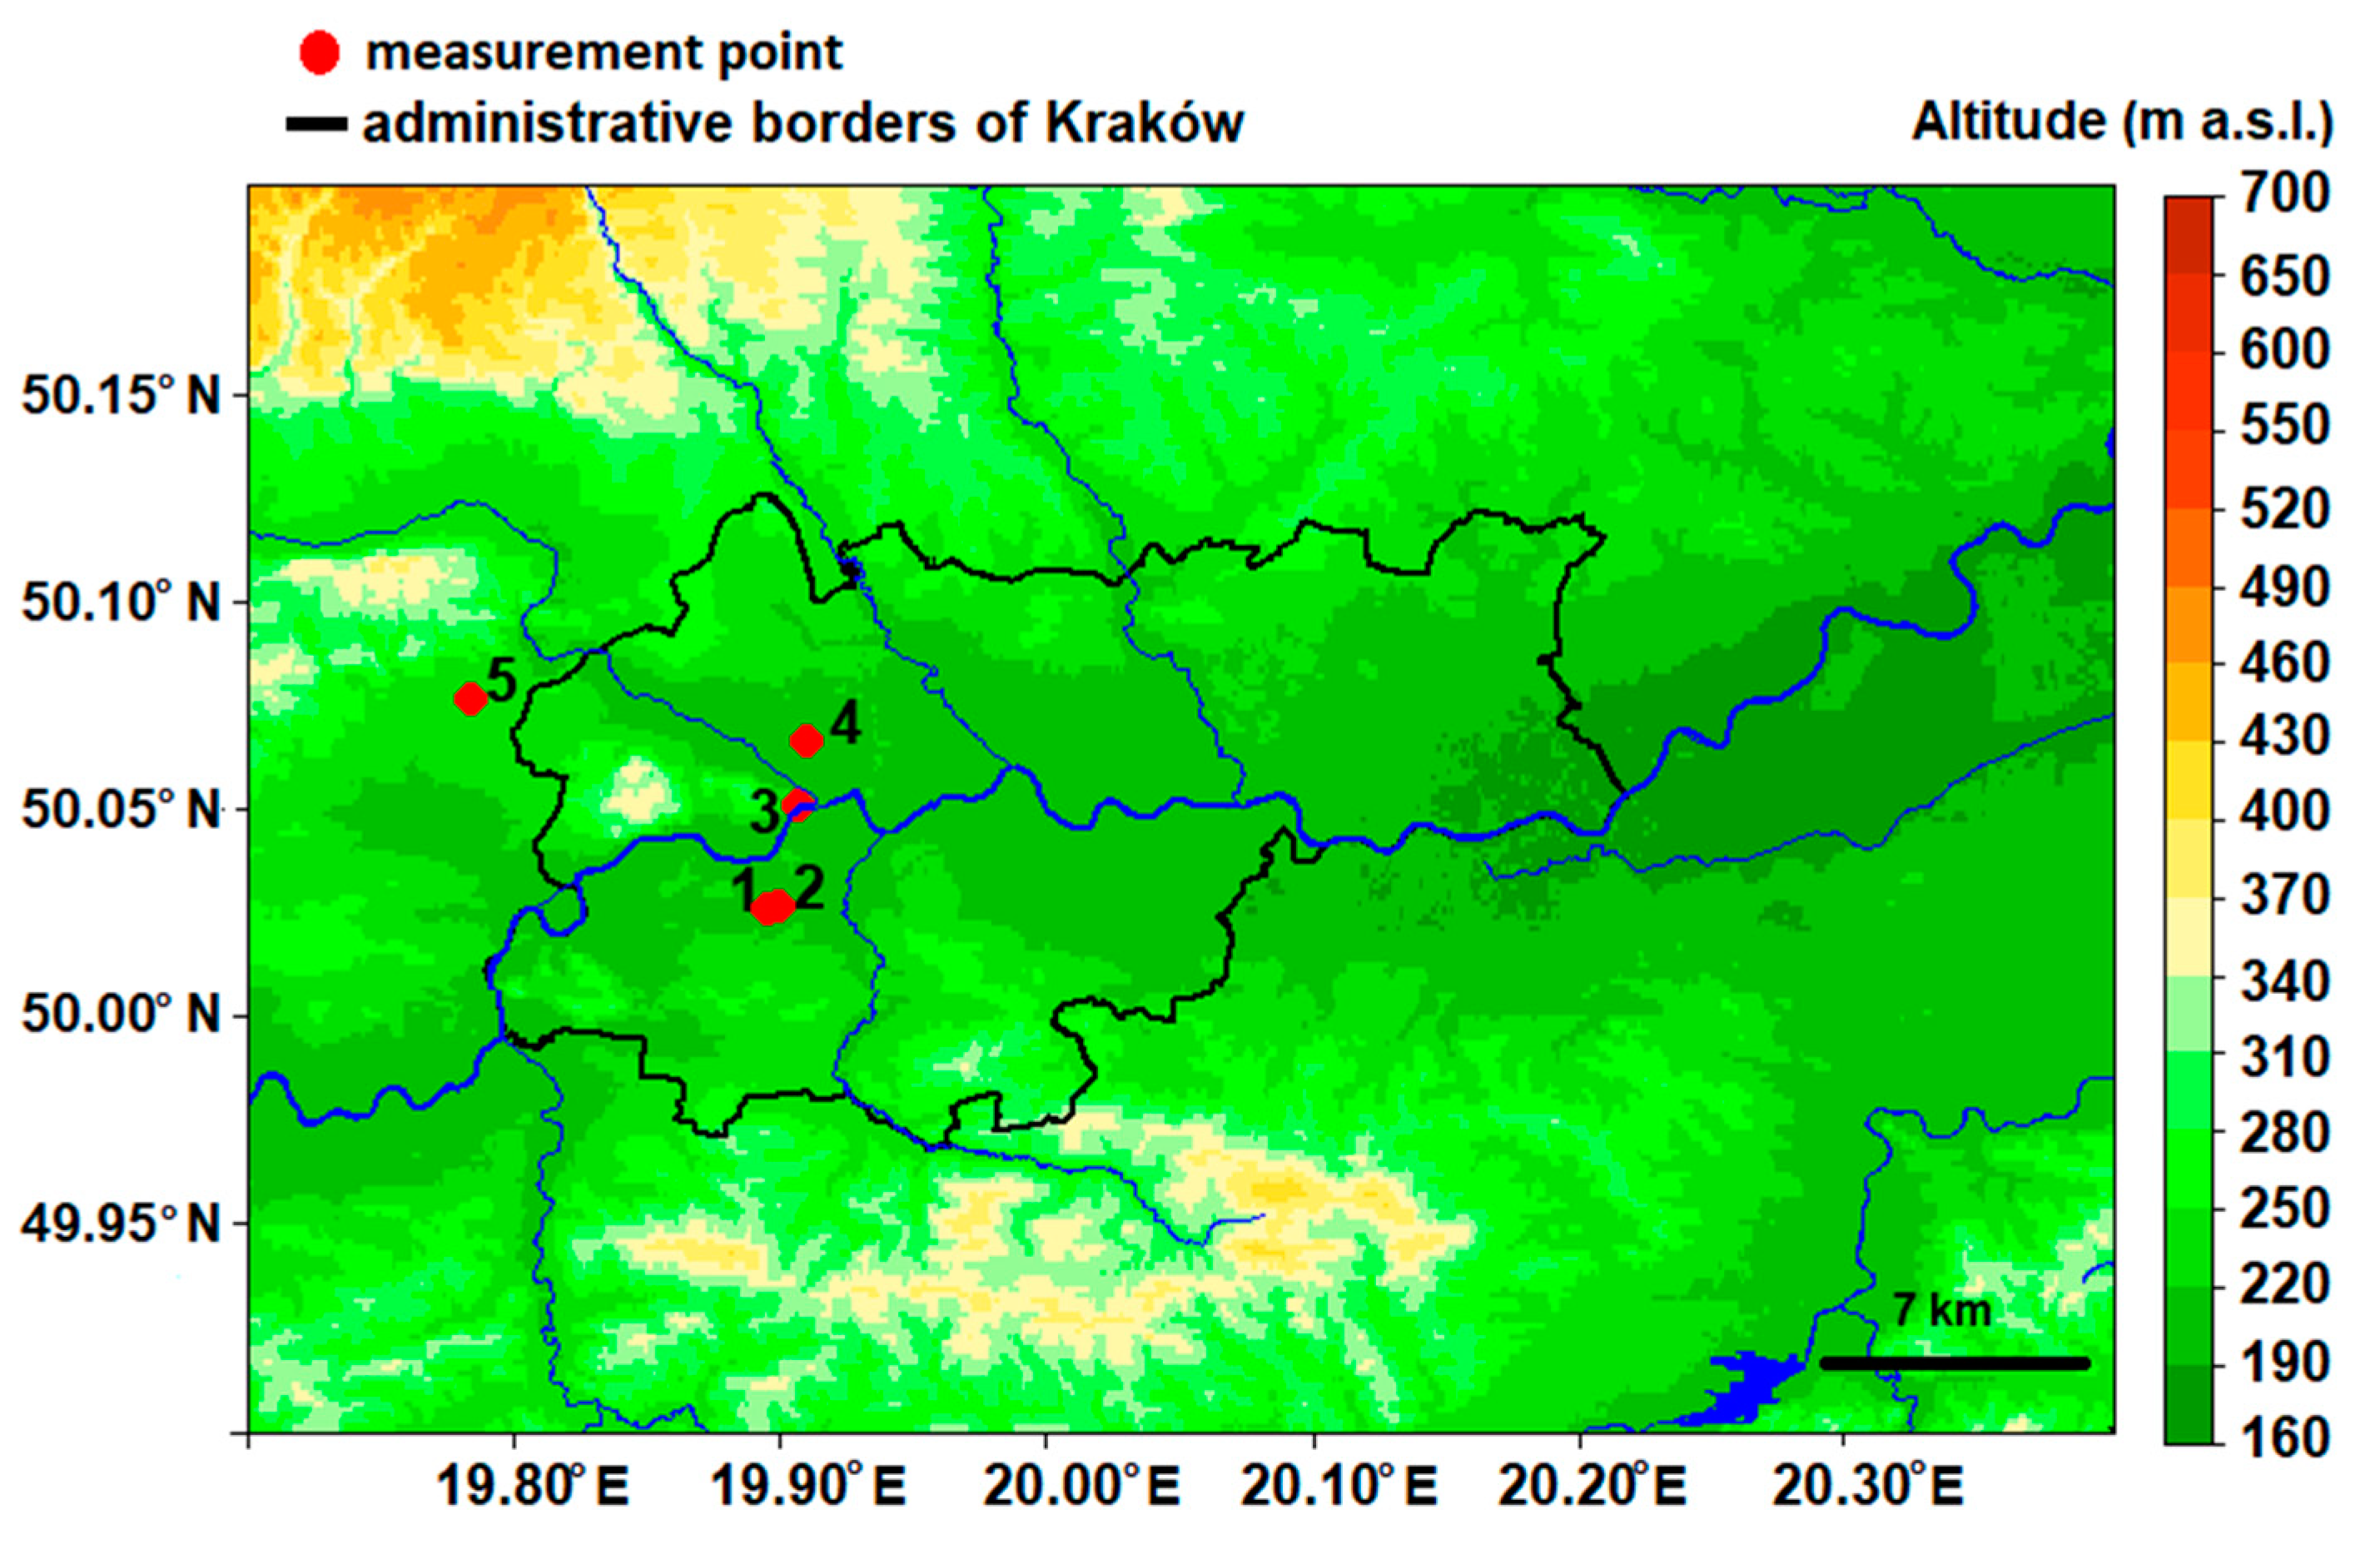
2.6. Study Area
2.7. Measurement Periods
- 18 September 2018 from 15:00 UTC to 21:00 UTC, i.e., afternoon hours;
- 21 September 2018 from 4:00 UTC to 9:30 UTC, i.e., morning hours.
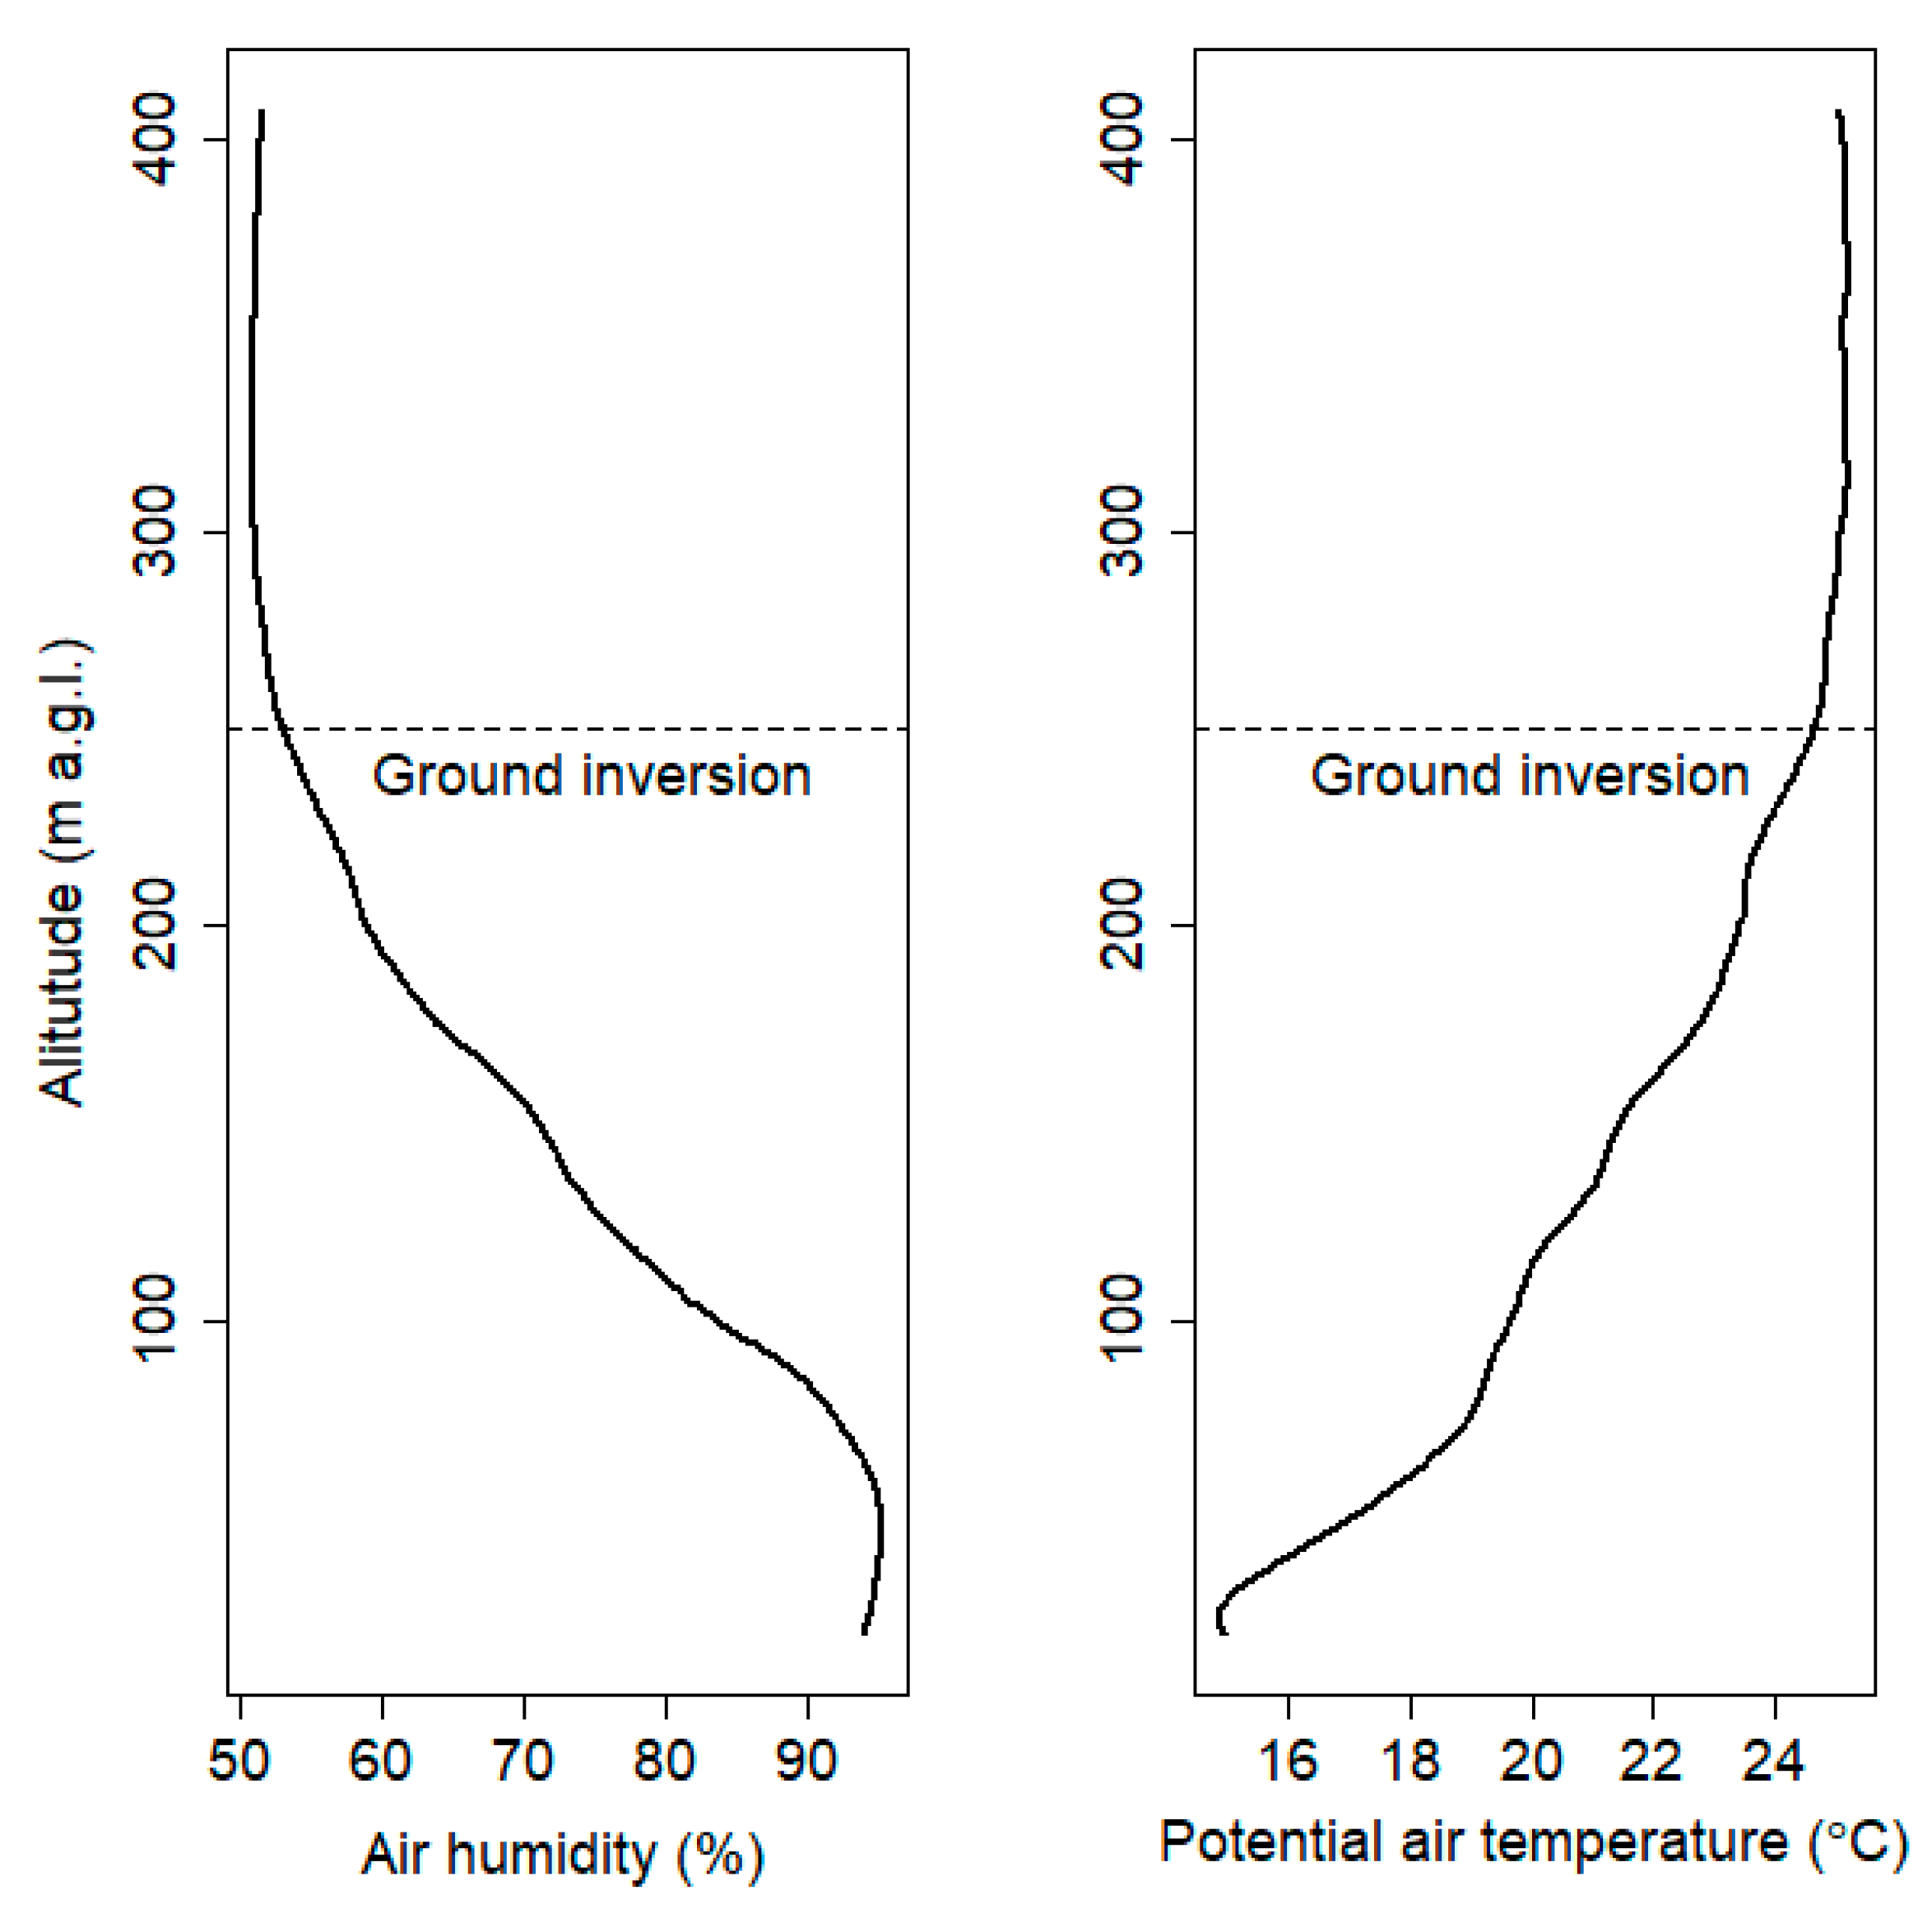
2.8. Vertical Profile Measurements
3. Results
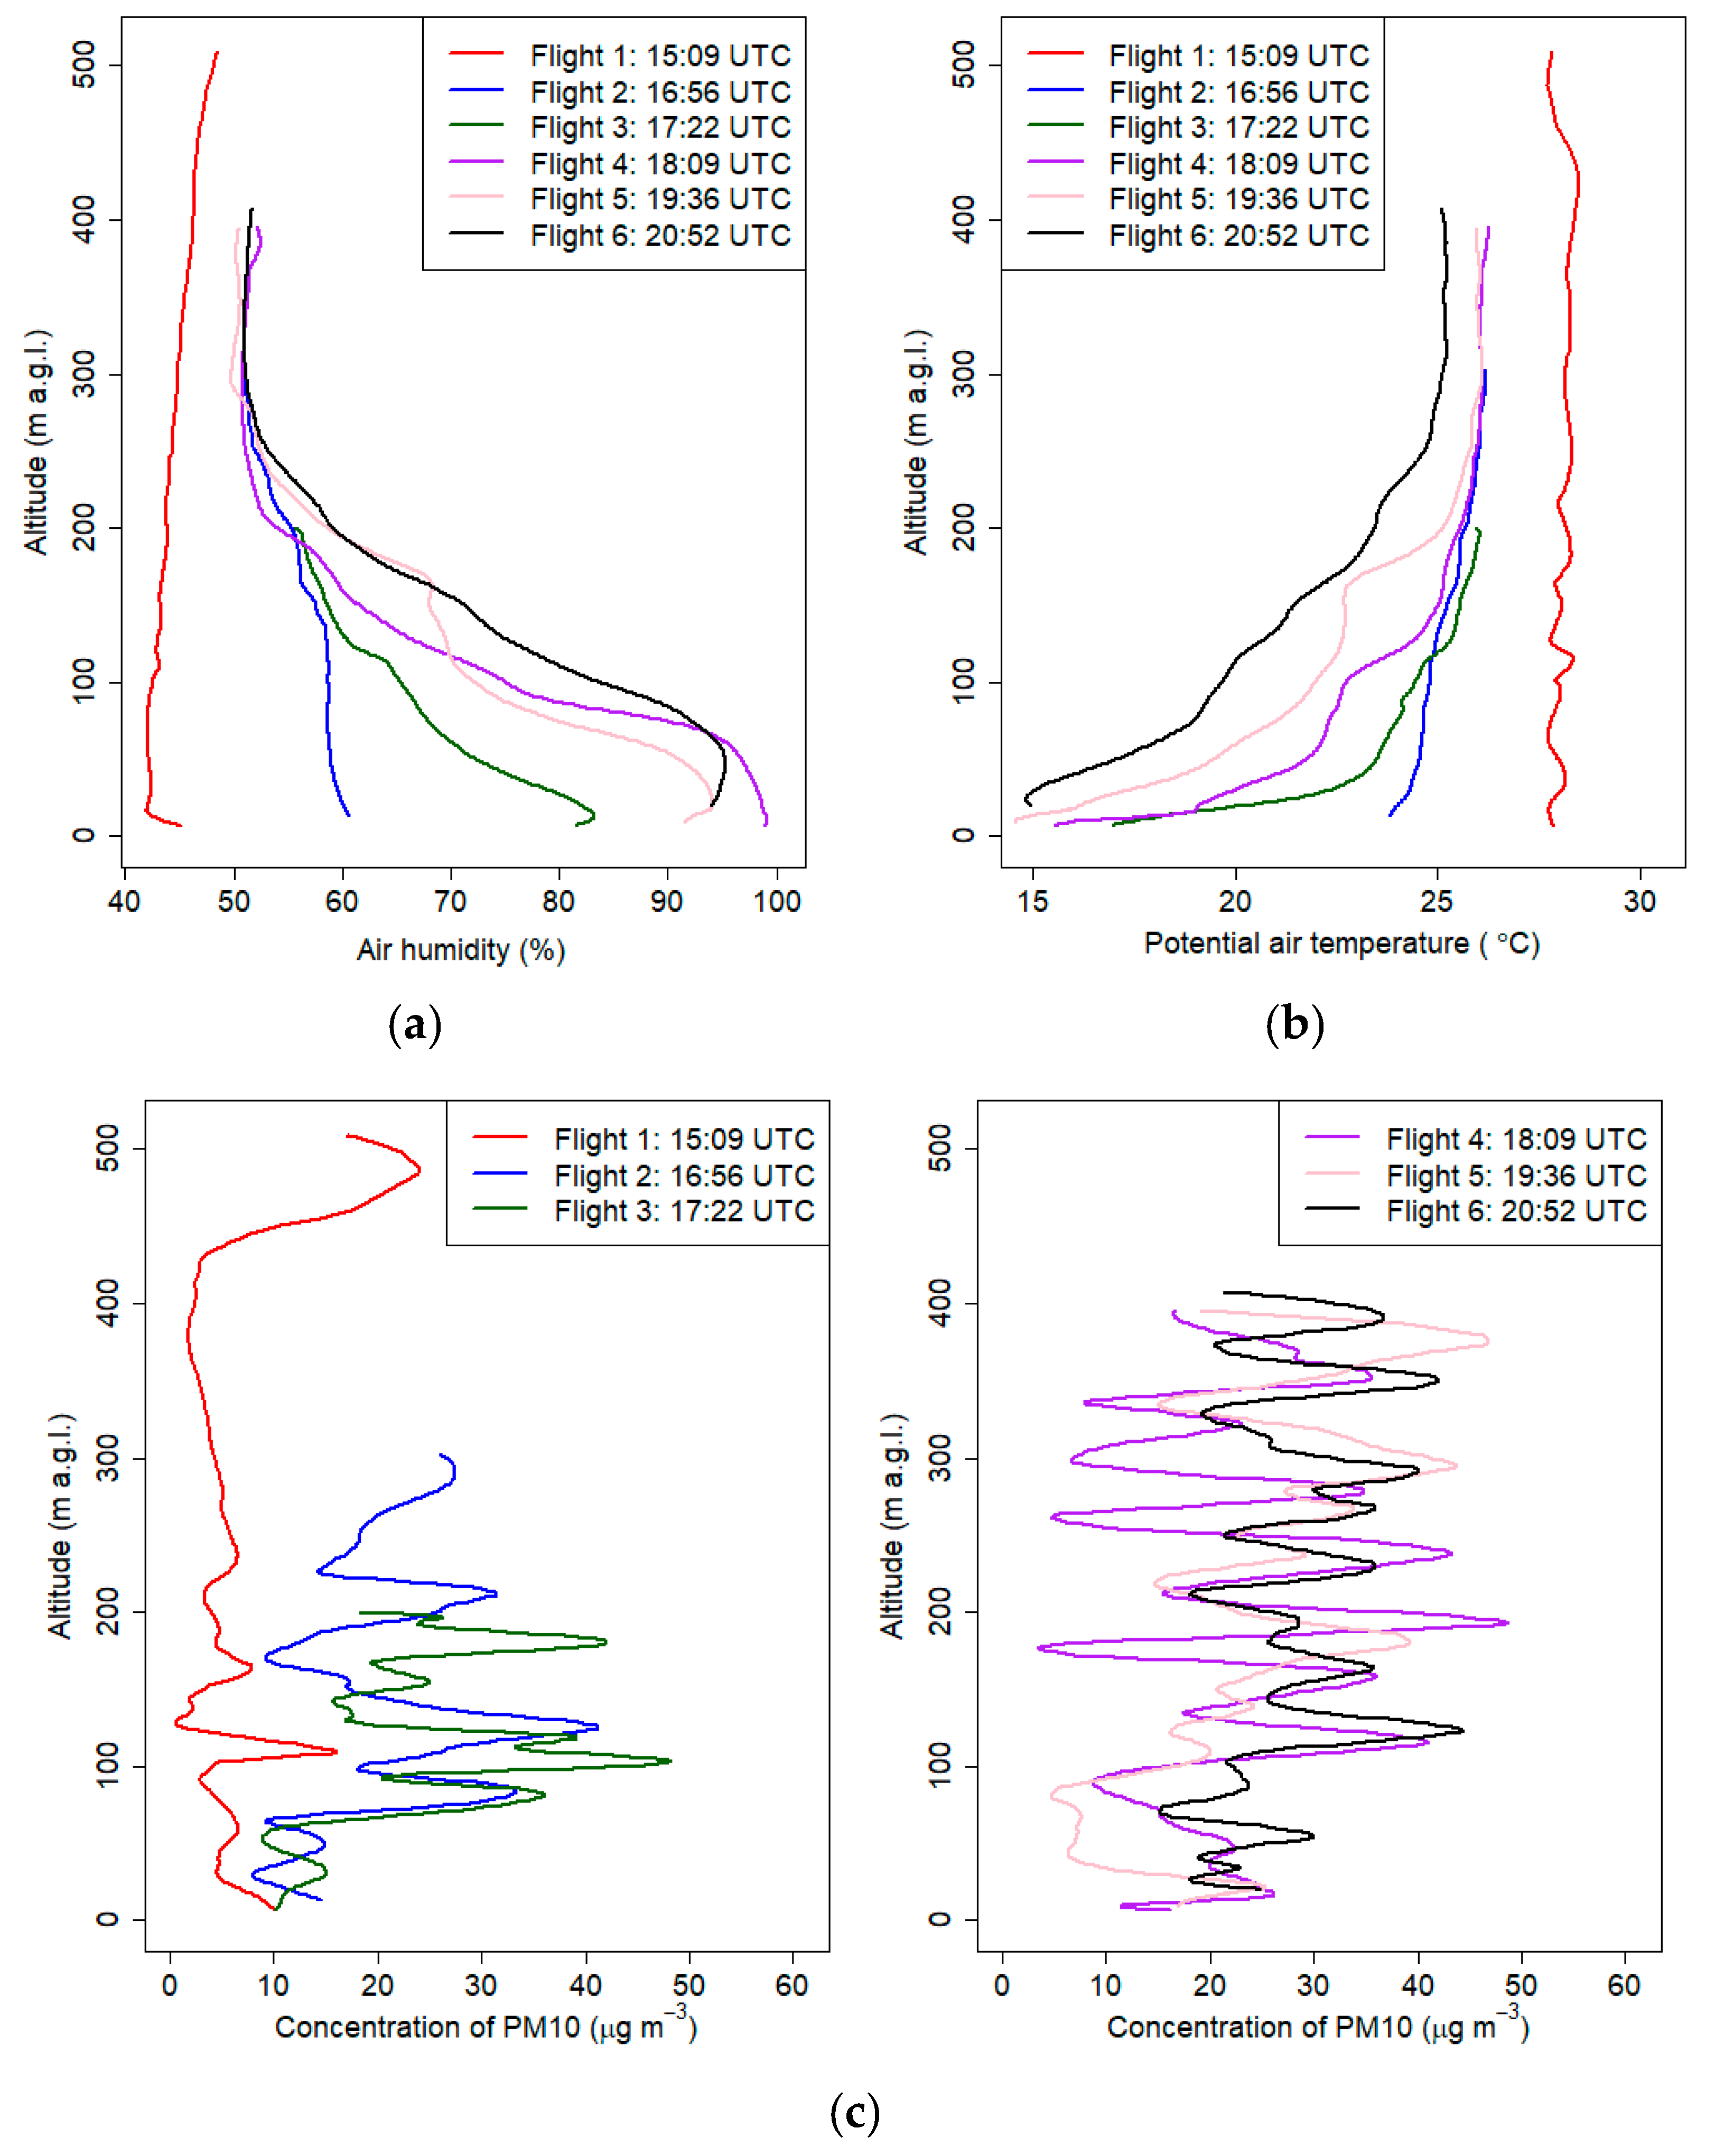
3.1. 18 September 2018—Evening Campaign
3.2. 21 September 2018—Morning Campaign
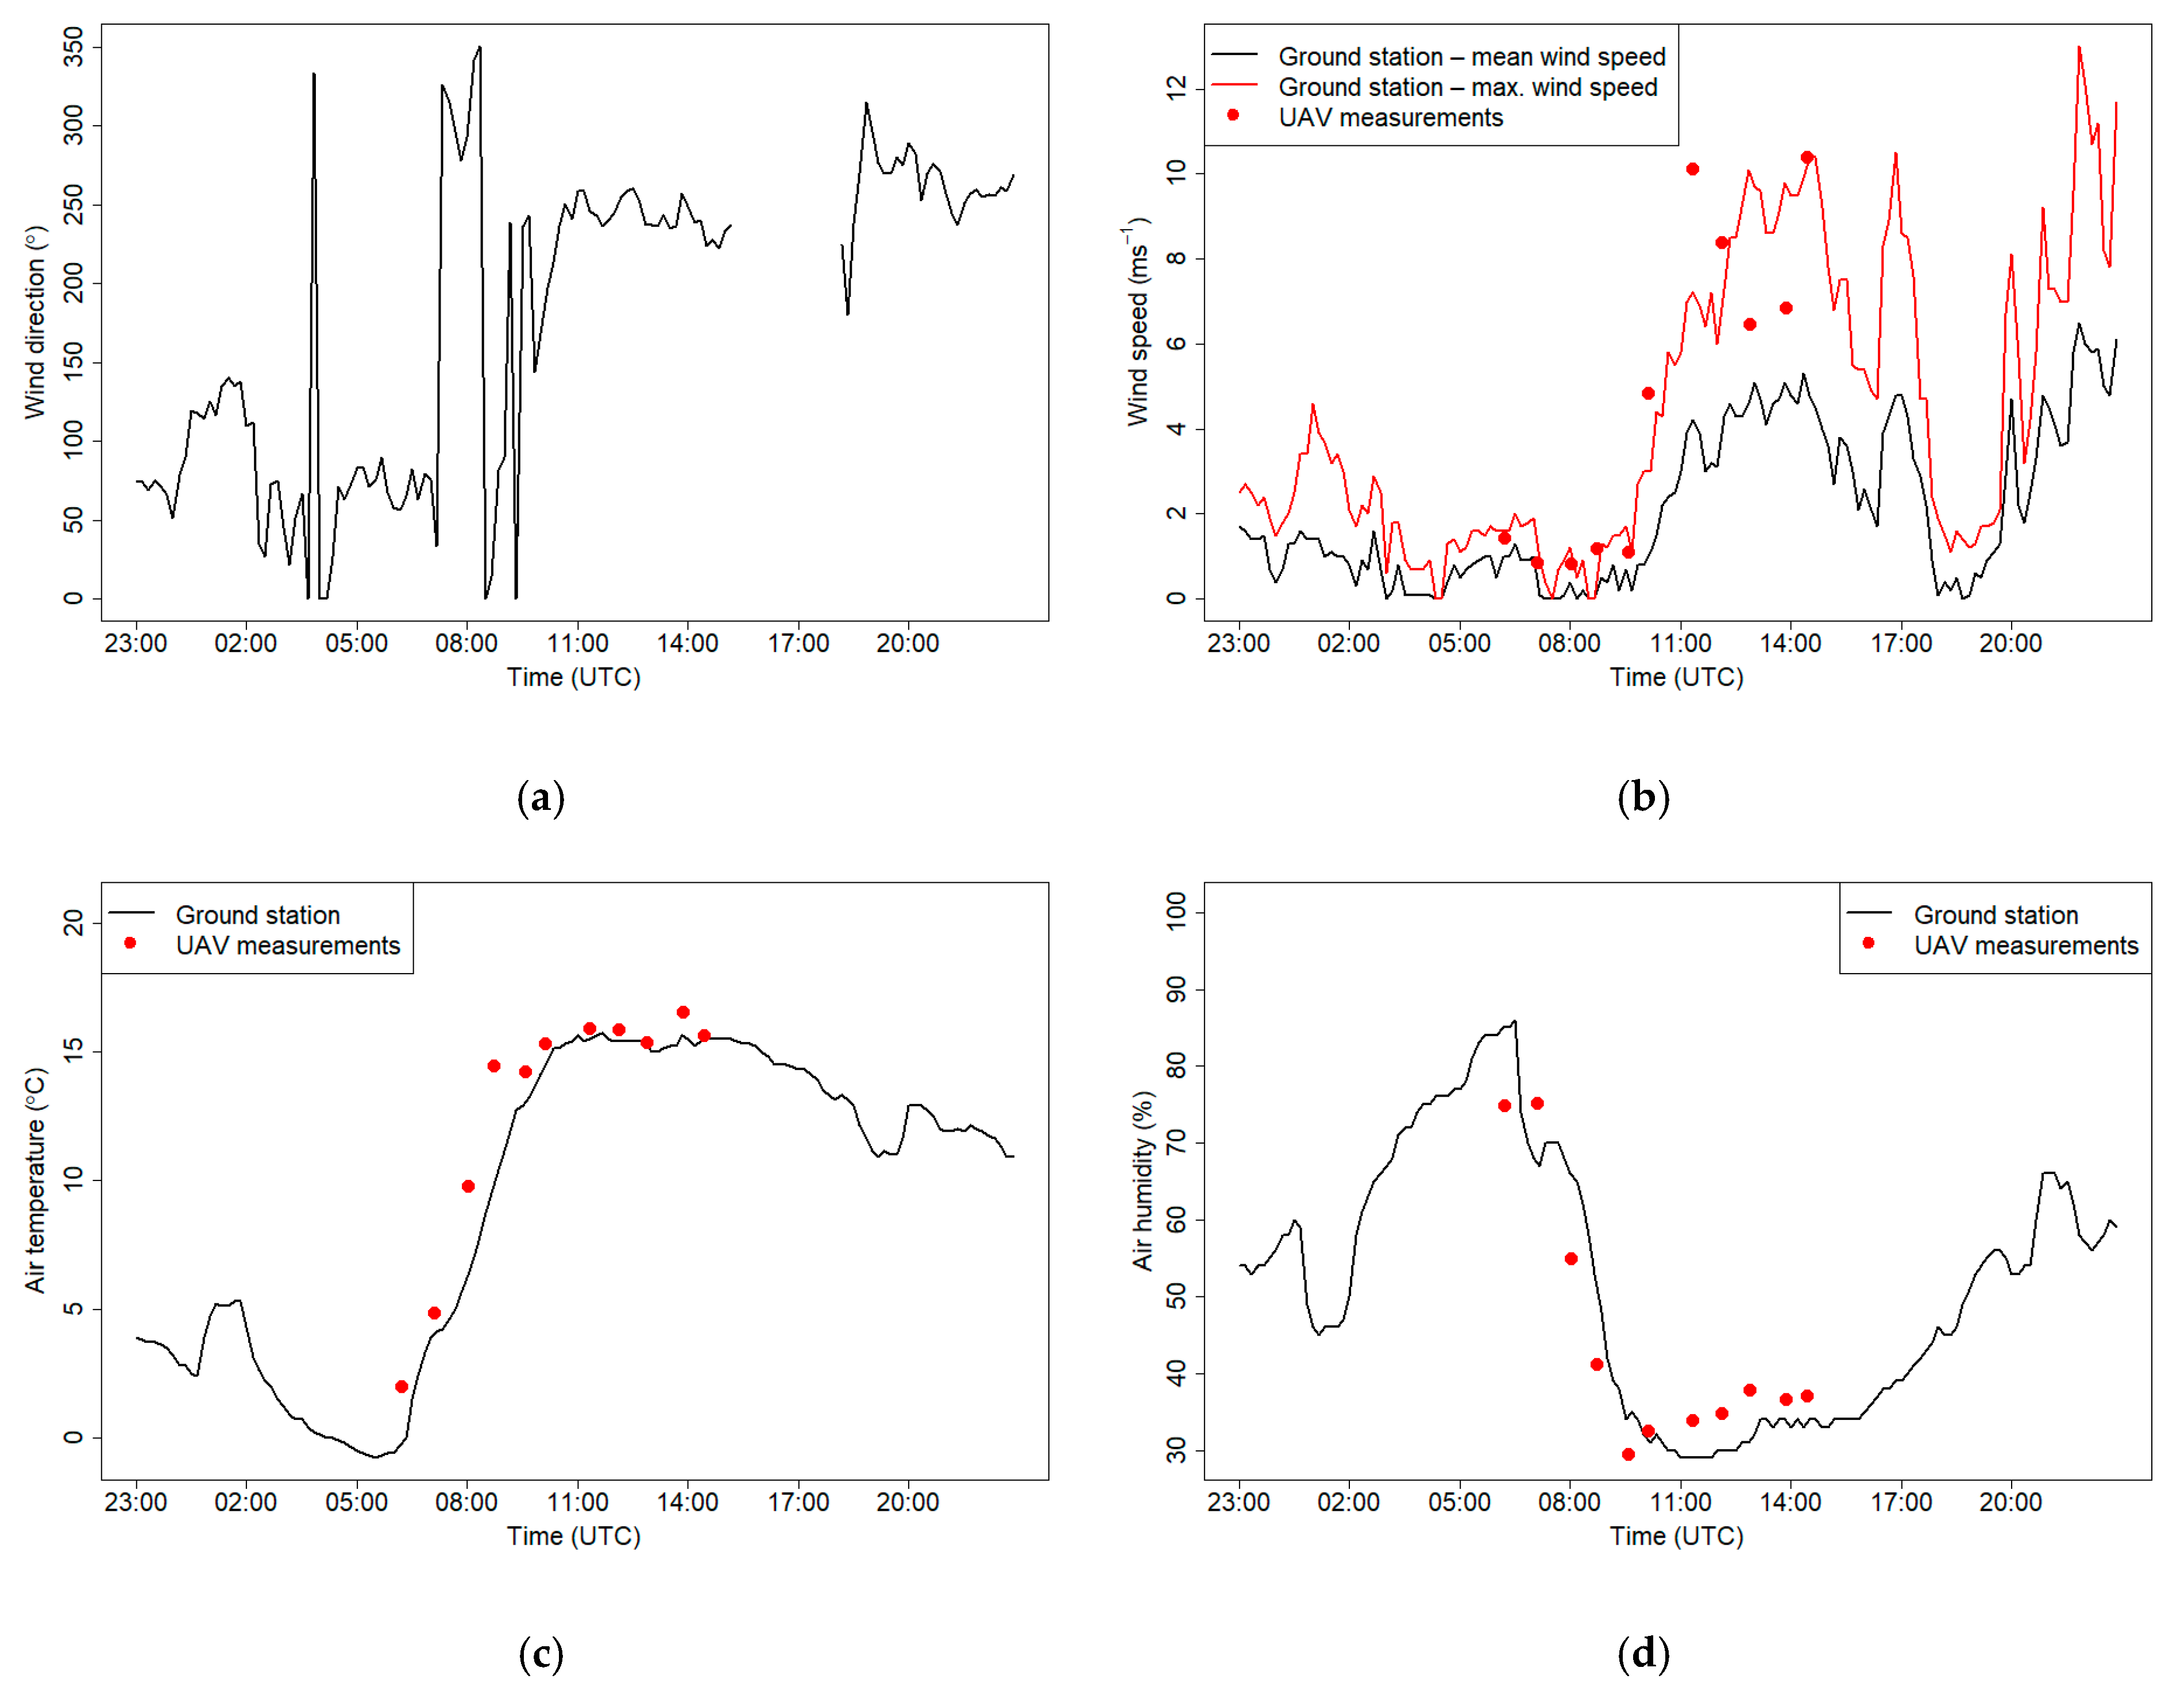
3.3. 7 March 2019—Whole-Day Campaign
4. Discussion
5. Conclusions
Author Contributions
Funding
Institutional Review Board Statement
Informed Consent Statement
Data Availability Statement
Conflicts of Interest
Appendix A
| Humidity Sensor—BOSH | ||||||
|---|---|---|---|---|---|---|
| Order number | Humidity amplitude (%) | Time before correction | The rate of change before correction (%/s.) | Humidity amplitude (%) | Time after correction | The rate of change after correction (%/s.) |
| Cooling | ||||||
| 1 | 22 | 440 | 0.050 | 28 | 150 | 0.187 |
| 2 | 15 | 250 | 0.060 | 20 | 100 | 0.200 |
| Mean value | 19 | 345 | 0.055 | 24 | 125 | 0.193 |
| Heating | ||||||
| 1 | 17 | 500 | 0.034 | 25 | 150 | 0.167 |
| 2 | 17 | 430 | 0.040 | 23 | 140 | 0.164 |
| Mean value | 17 | 465 | 0.037 | 24 | 145 | 0.165 |
| Temperature sensor—thermocouple | ||||||
| Order number | Temperature amplitude before correction (°C) | Time (s) | The rate of change (°C/s.) | Temperature amplitude after correction (°C) | Time after correction | The rate of change after correction (°C/s.) |
| Cooling | ||||||
| 1 | 6.3 | 102 | 0.062 | 5.8 | 90 | 0.064 |
| 2 | 5.5 | 100 | 0.055 | 5.5 | 80 | 0.069 |
| Mean value | 5.9 | 101 | 0.058 | 5.7 | 85 | 0.067 |
| Heating | ||||||
| 1 | 7 | 120 | 0.058 | 6.6 | 110 | 0.060 |
| 2 | 6.1 | 160 | 0.038 | 5.9 | 110 | 0.054 |
| Mean value | 6.55 | 140 | 0.048 | 6.3 | 110 | 0.057 |
| Temperature sensor—BOSH | ||||||
| Cooling | ||||||
| 1 | 7.1 | 409 | 0.017 | 7.6 | 280 | 0.027 |
| 2 | 5.5 | 320 | 0.017 | 6.2 | 140 | 0.044 |
| Mean value | 6.3 | 364.5 | 0.017 | 6.9 | 210 | 0.036 |
| Heating | ||||||
| 1 | 5.9 | 440 | 0.013 | 6.2 | 390 | 0.016 |
| 2 | 5.7 | 450 | 0.013 | 5.9 | 400 | 0.015 |
| Mean value | 5.8 | 445 | 0.013 | 6.1 | 395 | 0.015 |
| Potential temperature | |||||
| Flight order number | Min. temp. (°C) (height a.g.l.) | Max. temp. (°C) (height a.g.l.) | Depth of lowest layer (m) | Potential temperature gradient in lowest layer (°C/100 m) | Stability of atmosphere |
| 1 | 25 (499) | 28 (7) | >500 | −0.4 | Neutral |
| 2 | 24 (16) | 26 (300) | >300 | 0.8 | Neutral |
| 3 | 20 (9) | 26 (200) | 130 | 4.6 | Inversion |
| 4 | 17 (10) | 26 (392) | 150 | 7.2 | Inversion |
| 5 | 15 (10) | 26 (386) | 200 | 4.6 | Inversion |
| 6 | 15 (21) | 25 (404) | 250 | 3.4 | Inversion |
| Air humidity | |||||
| Flight order number | Min. humidity (%) (height a.g.l.) | Max. humidity (%) (height a.g.l.) | Depth of lowest layer (m) | Relative humidity gradient in lowest layer (%/100 m) | Stability of atmosphere |
| 1 | 50 (499) | 41 (7) | >500 | 1 | Neutral |
| 2 | 60 (16) | 50 (300) | >300 | −4 | Neutral |
| 3 | 87 (9) | 54 (199) | 120 | −30 | Inversion |
| 4 | 100 (10) | 53 (391) | 200 | −26 | Inversion |
| 5 | 96 (10) | 49 (386) | 200 | −22 | Inversion |
| 6 | 96 (21) | 51 (404) | 250 | −18 | Inversion |
| Potential Temperature | |||||
| Flight order number | Min. temp. (°C) (height a.g.l.) | Max. temp. (°C) (height a.g.l.) | Depth of lowest layer (m) | Potential temperature gradient in lowest layer (°C/100 m) | Stability of atmosphere |
| 1 | 6 (0) | 23 (293) | 230 | 7.4 | Inversion |
| 2 | 9 (4) | 21 (187) | 187 | 6.3 | Inversion |
| 3 | 15 (5) | 25 (290) | 90 | 1.9 | Inversion |
| 4 | 20 (4) | 25 (297) | 100 | 0.2 | Neutral |
| 5 | 24 (5) | 26 (294) | 220 | 0.7 | Neutral |
| 6 | 26 (3) | 27 (298) | >300 | 0.4 | Neutral |
| Air humidity | |||||
| Flight order number | Min. humidity (%) (height a.g.l.) | Max. humidity (%) (m a.g.l.) | Depth of lowest layer (m) | Relative humidity gradient in lowest layer (%/100 m) | Stability of atmosphere |
| 1 | 58 (293) | 98 (0) | 200 | −16.3 | Inversion |
| 2 | 62 (187) | 86 (4) | 187 | −8.9 | Inversion |
| 3 | 48 (290) | 65 (5) | 290 | −3.9 | Inversion |
| 4 | 52 (297) | 55 (4) | 90 | 10 | Neutral |
| 5 | 47 (5) | 49 (294) | 210 | 3.6 | Neutral |
| 6 | 38 (3) | 46 (298) | >300 | 2.9 | Neutral |
| Potential Temperature | |||||
| Flight order number | Min. temp. (°C) (height a.g.l.) | Max. temp. (°C) (height a.g.l.) | Depth of lowest layer (m) | Potential temperature gradient in lowest layer (°C/100 m) | Stability of atmosphere |
| 1 | 6 (24) | 14 (389) | 150 | 5.0 | Inversion |
| 2 | 7 (2) | 14 (391) | 70 | 7.4 | Inversion |
| 3 | 11 (12) | 15 (386) | 100 | 2.9 | Inversion |
| 4 | 15 (285) | 18 (105) | 100 | 1.7 | Inversion |
| 5 | 16 (392) | 17 (17) | >400 | −0.3 | Neutral |
| 6 | 17 (355) | 18 (20) | >400 | −0.3 | Neutral |
| 7 | 17 (136) | 18 (89) | >400 | 0.0 | Neutral |
| 8 | 17 (331) | 17 (13) | >400 | −0.1 | Neutral |
| 9 | 17 (307) | 17 (12) | >400 | −0.1 | Neutral |
| 10 | 17 (456) | 18 (2) | >500 | −0.2 | Neutral |
| 11 | 17 (268) | 18 (488) | >500 | 0 | Neutral |
| Air humidity | |||||
| Flight order number | Min. humidity (%) (height a.g.l.) | Max. humidity (%) (m a.g.l.) | Depth of lowest layer (m) | Relative humidity gradient in lowest layer (%/100 m) | Stability of atmosphere |
| 1 | 47 (155) | 75 (11) | 100 | −28.8 | Inversion |
| 2 | 47 (82) | 73 (2) | 80 | −32.6 | Inversion |
| 3 | 48 (199) | 61 (12) | 60 | −14.1 | Inversion |
| 4 | 39 (133) | 46 (381) | 100 | −5.0 | Inversion |
| 5 | 34 (2) | 47 (372) | >400 | 3.0 | Neutral |
| 6 | 32 (34) | 43 (386) | >400 | 1.8 | Neutral |
| 7 | 35 (2) | 42 (381) | >400 | 1.6 | Neutral |
| 8 | 37 (9) | 43 (347) | >400 | 1.3 | Neutral |
| 9 | 38 (10) | 46 (390) | >400 | 2.0 | Neutral |
| 10 | 40 (2) | 53 (464) | >500 | 2.3 | Neutral |
| 11 | 39 (12) | 48 (448) | >500 | 1.4 | Neutral |
References
- Air Quality in Europe-2019; European Environment Agency: København, Denmark, 2019.
- Biswas, P.; Wu, C.Y. 2005 Critical Review: Nanoparticles and the environment. J. Air Waste Manag. Assoc. 2005, 55, 708–746. [Google Scholar] [CrossRef]
- Karlsson, H.L.; Gustafsson, J.; Cronholm, P.; Moller, L. Size-dependent toxicity of metal oxide particles-A comparison between nano- and micrometer size. Toxicol. Lett. 2009, 188, 112–118. [Google Scholar] [CrossRef] [PubMed]
- Guo, S.; Hu, M.; Zamora, M.L.; Peng, J.F.; Shang, D.J.; Zheng, J.; Du, Z.F.; Wu, Z.; Shao, M.; Zeng, L.M.; et al. Elucidating severe urban haze formation in China. Proc. Natl. Acad. Sci. USA 2014, 111, 17373–17378. [Google Scholar] [CrossRef] [PubMed]
- Renard, J.B.; Michoud, V.; Giacomoni, J. Vertical Profiles of Pollution Particle Concentrations in the Boundary Layer above Paris (France) from the Optical Aerosol Counter LOAC Onboard a Touristic Balloon. Sensors 2020, 20, 1111. [Google Scholar] [CrossRef]
- Wang, D.X.; Stachlewska, I.S.; Song, X.Q.; Heese, B.; Nemuc, A. Variability of the Boundary Layer over an Urban Continental Site Based on 10 Years of Active Remote Sensing Observations in Warsaw. Remote Sens. 2020, 12, 33. [Google Scholar] [CrossRef]
- Baron, A.; Chazette, P.; Totems, J. Remote sensing of two exceptional winter aerosol pollution events and representativeness of ground-based measurements. Atmos. Chem. Phys. 2020, 20, 6749–6768. [Google Scholar] [CrossRef]
- Wood, C.R.; Jarvi, L.; Kouznetsov, R.D.; Nordbo, A.; Joffre, S.; Drebs, A.; Vihma, T.; Hirsikko, A.; Suomi, I.; Fortelius, C.; et al. An Overview of the Urban Boundary Layer Atmosphere Network in Helsinki. Bull. Am. Meteorol. Soc. 2013, 94, 1675–1690. [Google Scholar] [CrossRef][Green Version]
- Mahrt, L. Stably Stratified Atmospheric Boundary Layers. Annu. Rev. Fluid Mech. 2014, 46, 23–45. [Google Scholar] [CrossRef]
- Pardyjak, E.R.; Fernando, H.J.S.; Hunt, J.C.R.; Grachev, A.A.; Anderson, J. A case study of the development of nocturnal slope flows in a wide open valley and associated air quality implications. Meteorol. Z. 2009, 18, 85–100. [Google Scholar] [CrossRef]
- Li, X.; Xia, X.; Wang, L.; Cai, R.; Zhao, L.; Feng, Z.; Ren, Q.; Zhao, K. The role of foehn in the formation of heavy air pollution events in Urumqi, China. J. Geophys. Res. Atmos. 2015, 120, 5371–5384. [Google Scholar] [CrossRef]
- Wang, K.; Chen, F.E.; Au, W.; Zhao, Z.H.; Xia, Z.L. Evaluating the feasibility of a personal particle exposure monitor in outdoor and indoor microenvironments in Shanghai, China. Int. J. Environ. Health Res. 2019, 29, 209–220. [Google Scholar] [CrossRef] [PubMed]
- Mukherjee, A.; Stanton, L.G.; Graham, A.R.; Roberts, P.T. Assessing the Utility of Low-Cost Particulate Matter Sensors over a 12-Week Period in the Cuyama Valley of California. Sensors 2017, 17, 16. [Google Scholar] [CrossRef] [PubMed]
- Kelly, K.E.; Whitaker, J.; Petty, A.; Widmer, C.; Dybwad, A.; Sleeth, D.; Martin, R.; Butterfield, A. Ambient and laboratory evaluation of a low-cost particulate matter sensor. Environ. Pollut. 2017, 221, 491–500. [Google Scholar] [CrossRef]
- Zheng, T.S.; Bergin, M.H.; Johnson, K.K.; Tripathi, S.N.; Shirodkar, S.; Landis, M.S.; Sutaria, R.; Carlson, D.E. Field evaluation of low-cost particulate matter sensors in high-and low-concentration environments. Atmos. Meas. Tech. 2018, 11, 4823–4846. [Google Scholar] [CrossRef]
- Badura, M.; Batog, P.; Drzeniecka-Osiadacz, A.; Modzel, P. Optical particulate matter sensors in PM2.5 measurements in atmospheric air. In Proceedings of the 10th Conference on Interdisciplinary Problems in Environmental Protection and Engineering (EKO-DOK), Polanica Zdroj, Poland, 16–18 April 2018. [Google Scholar]
- Schnitzhofer, R.; Norman, M.; Wisthaler, A.; Vergeiner, J.; Harnisch, F.; Gohm, A.; Obleitner, F.; Fix, A.; Neininger, B.; Hansel, A. A multimethodological approach to study the spatial distribution of air pollution in an Alpine valley during wintertime. Atmos. Chem. Phys. 2009, 9, 3385–3396. [Google Scholar] [CrossRef]
- Chemel, C.; Burns, P. Pollutant Dispersion in a Developing Valley Cold-Air Pool. Bound. Layer Meteorol. 2015, 154, 391–408. [Google Scholar] [CrossRef]
- Mamali, D.; Marinou, E.; Sciare, J.; Pikridas, M.; Kokkalis, P.; Kottas, M.; Binietoglou, I.; Tsekeri, A.; Keleshis, C.; Engelmann, R.; et al. Vertical profiles of aerosol mass concentration derived by unmanned airborne in situ and remote sensing instruments during dust events. Atmos. Meas. Tech. 2018, 11, 2897–2910. [Google Scholar] [CrossRef]
- Chilinski, M.T.; Markowicz, K.M.; Kubicki, M. UAS as a Support for Atmospheric Aerosols Research: Case Study. Pure Appl. Geophys. 2018, 175, 3325–3342. [Google Scholar] [CrossRef]
- Kunz, M.; Lavric, J.V.; Gerbig, C.; Tans, P.; Neff, D.; Hummelgard, C.; Martin, H.; Rodjegard, H.; Wrenger, B.; Heimann, M. COCAP: A carbon dioxide analyser for small unmanned aircraft systems. Atmos. Meas. Tech. 2018, 11, 1833–1849. [Google Scholar] [CrossRef]
- Guimaraes, P.; Ye, J.; Batista, C.; Barbosa, R.; Ribeiro, I.; Medeiros, A.; Souza, R.; Martin, S.T. Vertical Profiles of Ozone Concentration Collected by an Unmanned Aerial Vehicle and the Mixing of the Nighttime Boundary Layer over an Amazonian Urban Area. Atmosphere 2019, 10, 599. [Google Scholar] [CrossRef]
- Brady, J.M.; Stokes, M.D.; Bonnardel, J.; Bertram, T.H. Characterization of a Quadrotor Unmanned Aircraft System for Aerosol-Particle-Concentration Measurements. Environ. Sci. Technol. 2016, 50, 1376–1383. [Google Scholar] [CrossRef] [PubMed]
- Villa, T.F.; Jayaratne, E.R.; Gonzalez, L.F.; Morawska, L. Determination of the vertical profile of particle number concentration adjacent to a motorway using an unmanned aerial vehicle. Environ. Pollut. 2017, 230, 134–142. [Google Scholar] [CrossRef]
- Masic, A.; Pikula, B.; Bibic, D. Mobile Measurements of Particulate Matter Concentrations in Urban Area. In Proceedings of the 28th DAAAM International Symposium, Zadar, Croatia, 8–11 November 2017; pp. 0452–0456. [Google Scholar] [CrossRef]
- Weber, K.; Heweling, G.; Fischer, C.; Lange, M. The use of an octocopter UAV for the determination of air pollutants—a case study of the traffic induced pollution plume around a river bridge in Duesseldorf, Germany. Int. J. Educ. Learn. Syst. 2017, 2, 63–66. [Google Scholar]
- Babaan, J.B.; Ballori, J.P.; Tamondong, A.M.; Ramos, R.V.; Ostrea, P.M. Estimation of PM 2.5 vertical distribution using customized UAV and mobile sensors in brgy. up campus, diliman, quezon city. In Proceedings of the International Conference Geomatic & Geospatial Technology (Ggt 2018): Geospatial and Disaster Risk Management, Kuala Lumpur, Malaysia, 3–5 September 2018; Volume 42–44, pp. 89–103. [Google Scholar] [CrossRef]
- Morawska-Horaska, M. Struktura termiczna dolnej części troposfery i jej wpływ na zanieczyszczenie powietrza w Krakowie. Człowiek Sr. 1978, 2, 61–85. [Google Scholar]
- Godłowska, J. Wpływ warunków meteorologicznych na jakość powietrza w krakowie. In Badania Porównawcze i Próba Podejścia Modelowego; Institute of Meteorology and Water Management: Warsaw, Poland, 2019. [Google Scholar]
- Jacob, J.D.; Chilson, P.B.; Houston, A.L.; Smith, S.W. Considerations for Atmospheric Measurements with Small Unmanned Aircraft Systems. Atmosphere 2018, 9, 16. [Google Scholar] [CrossRef]
- Nolan, P.J.; Pinto, J.; Gonzalez-Rocha, J.; Jensen, A.; Vezzi, C.N.; Bailey, S.C.C.; de Boer, G.; Diehl, C.; Laurence, R.; Powers, C.W.; et al. Coordinated Unmanned Aircraft System (UAS) and Ground-Based Weather Measurements to Predict Lagrangian Coherent Structures (LCSs). Sensors 2018, 18, 4448. [Google Scholar] [CrossRef]
- Liu, C.; Huang, J.P.; Wang, Y.W.; Tao, X.Y.; Hu, C.; Deng, L.C.; Xu, J.P.; Xiao, H.W.; Luo, L.; Xiao, H.Y.; et al. Vertical distribution of PM2.5 and interactions with the atmospheric boundary layer during the development stage of a heavy haze pollution event. Sci. Total Environ. 2020, 704, 12. [Google Scholar] [CrossRef] [PubMed]
- Local Regression. Available online: https://en.wikipedia.org/wiki/Local_regression (accessed on 15 November 2020).
- John, F.; Sanford, W. Nonparametric Regression in R. In An Appendix to: An R Companion to Applied Regression, 3rd ed.; Sage Publications: Thousand Oaks, CA, USA, 2018. [Google Scholar]
- Joachim, R.; Pascal, B.; Muller, J.M.; Stephanie, M. The Small Unmanned Meteorological Observer SUMO: A new tool for atmospheric boundary layer research. Meteorol. Z. 2009, 18, 141–147. [Google Scholar] [CrossRef]
- Kunz, M.; Lavric, J.V.; Gasche, R.; Gerbig, C.; Grant, R.H.; Koch, F.T.; Schumacher, M.; Wolf, B.; Zeeman, M. Surface flux estimates derived from UAS-based mole fraction measurements by means of a nocturnal boundary layer budget approach. Atmos. Meas. Tech. 2020, 13, 1671–1692. [Google Scholar] [CrossRef]
- Miloshevich, L.M.; Paukkunen, A.; Vömel, H.; Oltmans, S.J. Development and Validation of a Time-Lag Correction for Vaisala Radiosonde Humidity Measurements. J. Atmos. Ocean. Technol. 2004, 21, 1305–1327. [Google Scholar] [CrossRef]
- Achberger, C.; Barring, L. Correction of surface air temperature measurements from a mobile platform. Agric. For. Meteorol. 1999, 98–99, 227–238. [Google Scholar] [CrossRef]
- Jonassen, M. The Small Unmanned Meteorological Observer (SUMO): Characterization and Test of a New Measurement System for Atmospheric Boundary Layer Research; University of Bergen: Bergen, Norway, 2008. [Google Scholar]
- Savitzky, A.; Golay, M.J. Smoothing and Differentiation of Data by Simplified Least Squares Procedures. Anal. Chem. 1964, 36, 1627–1639. [Google Scholar] [CrossRef]
- Bromba, M.U.; Ziegler, H. Application hints for Savitzky-Golay digital smoothing filters. Anal. Chem. 1981, 53, 1583–1586. [Google Scholar] [CrossRef]
- Bokwa, A. Miejska wyspa ciepła na tle naturalnego zróżnicowania termicznego obszaru położonego we wklęsłej formie terenu (na przykładzie Krakowa). Prace Geogr. 2009, 122, 111–132. [Google Scholar]
- Trzepacz, P.; Wiecław-Michniewska, J.; Brzosko-Sermak, A.; Kołosin, A. Miasto w Badaniach Geografów; Instytut Geografii i Gospodarki Przestrzennej Uniwersytetu Jagiellońskiego: Kraków, Poland, 2015; pp. 221–240. [Google Scholar]
- Bokwa, A. Wieloletnie Zmiany Struktury Mezoklimatu Miasta na Przykładzie Krakowa; Instytut Geografii i Gospodarki Przestrzennej Uniwersytetu Jagiellońskiego: Kraków, Poland, 2010. [Google Scholar]
- Arya, S.P. (Ed.) Introduction to Micrometeorology; International Geophysics; Academic Press: Cambridge, MA, USA, 2001; Volume 79, pp. 62–88. [Google Scholar]
- Banta, R.M.; Mahrt, L.; Vickers, D.; Sun, J.; Balsley, B.B.; Pichugina, Y.L.; Williams, E.L. The very stable boundary layer on nights with weak low-level jets. J. Atmos. Sci. 2007, 64, 3068–3090. [Google Scholar] [CrossRef]
- Oke, T.R. Boundary Layer Climates, 2nd ed.; Routledge: London, UK, 1987; p. 464. [Google Scholar]
- Platis, A.; Altstadter, B.; Wehner, B.; Wildmann, N.; Lampert, A.; Hermann, M.; Birmili, W.; Bange, J. An Observational Case Study on the Influence of Atmospheric Boundary-Layer Dynamics on New Particle Formation. Bound. Layer Meteorol. 2016, 158, 67–92. [Google Scholar] [CrossRef]
- Cetti, C.; Buzzi, B.; Sprenger, M. Climatology of Alpine North Foehn; MeteoSwiss: Zurich, Switzerland, 2015; p. 77.
- Drobinski, P.; Steinacker, R.; Richner, H.; Baumann-Stanzer, K.; Beffrey, G.; Benech, B.; Berger, H.; Chimani, B.; Dabas, A.; Dorninger, M.; et al. Fohn in the Rhine Valley during MAP: A review of its multiscale dynamics in complex valley geometry. Q. J. R. Meteorol. Soc. 2007, 133, 897–916. [Google Scholar] [CrossRef]
- Strbova, K.; Raclavska, H.; Bilek, J. Impact of fugitive sources and meteorological parameters on vertical distribution of particulate matter over the industrial agglomeration. J. Environ. Manag. 2017, 203, 1190–1198. [Google Scholar] [CrossRef]
- Xu, Y.W.; Zhu, B.; Shi, S.S.; Huang, Y. Two Inversion Layers and Their Impacts on PM2.5 Concentration over the Yangtze River Delta, China. J. Appl. Meteorol. Climatol. 2019, 58, 2349–2362. [Google Scholar] [CrossRef]
- Han, S.Q.; Hao, T.Y.; Zhang, Y.F.; Liu, J.L.; Li, P.Y.; Cai, Z.Y.; Zhang, M.; Wang, Q.L.; Zhang, H. Vertical observation and analysis on rapid formation and evolutionary mechanisms of a prolonged haze episode over central-eastern China. Sci. Total Environ. 2018, 616, 135–146. [Google Scholar] [CrossRef]
- Kishcha, P.; Starobinets, B.; Alpert, P. Modeling of Foehn-Induced Extreme Local Dust Pollution in the Dead Sea Valley. In Proceedings of the 35th International Technical Meeting on Air Pollution Modelling and its Application (ITM), Chania, Greece, 3–7 October 2016; pp. 433–437. [Google Scholar]
- Greene, B.R.; Segales, A.R.; Bell, T.M.; Pillar-Little, E.A.; Chilson, P.B. Environmental and Sensor Integration Influences on Temperature Measurements by Rotary-Wing Unmanned Aircraft Systems. Sensors 2019, 19, 1470. [Google Scholar] [CrossRef] [PubMed]
- McKinney, K.A.; Wang, D.; Ye, J.H.; de Fouchier, J.B.; Guimaraes, P.C.; Batista, C.E.; Souza, R.A.F.; Alves, E.G.; Gu, D.; Guenther, A.B.; et al. A sampler for atmospheric volatile organic compounds by copter unmanned aerial vehicles. Atmos. Meas. Tech. 2019, 12, 3123–3135. [Google Scholar] [CrossRef]
- Crazzolara, C.; Ebner, M.; Platis, A.; Miranda, T.; Bange, J.; Junginger, A. A new multicopter-based unmanned aerial system for pollen and spores collection in the atmospheric boundary layer. Atmos. Meas. Tech. 2019, 12, 1581–1598. [Google Scholar] [CrossRef]
- Lee, S.H.; Kwak, K.H. Assessing 3-D Spatial Extent of Near-Road Air Pollution around a Signalized Intersection Using Drone Monitoring and WRF-CFD Modeling. Int. J. Environ. Res. Public Health 2020, 17, 6915. [Google Scholar] [CrossRef] [PubMed]
- Leuenberger, D.; Haefele, A.; Omanovic, N.; Fengler, M.; Martucci, G.; Calpini, B.; Fuhrer, O.; Rossa, A. Improving High-Impact Numerical Weather Prediction with Lidar and Drone Observations. Bull. Am. Meteorol. Soc. 2020, 101, E1036–E1051. [Google Scholar] [CrossRef]
- Thielicke, W.; Hübert, W.; Müller, U.; Eggert, M.; Wilhelm, P. Towards accurate and practical drone-based wind measurements with an ultrasonic anemometer. Atmos. Meas. Tech. Discuss. 2020, 2020, 1–29. [Google Scholar] [CrossRef]
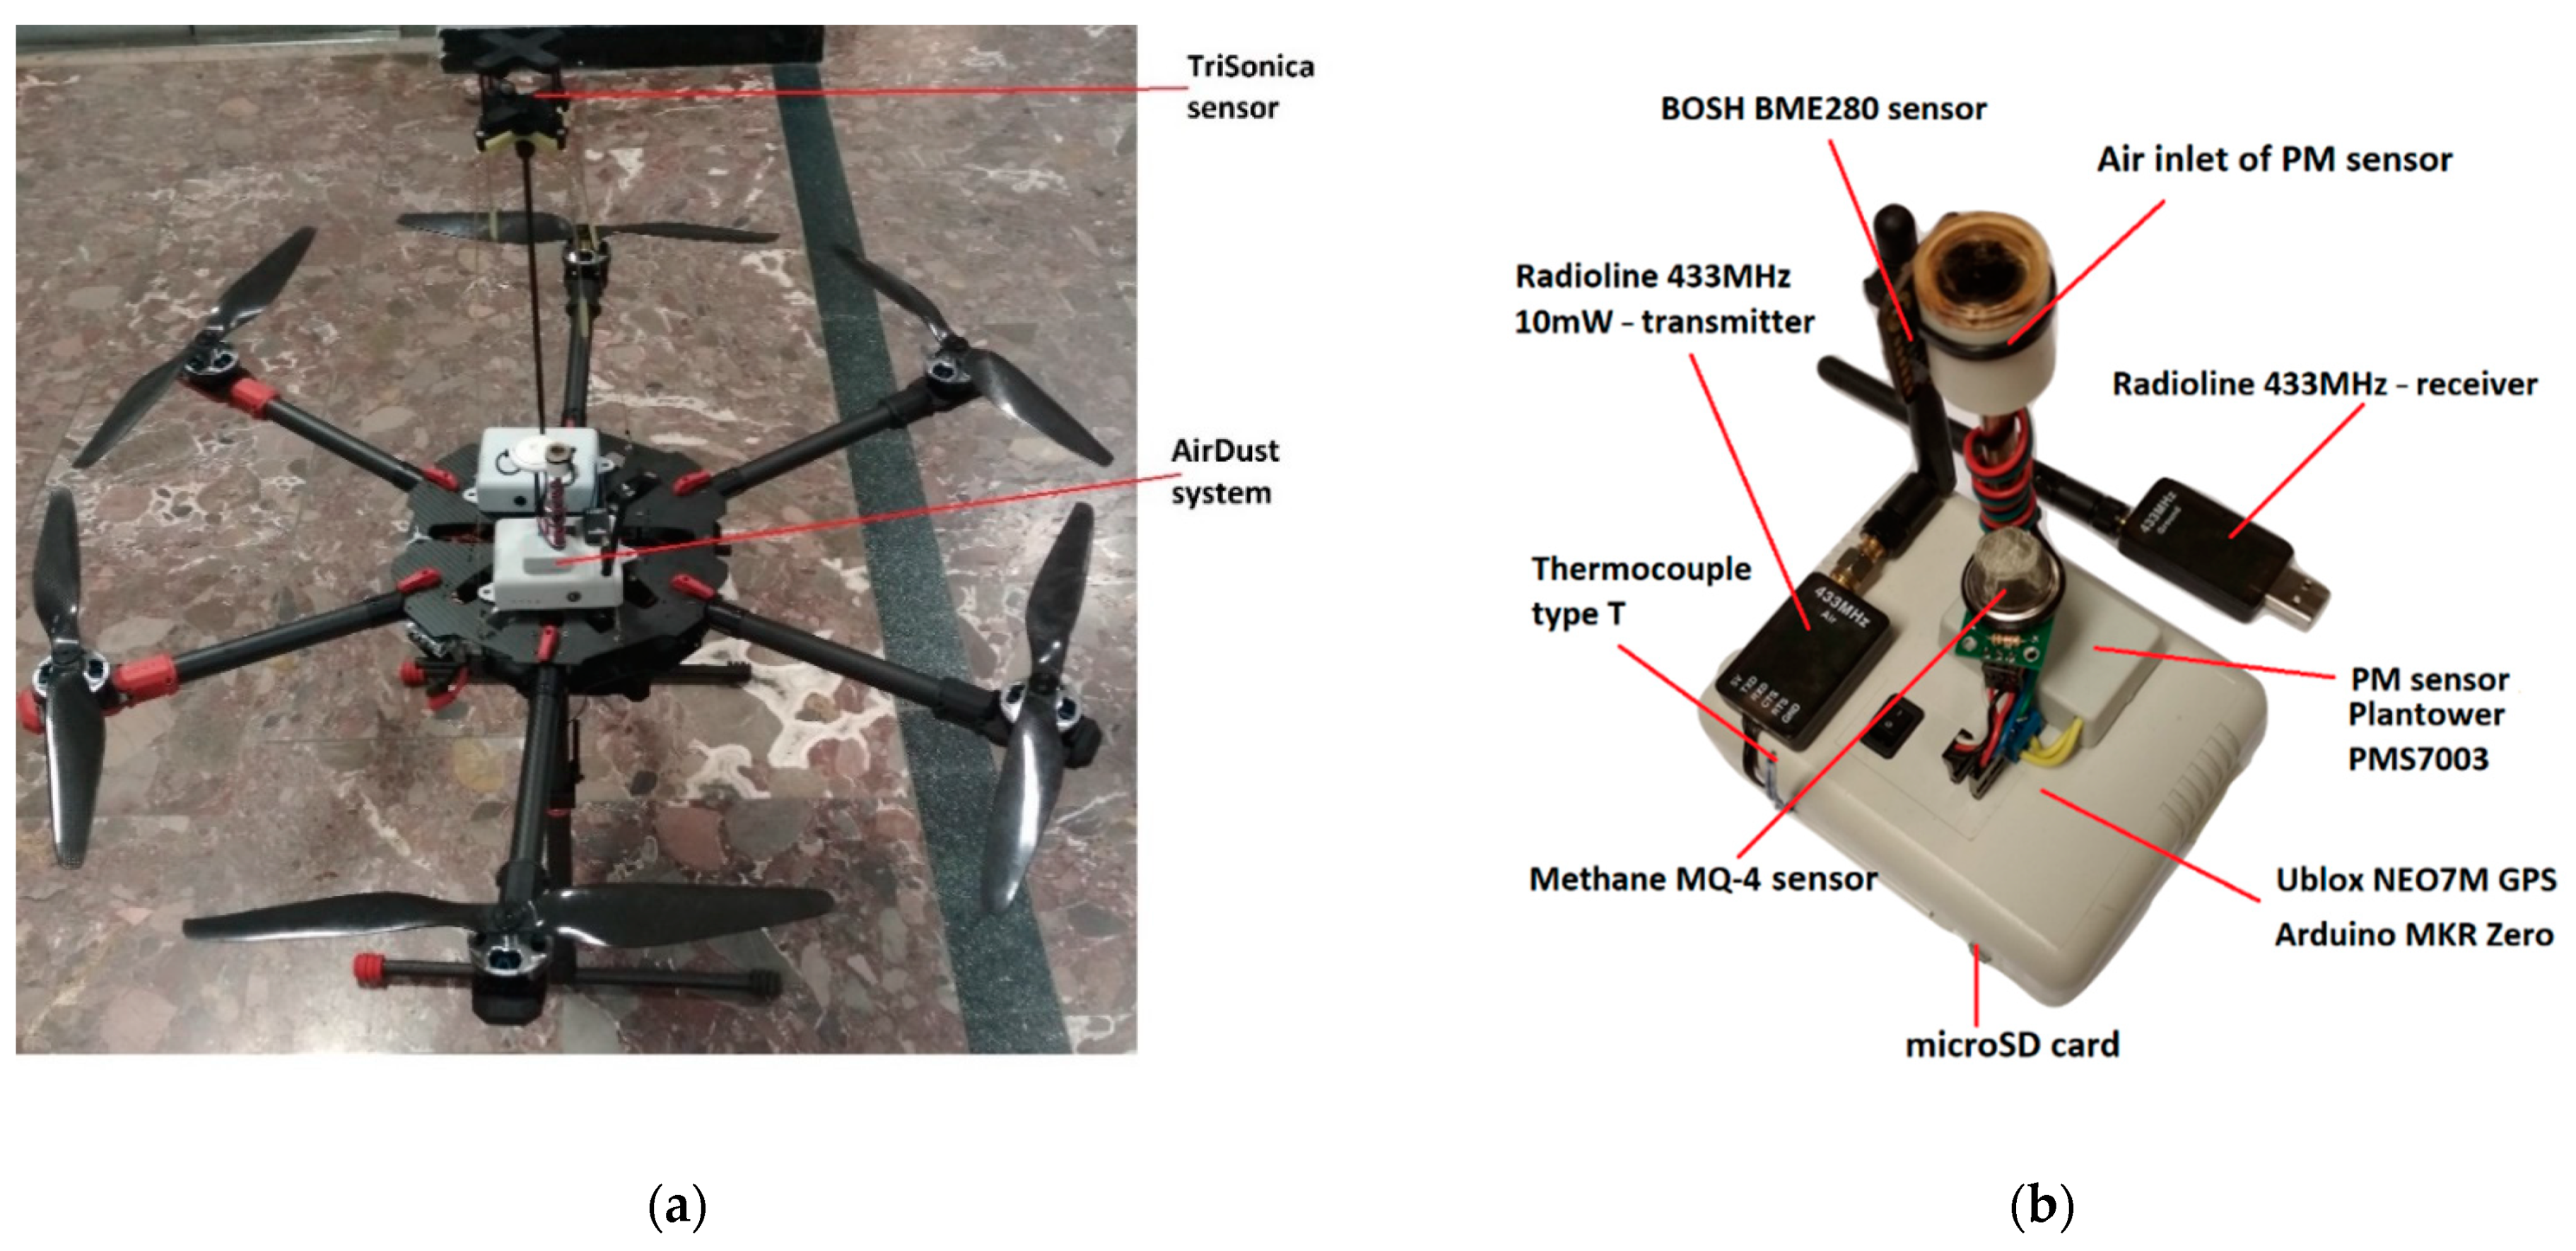
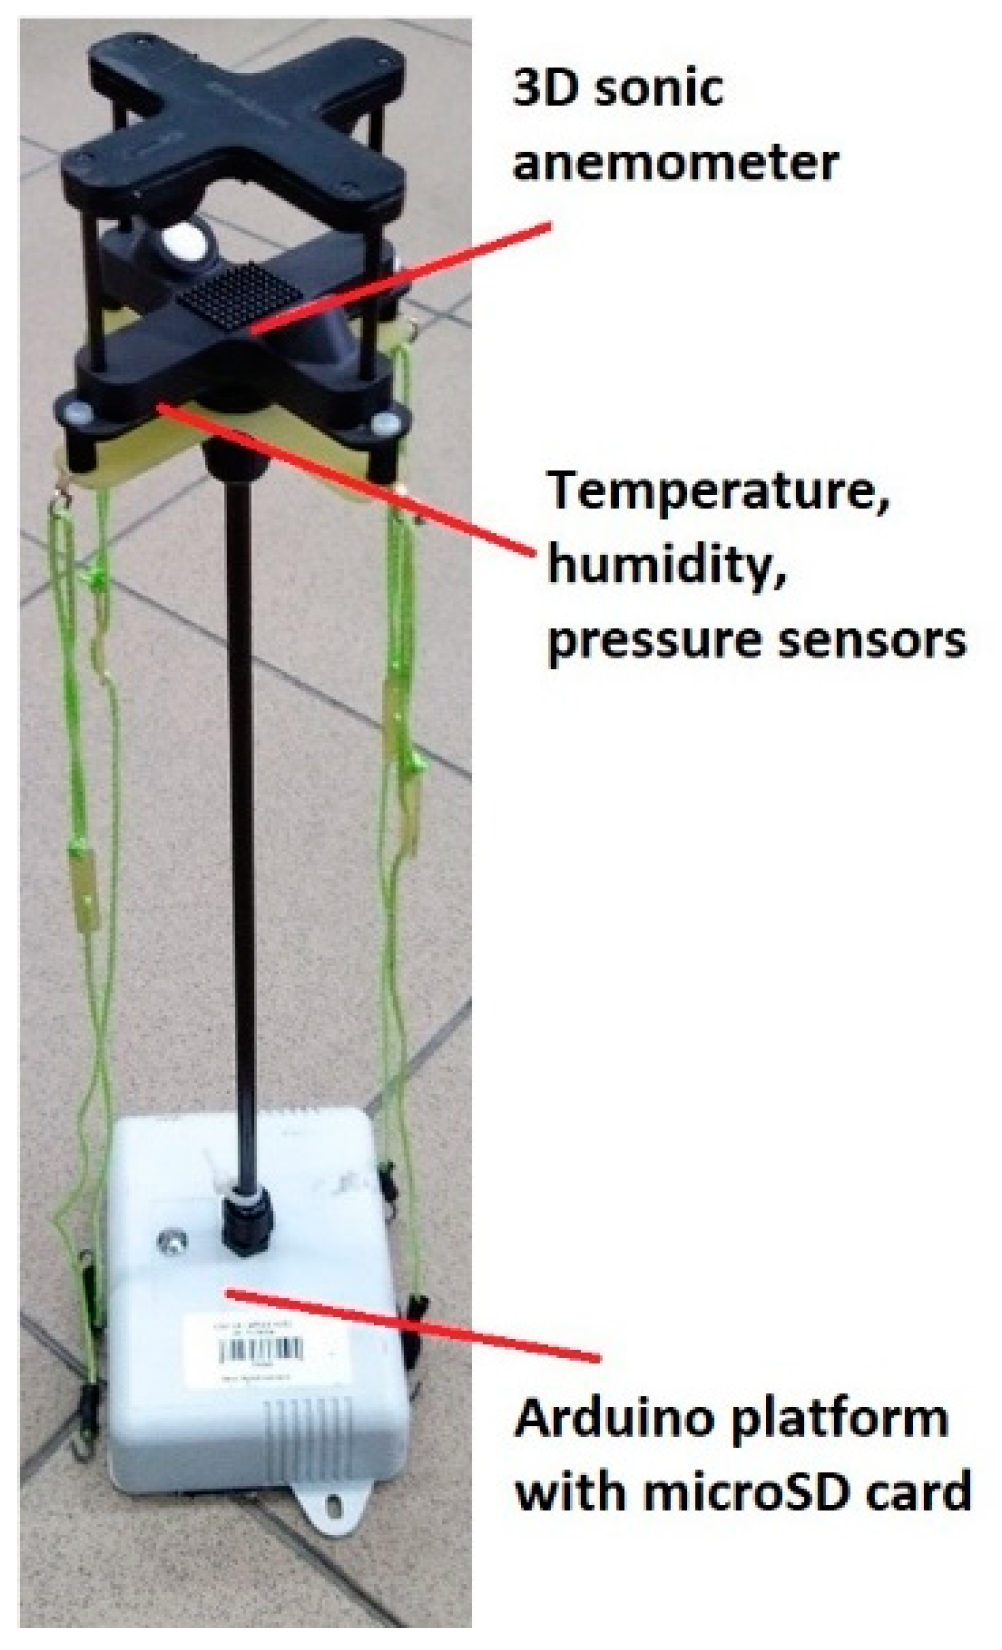
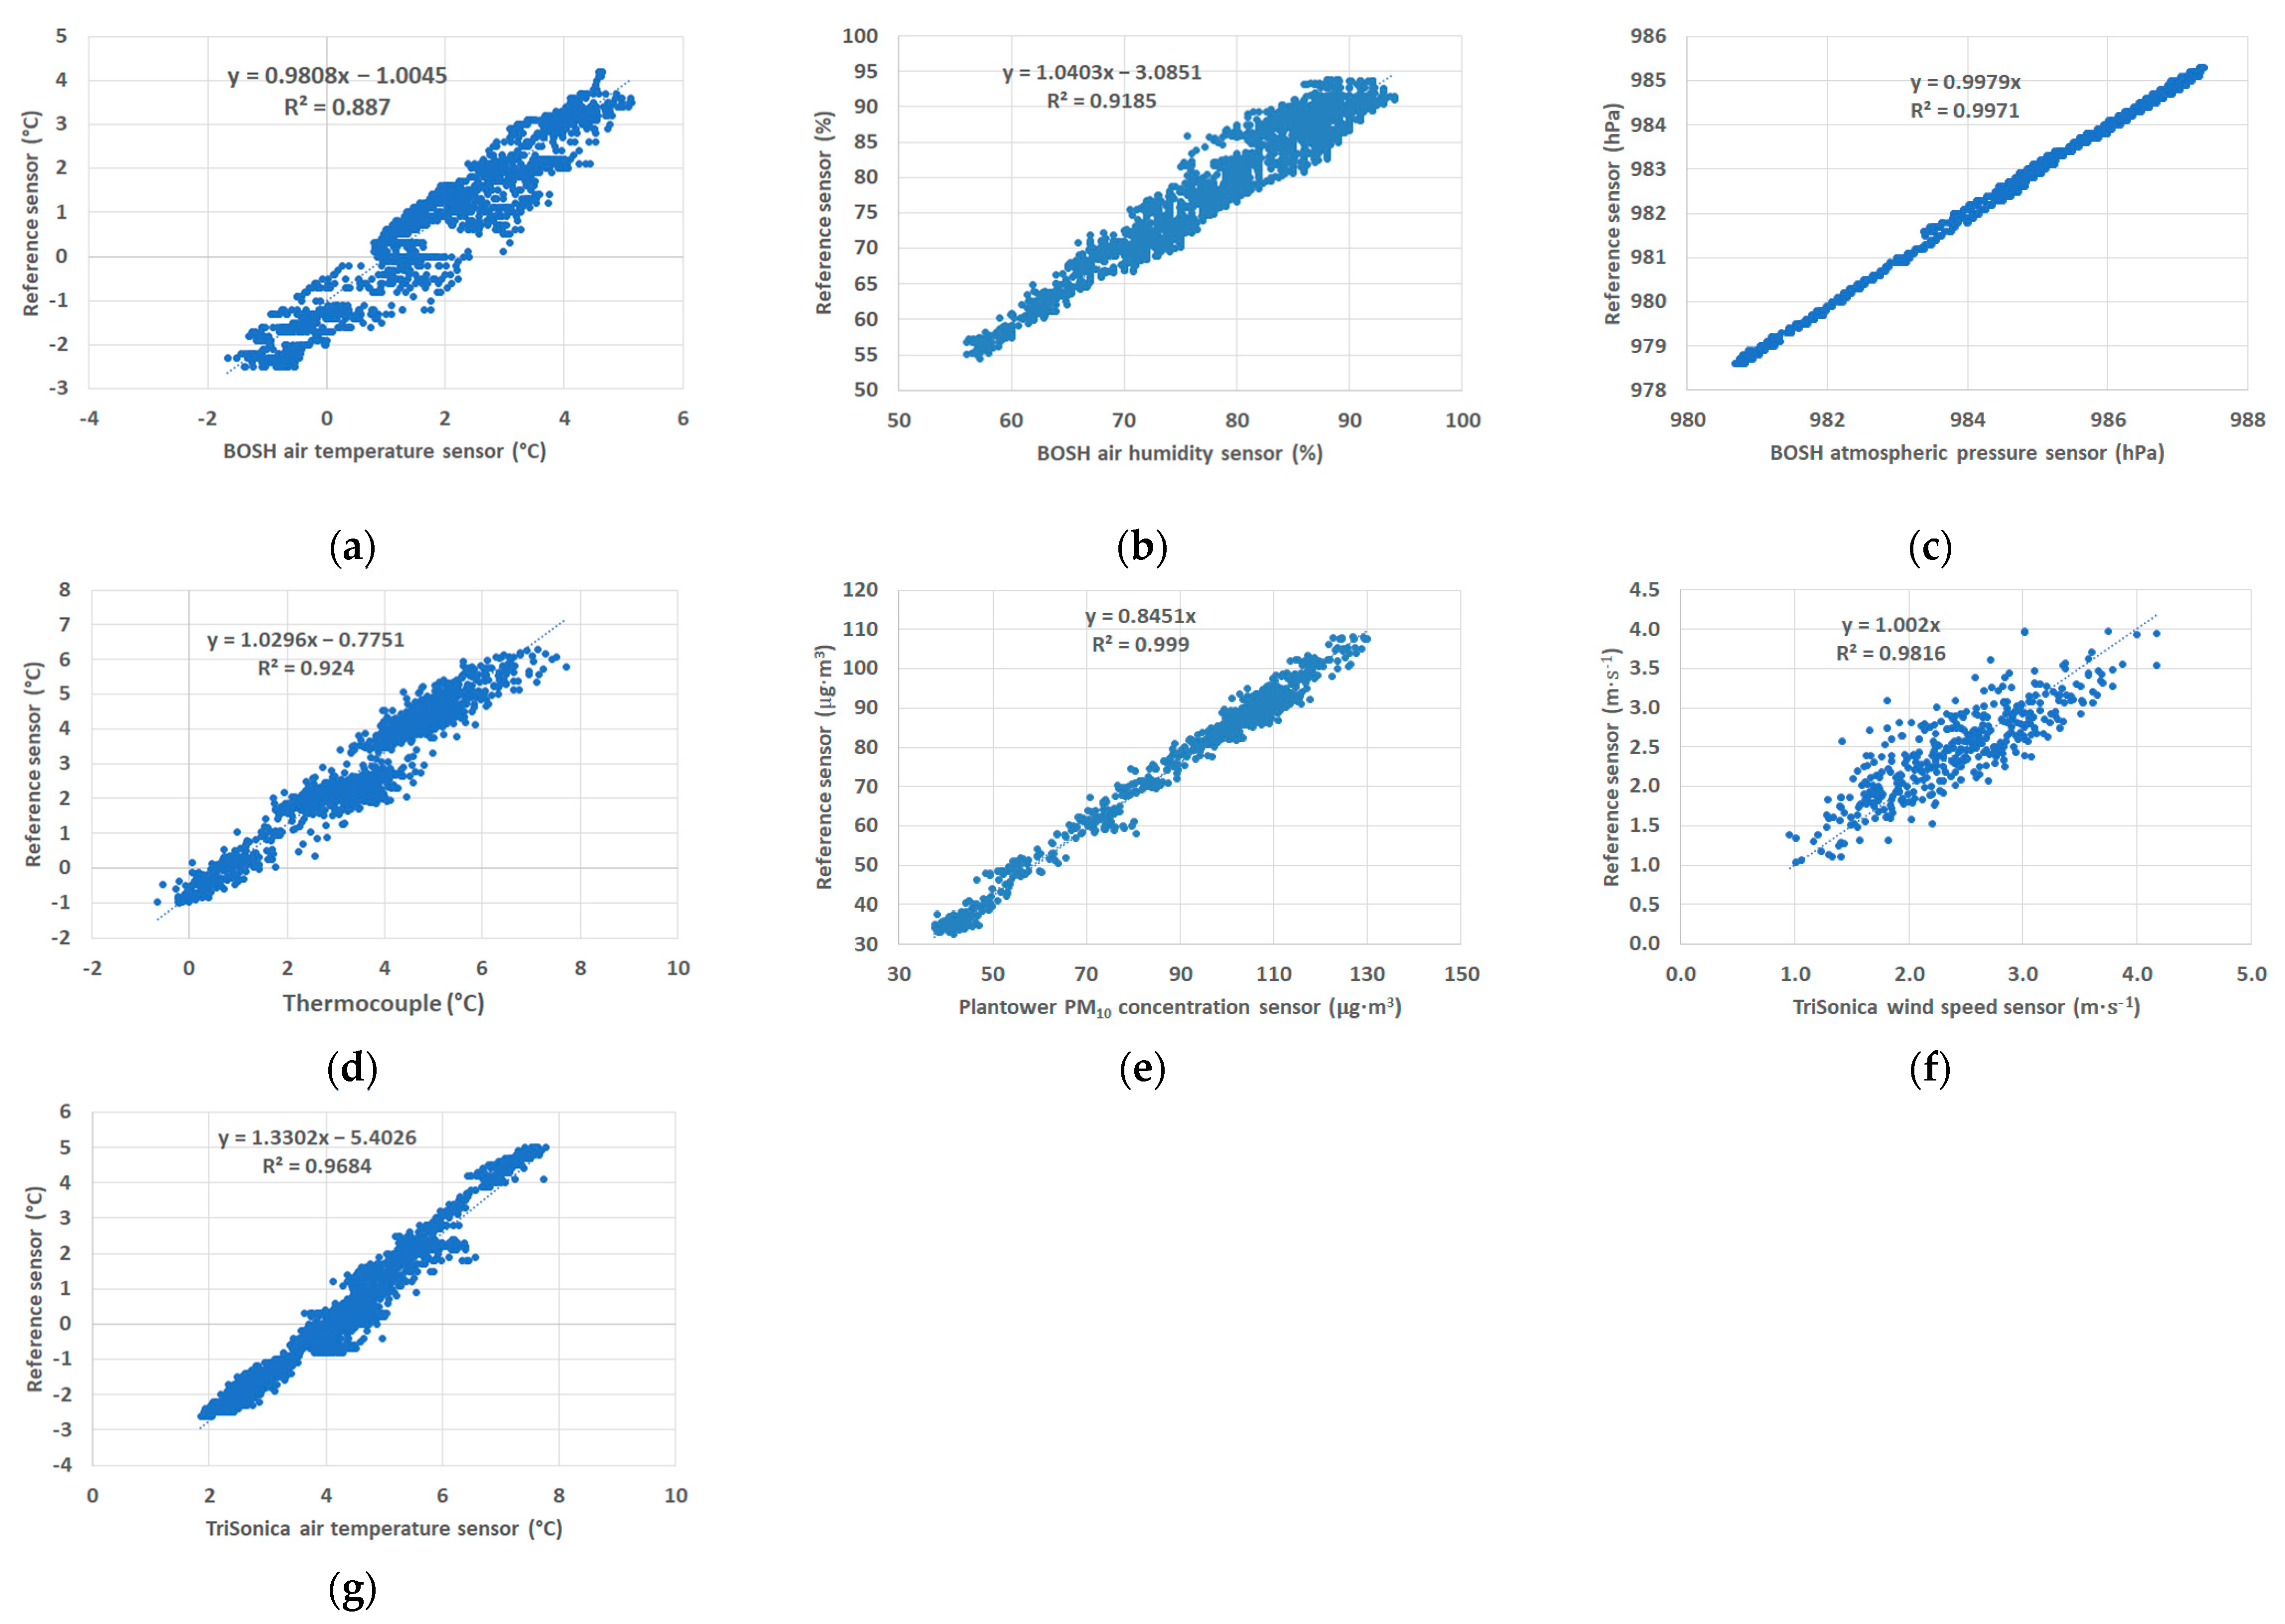
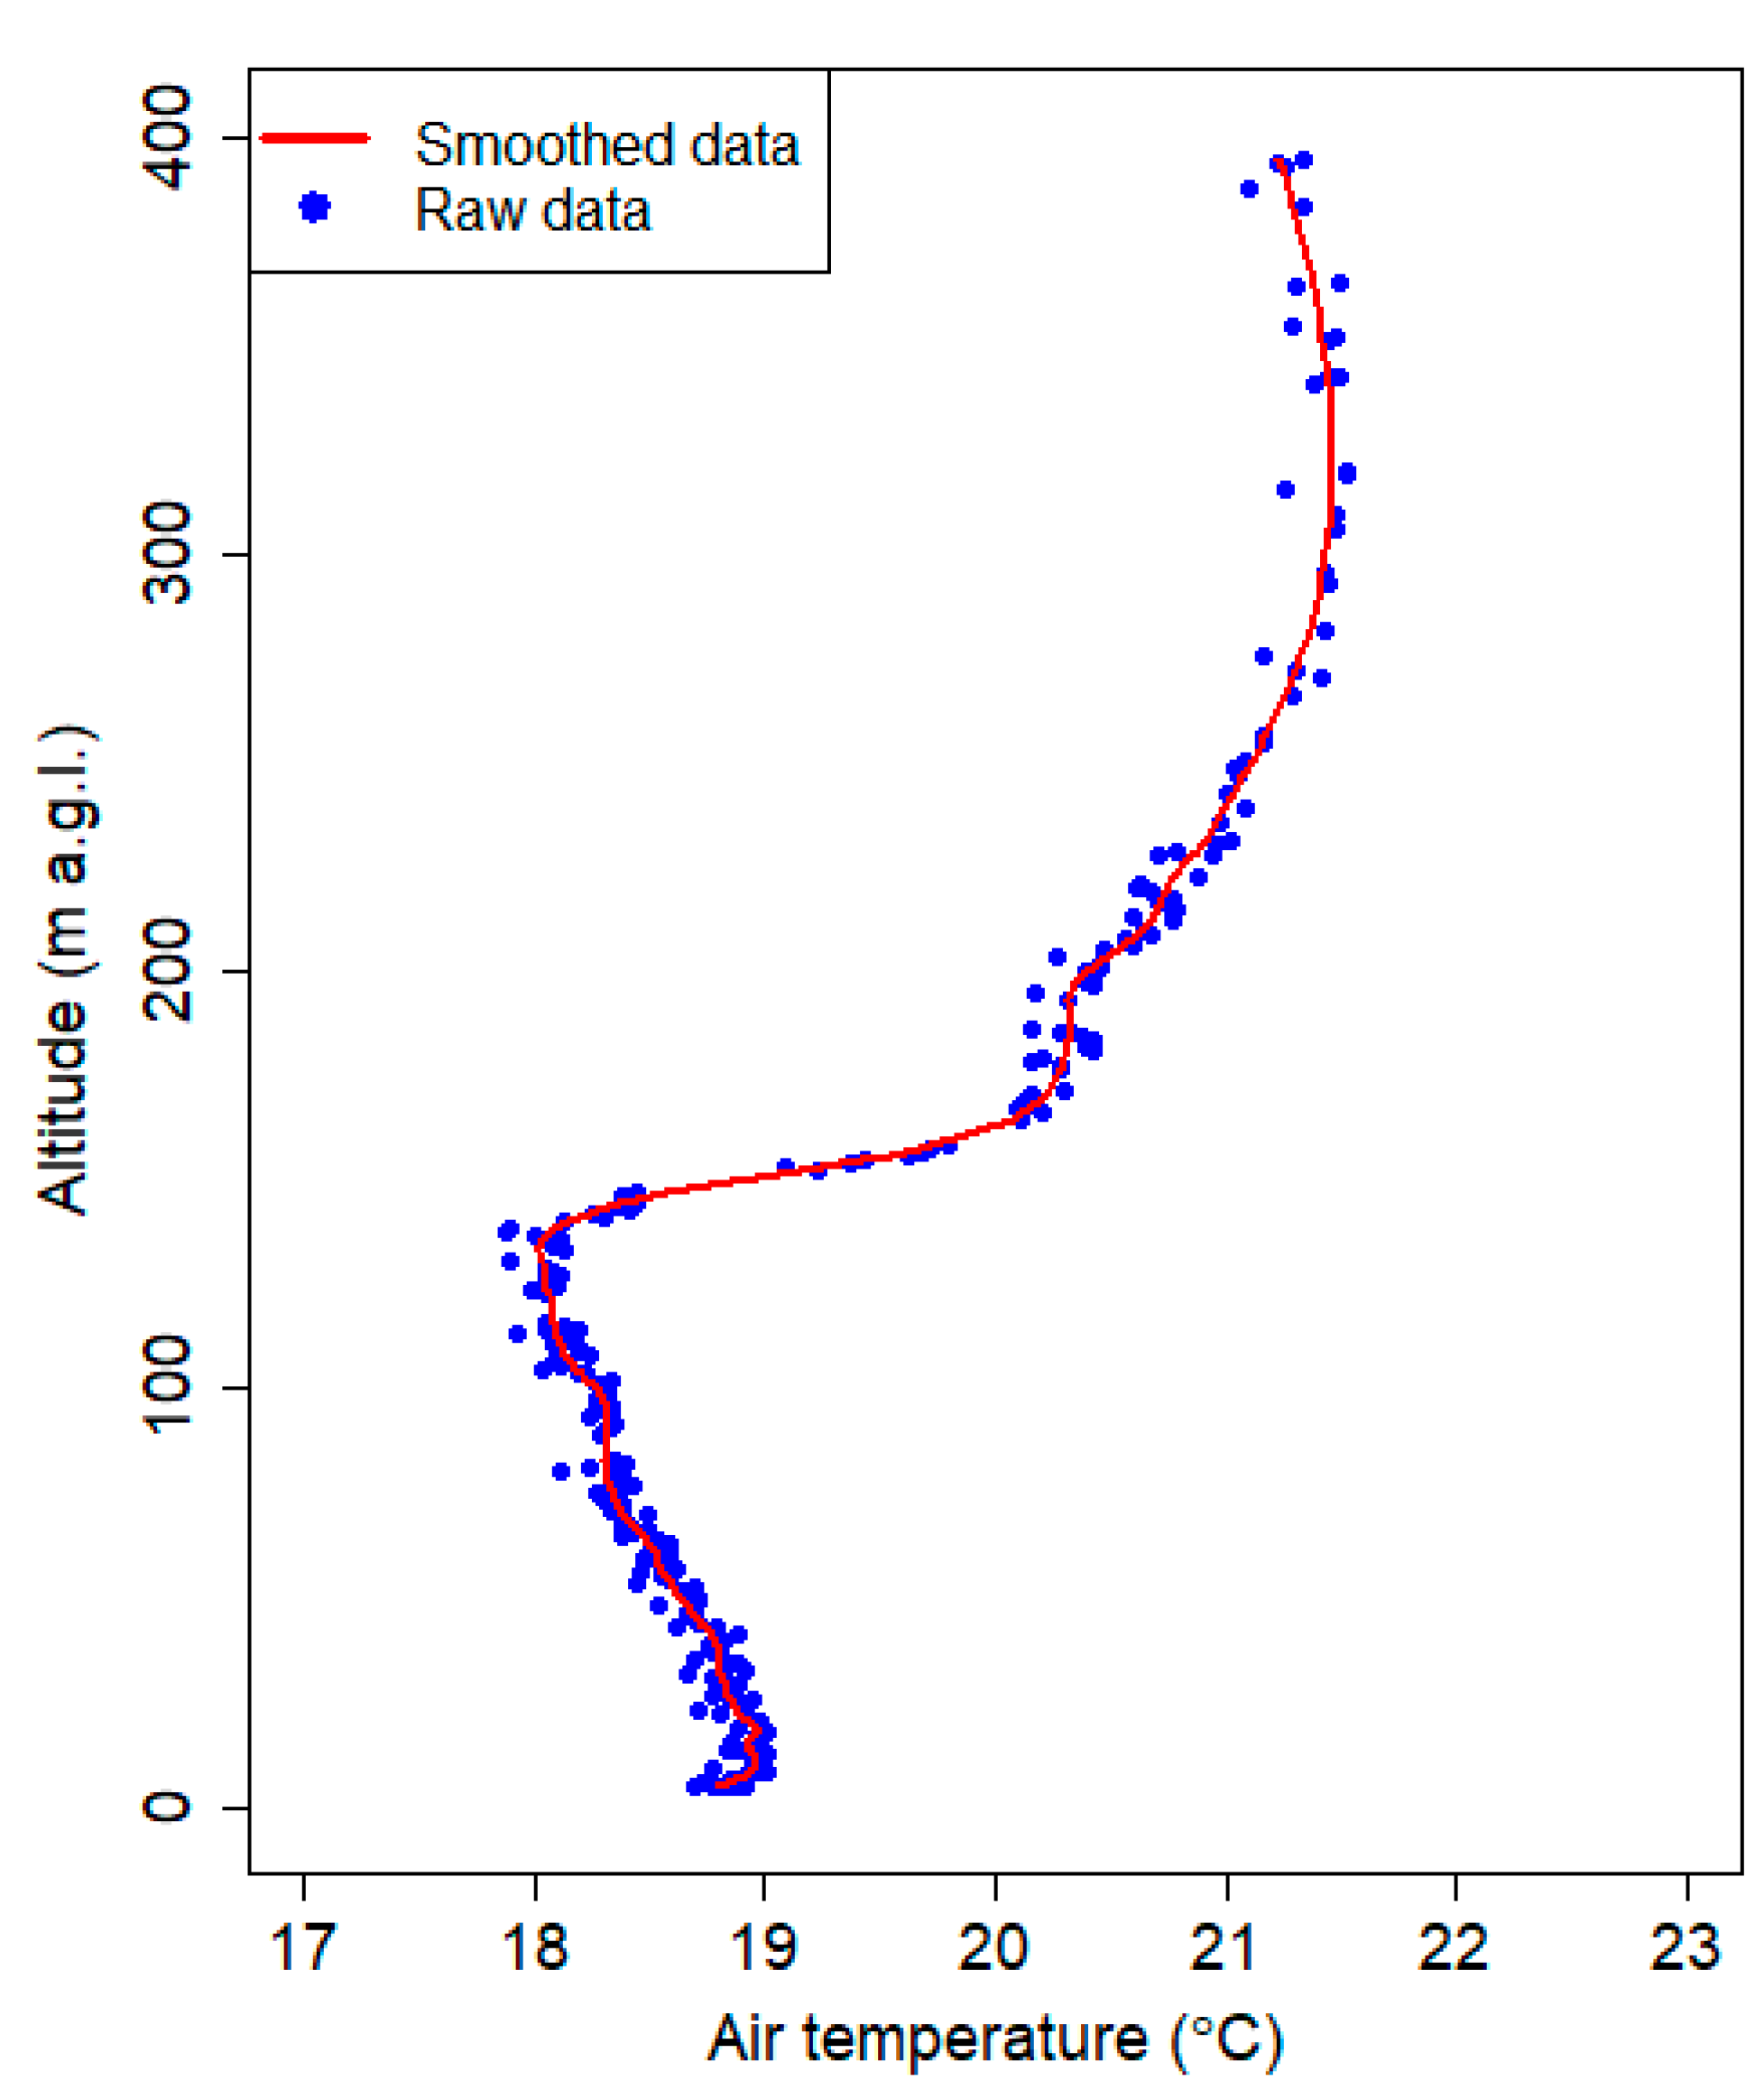
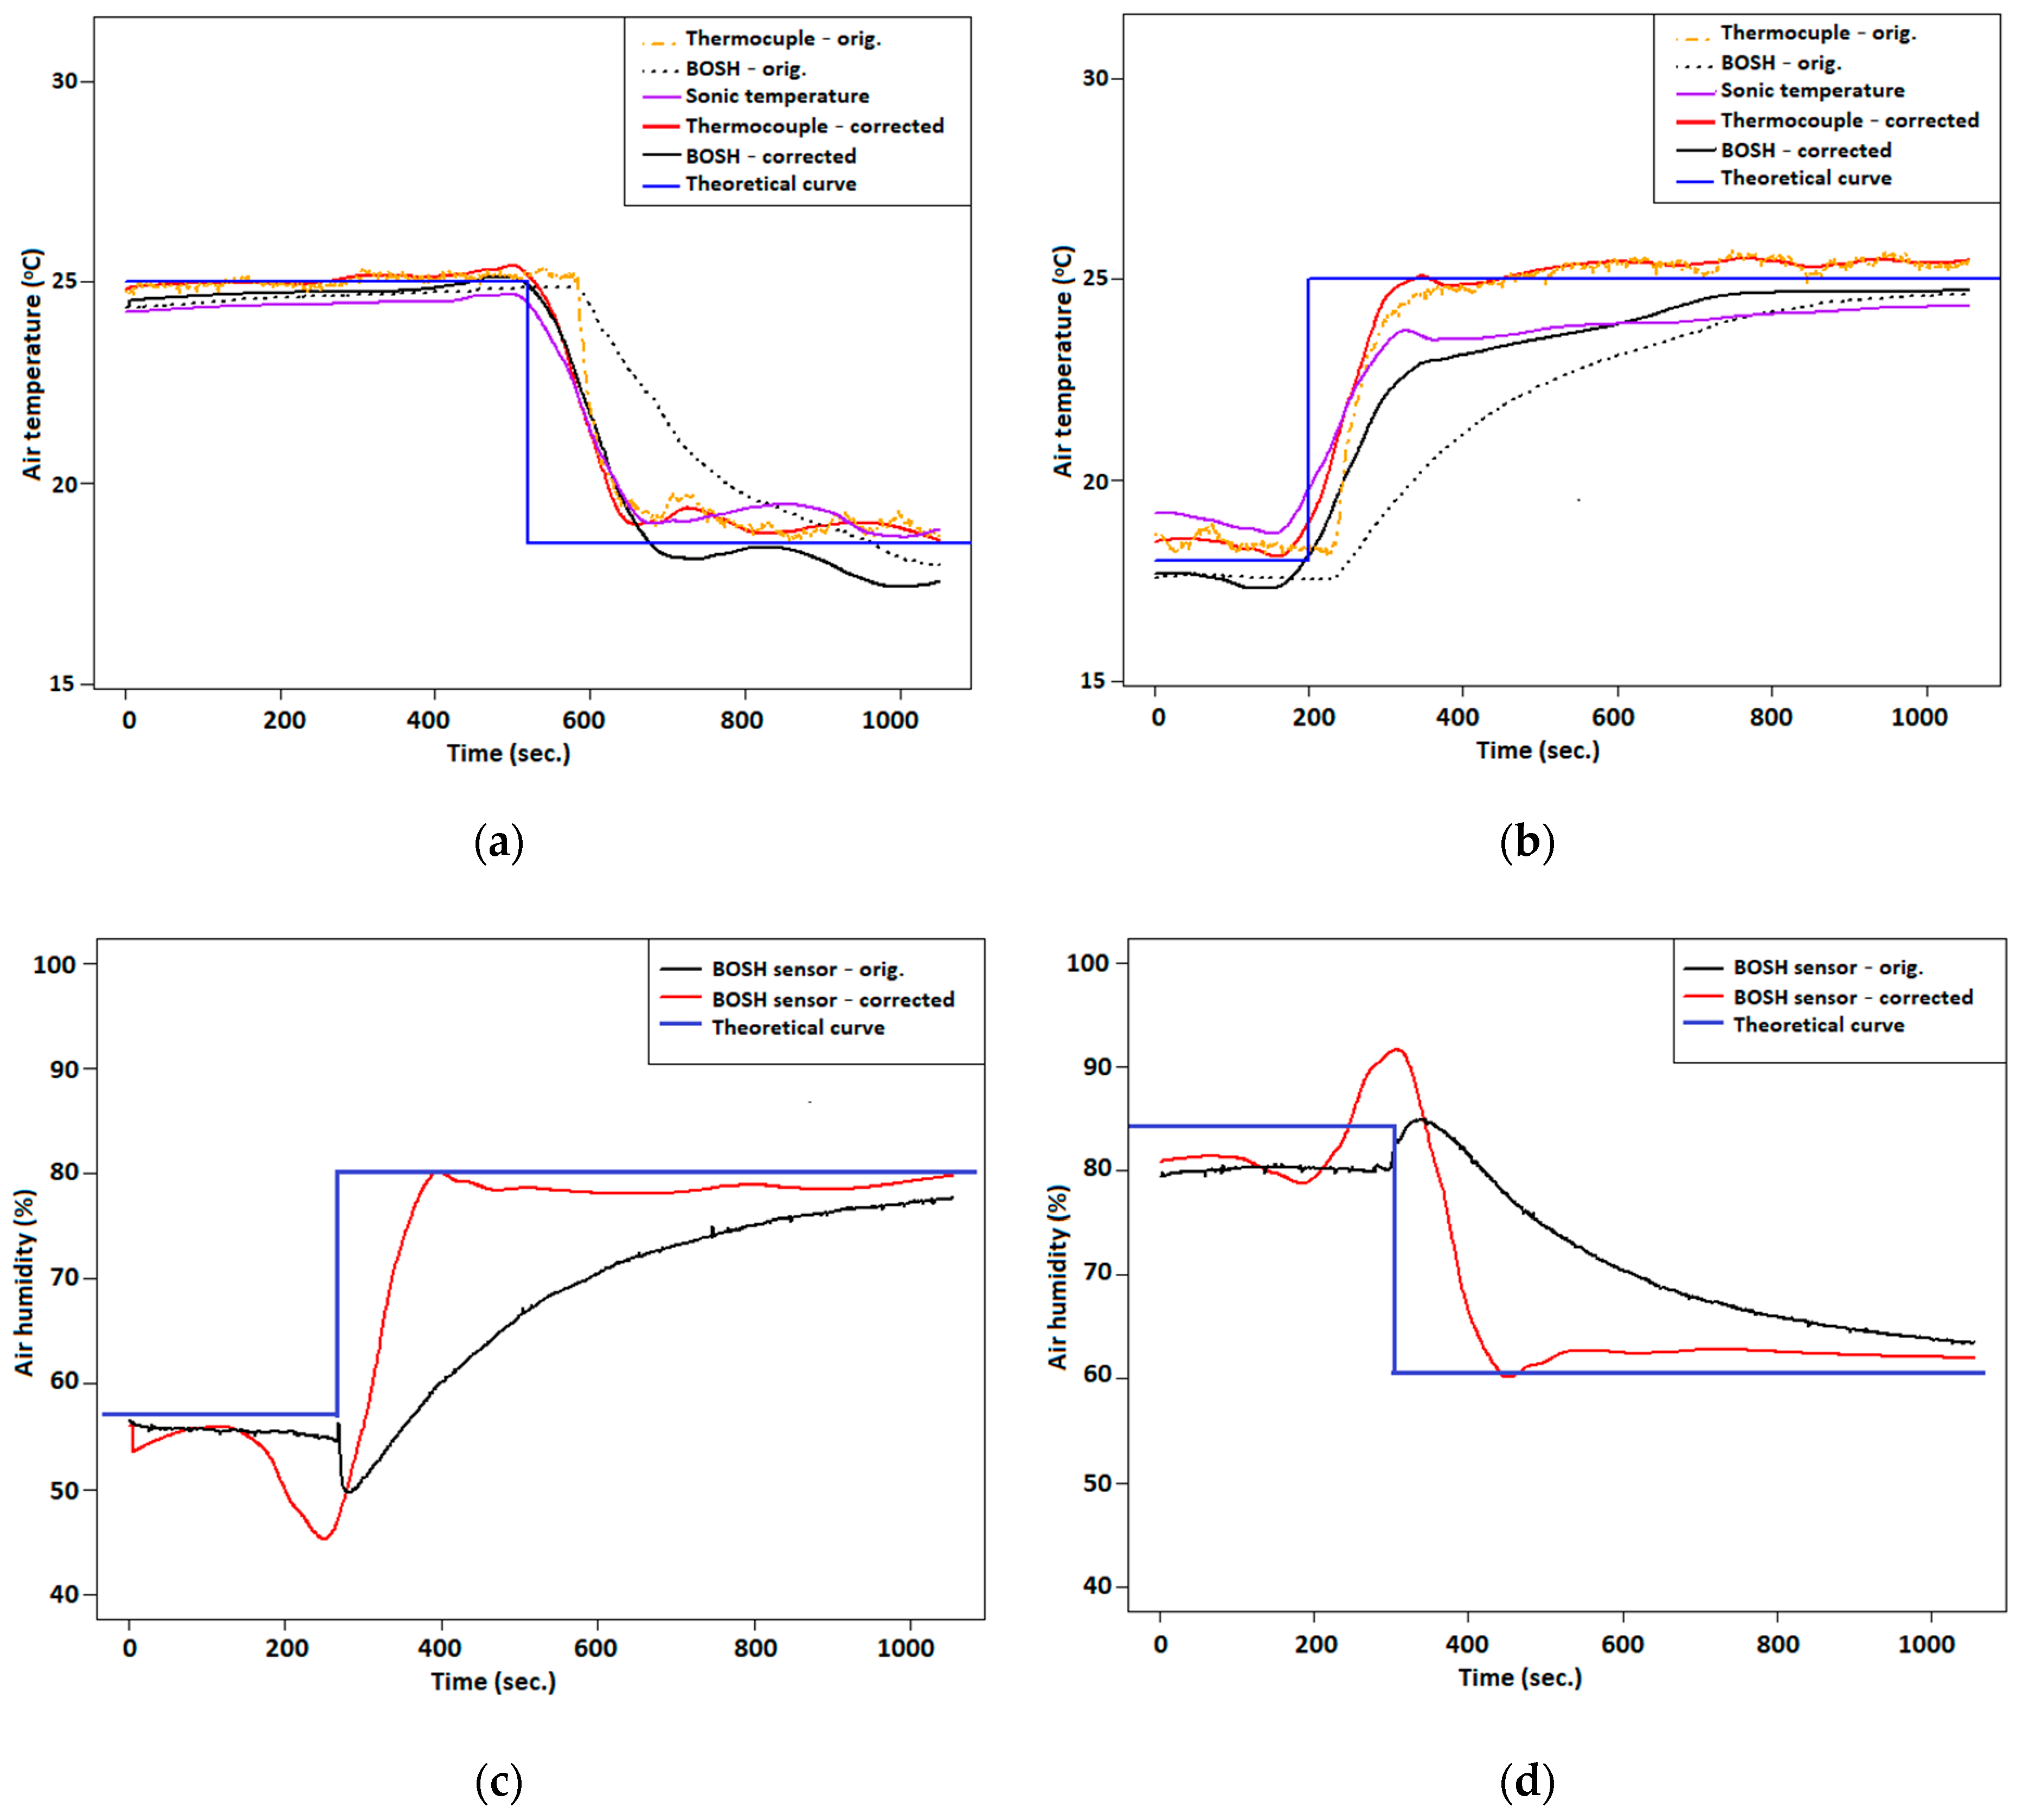






| Parameter | Value |
|---|---|
| Sampling frequency | 1 Hz |
| Weight | 235 g |
| Temperature operating range | −40 ÷ 85 °C |
| Temperature resolution | 0.01 °C |
| Temperature noise | 0.005 °C |
| Temperature accuracy | ±1.0 °C |
| Temperature response time | 1 s |
| Pressure operating range | 300 ÷ 1100 hPa |
| Pressure resolution | 0.0018 hPa |
| Pressure noise | 0.013 hPa |
| Pressure accuracy | 0.12 hPa |
| Humidity operating range | 0 ÷ 100% RH |
| Humidity resolution | 0.008% RH |
| Humidity noise | 0.02% RH |
| Humidity accuracy | ±3% RH |
| Humidity response time (0–>90%) | 1 s |
| PM operating range | 0 ÷ 1000 µg·m−3 |
| PM accuracy | ±10 µg·m−3 |
| PM single response time | 1 s |
| PM detectable size range, µm | 0.3–10 |
| PM size bins range, µm | 0.3–0.5, 0.5–1, 1–2.5, 2.5–5, 5–10, >10 |
| PM estimated concentrations | PM1, PM2.5, PM10 |
| Parameter | Value |
|---|---|
| Size | 9.1 × 9.1 × 5.2 cm |
| Weight | 50 g |
| Sampling frequency | 1 Hz, 2 Hz, 5 Hz, 10 Hz |
| Wind speed range | 0–50 m·s−1 |
| Wind speed resolution | 0.1 m |
| Wind speed accuracy | (0–10 m/s) ± 0.1 m/s; (11–30 m/s) ± 1%; (31–50 m/s) ± 2% |
| Wind direction range | (x/y) 0–360°; (z) ± 30° |
| Wind direction resolution | 1° |
| Wind direction accuracy | ±1° |
| Pressure range | 50–115 kPa |
| Pressure resolution | 0.1 kPa |
| Pressure accuracy | ±1 kPa |
| Humidity range | 0–100% RH |
| Humidity resolution | 0.1% |
| Humidity accuracy | ±3% |
| Temperature range (derived from speed of sound and humidity) | −40–80 °C (very fast response time) |
| Temperature resolution | 0.1 °C |
| Temperature accuracy | ±2 °C |
| No. | Name of Place | Longitude (°E) | Latitude (°N) | Height (m a.s.l. *) |
|---|---|---|---|---|
| 1 | Location of vertical measurement (UAV ** place) | 19.898 | 50.026 | 209 |
| 2 | JU Campus meteorological station | 19.902 | 50.026 | 212 |
| 3 | RTCN tower | 19.909 | 50.051 | 222 |
| 4 | AGH UST *** meteorological station | 19.912 | 50.067 | 220 |
| 5 | Synoptic station Balice | 19.909 | 50.051 | 237 |
Publisher’s Note: MDPI stays neutral with regard to jurisdictional claims in published maps and institutional affiliations. |
© 2021 by the authors. Licensee MDPI, Basel, Switzerland. This article is an open access article distributed under the terms and conditions of the Creative Commons Attribution (CC BY) license (https://creativecommons.org/licenses/by/4.0/).
Share and Cite
Sekula, P.; Zimnoch, M.; Bartyzel, J.; Bokwa, A.; Kud, M.; Necki, J. Ultra-Light Airborne Measurement System for Investigation of Urban Boundary Layer Dynamics. Sensors 2021, 21, 2920. https://doi.org/10.3390/s21092920
Sekula P, Zimnoch M, Bartyzel J, Bokwa A, Kud M, Necki J. Ultra-Light Airborne Measurement System for Investigation of Urban Boundary Layer Dynamics. Sensors. 2021; 21(9):2920. https://doi.org/10.3390/s21092920
Chicago/Turabian StyleSekula, Piotr, Miroslaw Zimnoch, Jakub Bartyzel, Anita Bokwa, Michal Kud, and Jaroslaw Necki. 2021. "Ultra-Light Airborne Measurement System for Investigation of Urban Boundary Layer Dynamics" Sensors 21, no. 9: 2920. https://doi.org/10.3390/s21092920
APA StyleSekula, P., Zimnoch, M., Bartyzel, J., Bokwa, A., Kud, M., & Necki, J. (2021). Ultra-Light Airborne Measurement System for Investigation of Urban Boundary Layer Dynamics. Sensors, 21(9), 2920. https://doi.org/10.3390/s21092920


