Communication

Over 1000 nm Near-Infrared Multispectral Imaging System for Laparoscopic In Vivo Imaging

1
Exploratory Oncology Research & Clinical Trial Center, National Cancer Center, Kashiwa, Chiba 277-8577, Japan
2
Research Institute for Biomedical Sciences, Tokyo University of Science, Noda, Chiba 278-8510, Japan
3
Department of Materials Science and Technology, Tokyo University of Science, Katsushika, Tokyo 162-8601, Japan
4
Department of Mechanical Engineering, Tokyo University of Science, Noda, Chiba 278-8510, Japan
5
Department of Gastroenterology and Endoscopy, National Cancer Center Hospital East, Kashiwa, Chiba 277-8577, Japan
6
Department of Pathology and Clinical Laboratories, National Cancer Center Hospital East, Kashiwa, Chiba 277-8577, Japan
7
RIKEN Center for Advanced Photonics, Wako, Saitama 351-0198, Japan
*
Author to whom correspondence should be addressed.
Sensors 2021, 21(8), 2649; https://doi.org/10.3390/s21082649
Submission received: 25 February 2021 / Revised: 1 April 2021 / Accepted: 6 April 2021 / Published: 9 April 2021
(This article belongs to the Special Issue Biomedical Infrared Imaging: From Sensors to Applications Ⅱ)

Abstract

:
In this study, a laparoscopic imaging device and a light source able to select wavelengths by bandpass filters were developed to perform multispectral imaging (MSI) using over 1000 nm near-infrared (OTN-NIR) on regions under a laparoscope. Subsequently, MSI (wavelengths: 1000–1400 nm) was performed using the built device on nine live mice before and after tumor implantation. The normal and tumor pixels captured within the mice were used as teaching data sets, and the tumor-implanted mice data were classified using a neural network applied following a leave-one-out cross-validation procedure. The system provided a specificity of 89.5%, a sensitivity of 53.5%, and an accuracy of 87.8% for subcutaneous tumor discrimination. Aggregated true-positive (TP) pixels were confirmed in all tumor-implanted mice, which indicated that the laparoscopic OTN-NIR MSI could potentially be applied in vivo for classifying target lesions such as cancer in deep tissues.

1. Introduction

The number of cancer cases and deaths worldwide has been strikingly increasing with the rapidly aging population [1]. Surgical resection is one of the most common procedures used to treat cancers. As a minimally invasive surgery compared to laparotomy, laparoscopic surgery has been in great demand because the need for such surgeries has increased. Therefore, in order to perform laparoscopic surgery more safely and efficiently, it is necessary to develop an image-guided surgical support system identifying cancer-associated regions and anatomical structures such as blood vessels and nerves.
Recent advances in imaging technologies associated with machine learning have led to the identification of anatomical structures and the localization of cancer in surgical image data [2,3]. However, red, green, and blue (RGB) images acquired by standard visible-light-sensitive cameras only allow the observation of the target’s surface. In addition, it is challenging to distinguish between tissues with similar colors and shapes. Therefore, the use of spectral information beyond the visible light wavelength range in the learning process plays a crucial role in machine learning approaches to catch up with, or even outperform, predictions made by medical experts.
Near-infrared (NIR) light offers advantages over the visible spectral range, including high biological transparency owing to its low absorption and scattering by tissues. The over 1000 nm (OTN) wavelength NIR region (1000–2000 nm), often called the “second biological window” [4], provides higher penetration depth down to 10 mm [5], as well as chemical information corresponding to the overtone and combination tone of molecular vibrations. This slight absorption, which is at a magnitude 10−2 lower than that of the visible or mid-infrared regions [6], delivers the fingerprint of chemical composition in the deep tissue [7]. Moreover, spectral imaging, which can acquire the spectrum of each camera pixel, can analyze a large amount of data with a high spatial resolution [8]. Spectral imaging with a high wavelength resolution is called hyperspectral imaging (HSI) [9,10]. Various resected cancers have been analyzed using HSI [11,12,13,14,15,16]. For instance, Sato et al. reported that NIR-HSI could be used to identify tumors covered by normal mucosa [17]. To apply NIR-HSI to real-time imaging, wavelength bands must be reduced because the HSI data (200–300 bands) require substantial processing time. Therefore, Akimoto et al. proposed a selection method for valuable wavelengths, and the authors indicated that four bands in the range of 1000–1400 nm could identify the region of a gastrointestinal stromal tumor under normal mucosa, using the same level of accuracy as NIR-HSI [18]. The results indicate that multispectral imaging (MSI) using selected wavelengths in the range of OTN-NIR could potentially recognize invisible cancer and organs during surgery without labeling with a fluorescent probe. However, to date, only studies on laparoscopic HSI or MSI using less than 1000 nm light have been reported [19,20,21].
In this study, based on a laparoscope that can observe OTN-NIR images, as reported by Zako et al. [22], a wavelength-selectable light source and an optical system for laparoscopy were built to perform OTN-NIR MSI with easy operability. We demonstrate the proof-of-concept for this prototype laparoscope and light source.

2. Materials and Methods

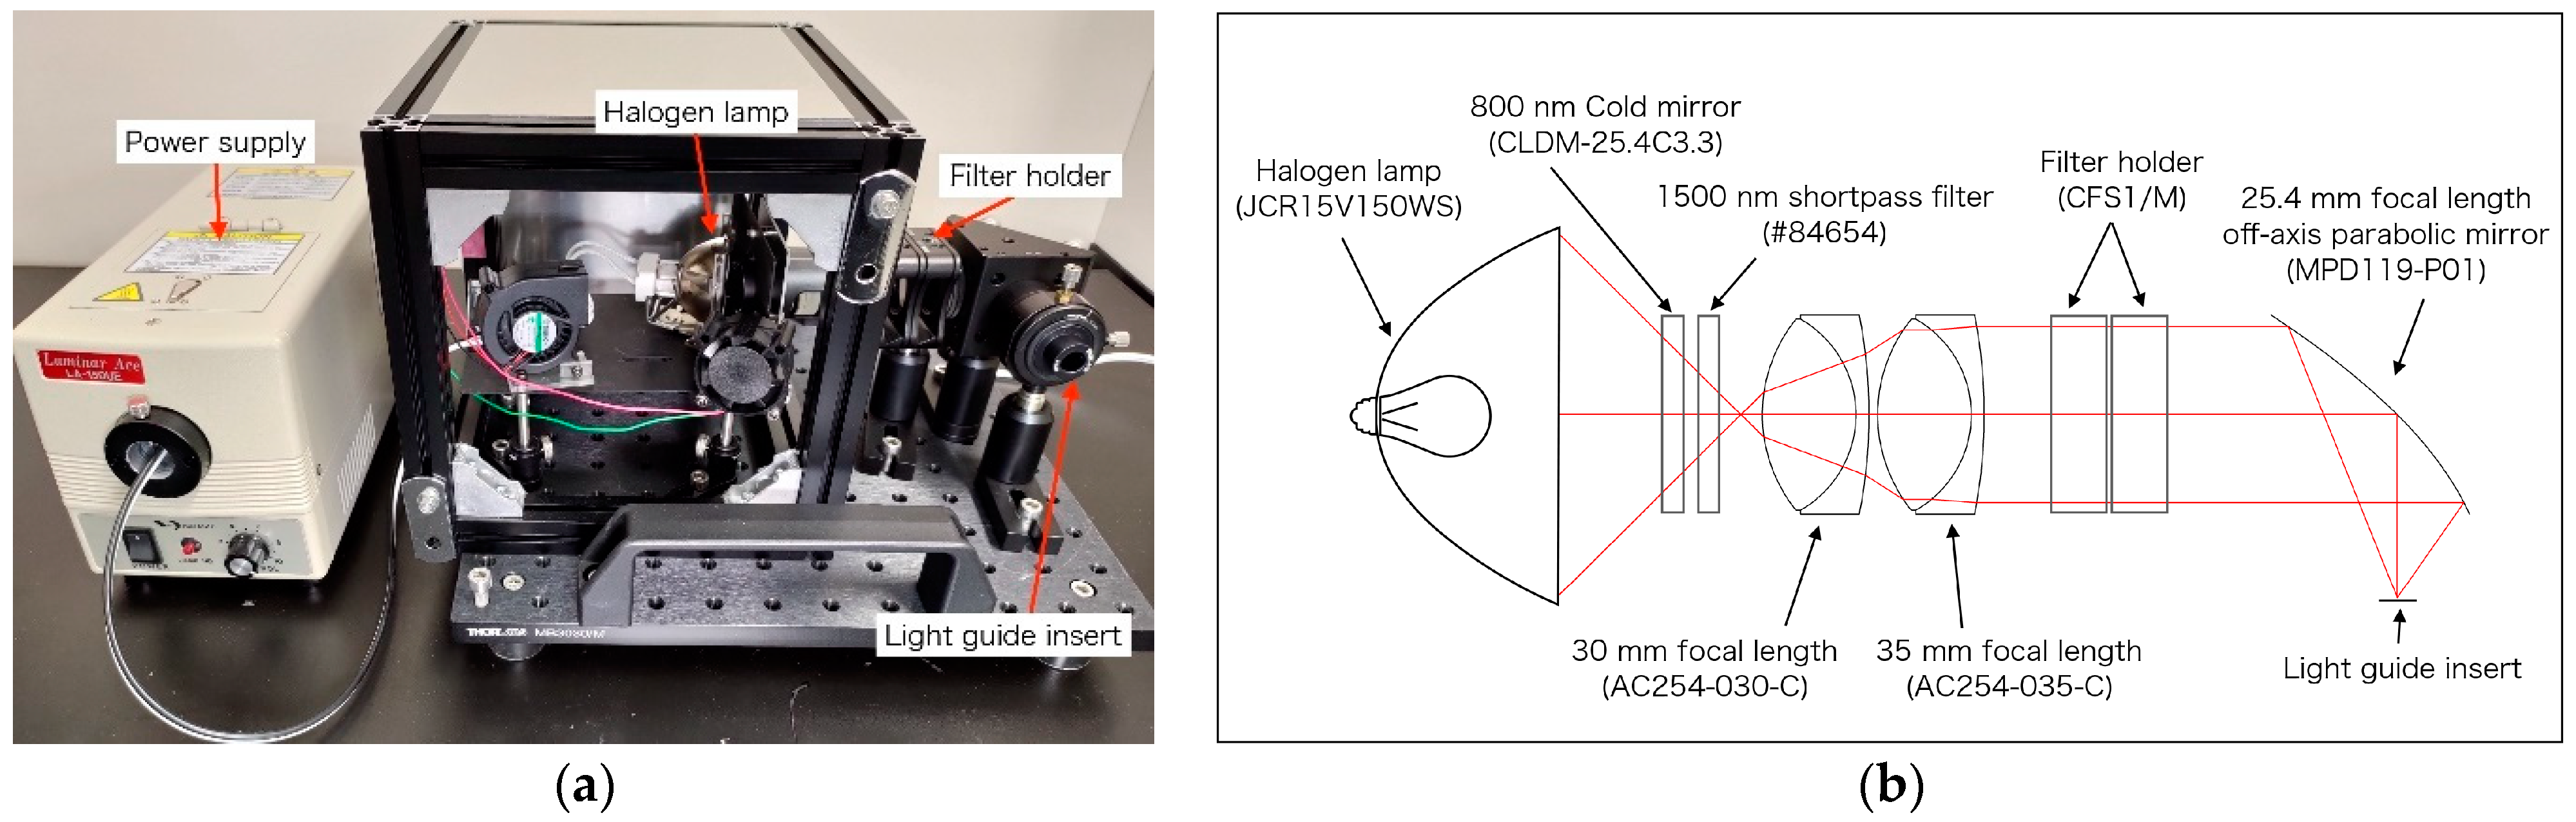
2.1. Light Source and Laparoscope for OTN-NIR Multispectral Imaging

In this study, a light source that can perform OTN-NIR multispectral imaging was developed. In Figure 1a, the developed light source able to select the output wavelength manually using an NIR bandpass filter is shown. The light source was constructed with a cold mirror (CLDM-25.4C3.3, SIGMA KOKI, Tokyo, Japan), a 1500 nm shortpass filter (#84654, Edmund Optics, Barrington, NJ, USA), two achromatic lenses (AC254-030-C and AC254-035-C, Thorlabs, Newton, NJ, USA), and an off-axis parabolic mirror (MPD119-P01, Thorlabs, USA) based on a 150 W halogen lamp (JCR15V150WS and LA-150UE, HAYASHI-REPIC CO., LTD., Tokyo, Japan). The filter holders (CFS1/M, Thorlabs, USA), inserted in the light source, enabled the selection of the output wavelength. The optical system, modeled using the CODEV optical ray-tracing software, is shown in Figure 1b. As the selectable filters, 14 wavelength (1000–1400 nm) filters that were commercially available are listed in Table 1. For filters below 1150 nm, a 1250 nm shortpass filter was added because transmitted light was observed in the region over 1400 nm.
The prototype imaging system developed to perform OTN-NIR multispectral imaging under a laparoscope is depicted in Figure 2a. The device was constructed with a custom-made VIS-NIR endoscope (Machida Endoscope Co., Tokyo, Japan) [22], an NIR tunable fluidic lens (EL-16-40-TC-NIR-20D-1-C, Optotune, Dietikon, Switzerland), an achromatic lens (AC254-060-C, Thorlabs, Newton, NJ, USA), and a 320 × 256 pixel InGaAs camera (Xeva-1.7-320, Xenics, Leuven, Belgium). The optical system is illustrated in Figure 2b. As shown in the figure, the field of view (FOV) was approximately 60°, the exit pupil diameter was 3 mm, and the maximum eyepiece field angle was ±7°. The laparoscope had a light guide of 5 mm diameter bundle fiber connecting to the light source. Due to a focus shift that occurred when the wavelength was changed in the light source, the optical power of the tunable lens was set, as shown in Table 1, to adjust the focus [23]. By tuning the optical power, the angle of view changed on the order of several pixels. Therefore, based on the image at 1000 nm, which had the largest angle of view, all wavelength images were enlarged, and the positions were matched by an affine transformation.

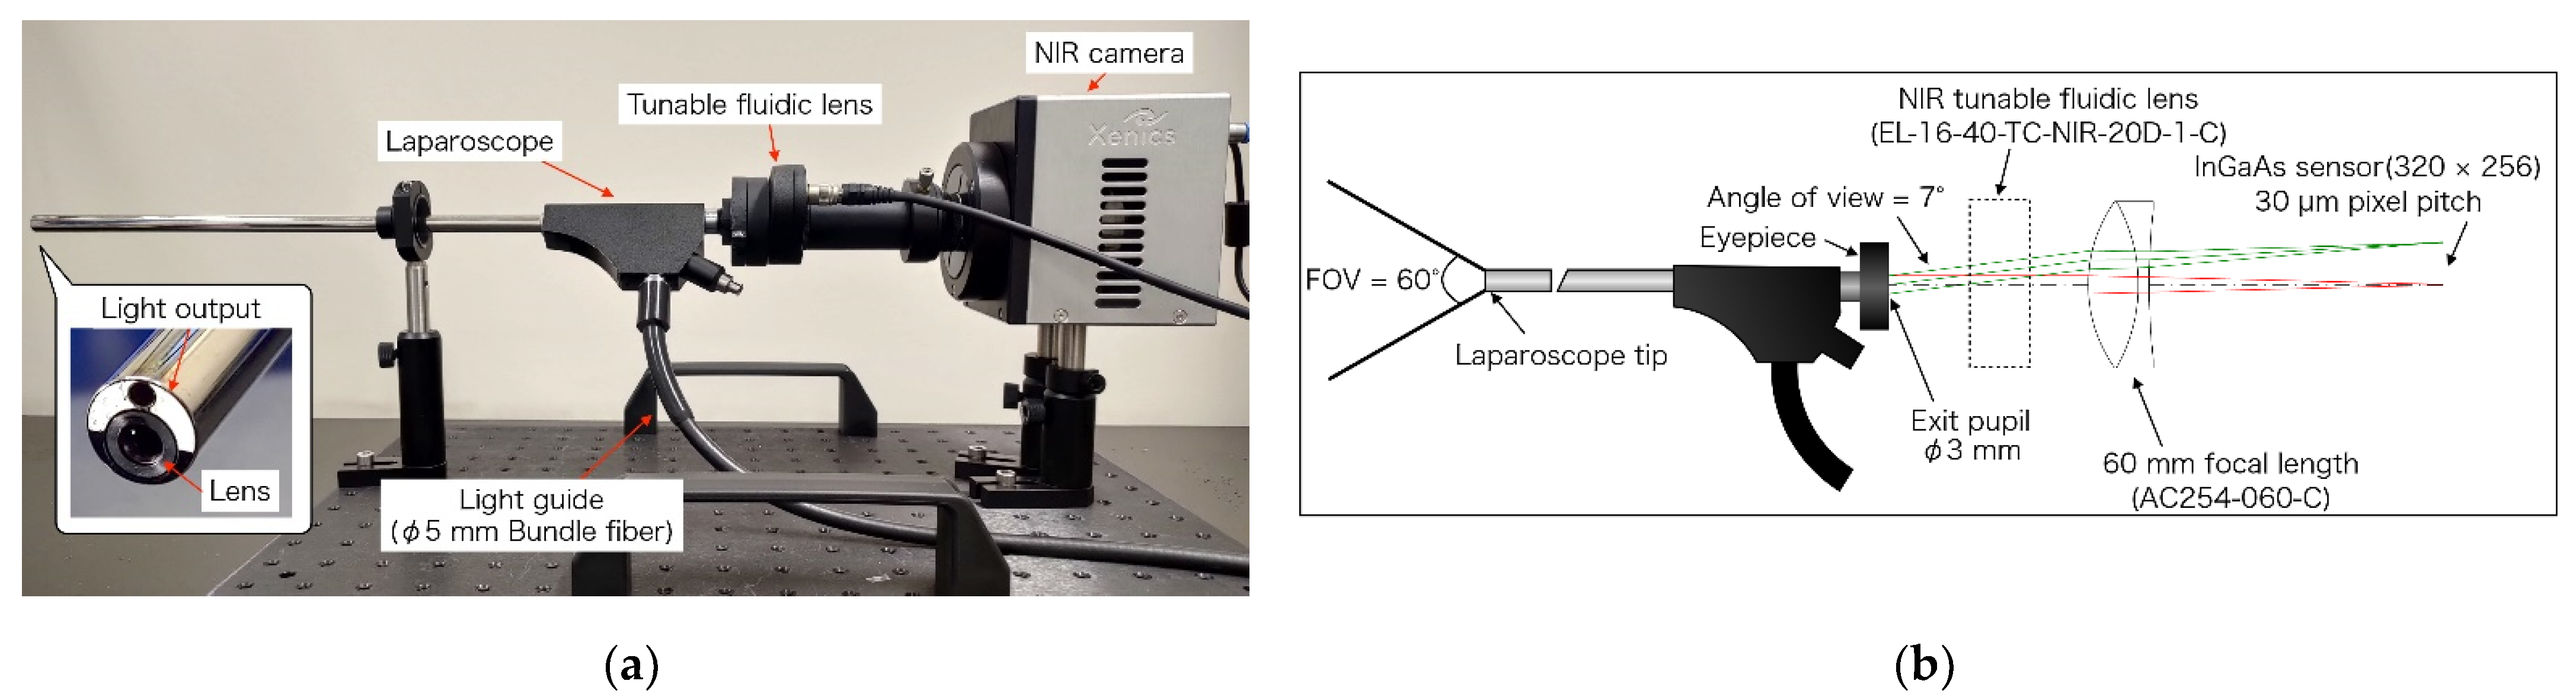
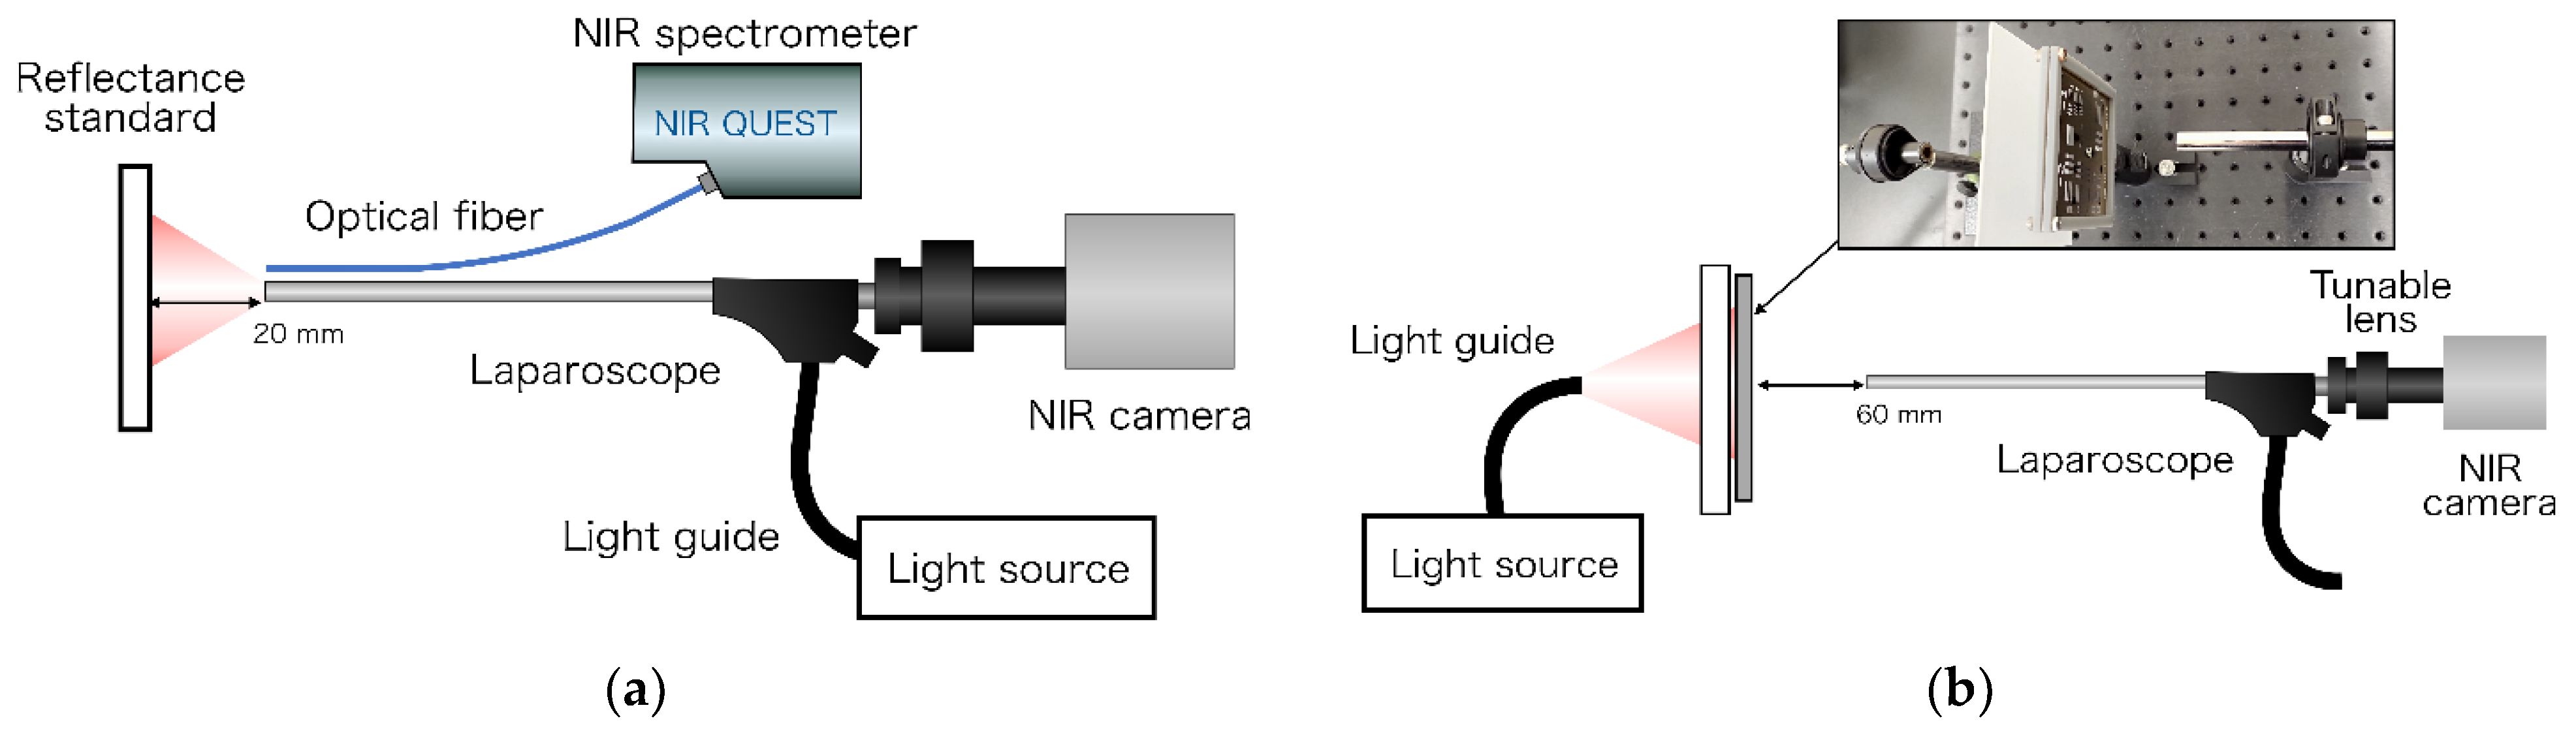
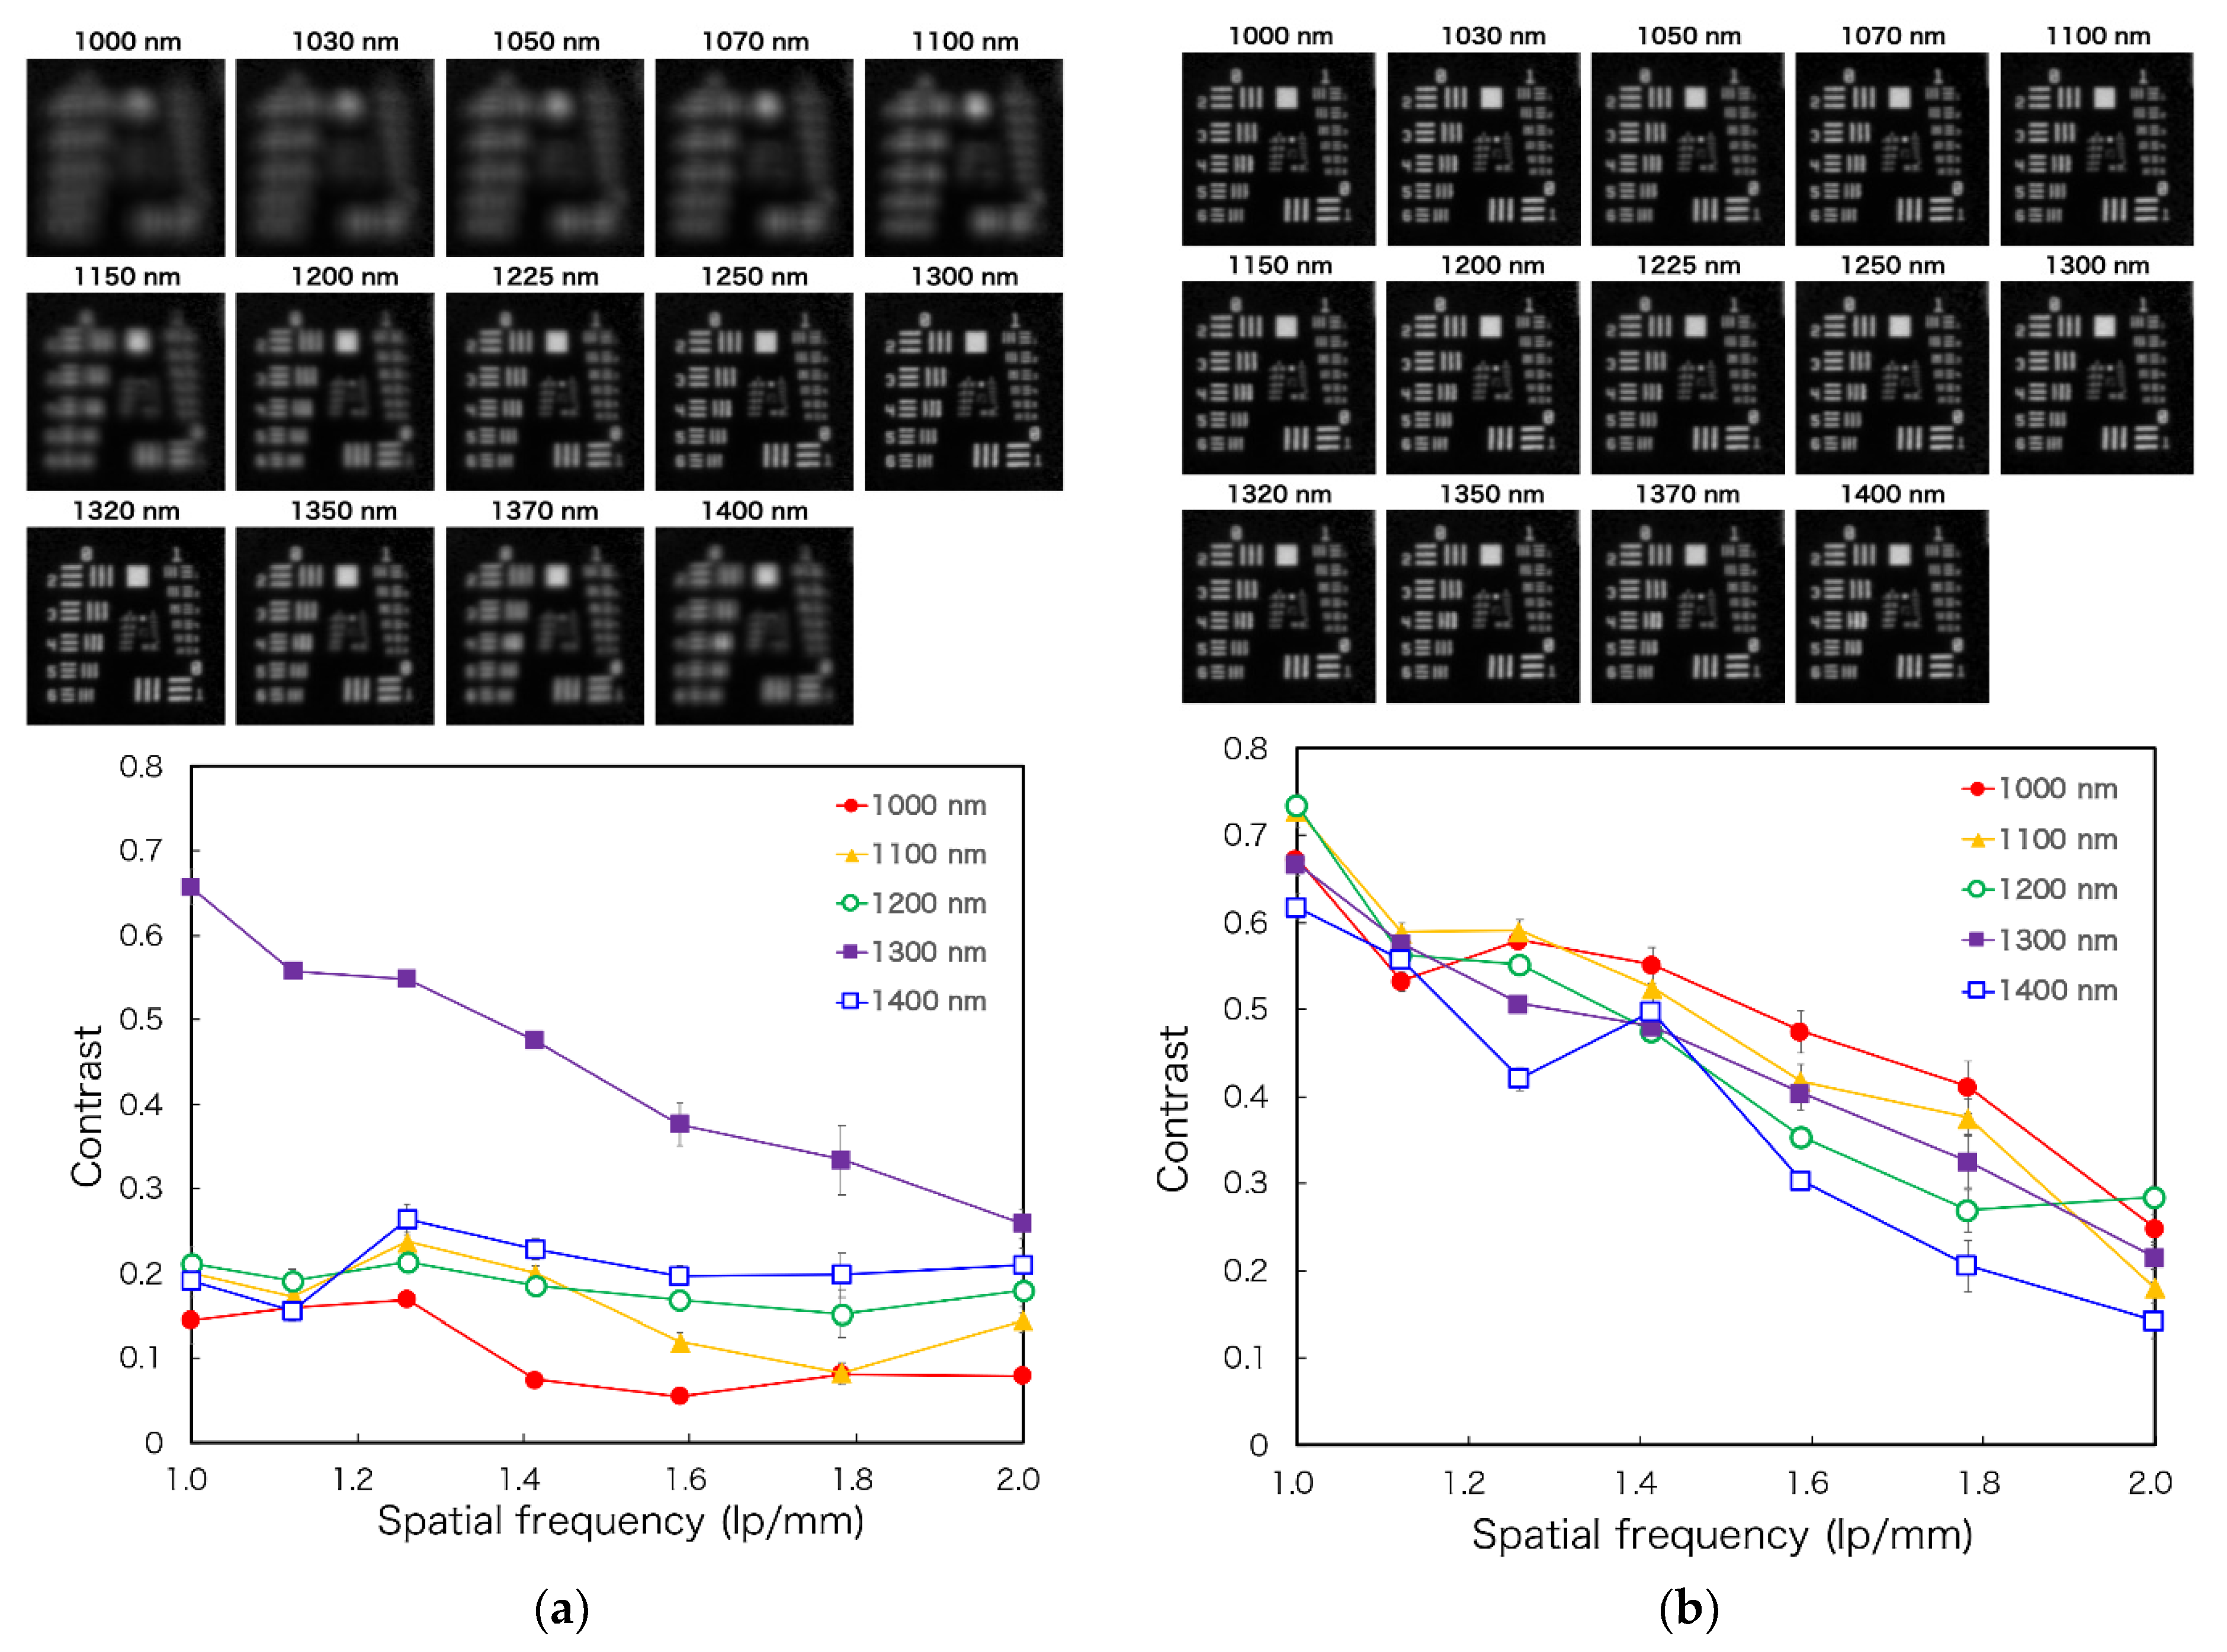
2.2. Properties of the Laparoscope and Light Source

The spectral characteristics of the developed light source at 14 wavelengths were confirmed using a 99% reflectance standard (SG3052, SphereOptics GmbH, Herrsching, Germany) placed at 20 mm from the tip of the laparoscope. Subsequently, the spectrum was measured using an NIR spectrometer (NIRQuest512-2.2, Ocean Photonics, Tokyo, Japan), as shown in Figure 3a.
The resolution using the developed laparoscopic OTN-NIR imaging device was evaluated using a 1951 USAF resolution chart (R3L3S1N, Thorlabs) placed at 60 mm from the laparoscope tip. Illumination was provided from outside to ensure even lighting. This light transilluminated a 100 × 100 mm N-BK7 ground glass diffuser (DG100X100-220, Thorlabs, Newton, NJ, USA) onto which the resolution chart was placed. The contrast for each element of the USAF resolution chart was calculated using the Michelson contrast formula, as follows [24]:
C o n t r a s t   =   I m a x I m i n I m a x + I m i n
where I m a x and I m i n represent the highest and lowest pixel intensity values of the adjacent bars within an element, respectively.

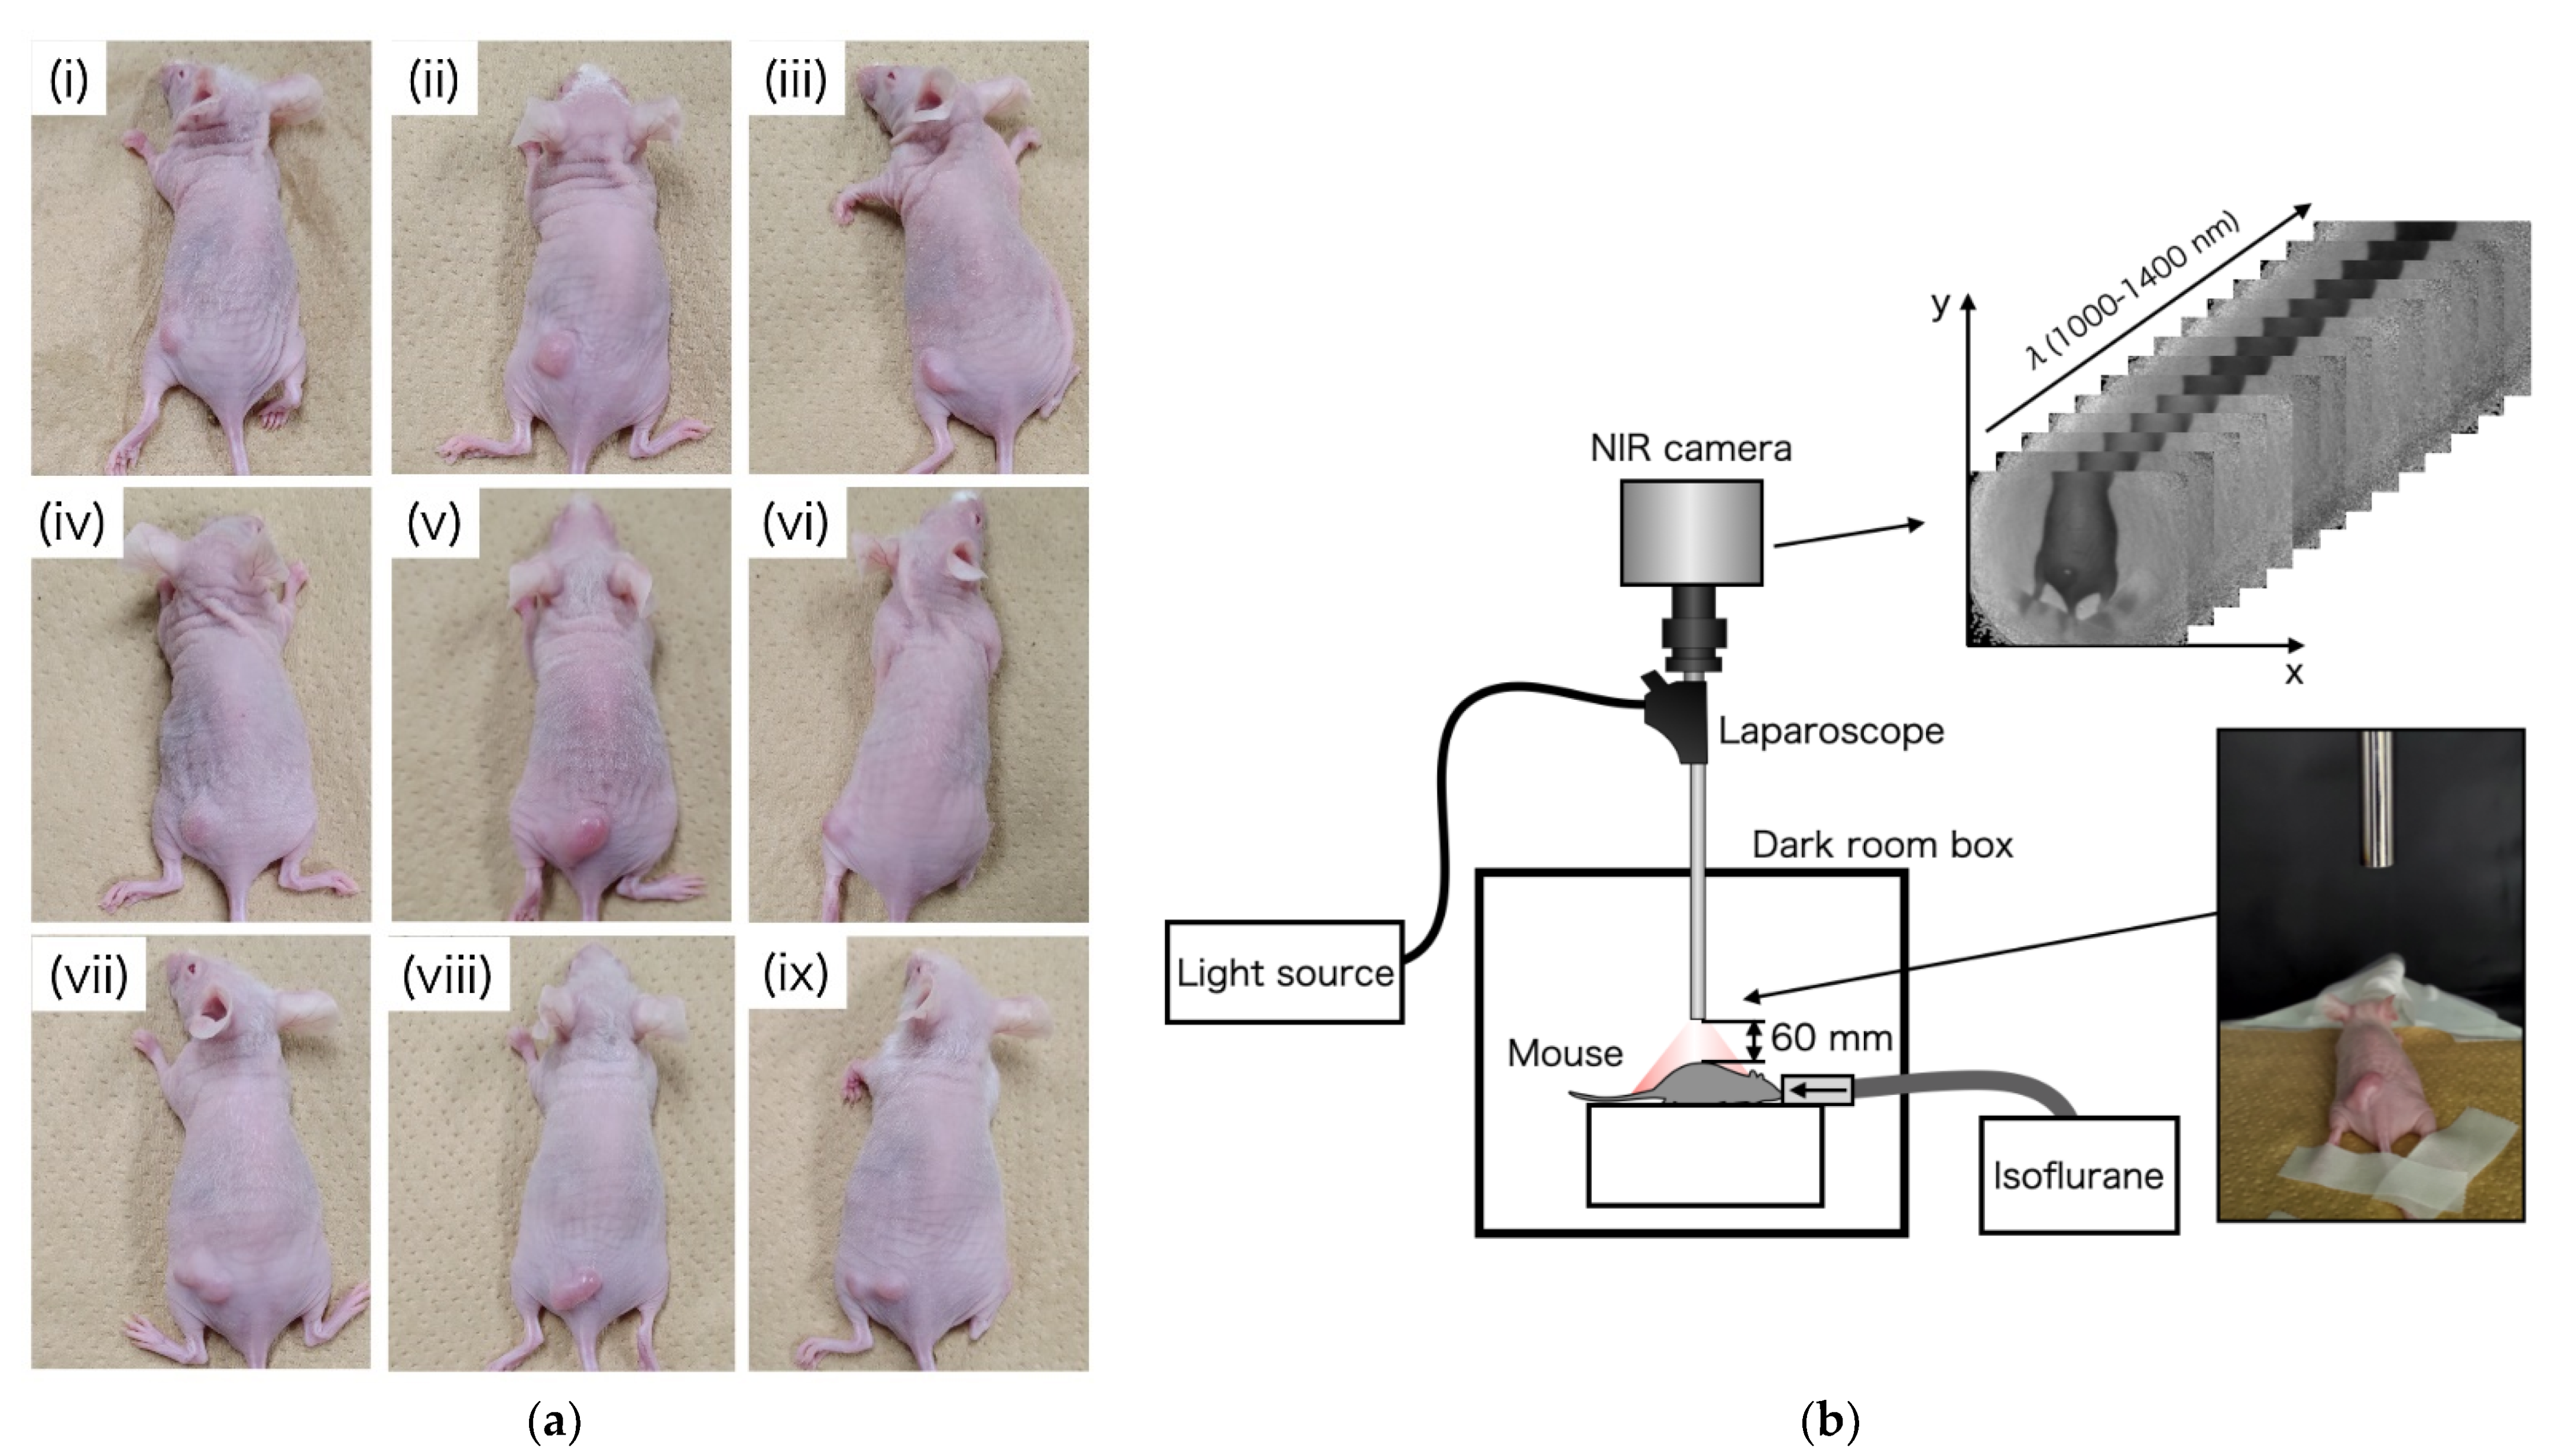
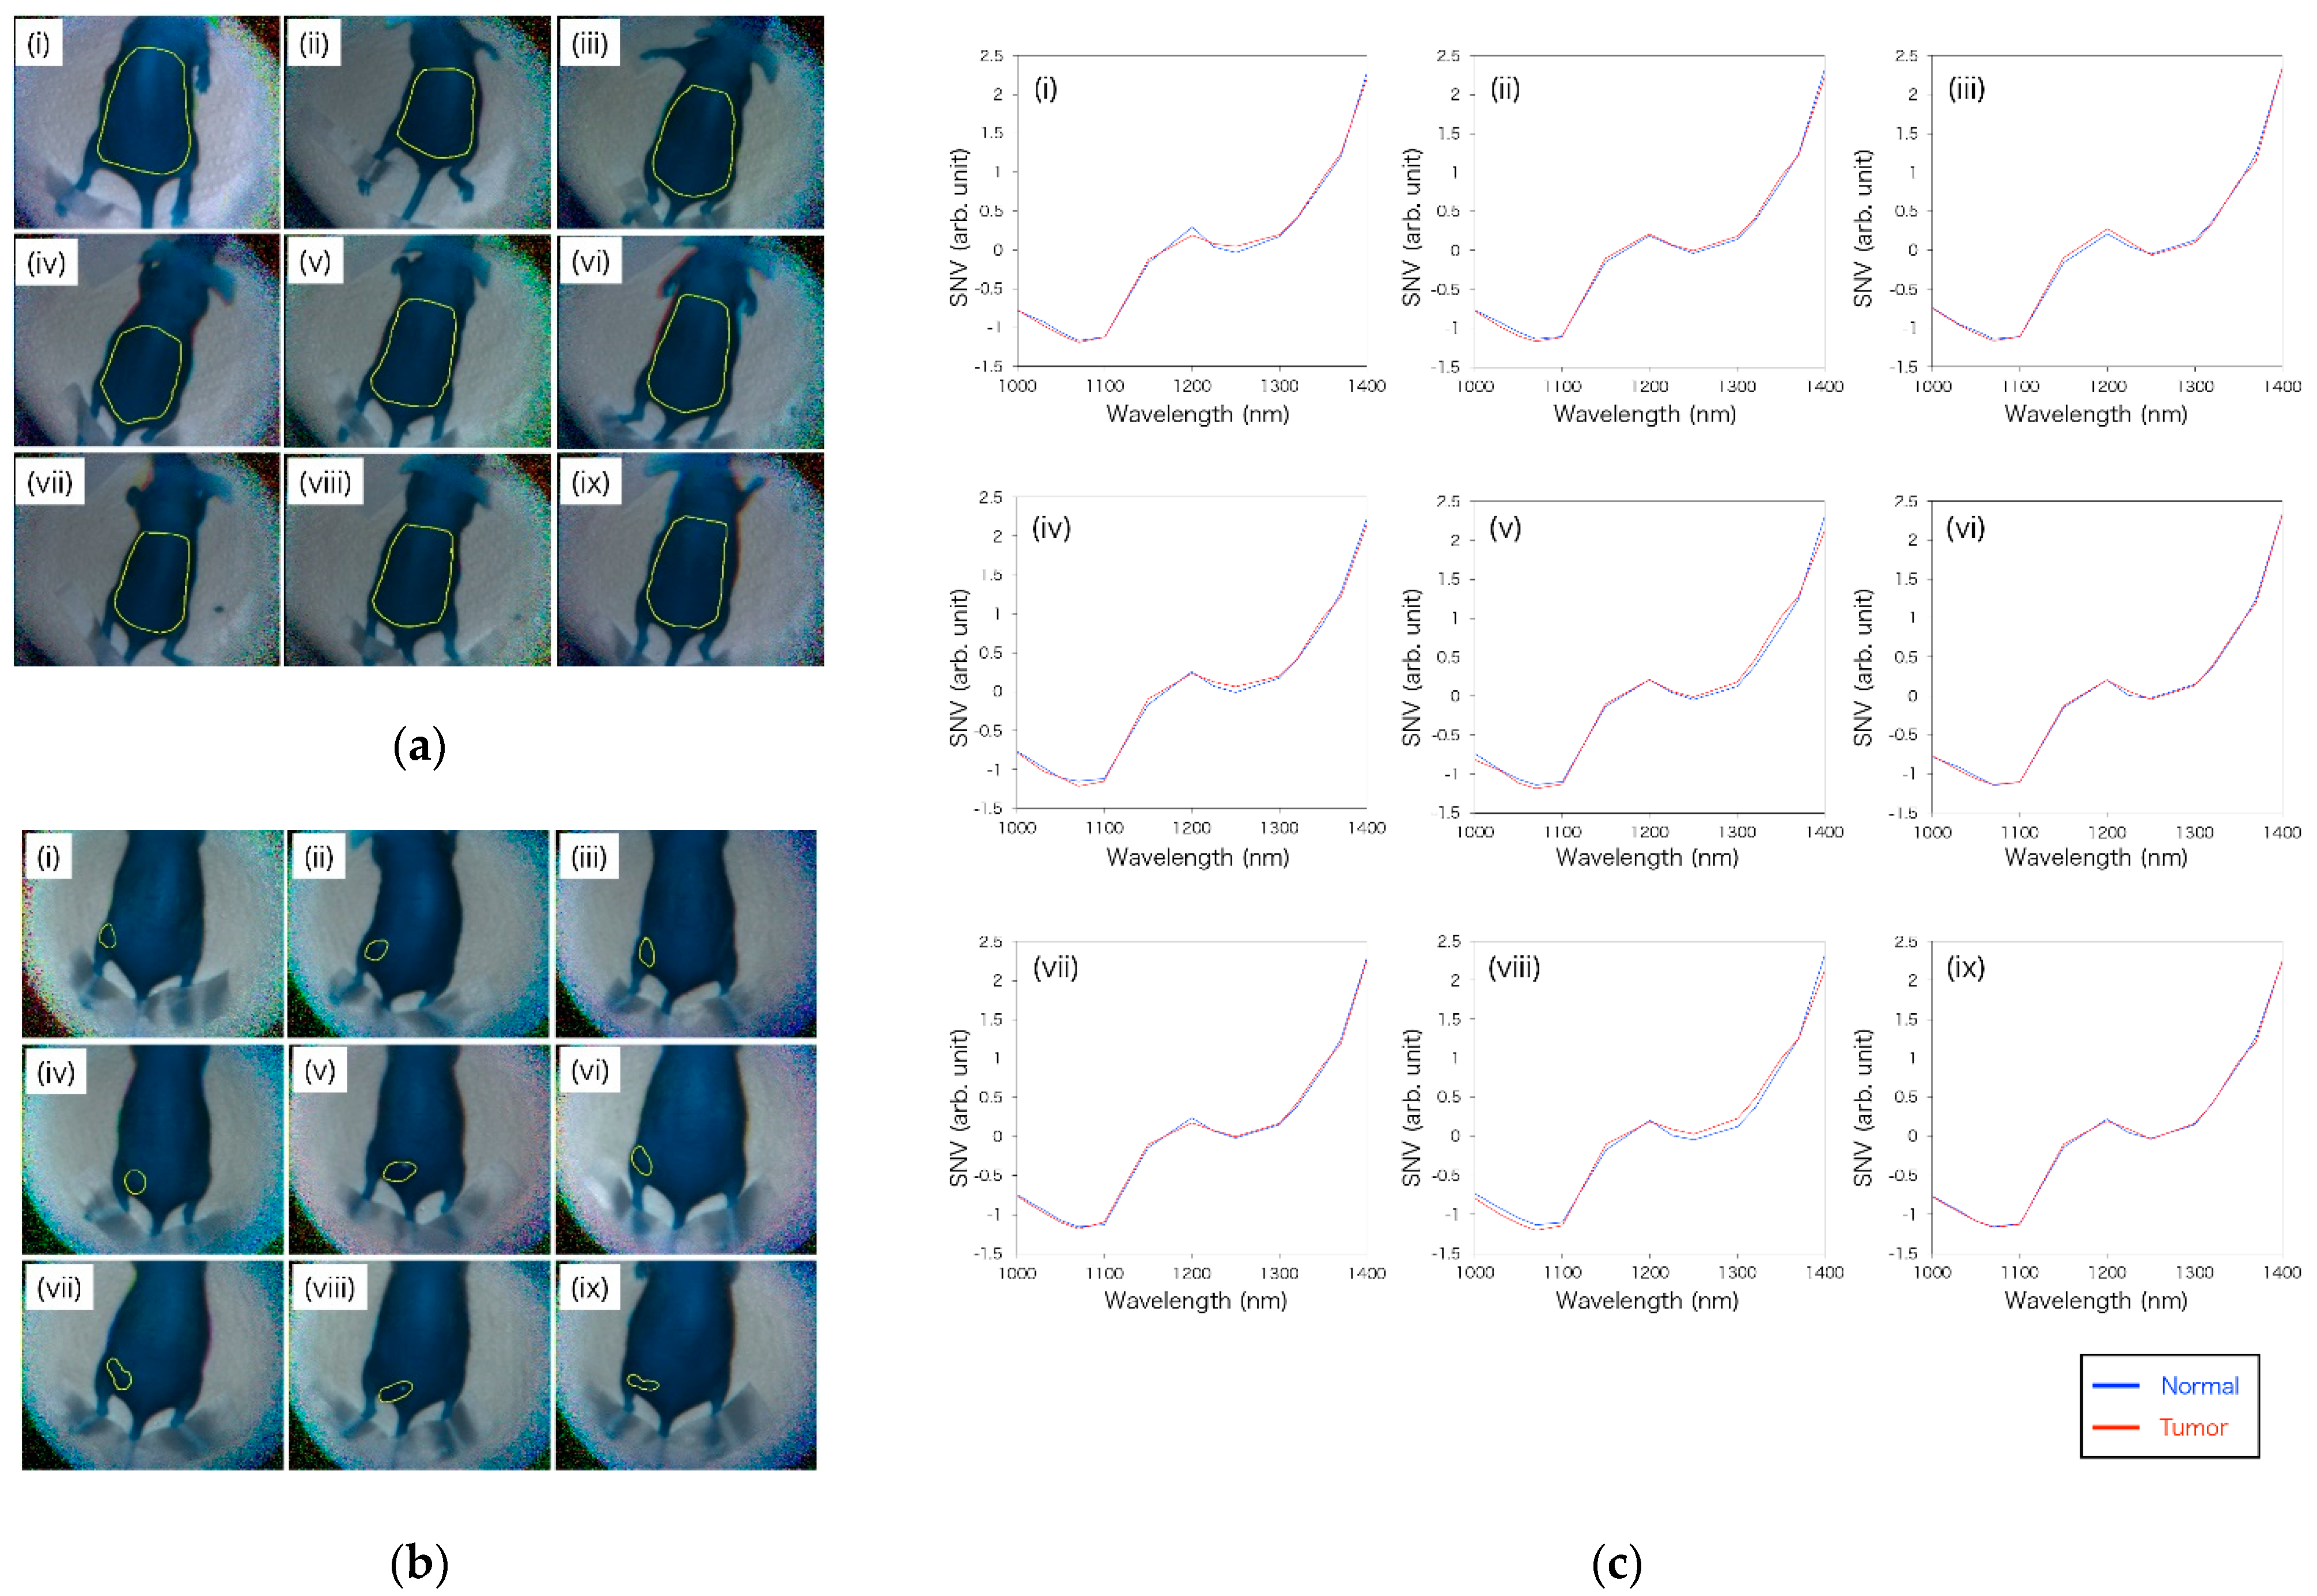
2.3. OTN-NIR Multispectral Imaging for Live Mouse

To prepare tumor-bearing mice, HT29 human colon cancer cells (ATCC HTB-38) were cultured in Roswell Park Memorial Institute medium (RPMI 189-02025, FUJIFILM Wako Pure Chemical Corporation, Osaka, Japan) supplemented with 10% fetal bovine serum (FBS 10270-106, Gibco) and 1% penicillin/streptomycin (161-23181, FUJIFILM Wako Pure Chemical Corporation). All cells were maintained at 37 °C and 5% CO2 in a humidified incubator. HT29 cells (1 × 10⁷) were implanted in the left waist of nine female BALB/c-nu nude mice at 6 weeks of age (Charles River Laboratories Japan, Inc., Kanagawa, Japan). Mice 14 days after cancer implantation are shown in Figure 4a.
In this study, OTN-NIR multispectral imaging under a laparoscope was performed in a dark box, as shown in Figure 4b. The OTN-NIR multispectral images were captured for the live mice before tumor implantation and 14 days post-implantation. The distance between the tip of the laparoscope and the mouse was 60 mm. All procedures and protocols were approved by the Animal Care and Use Committee of the National Cancer Center (K19-016).

2.4. Data Processing

It was necessary to calibrate images from the dark noise and white standard in each pixel ( i , j ) to analyze each mouse image. Moreover, in this study, each reflectance was converted to absorbance. The calibration was performed as follows:
A ( i , j ) = log 10 ( I r ( i , j ) I d ( i , j ) I w ( i , j ) I d ( i , j ) )
where A ( i , j ) is the row vector of the absorbance spectrum for the obtained image, and I r ( i , j ) , I w ( i , j ) , and I d ( i , j ) are row vectors of raw data, white standard data, and dark data, respectively. When I w ( i , j ) I d ( i , j ) was lower than zero, the pixel was excluded from the calculation. Because the pixel data had a 12-bit depth resolution (0–4095), the exposure time was set such that the maximum value of I w ( i , j ) was approximately 90% of the dynamic range (4095) at each wavelength.
In NIR spectral measurements, variance such as non-specific scatter occurs on the surface of the sample. In this regard, the variance is reduced using the standard normal variate (SNV) for baseline correction of the spectrum as follows:
Z ( x ) = x mean ( x ) std ( x )
where x is a row vector containing the original spectrum, mean(x) is the mean of x, std(x) is the standard deviation of x, and Z ( x ) denotes the SNV-transformed spectrum. In this study, A ( i , j ) was assigned to x.

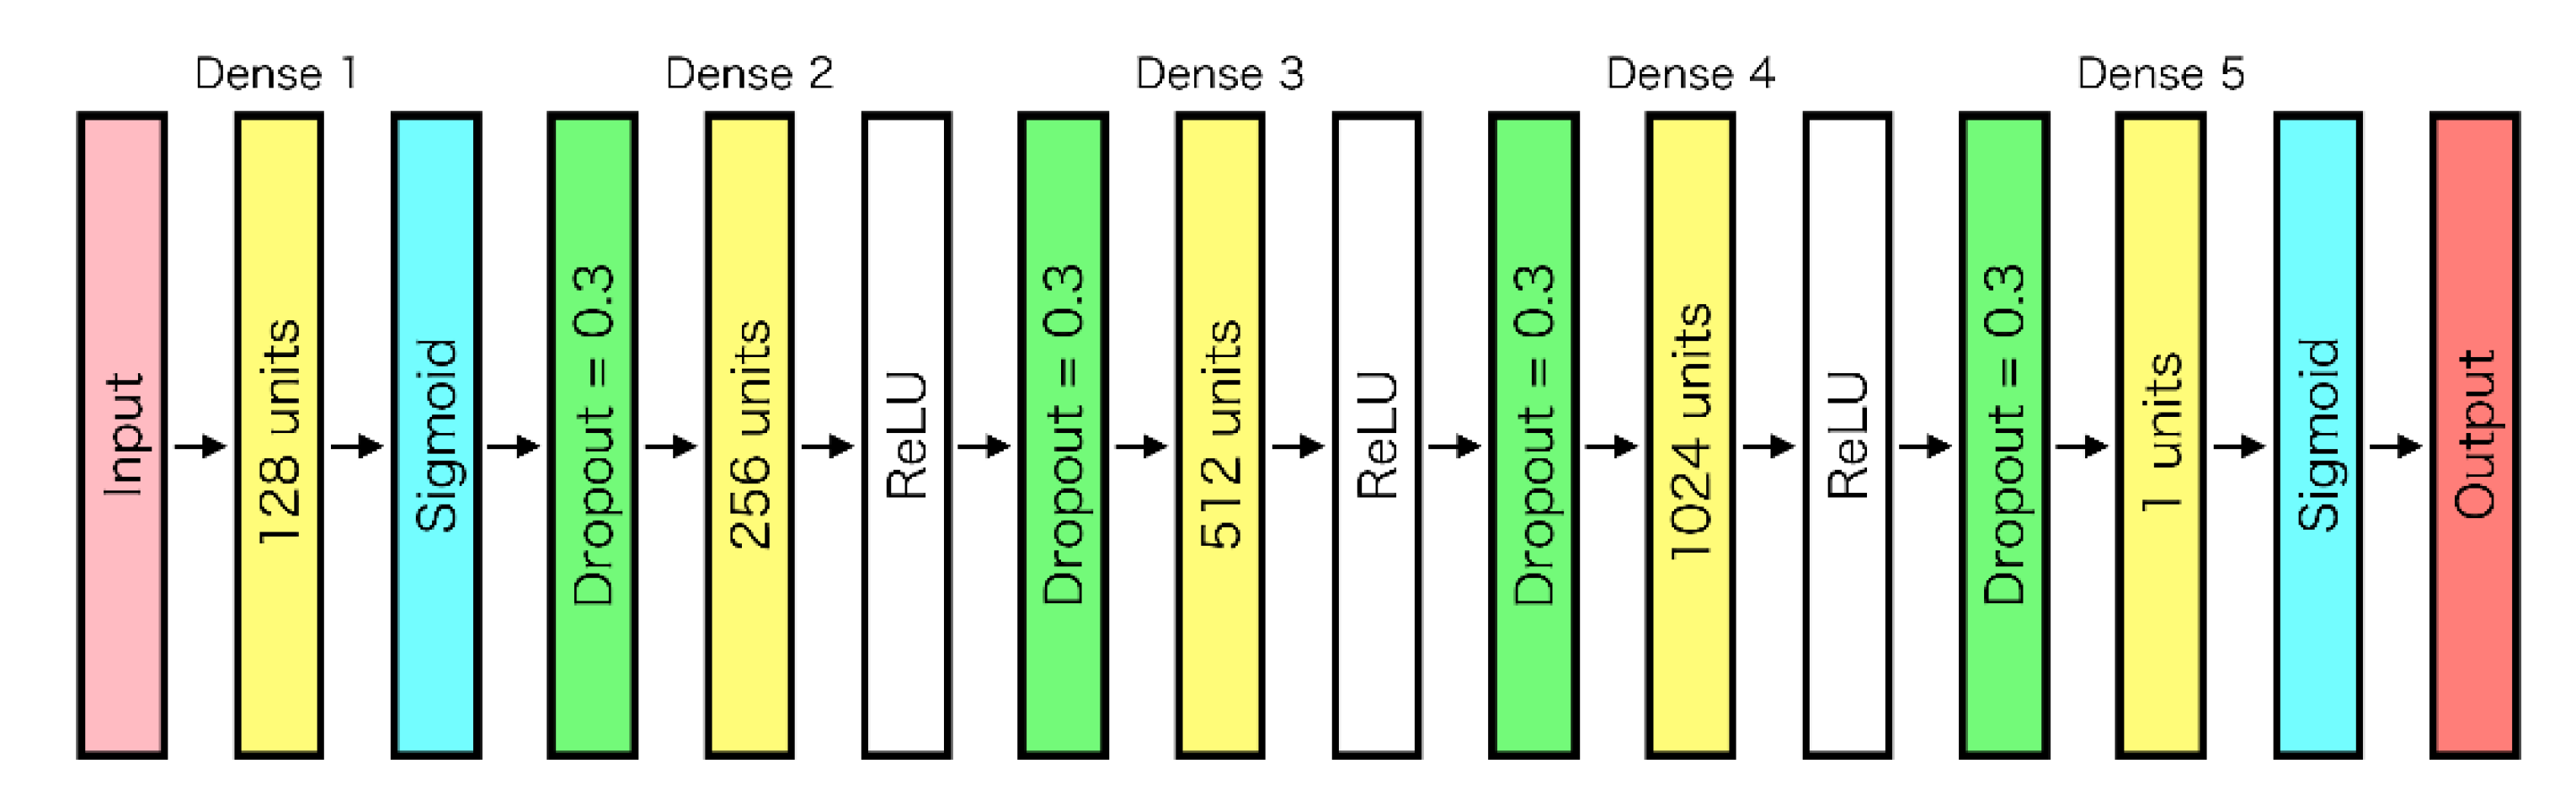
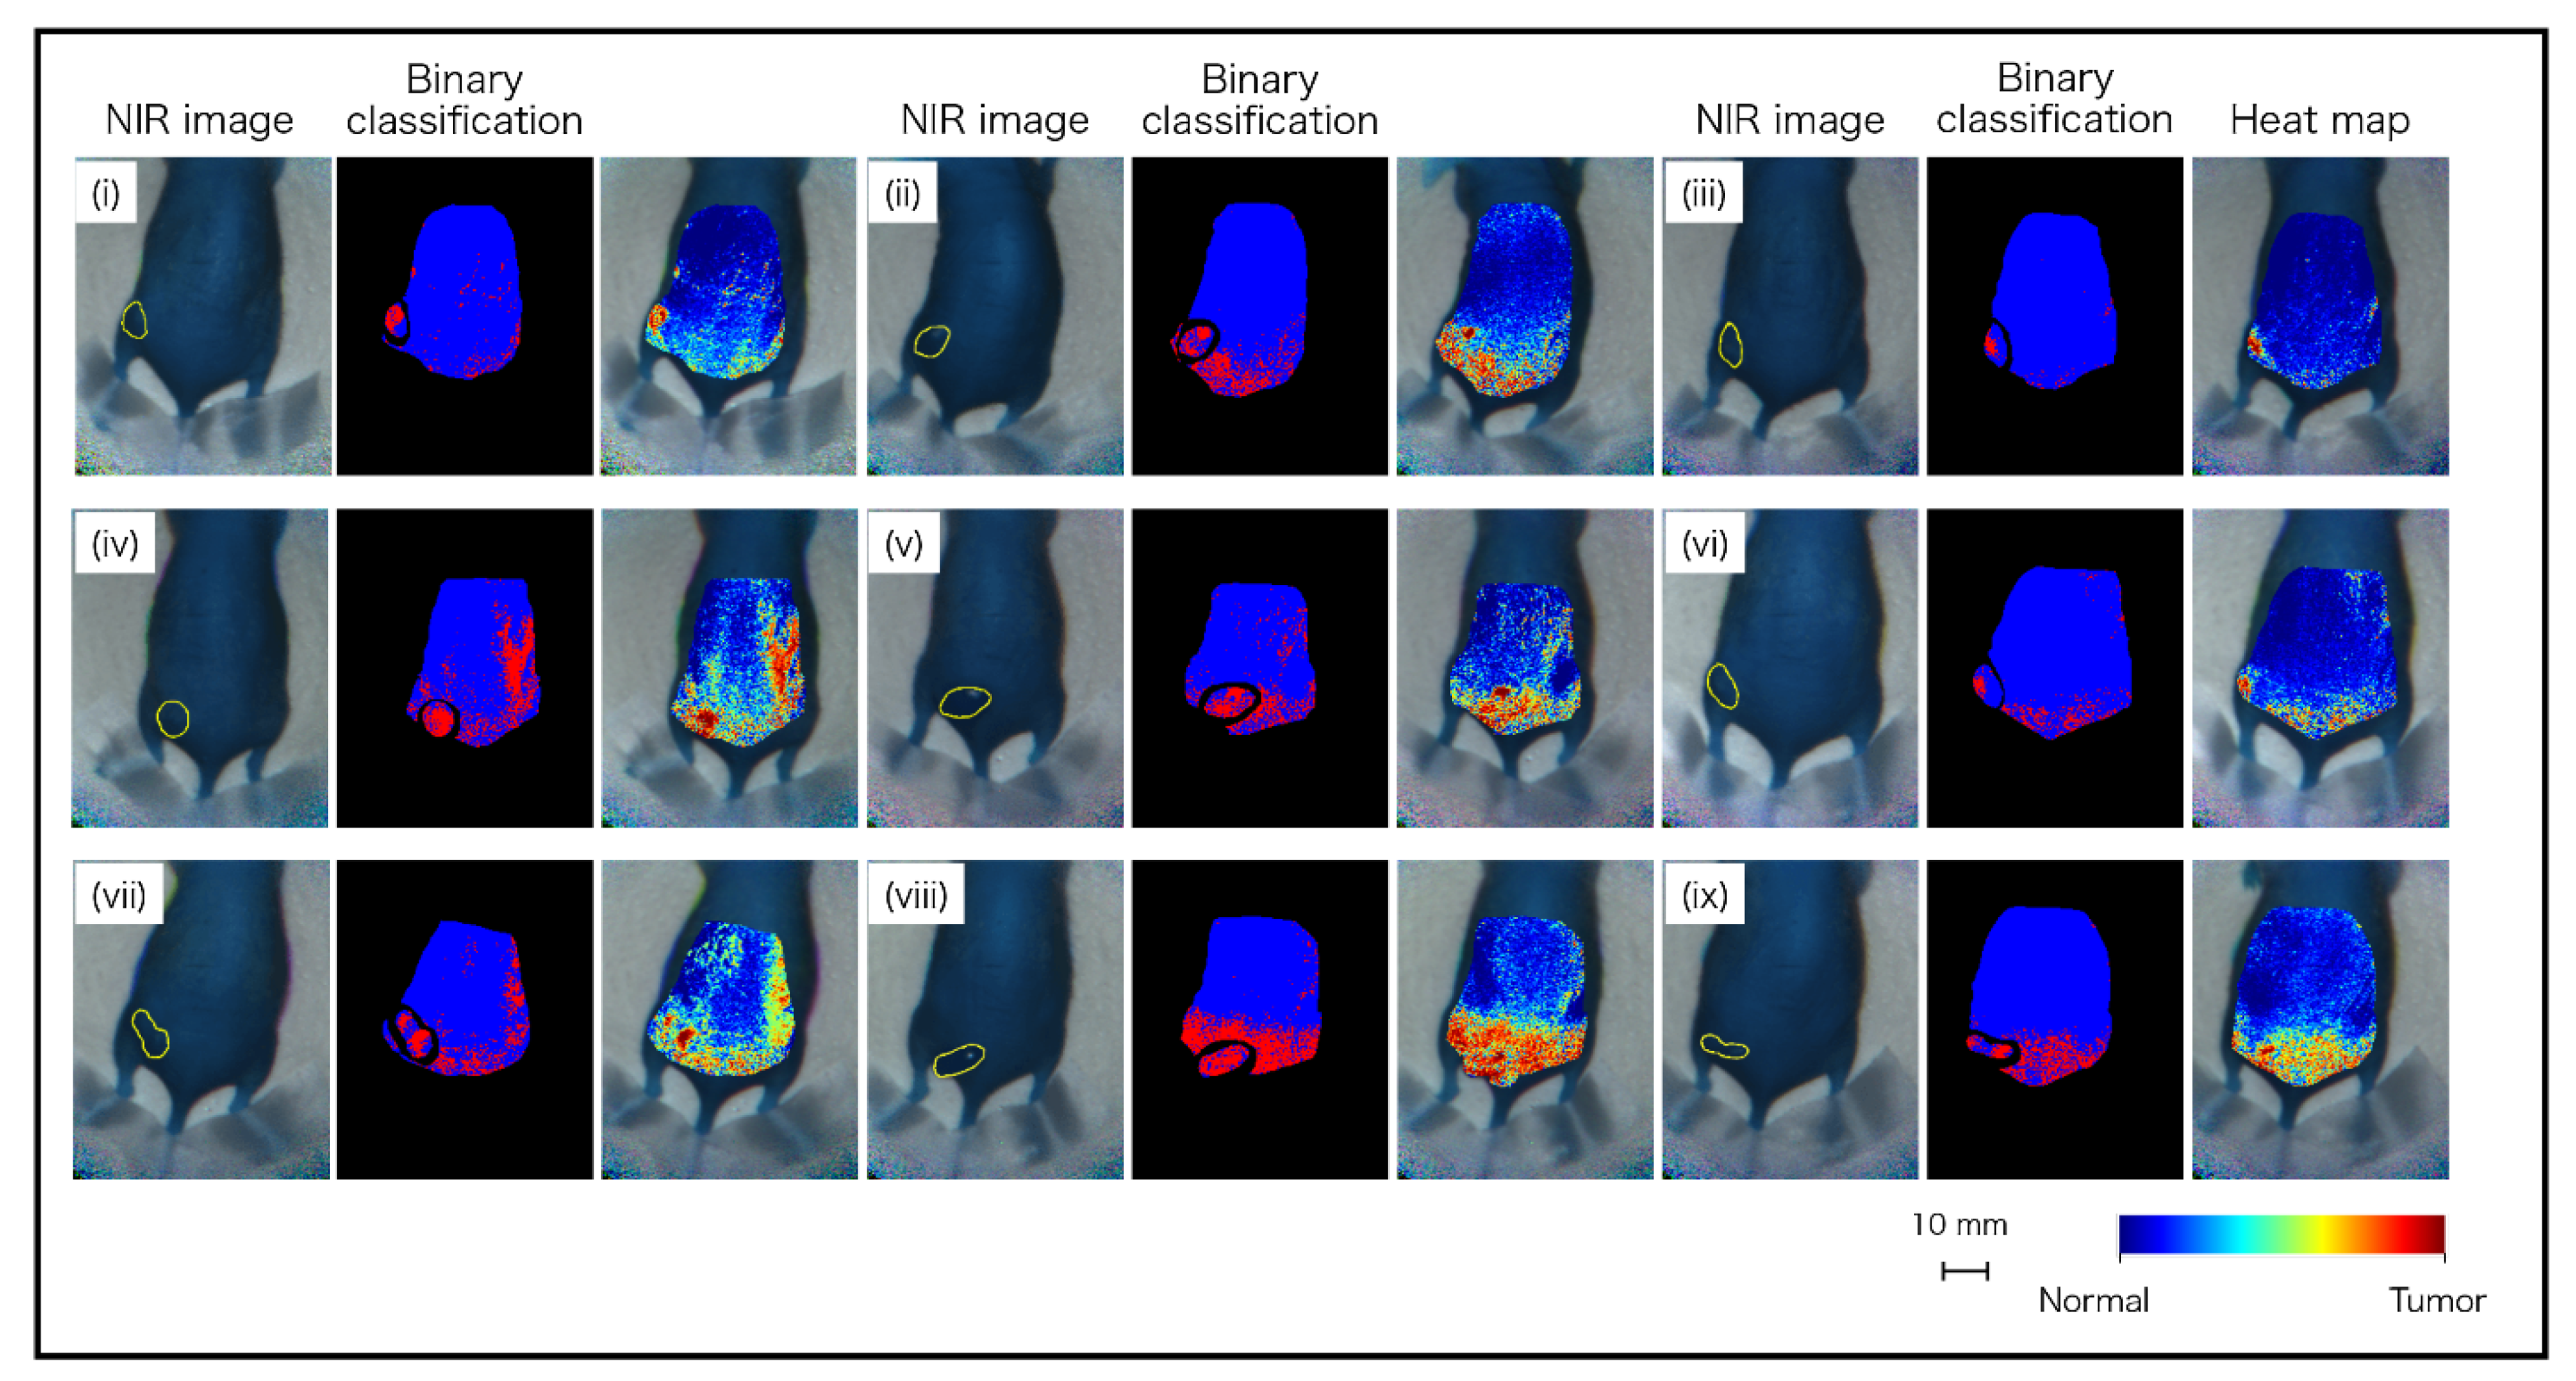
2.5. Classification Algorithm

In this study, an artificial neural network with a dense multilayer was employed to identify tumors from OTN-NIR MSI data [25,26]. Each unit in a particular layer was connected to all the units in the next layer. The input value z j of the j th unit was calculated by adding the bias b j to the sum from 1 to the i th of the values, which is the multiplication of the output values x i and the corresponding weight w i j as follows:
z j = i = 1 m w i j x i + b j
where z j represents the input to the activation function, and the response is the output of the unit. As the activation function, the sigmoid and Rectified Linear Unit (ReLU) functions were used as follows:
σ ( z j )   =   1 1 + e z j
R ( z j ) =   max ( 0 , z j )
As updating weights, the backpropagation method was used to train the neural network as follows:
w i , j k 1 , k = η E w i , j k 1 , k  
where w i , j k 1 , k is the weight between the i th unit in the ( k 1 ) th layer and the j th unit in the k th layer, E is the error function, and η is the learning rate.
To suppress overlearning, a dropout process was applied to all layers except for the final layer. Adam was used as the optimization function. The structure of the neural network used in this study is shown in Figure 5. Because the final output value indicates the probability of discrimination as “tumor” from the multispectral input data of a pixel, the prediction results were displayed as binary classification with 60% of the cutoff value and heat map.
In this study, multispectral imaging data were extracted from the region of the back to the waist in mice before tumor implantation as “normal” teaching data. Multispectral imaging data of the tumor area were defined by medical experts and were extracted from mice 14 days after tumor implantation as “tumor” teaching data. To classify “normal” and “tumor”, leave-one-out cross-validation was employed. In this procedure, the pixels of a mouse were classified by data sets of eight mice built as teaching data. This procedure could provide an unbiased estimate of generalization ability.
The prediction accuracy was evaluated by classifying the pixels into four groups, namely: tumor predicted as tumor (true-positive: TP), tumor predicted as normal (false-negative: FN), normal predicted as tumor (false-positive: FP), and normal predicted as normal (true-negative: TN). From the classified pixels, the specificity, sensitivity, and accuracy can be calculated as follows:
Specificity   ( % ) = TN FP + TN × 100 ,
Sensitivity   ( % ) = TP TP + FN × 100 ,
Accuracy   ( % ) = TP + TN TP + TN + FP + FN × 100.
For binary classification of pixels in tumor-implanted mice, it was challenging to draw a correct boundary between the tumor and the normal areas. Therefore, the pixels that could be defined as tumor or normal were extracted, and the binary classification’s image, specificity, sensitivity, and accuracy were derived.

3. Results and Discussion

First, the NIR light transmitted through each of the 14 bandpass filters was detected by spectroscopy to validate the specifications of the filters. The results of the spectroscopy of the reflected light from the standard reflector are shown in Figure 6. Each bandpass filter was confirmed to perform as in the specifications. The system with these filters is available as the light source for MSI in the OTN-NIR wavelength range.
The 1951 USAF resolution chart images for each wavelength were captured to evaluate the spatial resolution of the developed laparoscopic NIR imaging device, with or without a tunable lens. From these images, the contrast of each wavelength can be calculated. These images and the calculated contrasts are shown in Figure 7a,b. According to the Rayleigh criterion, line pairs can be considered resolved if the contrast value is higher than 0.26 [27]. Although the images are focused on around 1300 nm without the tunable lens, the tunable lens setup could focus on 14 wavelengths. Moreover, the results show that the image can be resolved up to 1.6–2.0 lp/mm at 1000–1400 nm wavelengths using the tunable lens. In future, custom-made achromatic lenses may be used to address the wavelength irregularities; however, this may present disadvantages for the laparoscopic application of MSI because the number of lenses and weight will increase, and the light intensity will decrease. In contrast, although the angle of view of the tunable lens needs to be corrected for each wavelength, it has the potential to be used for laparoscopic short-wavelength IR (SWIR) MSI, which has a broader range of wavelengths because it can correct the focus shift with a single lens.
Through the 14-wavelength filter, the mice before and 14 days after implantation of the tumor could be captured by OTN-NIR MSI with live imaging. In this imaging, the average exposure time of each wavelength was 46 ms. Figure 8a,b shows the OTN-NIR pseudo-color images (B: 1000 nm, G: 1200 nm, R: 1400 nm) of each mouse with the boundaries of the pixels used in the normal and tumor datasets. In Figure 8c, the average SNV-processed spectra of normal or tumor datasets are shown. In this study, no pixels with I w ( i , j ) I d ( i , j ) lower than zero in the region of interest (ROI) were present. Although all the absorption spectra in Figure 8c show a similar shape, they also show differences between the normal and the tumor pixels at approximately 1070, 1250, and 1400 nm. This indicates that the OTN-NIR absorption spectra likely include tumor-specific information.
Based on these datasets, machine learning was performed using neural networks. The discrimination results of the nine mice are shown in Figure 9. It was visually apparent that the pixels identified as “tumor” and “normal” were aggregated in the tumor and normal areas, respectively. However, there were also some FP and FN pixels. In particular, various FP pixels were observed between the waist and tail. It is considered that the spectrum was similar between the tumor and waist, as the tumor was in the waist region. As shown in the heatmap diagram in Figure 9, although there were red level pixels that were false-positive, there was a tendency for a large amount of red level pixels to be in the tumor area and a small number of red level pixels in the normal area. In the analyzed results, total pixels (102,420 px) were classified as follows: TP, 2629 px; FN, 2287 px; FP, 10,212 px; and TN, 87,292 px. From the classified pixels, the specificity, sensitivity, and accuracy were calculated as 89.5%, 53.5%, and 87.8%, respectively. The results are listed in Table 2.
In this study, although aggregated TP pixels were visually recognized and confirmed in all tumor-implanted mice, identification of tumor-implanted mice showed lower sensitivity than hyperspectral imaging in previous studies [28]. The reasons for these results are considered to be the following: (i) As the imaging time exceeded the order of seconds, there were blurred pixels in the merged multidimensional image due to breathing and heartbeat. (ii) The data set size was lower than that of the previous study because of the smaller number of mice and small ROI. (iii) Because the illumination was non-uniform compared with that of the conventional method, more pixels of halation and dark shadows were included. (iv) Although the previous study used an NIR wavelength of 256 bands, the most specific absorption wavelengths for tumor discrimination were different because only 14 wavelengths were used in this study.
As for the above, future prospects are considered as follows: (i) The time required for imaging was long because the filter change was done manually. By automating the filter change, the total imaging time could be shorter than that in this study. (ii) The proposed improvements noted above enable image capture at high speeds; thus, several sample images with various magnifications could be acquired. (iii) A suitable FOV for identification could be created by imaging from various angles, and halation and dark shadow could be decreased by changing the arrangement of the illumination at the tip of the laparoscope. (iv) The valuable wavelengths for the identification of tumors could be selected from NIR-HSI data using resected specimens. In this study, OTN-NIR MSI was investigated using commercially available filters via straightforward construction; however, spectral images with high wavelength resolution could be obtained by adopting an acoustic tunable filter (AOTF) and a liquid crystal tunable filter to select the wavelength before imaging or light output [21,29,30]. In particular, a combination of an AOTF and a supercontinuum light source is promising because high power output and fast wavelength switching can be obtained. (v) In addition to the points mentioned, although a neural network was used as a machine learning method in this study, other methods such as support vector machine and principal correlation analysis have been proposed to identify lesions [11]. The identification accuracy may be improved by investigating the optimal algorithm.
Although the subcutaneous tumor model of mice was adopted because it was straightforward to handle the tumor implantation, the overall sensitivity was low, and two out of nine samples showed a sensitivity below 30%. The conceivable reasons are that light scattering by the skin, which has a complex structure such as hair follicles, resulted in the inclusion of the spectra disruption through the skin in all tumor data. In addition, because it was difficult to make the conditions uniform for the specimens (e.g., tumor size and contrast of subject), it may be observed that the identification ability was low in some samples that included individual differences. In contrast, gastrointestinal tissue composed of smooth muscle may be a suitable target for spectral imaging because it has a simpler structure than skin and shows less optical scattering [31]. Therefore, the proposed device is expected to be applied to the gastroenterological field. In particular, there is a demand in medical applications to visualize the location of invisible digestive tract cancer from the serous membrane side during laparoscopic surgery. Previous studies have indicated that tumors existing under normal tissue in the stomach could be distinguished by high sensitivity, specificity, and accuracy at four wavelengths [17,19]. Thus, the analysis of resected digestive tract cancer specimens by NIR-HSI on the serous side is underway. By determining the effective wavelengths for cancer detection, processing techniques such as those used for tissue oxygen saturation may be applied [32,33]. Therefore, laparoscopic OTN-NIR MSI has the potential to enable cancer detection in deep regions during surgery.

4. Conclusions

In this study, we developed a laparoscopic imaging device and a wavelength-selectable light source to perform OTN-NIR MSI, which was performed on nine live mice before and after tumor implantation. The images of tumor-implanted mice were classified using normal and tumor pixel datasets using a neural network. As a result, pixels of subcutaneous tumors were distinguished without opening the skin. The specificity, sensitivity, and accuracy were 89.5%, 53.5%, and 87.8%, respectively. This is the first report demonstrating the classification of living tissues with OTN-NIR MSI under laparoscopy. Therefore, this study serves as a preliminary step in clinical research on laparoscopic OTN-NIR MSI for future use by optimizing the algorithm and imaging conditions.
In future, the use of a high-resolution NIR camera and light source that can select wavelengths automatically will enable the acquisition of a large amount of OTN-NIR MSI data at high speed. Therefore, the device may realize higher discrimination accuracy. In addition, the device is expected to be used in various situations, such as laparoscopic surgery.

Author Contributions

Conceptualization, T.T., H.I., H.Y., K.S. and H.T.; methodology, T.T., H.I., H.Y., K.S., K.T. and H.T.; software, T.T., K.A. and H.T.; validation, T.T., Y.K., K.A., R.I. and Y.E.; formal analysis, T.T. and H.T.; investigation, T.T., Y.K., K.A., R.I. and Y.E.; resources, T.T, H.I., H.T.; data curation, T.T., K.O., M.U., H.I., H.Y., K.S. and H.T.; writing—original draft preparation, T.T.; writing—review and editing, K.O., M.U., H.I., H.Y., K.S., D.S., T.K. (Tomohiro Kadota), T.M., T.K. (Takeshi Kuwata) and H.T.; visualization, T.T.; supervision, T.T.; project administration, H.I., H.Y., K.S. and H.T.; funding acquisition, T.T, H.I., H.T. All authors have read and agreed to the published version of the manuscript.

Funding

This research was funded by the National Cancer Center Research and Development Fund Grant Number 31-A-11 and 2021-s-2 and Grant-in-Aid for Scientific Research(B) Grant Number 21H03844.

Institutional Review Board Statement

All procedures and protocols were approved by the Animal Care and Use Committee of the National Cancer Center (K19-016).

Informed Consent Statement

Not applicable.

Data Availability Statement

The data presented in this study are available on request from the corresponding author.

Conflicts of Interest

The authors declare no conflict of interest.

References

  1. Sung, H.; Ferlay, J.; Siegel, R.L.; Laversanne, M.; Soerjomataram, I.; Jemal, A.; Bray, F. Global cancer statistics 2020: GLOBOCAN estimates of incidence and mortality worldwide for 36 cancers in 185 countries. CA Cancer J. Clin. 2018, 68, 394–424. [Google Scholar] [CrossRef]
  2. Hashimoto, D.A.; Rosman, G.; Rus, D.; Meireles, O.R. Artificial Intelligence in Surgery: Promises and Perils. Ann. Surg. 2018, 268, 70–76. [Google Scholar] [CrossRef] [PubMed]
  3. Kitaguchi, D.; Takeshita, N.; Matsuzaki, H.; Hasegawa, H.; Honda, R.; Teramura, K.; Oda, T.; Ito, M. Computer-assisted real-time automatic prostate segmentation during TaTME: A single-center feasibility study. Surg. Endosc. 2020, 1–7. [Google Scholar] [CrossRef] [PubMed]
  4. Smith, A.M.; Mancini, M.C.; Nie, S. Second window for in vivo imaging. Nat. Nanotechnol. 2009, 4, 710–711. [Google Scholar] [CrossRef] [PubMed] [Green Version]
  5. Zako, T.; Yoshimoto, M.; Hyodo, H.; Kishimoto, H.; Ito, M.; Kaneko, K.; Soga, K.; Maeda, M. Cancer-targeted near infrared imaging using rare earth ion-doped ceramic nanoparticles. Biomater. Sci. 2014, 3, 59–64. [Google Scholar] [CrossRef] [PubMed]
  6. Okubo, K.; Kitagawa, Y.; Hosokawa, N.; Umezawa, M.; Kamimura, M.; Kamiya, T.; Ohtani, N.; Soga, K. Visualization of quantitative lipid distribution in mouse liver through near-infrared hyperspectral imaging. Biomed. Opt. Express 2021, 12, 823–835. [Google Scholar] [CrossRef] [PubMed]
  7. Ehlen, L.; Zabarylo, U.J.; Speichinger, F.; Bogomolov, A.; Belikova, V.; Bibikova, O.; Artyushenko, V.; Minet, O.; Beyer, K.; Kreis, M.E.; et al. Synergy of Fluorescence and Near-Infrared Spectroscopy in Detection of Colorectal Cancer. J. Surg. Res. 2019, 242, 349–356. [Google Scholar] [CrossRef] [Green Version]
  8. Rey-Barroso, L.; Burgos-Fernández, F.J.; Delpueyo, X.; Ares, M.; Royo, S.; Malvehy, J.; Puig, S.; Vilaseca, M. Visible and Extended Near-Infrared Multispectral Imaging for Skin Cancer Diagnosis. Sensors 2018, 18, 1441. [Google Scholar] [CrossRef] [PubMed] [Green Version]
  9. Lu, G.; Fei, B. Medical hyperspectral imaging: A review. J. Biomed. Opt. 2014, 19, 010901. [Google Scholar] [CrossRef]
  10. Yoon, J.; Joseph, J.; Waterhouse, D.J.; Luthman, A.S.; Gordon, G.S.D.; Di Pietro, M.; Januszewicz, W.; Fitzgerald, R.C.; Bohndiek, S.E. A clinically translatable hyperspectral endoscopy (HySE) system for imaging the gastrointestinal tract. Nat. Commun. 2019, 10, 1902. [Google Scholar] [CrossRef] [PubMed] [Green Version]
  11. Akbari, H.; Uto, K.; Kosugi, Y.; Kojima, K.; Tanaka, N. Cancer detection using infrared hyperspectral imaging. Cancer Sci. 2011, 102, 852–857. [Google Scholar] [CrossRef]
  12. Liu, Z.; Wang, H.; Li, Q. Tongue Tumor Detection in Medical Hyperspectral Images. Sensors 2011, 12, 162–174. [Google Scholar] [CrossRef] [Green Version]
  13. Baltussen, E.J.M.; Sterenborg, H.J.C.M.; Ruers, T.J.M.; Dashtbozorg, B. Optimizing algorithm development for tissue classification in colorectal cancer based on diffuse reflectance spectra. Biomed. Opt. Express 2019, 10, 6096–6113. [Google Scholar] [CrossRef]
  14. Kho, E.; De Boer, L.L.; Van De Vijver, K.K.; Van Duijnhoven, F.; Peeters, M.-J.T.V.; Sterenborg, H.J.; Ruers, T.J. Hyperspectral Imaging for Resection Margin Assessment during Cancer Surgery. Clin. Cancer Res. 2019, 25, 3572–3580. [Google Scholar] [CrossRef] [Green Version]
  15. Kho, E.; Boer, L.L.; Post, A.L.; Van De Vijver, K.K.; Jóźwiak, K.; Sterenborg, H.J.; Ruers, T.J. Imaging depth variations in hyperspectral imaging: Development of a method to detect tumor up to the required tumor-free margin width. J. Biophotonics 2019, 12, e201900086. [Google Scholar] [CrossRef] [PubMed]
  16. De Koning, S.G.B.; Weijtmans, P.; Karakullukcu, M.B.; Shan, C.; Baltussen, E.J.M.; Smit, L.A.; Van Veen, R.L.P.; Hendriks, B.H.W.; Sterenborg, H.J.C.M.; Ruers, T.J.M. Toward assessment of resection margins using hyperspectral diffuse reflection imaging (400–1700 nm) during tongue cancer surgery. Lasers Surg. Med. 2020, 52, 496–502. [Google Scholar] [CrossRef]
  17. Sato, D.; Takamatsu, T.; Umezawa, M.; Kitagawa, Y.; Maeda, K.; Hosokawa, N.; Okubo, K.; Kamimura, M.; Kadota, T.; Akimoto, T.; et al. Distinction of surgically resected gastrointestinal stromal tumor by near-infrared hyperspectral imaging. Sci. Rep. 2020, 10, 21852. [Google Scholar] [CrossRef] [PubMed]
  18. Akimoto, K.; Ike, R.; Maeda, K.; Hosokawa, N.; Takamatsu, T.; Soga, K.; Yokota, H.; Sato, D.; Kuwata, T.; Ikematsu, H.; et al. Wavelength Bands Reduction Method in Near-Infrared Hyperspectral Image based on Deep Neural Network for Tumor Lesion Classification. Adv. Image Video Process. 2021, 9, 273–281. [Google Scholar] [CrossRef]
  19. Zuzak, K.J.; Naik, S.C.; Alexandrakis, G.; Hawkins, D.; Behbehani, K.; Livingston, E. Intraoperative bile duct visualization using near-infrared hyperspectral video imaging. Am. J. Surg. 2008, 195, 491–497. [Google Scholar] [CrossRef] [PubMed]
  20. Zuzak, K.J.; Naik, S.C.; Alexandrakis, G.; Hawkins, D.; Behbehani, K.; Livingston, E.H. Characterization of a Near-Infrared Laparoscopic Hyperspectral Imaging System for Minimally Invasive Surgery. Anal. Chem. 2007, 79, 4709–4715. [Google Scholar] [CrossRef]
  21. Clancy, N.T.; Jones, G.; Maier-Hein, L.; Elson, D.S.; Stoyanov, D. Surgical spectral imaging. Med. Image Anal. 2020, 63, 101699. [Google Scholar] [CrossRef] [PubMed]
  22. Zako, T.; Ito, M.; Hyodo, H.; Yoshimoto, M.; Watanabe, M.; Takemura, H.; Kishimoto, H.; Kaneko, K.; Soga, K.; Maeda, M. Extra-luminal detection of assumed colonic tumor site by near-infrared laparoscopy. Surg. Endosc. 2015, 30, 4153–4159. [Google Scholar] [CrossRef]
  23. Volpi, D.; Tullis, I.D.C.; Barber, P.R.; Augustyniak, E.M.; Smart, S.C.; Vallis, K.A.; Vojnovic, B. Electrically tunable fluidic lens imaging system for laparoscopic fluorescence-guided surgery. Biomed. Opt. Express 2017, 8, 3232–3247. [Google Scholar] [CrossRef] [PubMed] [Green Version]
  24. Kang, H.G.; Song, S.H.; Han, Y.B.; Lee, H.-Y.; Kim, K.M.; Hong, S.J. Proof-of-concept of a multimodal laparoscope for simultaneous NIR/gamma/visible imaging using wavelength division multiplexing. Opt. Express 2018, 26, 8325–8339. [Google Scholar] [CrossRef] [PubMed]
  25. Svozil, D.; Kvasnicka, V.; Pospichal, J. Introduction to multi-layer feed-forward neural networks. Chemom. Intell. Lab. Syst. 1997, 39, 43–62. [Google Scholar] [CrossRef]
  26. Udelhoven, T.; Schütt, B. Capability of feed-forward neural networks for a chemical evaluation of sediments with diffuse reflectance spectroscopy. Chemom. Intell. Lab. Syst. 2000, 51, 9–22. [Google Scholar] [CrossRef]
  27. Stelzer, E.H. Contrast, resolution, pixelation, dynamic range and signal-to-noise ratio: Fundamental limits to resolution in fluorescence light microscopy. J. Microsc. 1998, 189, 15–24. [Google Scholar] [CrossRef]
  28. Kasai, M.; Yasuda, Y.; Takemura, H.; Mizoguchi, H.; Soga, K.; Kaneko, K. In vivo tumor spatial classification using PCA and K-means with NIR-hyperspectral data. J. Biomed. Eng. Med. Imaging 2016, 3, 45. [Google Scholar] [CrossRef]
  29. Li, Q.; Wang, Y.; Liu, H.; Sun, Z. AOTF based hyperspectral tongue imaging system and its applications in computer-aided tongue disease diagnosis. In Proceedings of the 2010 3rd International Conference on Biomedical Engineering and Informatics, Yantai, China, 16–18 October 2010; Volume 4, pp. 1424–1427. [Google Scholar]
  30. Shao, H.; Chen, Y.; Yang, Z.; Jiang, C.; Li, W.; Wu, H.; Wang, S.; Yang, F.; Chen, J.; Puttonen, E.; et al. Feasibility Study on Hyperspectral LiDAR for Ancient Huizhou-Style Architecture Preservation. Remote Sens. 2019, 12, 88. [Google Scholar] [CrossRef] [Green Version]
  31. Soga, K.; Umezawa, M.; Okubo, K. Transparency in Biology: Making Invisible Visible; Springer: Singapore, 2021; p. 263. [Google Scholar] [CrossRef]
  32. Wirkert, S.J. Multispectral Image Analysis in Laparoscopy—A Machine Learning Approach to Live Perfusion Monitoring. Ph.D. Dissertation, Karlsruher Institut für Technologie (KIT), Karlsruhe, Germany, 2018. [Google Scholar] [CrossRef]
  33. Köhler, H.; Kulcke, A.; Maktabi, M.; Moulla, Y.; Jansen-Winkeln, B.; Barberio, M.; Diana, M.; Gockel, I.; Neumuth, T.; Chalopin, C. Laparoscopic system for simultaneous high-resolution video and rapid hyperspectral imaging in the visible and near-infrared spectral range. J. Biomed. Opt. 2020, 25, 086004. [Google Scholar] [CrossRef] [PubMed]
Figure 1. (a) Developed light source for over 1000 nm (OTN)-near-infrared (NIR) multispectral imaging; (b) optical ray tracing at 1200 nm for the light source optical system.
Sensors 21 02649 g001
Figure 2. (a) Laparoscopic OTN-NIR imaging device; (b) optical ray tracing at 1300 nm for a laparoscopic optical system. The minimum (0°) and maximum (7°) angles of view are shown in red and green. The FOV was 60°.
Sensors 21 02649 g002
Figure 3. (a) Spectroscopy for the light source of the laparoscopic OTN-NIR multispectral imaging system. The exposure time was set to 500 ms. The average was 10 times. (b) Resolution evaluation of the laparoscopic NIR imaging device.
Sensors 21 02649 g003
Figure 4. (a) Tumor-bearing mice on day 14, after implantation of HT29 cells; (b) experimental setup of OTN-NIR multispectral imaging under laparoscope.
Sensors 21 02649 g004
Figure 5. Neural network structure.
Sensors 21 02649 g005
Figure 6. The spectrum of the transmitted light through each bandpass filter.
Sensors 21 02649 g006
Figure 7. The figure displays 1951 USAF resolution chart images for the laparoscope at each spectral band (Top) and the spatial resolving power of the laparoscopic imaging system by a contrast transfer function analysis (Bottom): (a) without the tunable lens and (b) with the tunable lens.
Sensors 21 02649 g007
Figure 8. (a) Boundaries of pixels used as teaching data for the normal area before tumor implantation in nine mice; (b) boundaries of pixels used as teaching data for the tumor area of the nine tumor-implanted mice; (c) average of the standard normal variate (SNV)-processed spectrum of normal and tumor pixels in each mouse.
Sensors 21 02649 g008
Figure 9. Classification images of tumor-implanted mice by neural network using OTN-NIR MSI datasets.
Sensors 21 02649 g009
Table 1. Bandpass filter information and the tunable lens settings.
Wavelength (nm)Optical Power (dpt)FWHM (nm)VendorModel Number
1000−2.0310Edmund Optics65-782
1030−1.8710Thorlabs, IncFLH1030-10
1050−1.5510Edmund Optics65-783
1070−1.6110Thorlabs, IncFBH1070-10
1100−1.4210Edmund Optics65-784
1150−0.8510Edmund Optics65-785
1200−0.6910Edmund Optics65-786
1225−0.2910IR System Co., Ltd.NB-1225-010 nm
1250−0.2210Edmund Optics65-787
13000.2912Edmund Optics65-788
13200.5912Thorlabs, IncFB1320-12
13500.6712Edmund Optics65-789
13700.9410IR System Co., Ltd.NB-1370-010 nm
14001.1812Edmund Optics65-790
Table 2. Prediction results of OTN-NIR multispectral imaging (MSI) analysis for the tumor-implanted mice.
No.Tumor Volume (mm3)Tumor (px)Normal (px)Specificity (%)Sensitivity (%)Accuracy (%)
i174.036011,01596.354.795.0
ii526.050711,52789.453.587.9
iii355.245110,92399.226.696.3
iv416.156510,32280.972.980.5
v821.9735869888.061.185.9
vi276.555812,47294.621.391.5
vii696.2648945387.152.384.9
viii419.568410,45777.874.177.6
ix341.940812,63790.052.788.8
total-491697,50489.553.587.8
Publisher’s Note: MDPI stays neutral with regard to jurisdictional claims in published maps and institutional affiliations.

