
An Outlook of Recent Advances in Chemiresistive Sensor-Based Electronic Nose Systems for Food Quality and Environmental Monitoring


Abstract
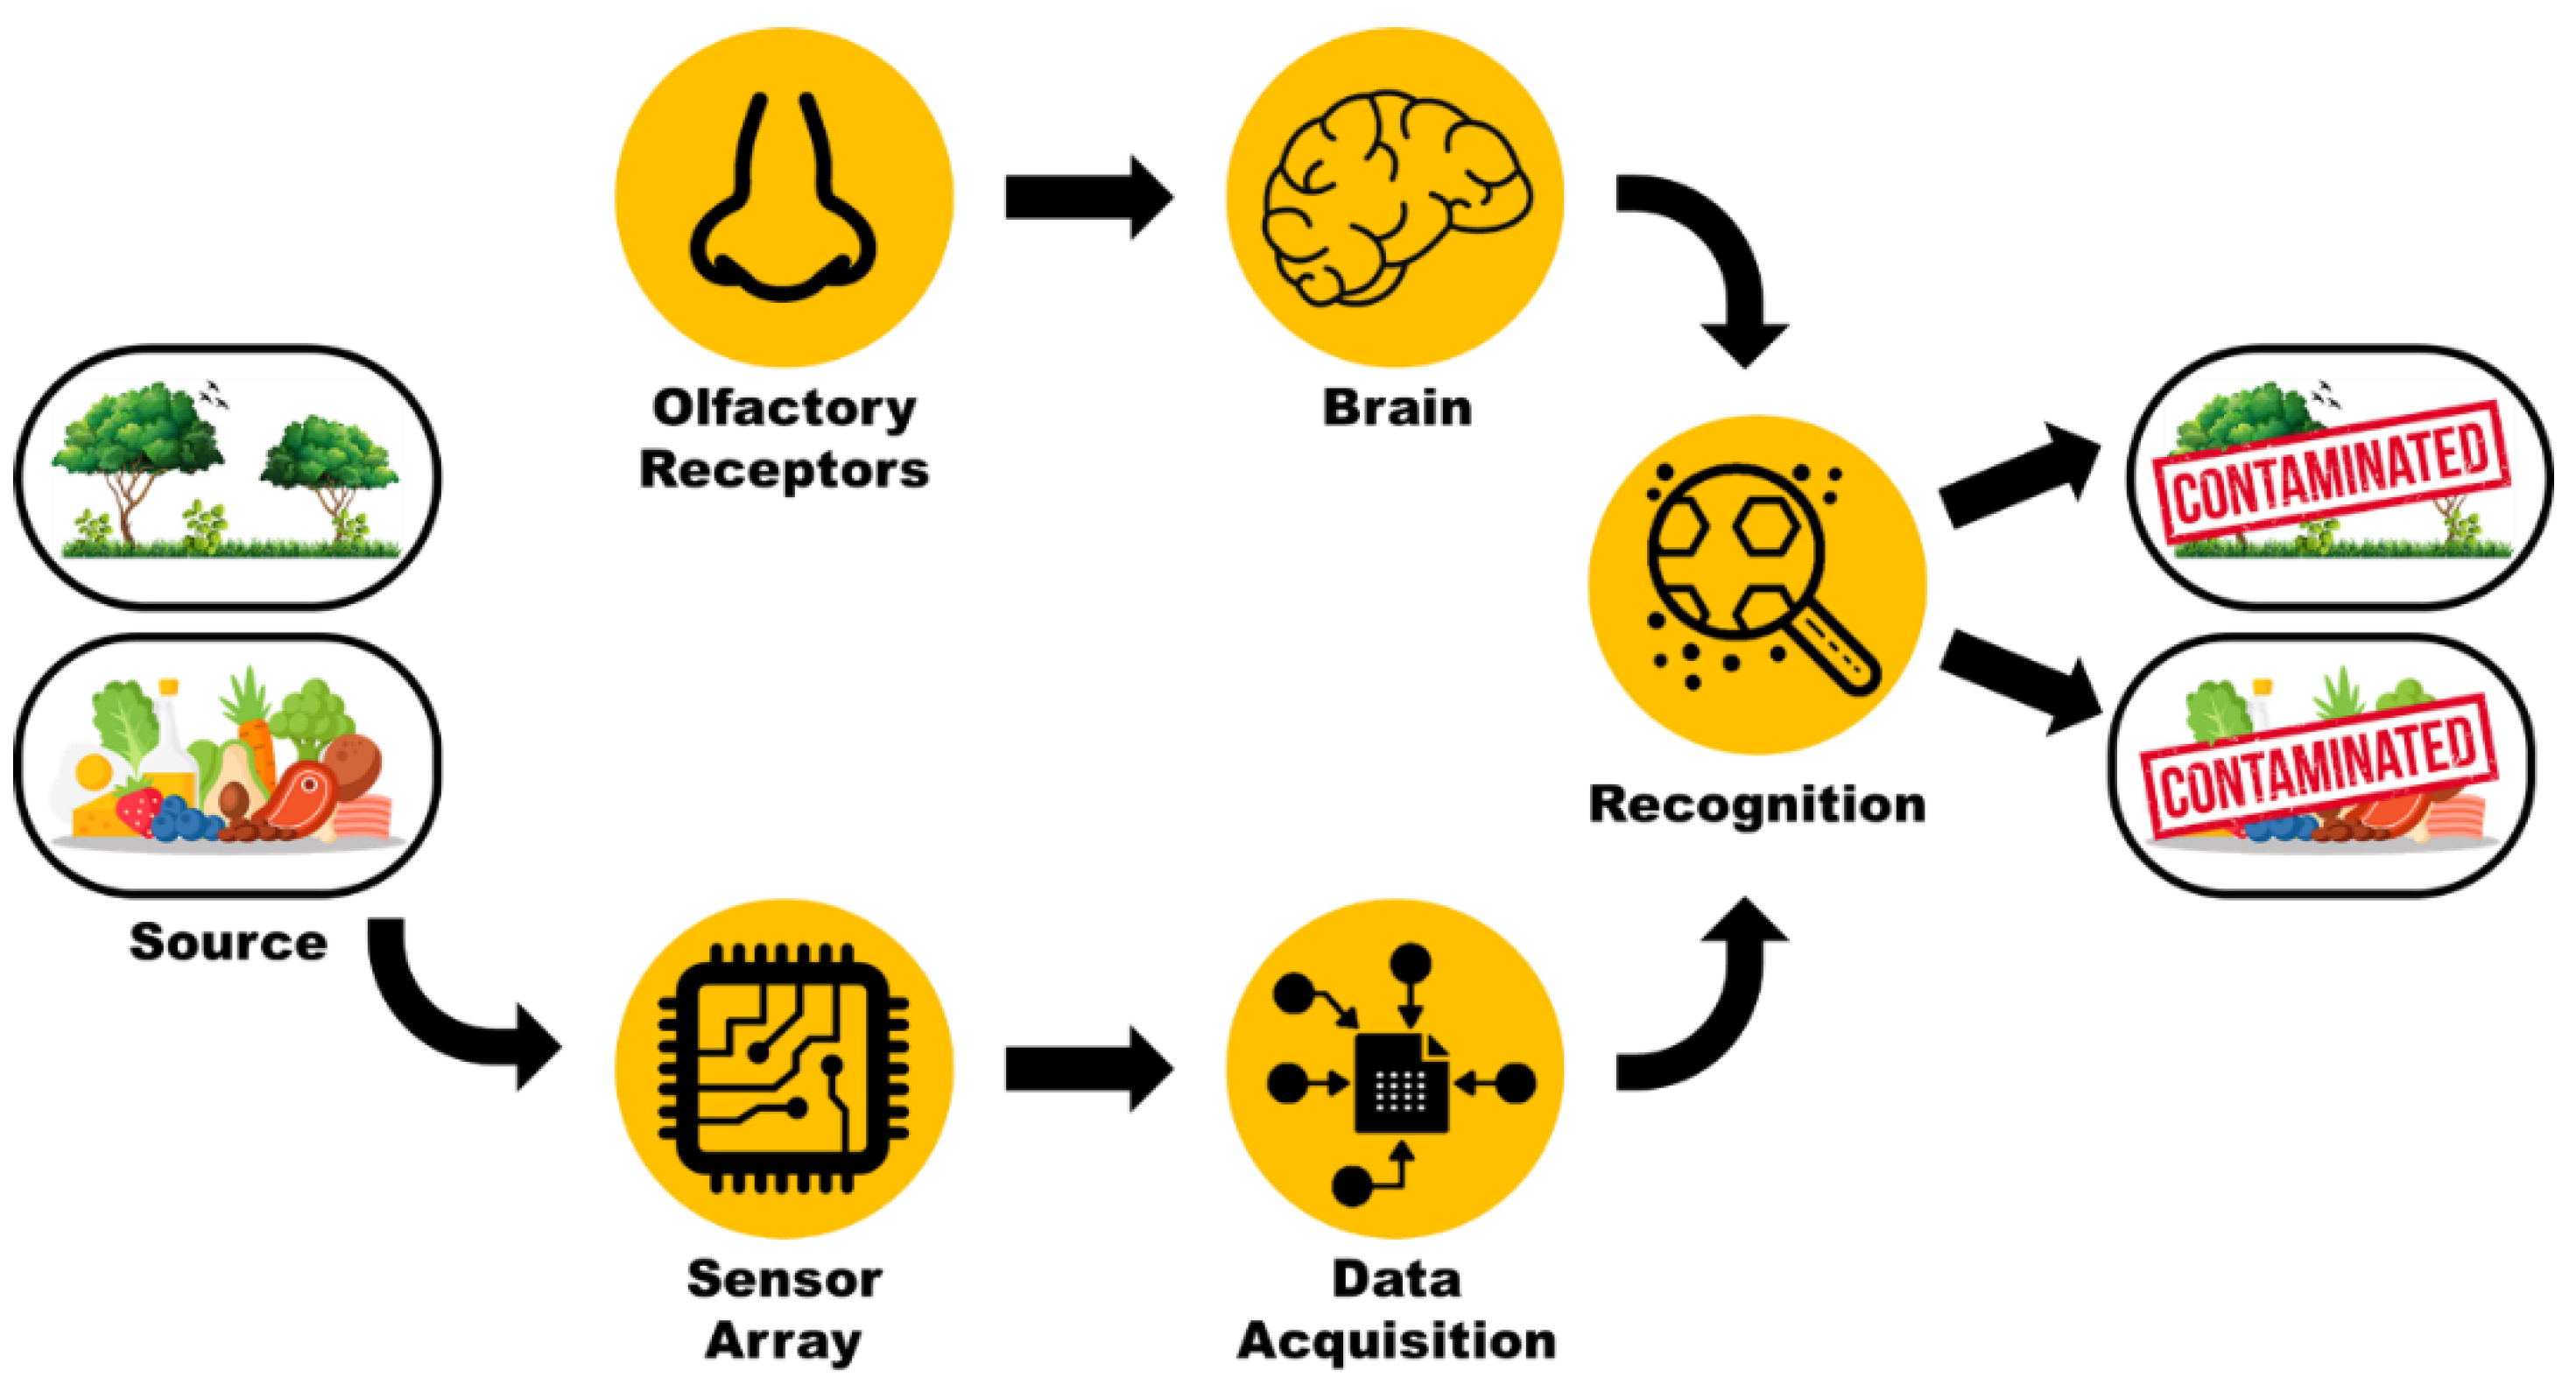
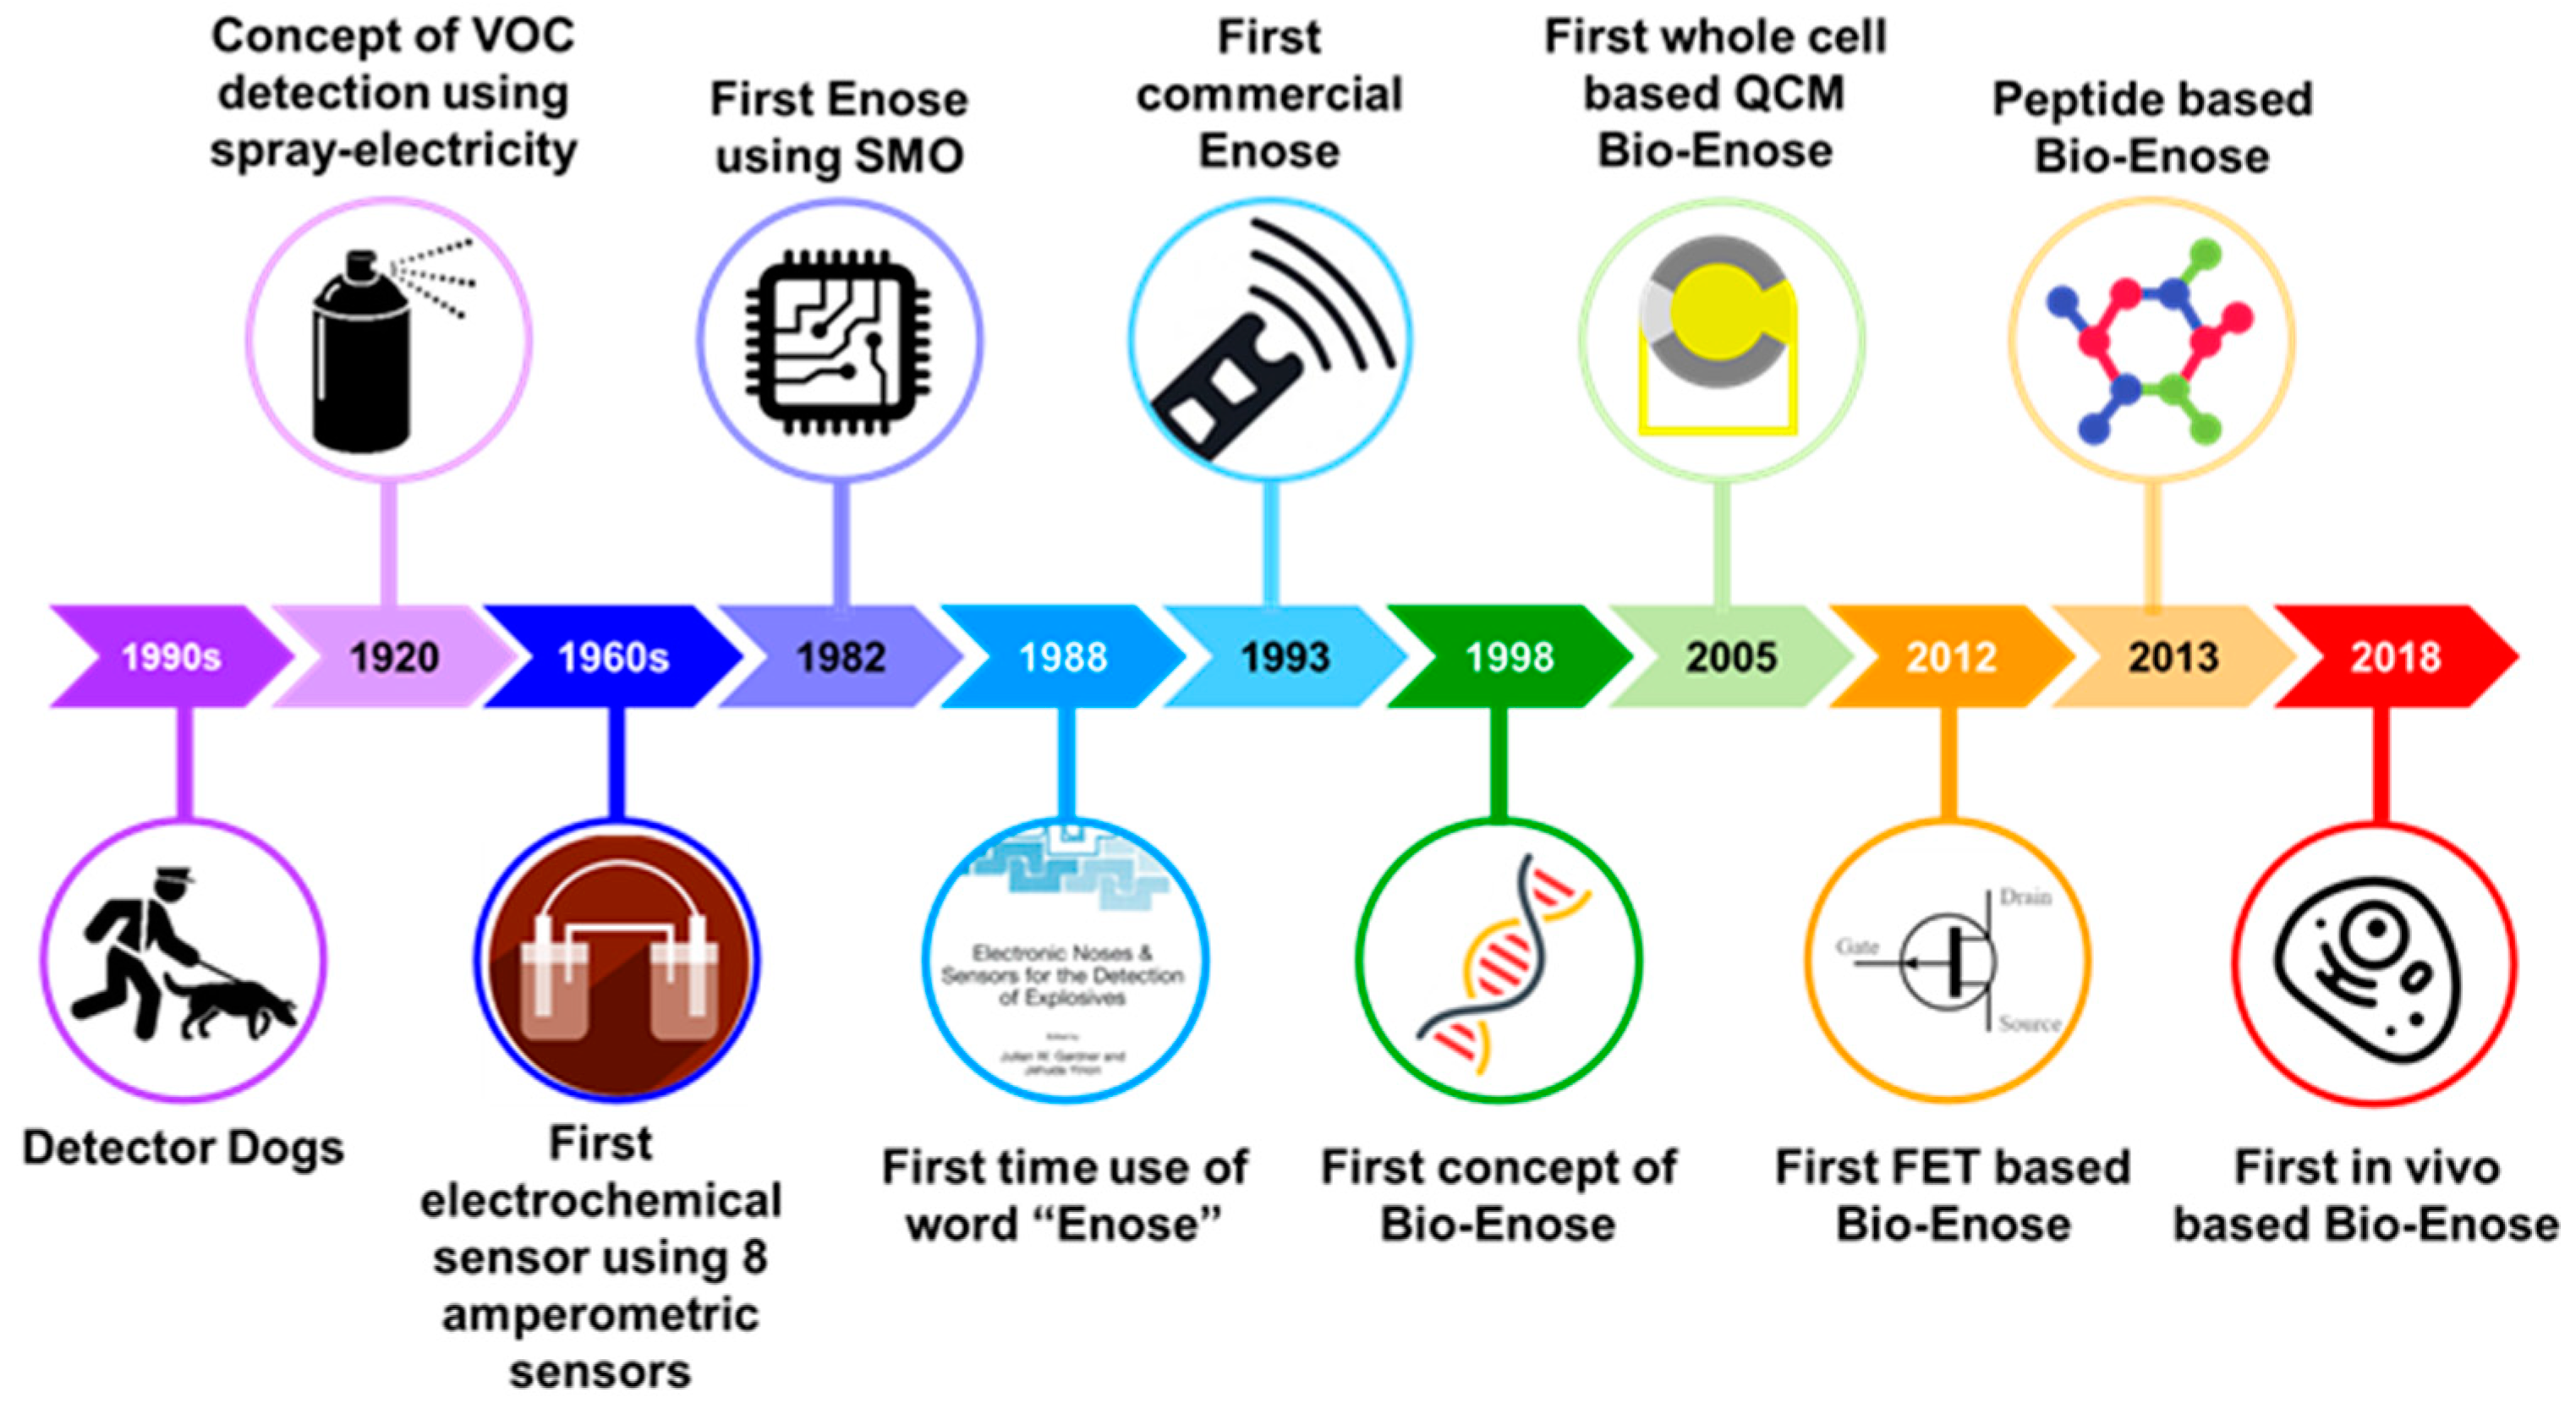
1. Introduction
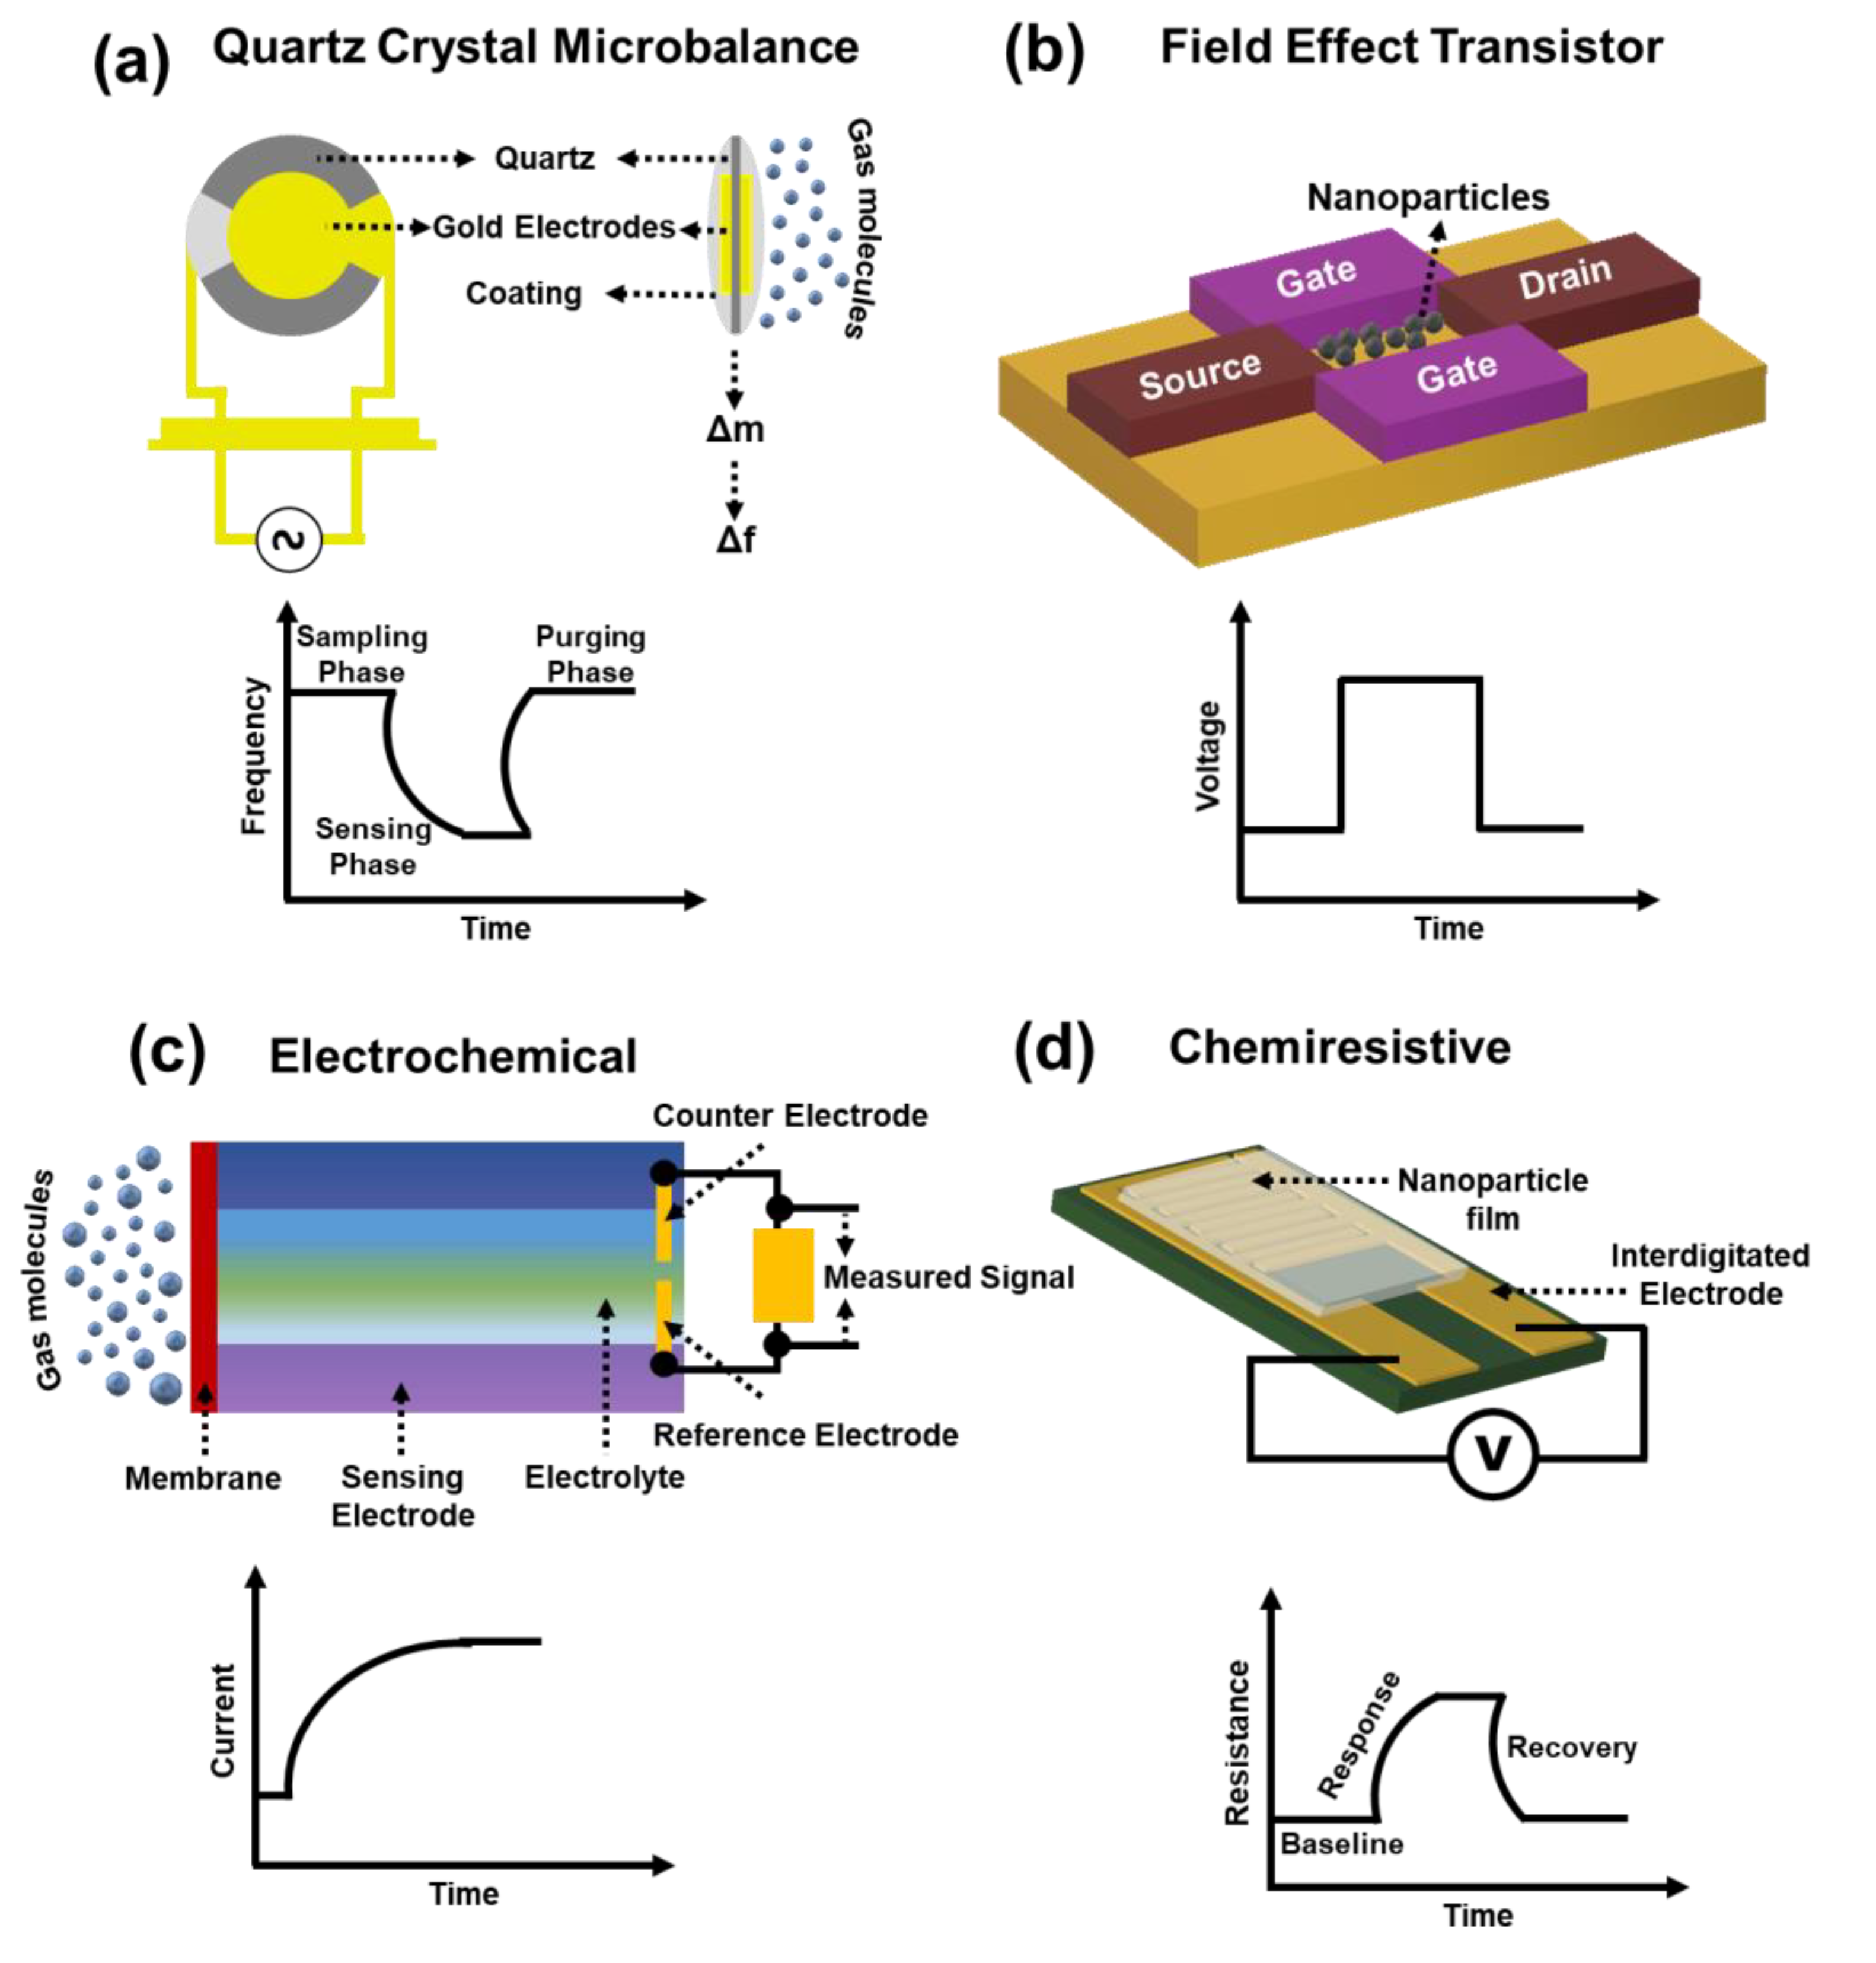
2. Chemiresistive Gas Sensors
2.1. Conducting Polymer
2.2. Carbon-Based
2.3. Semiconducting Metal Oxides
2.3.1. Types of Semiconducting Metal Oxides
N-Type Semiconductors
P-Type Semiconductors
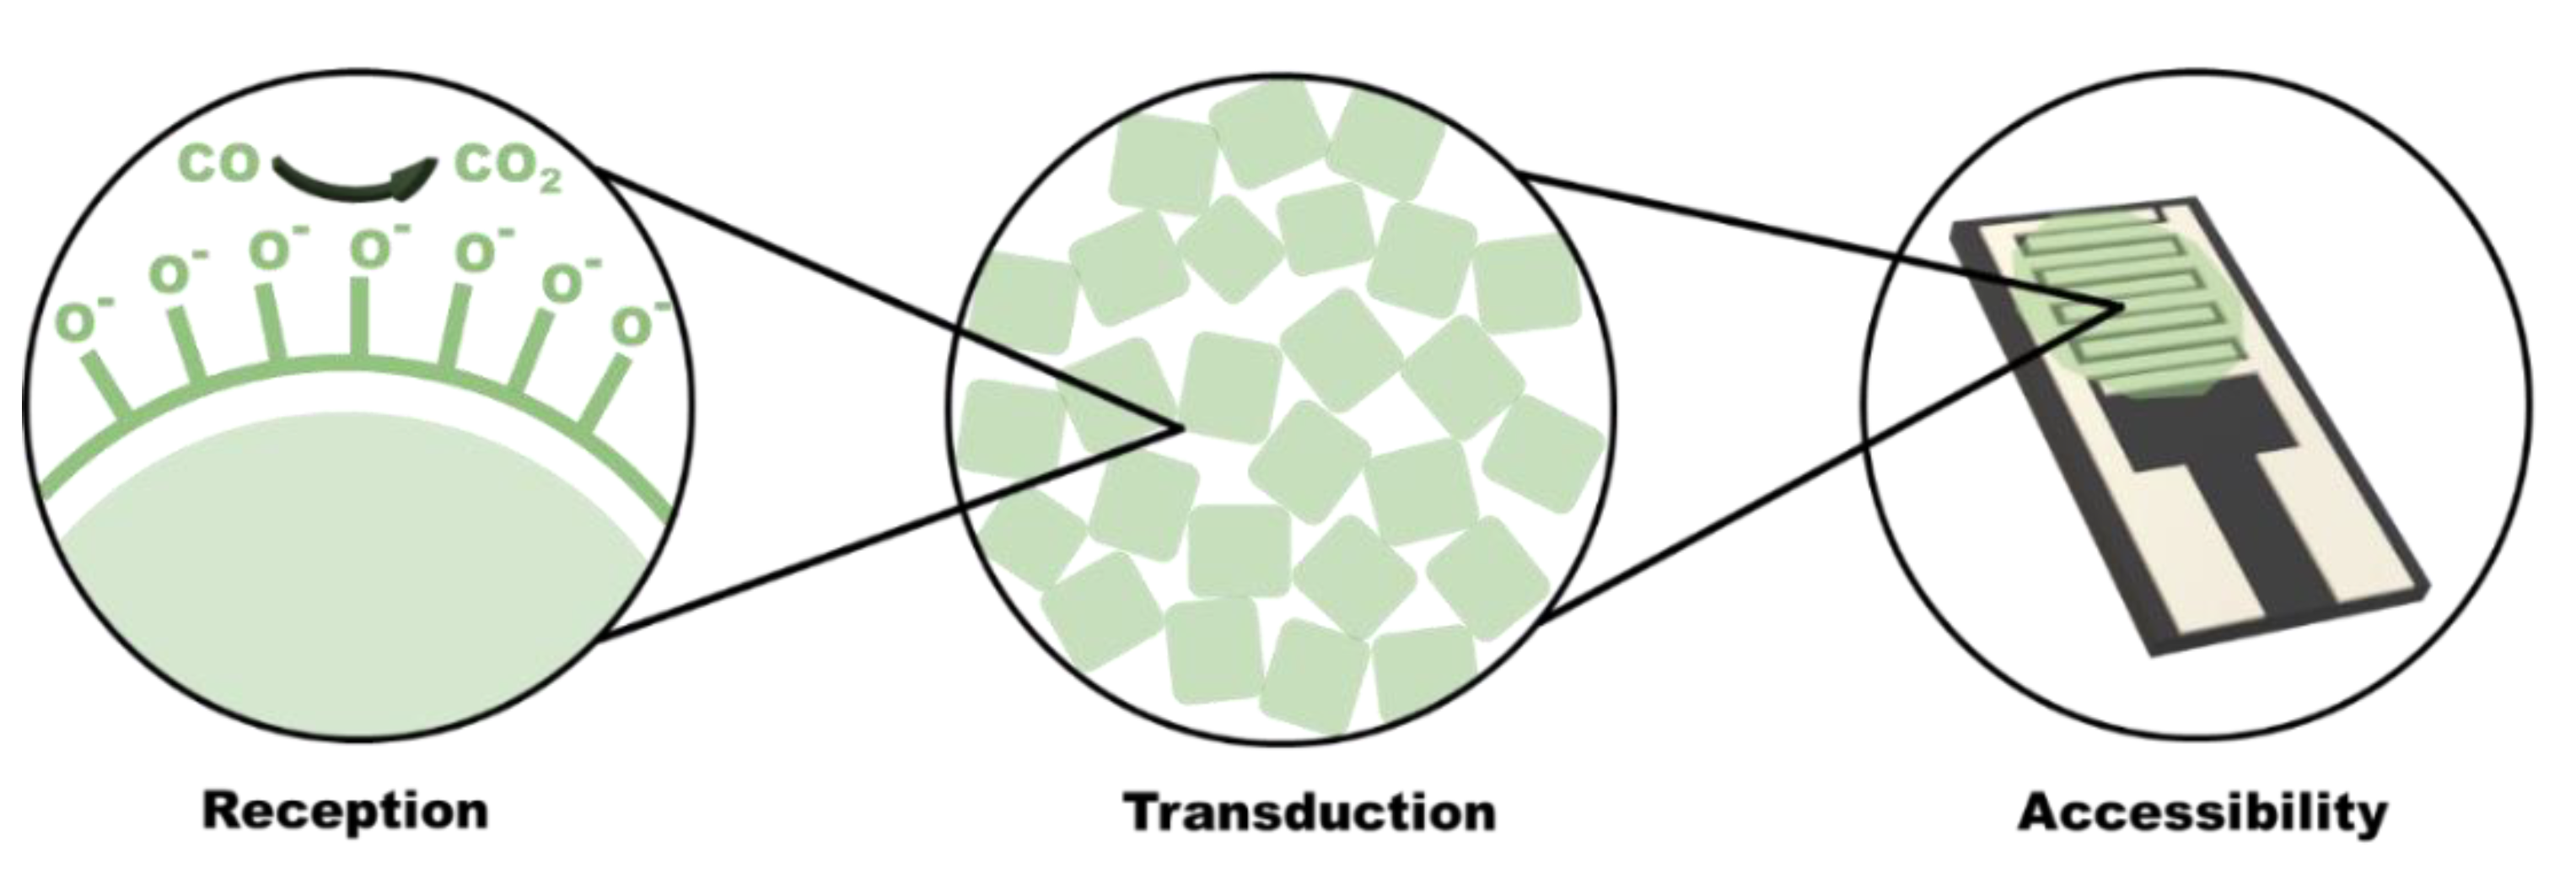
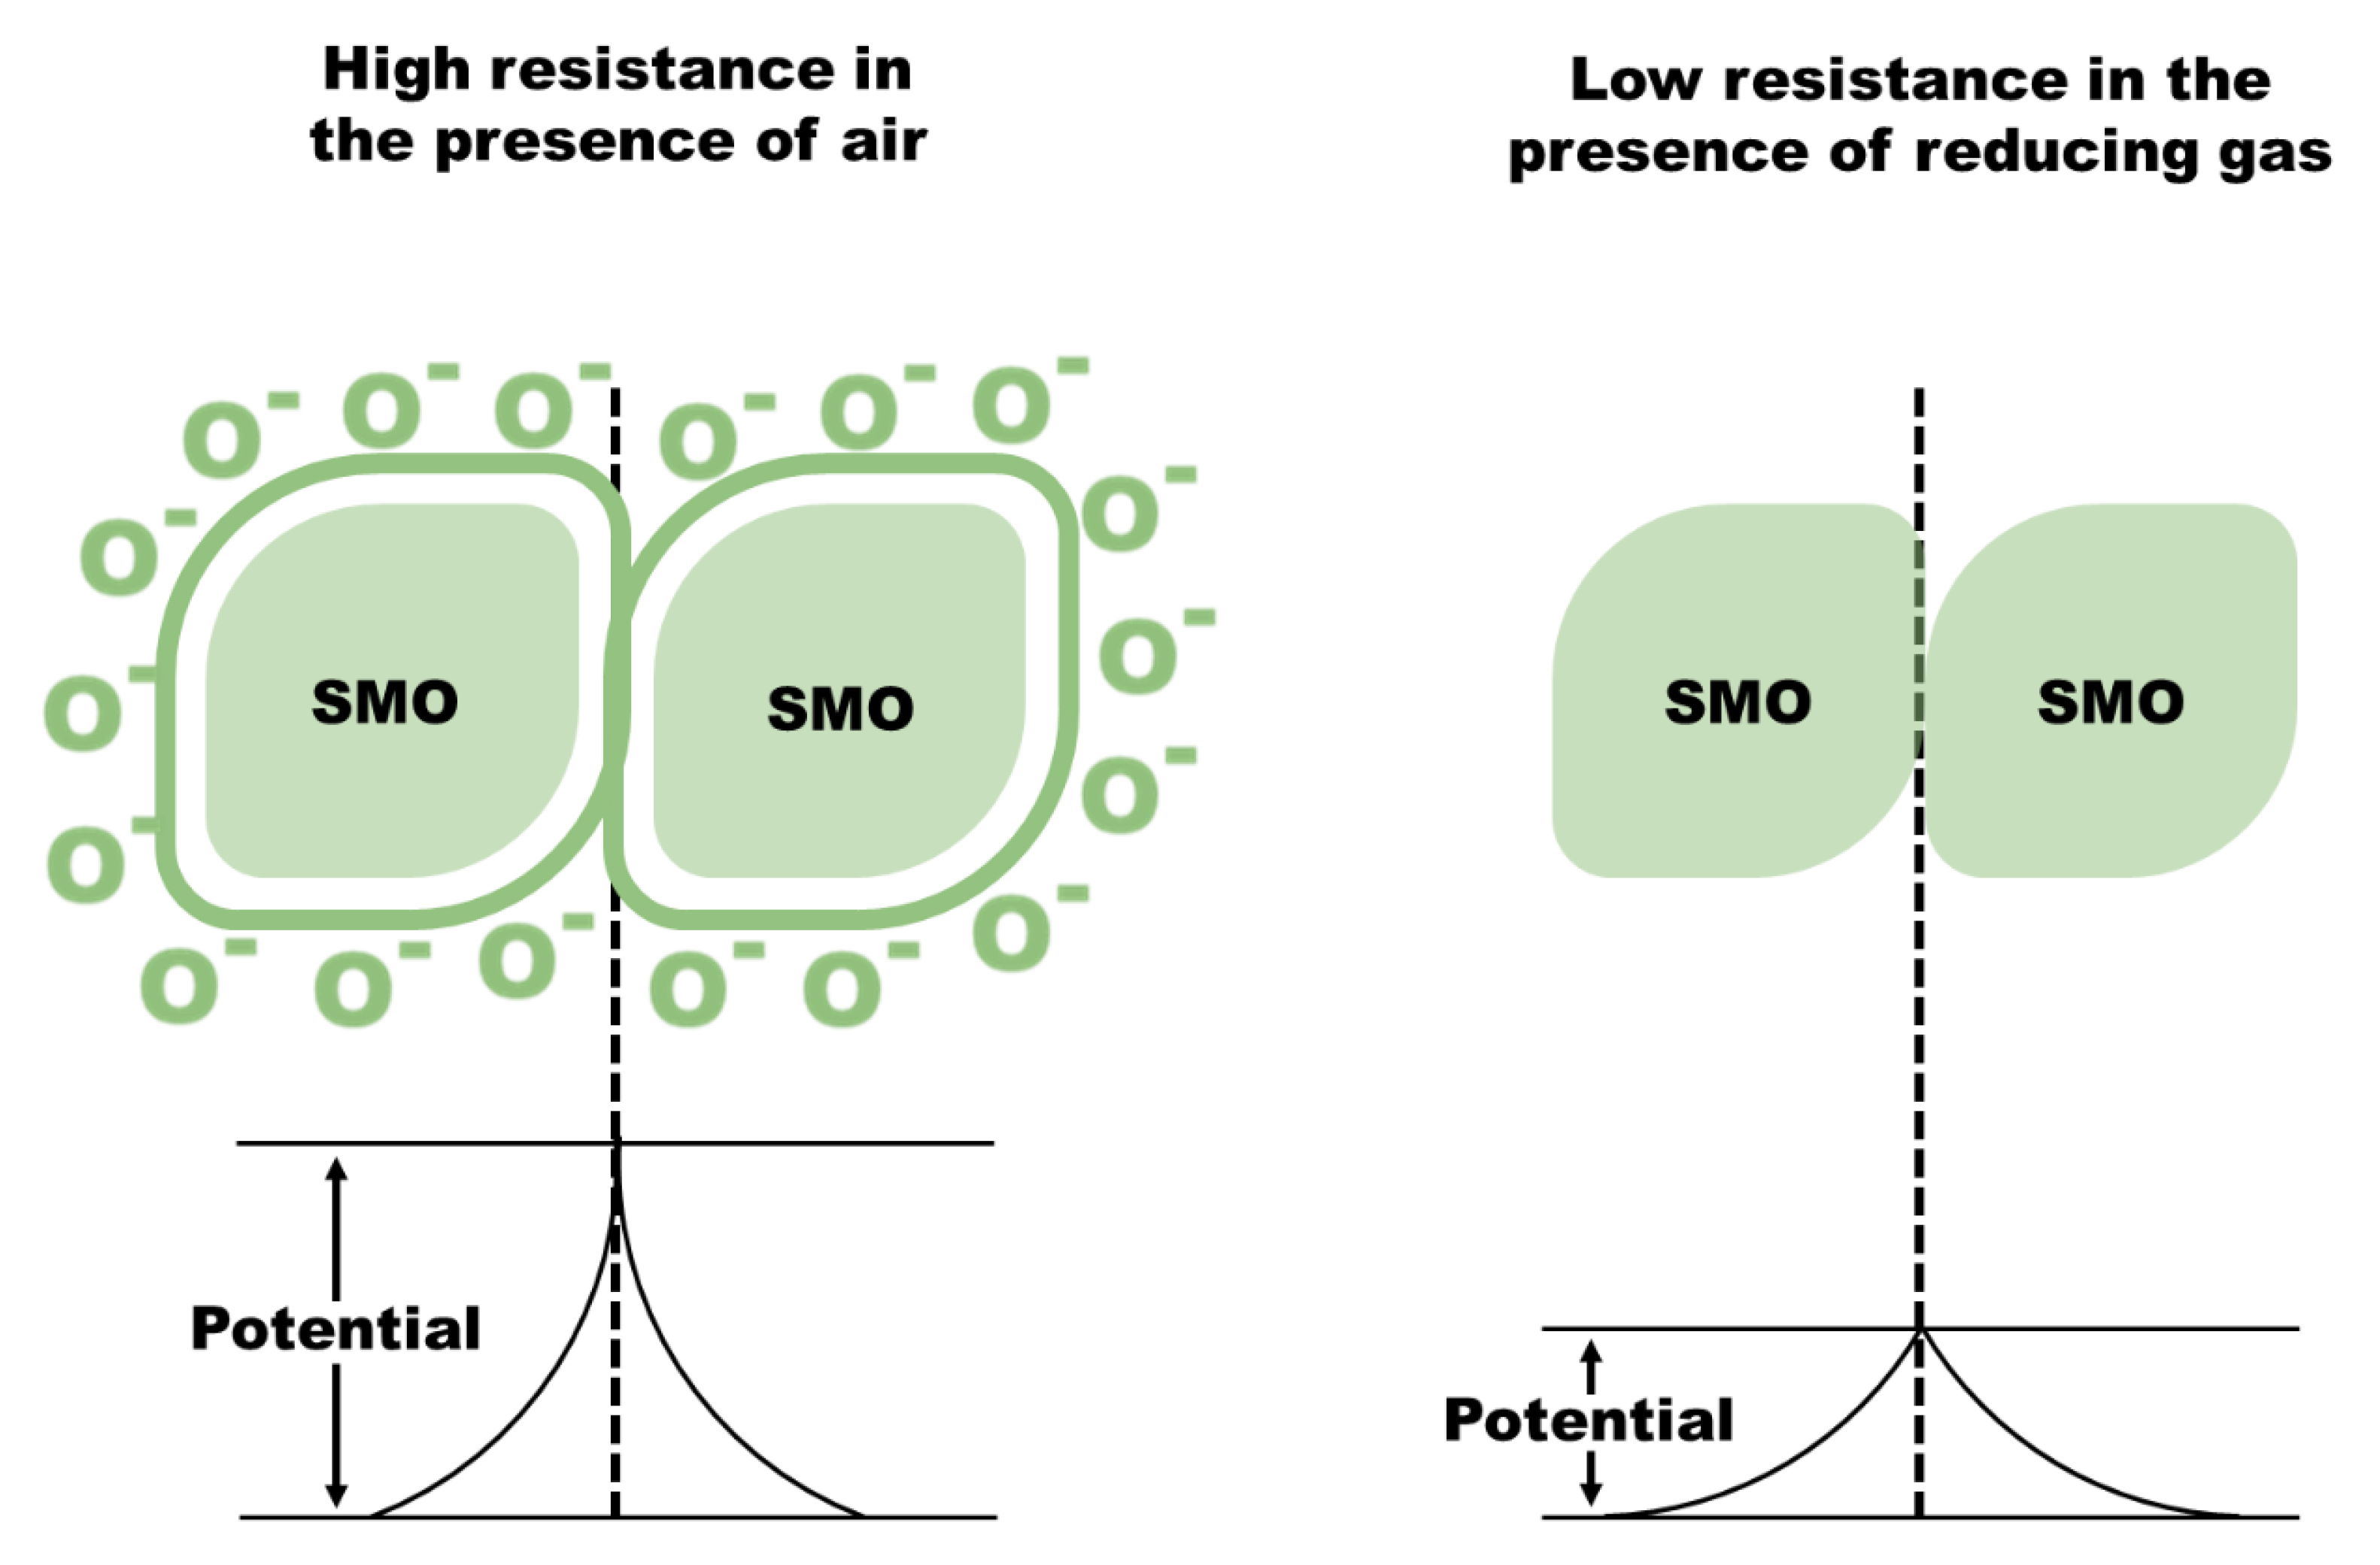
2.3.2. Sensing Mechanism
Reception Mechanism
- Ionosorption of the molecular oxygen from air and formation of reactive oxygen species (O2−, O−, O2−) on the SMO surface. These ionosorbed oxygen trap electrons from the conduction band, resulting in band bending and formation of a depletion layer along with an increase in the work function of the grains. This reaction proceeds according to the following equation [57]:
- where O2 gas represents the oxygen molecules available in the atmosphere
- e is the electron that can reach the surface of SMO; S is the unoccupied sites available for the chemisorption of oxygen molecules
- is the chemisorbed oxygen on the surface of SMO (where α = 1 or 2 for single of doubly form; β = 1 or 2 for atomic or molecular form)
- Reaction of the analyte gas with reactive oxygen species. This results in the formation of volatile reaction products. As the adsorbed reactive oxygen species are consumed in the reaction, it releases the trapped electrons from the SMO surface and subsequently decreases the work function of the grain [58,59].
Transduction Mechanism
Accessibility to Grain Boundaries
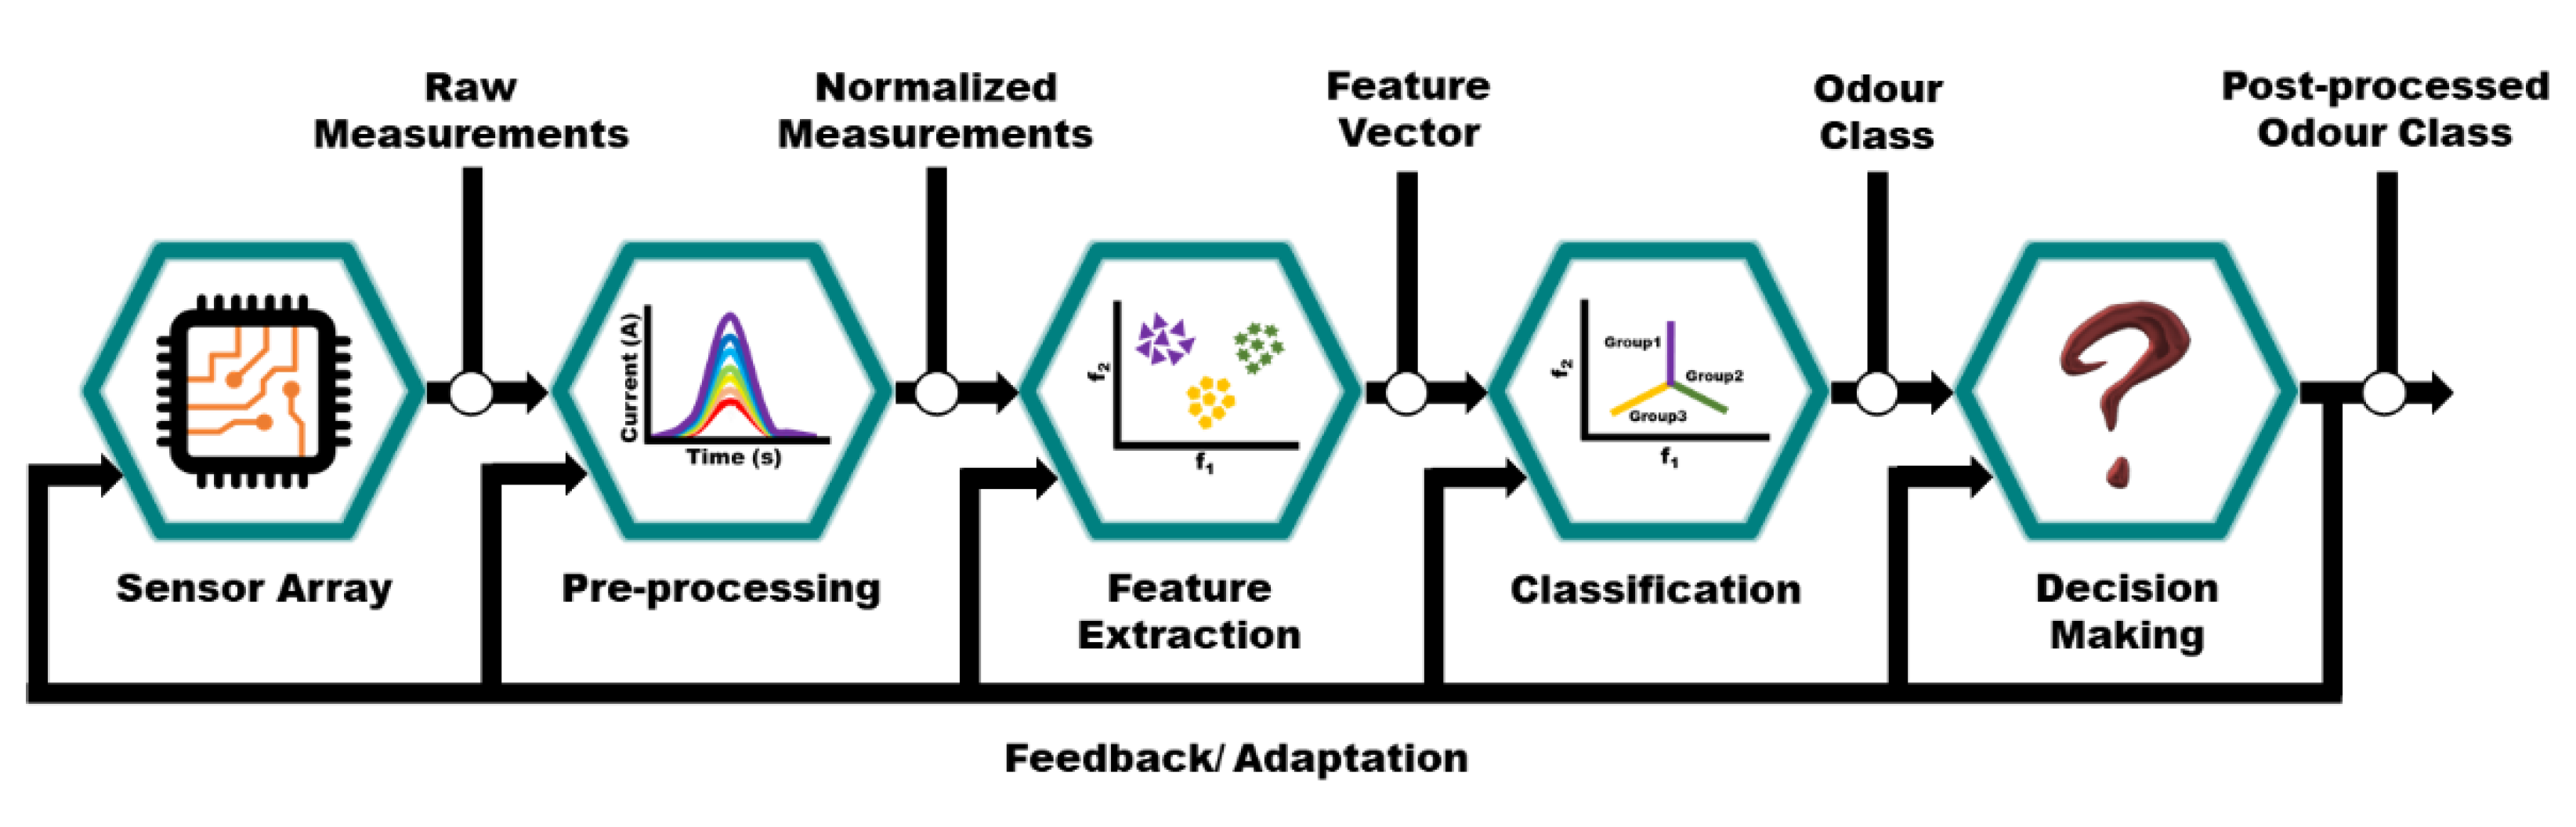
3. Enose Systems
3.1. Pattern Recognition Techniques
3.1.1. Graphical Methods
3.1.2. Multivariate Data Analysis Methods
3.1.3. Neural Network Methods
4. Application of Enoses in Food and Environmental Monitoring
4.1. Food Industry
4.1.1. Bakery and Grains
4.1.2. Beverages
4.1.3. Fruits and Vegetables
4.1.4. Meat and Fish
4.1.5. Milk and Dairy
4.1.6. Oils
4.1.7. Spices
4.2. Environmental Monitoring
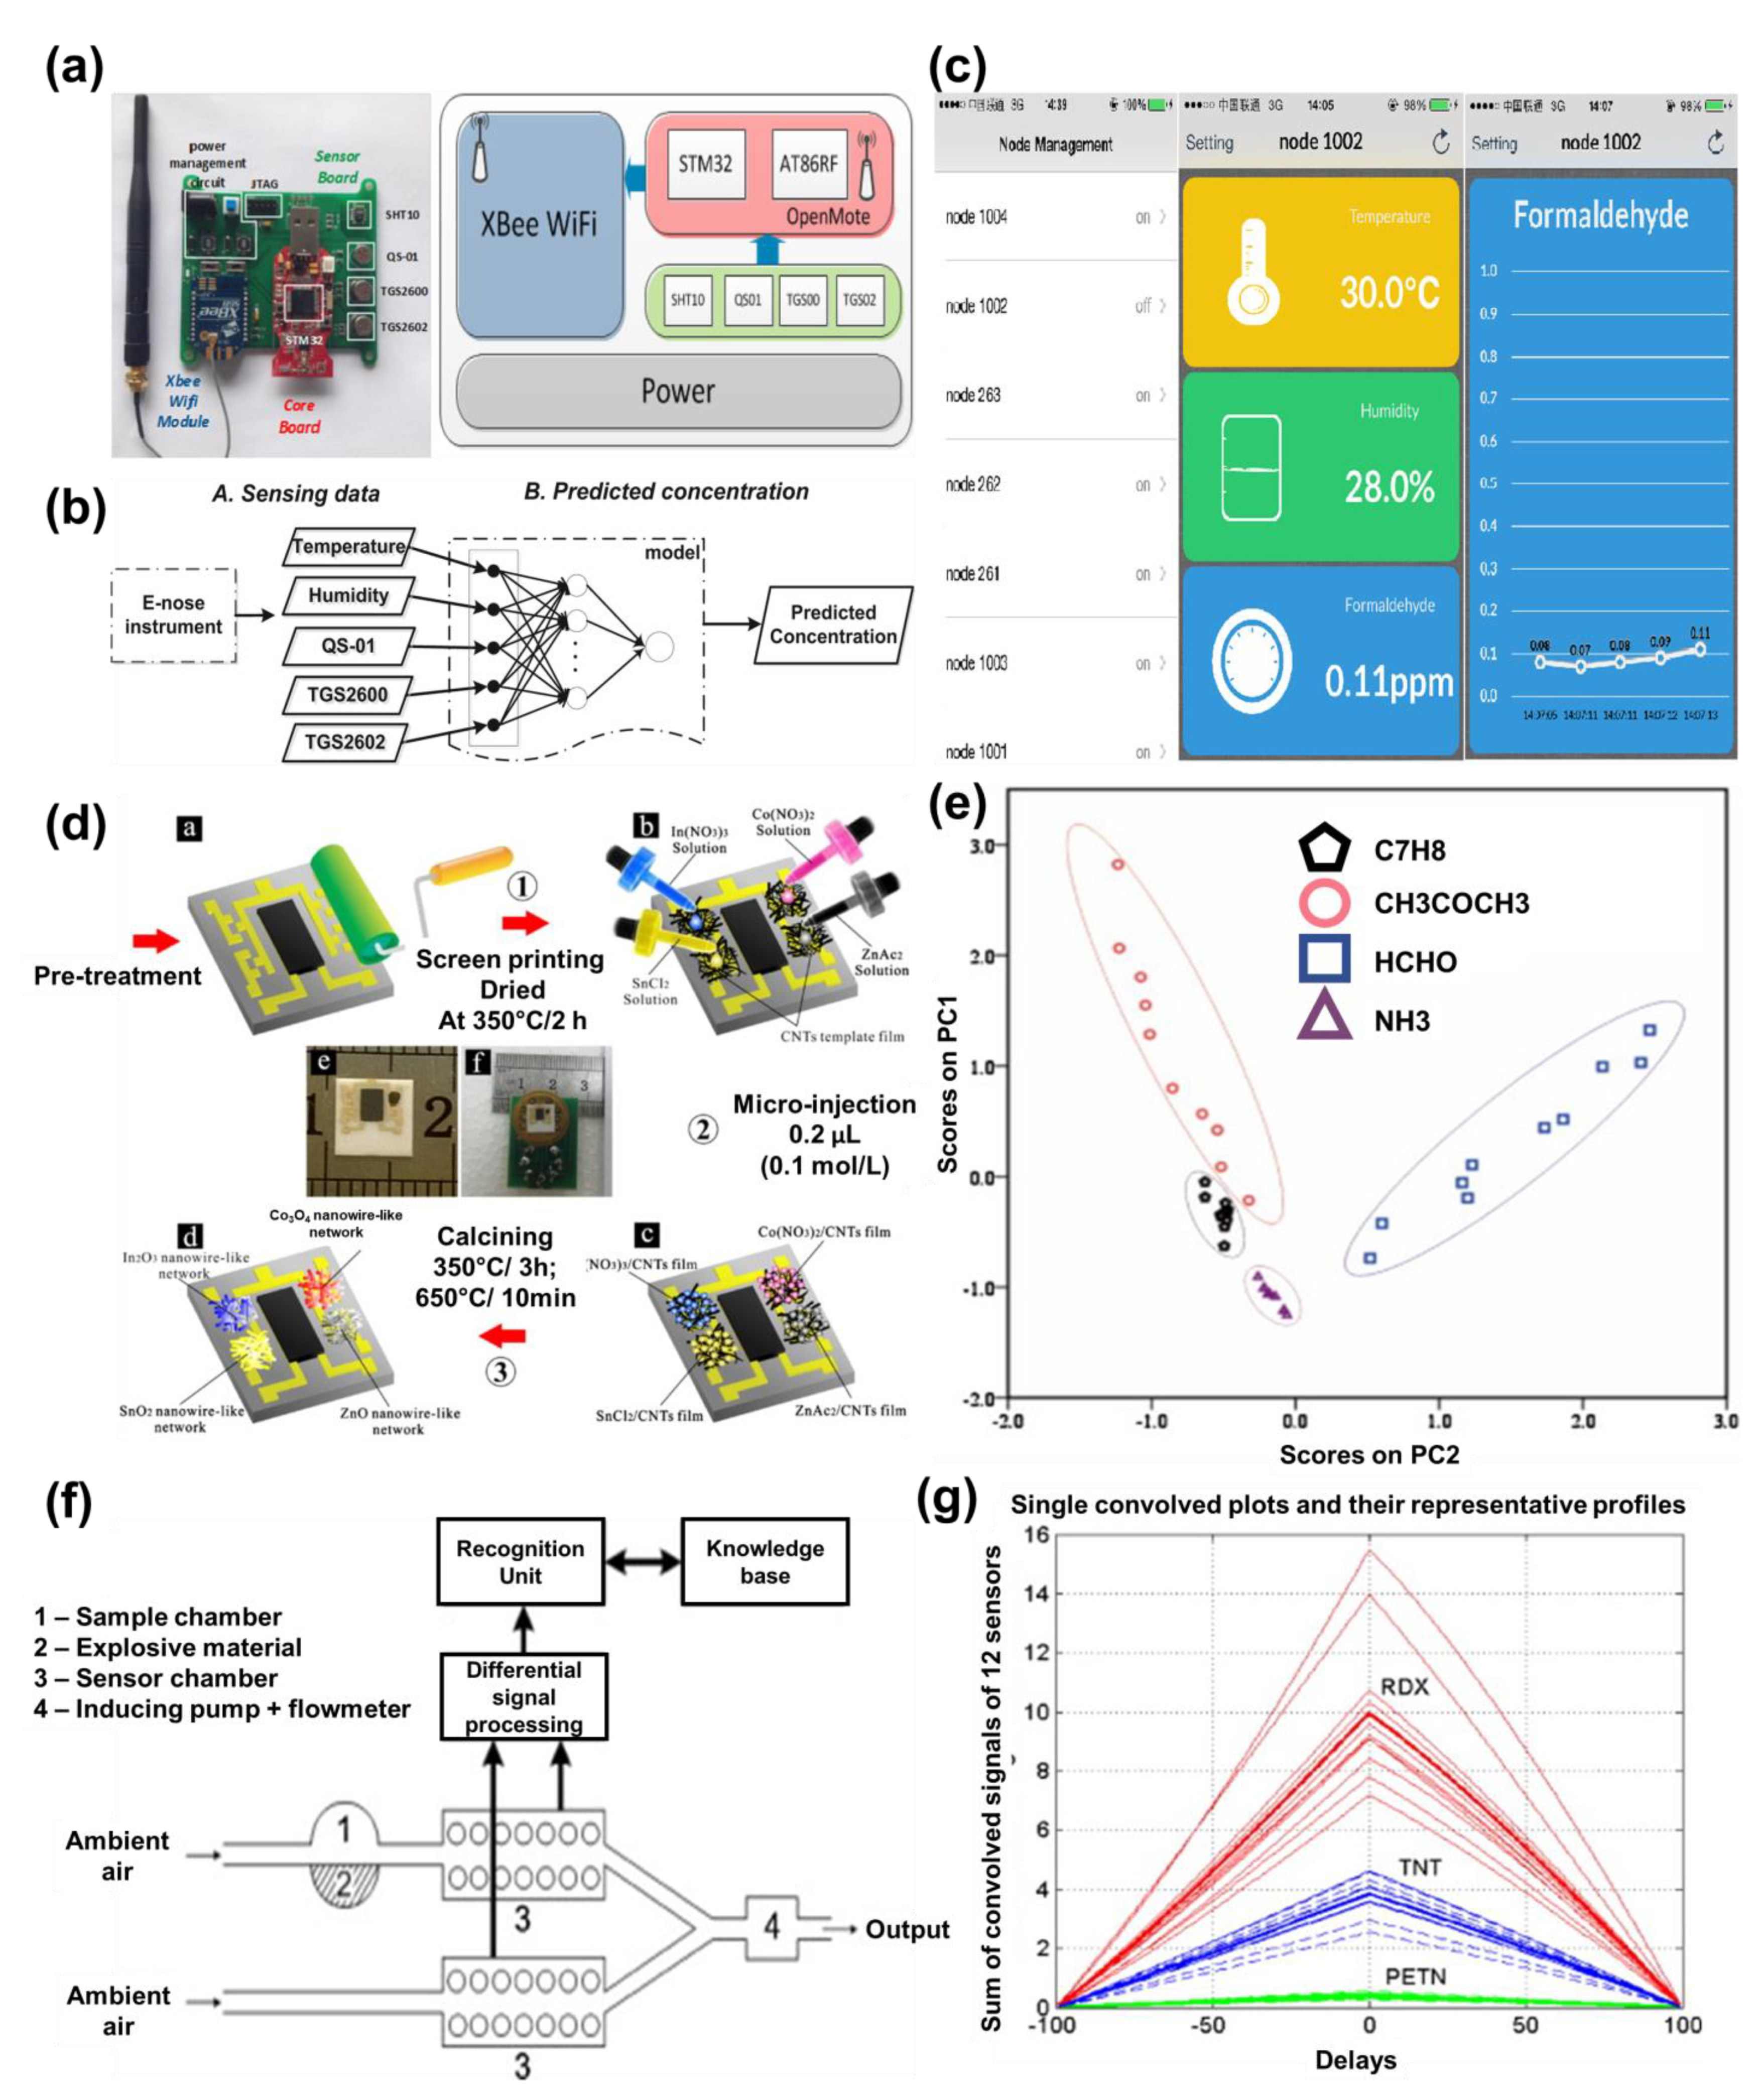
4.2.1. Air Quality Monitoring
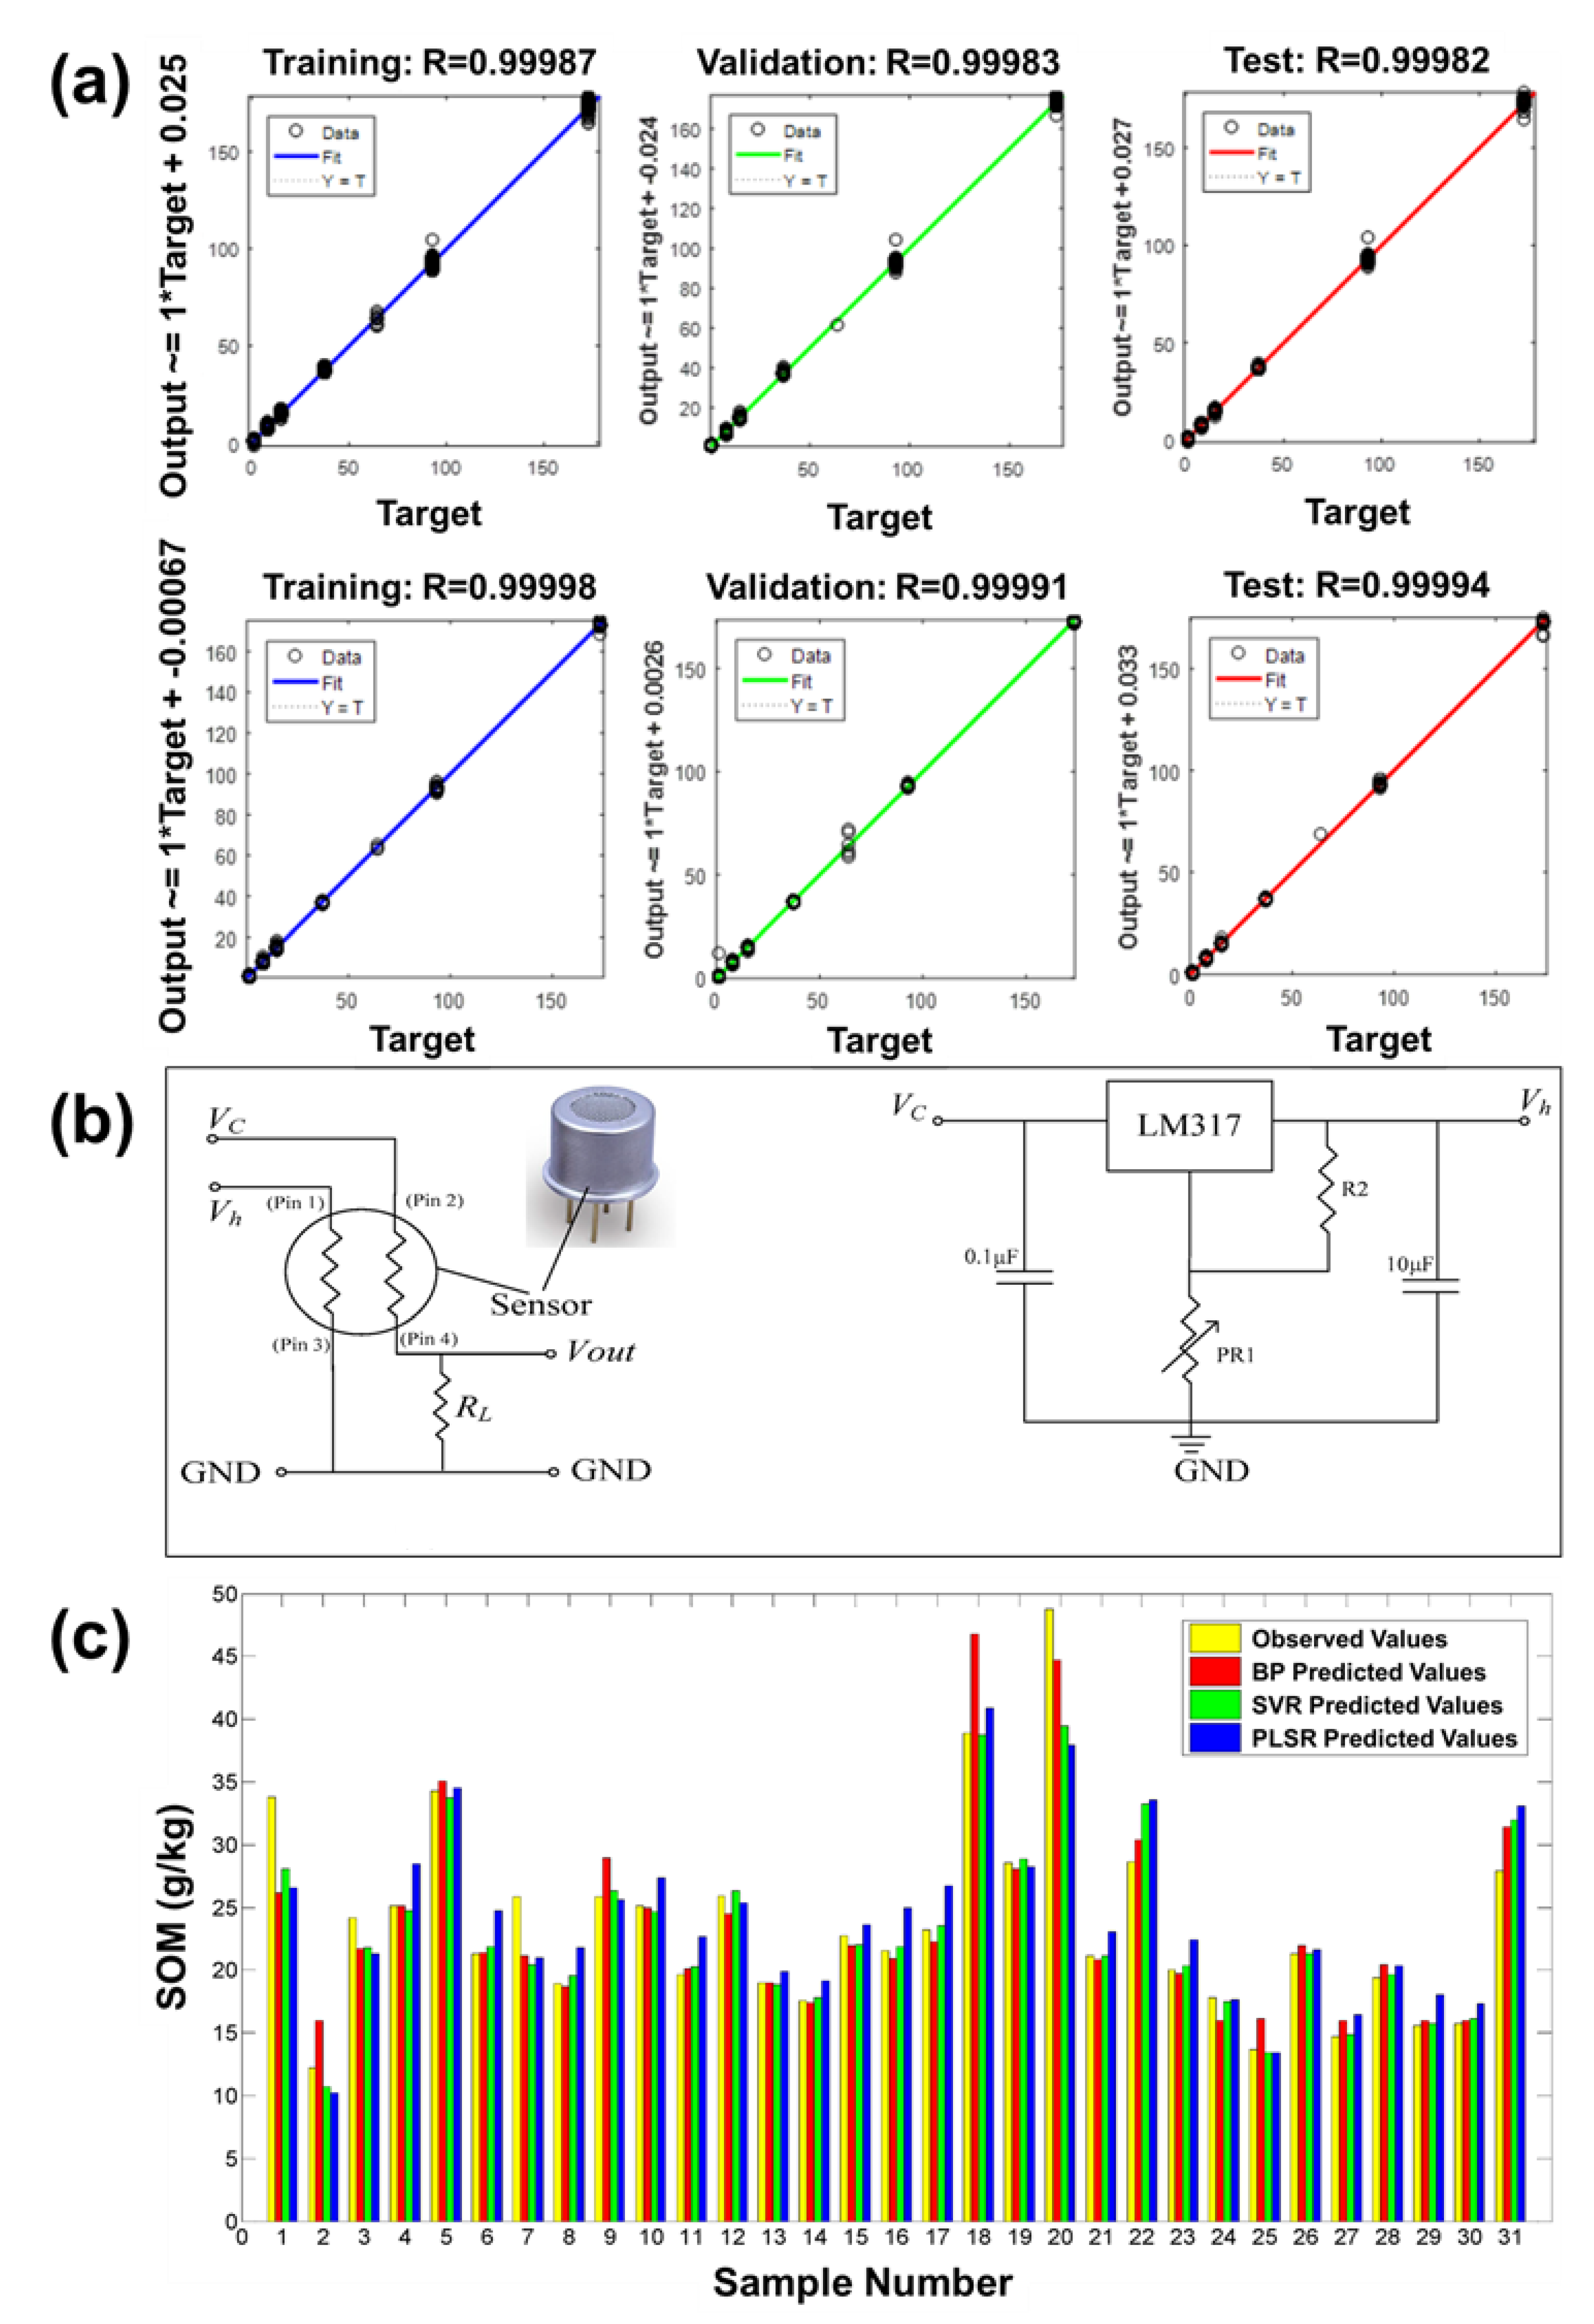
4.2.2. Soil Quality Monitoring
4.2.3. Water Pollution Control
5. Challenges and Future Scope
6. Conclusions
Author Contributions
Funding
Institutional Review Board Statement
Informed Consent Statement
Data Availability Statement
Conflicts of Interest
References
- Tan, J.; Xu, J. Applications of electronic nose (e-nose) and electronic tongue (e-tongue) in food quality-related properties determination: A review. Artif. Intell. Agric. 2020, 4, 104–115. [Google Scholar] [CrossRef]
- Wasilewski, T.; Gębicki, J. Emerging Strategies for Enhancing Detection of Explosives by Artificial Olfaction. Microchem. J. 2021, 164, 106025. [Google Scholar] [CrossRef]
- Hogewind, F.; Zwaardemaker, H. On spray-electricity and waterfall-electricity. KNAW Proc. 1920, 22, 429–437. [Google Scholar]
- Wilkens, W.F.; Hartman, J.D. An Electronic Analog for the Olfactory Processes a. J. Food Sci. 1964, 29, 372–378. [Google Scholar] [CrossRef]
- HARTMAN, J. A Possible Objective Method for the Rapid Estimation of Flavors in Vegetables; American Society for Horticultural Science: Alexandria, VA, USA, 1954; pp. 335–342. [Google Scholar]
- Moncrieff, R.W. An instrument for measuring and classifying odors. J. Appl. Physiol. 1961, 16, 742–749. [Google Scholar] [CrossRef]
- Persaud, K.; Dodd, G. Analysis of discrimination mechanisms in the mammalian olfactory system using a model nose. Nature 1982, 299, 352–355. [Google Scholar] [CrossRef]
- Göpel, W.; Ziegler, C.; Breer, H.; Schild, D.; Apfelbach, R.; Joerges, J.; Malaka, R. Bioelectronic noses: A status report part I. Biosens. Bioelectron. 1998, 13, 479–493. [Google Scholar] [CrossRef]
- Ko, H.J.; Park, T.H. Piezoelectric olfactory biosensor: Ligand specificity and dose-dependence of an olfactory receptor expressed in a heterologous cell system. Biosens. Bioelectron. 2005, 20, 1327–1332. [Google Scholar] [CrossRef] [PubMed]
- Park, S.J.; Kwon, O.S.; Lee, S.H.; Song, H.S.; Park, T.H.; Jang, J. Ultrasensitive flexible graphene based field-effect transistor (FET)-type bioelectronic nose. Nano Lett. 2012, 12, 5082–5090. [Google Scholar] [CrossRef] [PubMed]
- Lim, J.H.; Park, J.; Ahn, J.H.; Jin, H.J.; Hong, S.; Park, T.H. A peptide receptor-based bioelectronic nose for the real-time determination of seafood quality. Biosens. Bioelectron. 2013, 39, 244–249. [Google Scholar] [CrossRef]
- Gao, K.; Li, S.; Zhuang, L.; Qin, Z.; Zhang, B.; Huang, L.; Wang, P. In vivo bioelectronic nose using transgenic mice for specific odor detection. Biosens. Bioelectron. 2018, 102, 150–156. [Google Scholar] [CrossRef]
- Catalan, L.J.; Liang, V.; Jia, C.Q. Comparison of various detection limit estimates for volatile sulphur compounds by gas chromatography with pulsed flame photometric detection. J. Chromatogr. A 2006, 1136, 89–98. [Google Scholar] [CrossRef]
- Suresh, M.; Vasa, N.J.; Agarwal, V.; Chandapillai, J. UV photo-ionization based asymmetric field differential ion mobility sensor for trace gas detection. Sens. Actuators B Chem. 2014, 195, 44–51. [Google Scholar]
- de Gouw, J.; Warneke, C. Measurements of volatile organic compounds in the earth’s atmosphere using proton-transfer-reaction mass spectrometry. Mass Spectrom. Rev. 2007, 26, 223–257. [Google Scholar] [CrossRef]
- Zambotti, G.; Soprani, M.; Gobbi, E.; Capuano, R.; Pasqualetti, V.; Di Natale, C.; Ponzoni, A. Early detection of fish degradation by electronic nose. In Proceedings of the 2019 IEEE International Symposium on Olfaction and Electronic Nose (ISOEN), Fukuoka, Japan, 26–29 May 2019; pp. 1–3. [Google Scholar]
- Amal, H.; Leja, M.; Funka, K.; Skapars, R.; Sivins, A.; Ancans, G.; Liepniece-Karele, I.; Kikuste, I.; Lasina, I.; Haick, H. Detection of precancerous gastric lesions and gastric cancer through exhaled breath. Gut 2016, 65, 400–407. [Google Scholar] [CrossRef] [PubMed]
- Güntner, A.T.; Koren, V.; Chikkadi, K.; Righettoni, M.; Pratsinis, S.E. E-Nose Sensing of Low-ppb Formaldehyde in Gas Mixtures at High Relative Humidity for Breath Screening of Lung Cancer? ACS Sens. 2016, 1, 528–535. [Google Scholar] [CrossRef]
- Shehada, N.; Cancilla, J.C.; Torrecilla, J.S.; Pariente, E.S.; Brönstrup, G.; Christiansen, S.; Johnson, D.W.; Leja, M.; Davies, M.P.A.; Liran, O.; et al. Silicon Nanowire Sensors Enable Diagnosis of Patients via Exhaled Breath. ACS Nano 2016, 10, 7047–7057. [Google Scholar] [CrossRef] [PubMed]
- Brudzewski, K.; Osowski, S.; Dwulit, A. Recognition of coffee using differential electronic nose. IEEE Trans. Instrum. Meas. 2012, 61, 1803–1810. [Google Scholar] [CrossRef]
- Dutta, S.; Bhattacharjee, P.; Bhattacharyya, N. Assessment of shelf lives of black pepper and small cardamom cookies by metal oxide-based electronic nose using spoilage index. Food Bioprocess Technol. 2017, 10, 2023–2033. [Google Scholar] [CrossRef]
- Längkvist, M.; Coradeschi, S.; Loutfi, A.; Rayappan, J.B.B. Fast classification of meat spoilage markers using nanostructured ZnO thin films and unsupervised feature learning. Sensors 2013, 13, 1578–1592. [Google Scholar] [CrossRef]
- Brudzewski, K.; Osowski, S.; Pawlowski, W. Metal oxide sensor arrays for detection of explosives at sub-parts-per million concentration levels by the differential electronic nose. Sens. Actuators B Chem. 2012, 161, 528–533. [Google Scholar] [CrossRef]
- Mawardzi, M.; Japper-Jaafar, A.; Najib, M.; Daud, S.; Ya, T. Classification of waxy crude oil odor-profile using gas sensor array. IOP Publ. 2019, 469, 012073. [Google Scholar] [CrossRef]
- Rincón, M.; Getino, J.; Robla, J.; Hierro, J.G.; Mochón, J.; Bustinza, I. Gas sensor array for VOC’s monitoring in soils contamination. Ingeniería 2010, 14, 45–54. [Google Scholar]
- Bright, C.J.; Nallon, E.C.; Polcha, M.P.; Schnee, V.P. Quantum dot and polymer composite cross-reactive array for chemical vapor detection. Anal. Chem. 2015, 87, 12270–12275. [Google Scholar] [CrossRef]
- Wilson, A.D. Review of electronic-nose technologies and algorithms to detect hazardous chemicals in the environment. Procedia Technol. 2012, 1, 453–463. [Google Scholar] [CrossRef]
- Wojnowski, W.; Majchrzak, T.; Dymerski, T.; Gębicki, J.; Namieśnik, J. Electronic noses: Powerful tools in meat quality assessment. Meat Sci. 2017, 131, 119–131. [Google Scholar] [CrossRef]
- Llobet, E.; Smulko, J. Advanced Nanomaterials for Inexpensive Gas Microsensors-Synthesis, Integration and Applications; Elsevier: Cham, Switzerland, 2020. [Google Scholar]
- Wojnowski, W.; Majchrzak, T.; Dymerski, T.; Gębicki, J.; Namieśnik, J. Portable electronic nose based on electrochemical sensors for food quality assessment. Sensors 2017, 17, 2715. [Google Scholar] [CrossRef]
- Campagnoli, A.; Dell’Orto, V. Potential application of electronic olfaction systems in feedstuffs analysis and animal nutrition. Sensors 2013, 13, 14611–14632. [Google Scholar] [CrossRef]
- Triyana, K.; Rianjanu, A.; Nugroho, D.B.; As’ari, A.H.; Kusumaatmaja, A.; Roto, R.; Suryana, R.; Wasisto, H.S. A highly sensitive safrole sensor based on polyvinyl acetate (PVAc) nanofiber-coated QCM. Sci. Rep. 2019, 9, 1–12. [Google Scholar] [CrossRef]
- Kuchmenko, T.A.; Lvova, L.B. A perspective on recent advances in piezoelectric chemical sensors for environmental monitoring and foodstuffs analysis. Chemosensors 2019, 7, 39. [Google Scholar] [CrossRef]
- Majhi, S.M.; Mirzaei, A.; Kim, H.W.; Kim, S.S.; Kim, T.W. Recent advances in energy-saving chemiresistive gas sensors: A review. Nano Energy 2021, 79, 105369. [Google Scholar] [CrossRef] [PubMed]
- Paska, Y.; Haick, H. Interactive effect of hysteresis and surface chemistry on gated silicon nanowire gas sensors. ACS Appl. Mater. Interfaces 2012, 4, 2604–2617. [Google Scholar] [CrossRef] [PubMed]
- Do, J.-S.; Chen, Y.-Y.; Tsai, M.-L. Planar solid-state amperometric hydrogen gas sensor based on Nafion «/Pt/nano-structured polyaniline/Au/Al2O3 electrode. Int. J. Hydrog. Energy 2018, 43, 14848–14858. [Google Scholar] [CrossRef]
- Wang, C.; Xu, J.; Yang, B.; Xia, F.; Zhu, Y.; Xiao, J. Effect of MgO doping on the BiVO4 sensing electrode performance for YSZ-based potentiometric ammonia sensor. Solid State Electron. 2018, 147, 19–25. [Google Scholar] [CrossRef]
- Janata, J.; Josowicz, M. Conducting polymers in electronic chemical sensors. Nat. Mater. 2003, 2, 19–24. [Google Scholar] [CrossRef] [PubMed]
- Salehi-Khojin, A.; Khalili-Araghi, F.; Kuroda, M.A.; Lin, K.Y.; Leburton, J.-P.; Masel, R.I. On the sensing mechanism in carbon nanotube chemiresistors. ACS Nano 2011, 5, 153–158. [Google Scholar] [CrossRef]
- Righettoni, M.; Tricoli, A.; Pratsinis, S.E. Si: WO3 sensors for highly selective detection of acetone for easy diagnosis of diabetes by breath analysis. Anal. Chem. 2010, 82, 3581–3587. [Google Scholar] [CrossRef]
- Bai, H.; Shi, G. Gas sensors based on conducting polymers. Sensors 2007, 7, 267–307. [Google Scholar] [CrossRef]
- Murugappan, K.; Castell, M.R. Bridging electrode gaps with conducting polymers around the electrical percolation threshold. Electrochem. Commun. 2018, 87, 40–43. [Google Scholar] [CrossRef]
- Armitage, B.I.; Murugappan, K.; Lefferts, M.J.; Cowsik, A.; Castell, M.R. Conducting polymer percolation gas sensor on a flexible substrate. J. Mater. Chem. C 2020, 8, 12669–12676. [Google Scholar] [CrossRef]
- Gruber, J.; Nascimento, H.M.; Yamauchi, E.Y.; Li, R.W.; Esteves, C.H.; Rehder, G.P.; Gaylarde, C.C.; Shirakawa, M.A. A conductive polymer based electronic nose for early detection of Penicillium digitatum in post-harvest oranges. Mater. Sci. Eng. C 2013, 33, 2766–2769. [Google Scholar] [CrossRef]
- Zaporotskova, I.V.; Boroznina, N.P.; Parkhomenko, Y.N.; Kozhitov, L.V. Carbon nanotubes: Sensor properties. A review. Mod. Electron. Mater. 2016, 2, 95–105. [Google Scholar] [CrossRef]
- Nazemi, H.; Joseph, A.; Park, J.; Emadi, A. Advanced micro-and nano-gas sensor technology: A review. Sensors 2019, 19, 1285. [Google Scholar] [CrossRef]
- Das, S.; Jayaraman, V. SnO2: A comprehensive review on structures and gas sensors. Prog. Mater. Sci. 2014, 66, 112–255. [Google Scholar] [CrossRef]
- An, S.; Park, S.; Ko, H.; Lee, C. Fabrication of WO3 nanotube sensors and their gas sensing properties. Ceram. Int. 2014, 40, 1423–1429. [Google Scholar] [CrossRef]
- Dong, C.; Zhao, R.; Yao, L.; Ran, Y.; Zhang, X.; Wang, Y. A review on WO3 based gas sensors: Morphology control and enhanced sensing properties. J. Alloy. Compd. 2020, 820, 153194. [Google Scholar] [CrossRef]
- Shankar, P.; Rayappan, J.B.B. Gas sensing mechanism of metal oxides: The role of ambient atmosphere, type of semiconductor and gases-A review. Sci. Lett. J. 2015, 4, 126. [Google Scholar]
- Zhu, L.; Zeng, W. Room-temperature gas sensing of ZnO-based gas sensor: A review. Sens. Actuators A Phys. 2017, 267, 242–261. [Google Scholar] [CrossRef]
- Arif, M.; Sanger, A.; Singh, A. Highly sensitive NiO nanoparticle based chlorine gas sensor. J. Electron. Mater. 2018, 47, 3451–3458. [Google Scholar] [CrossRef]
- Rydosz, A. The use of copper oxide thin films in gas-sensing applications. Coatings 2018, 8, 425. [Google Scholar] [CrossRef]
- Xu, J.; Cheng, J. The advances of Co3O4 as gas sensing materials: A review. J. Alloy. Compd. 2016, 686, 753–768. [Google Scholar] [CrossRef]
- Wang, X.; Tian, W.; Zhai, T.; Zhi, C.; Bando, Y.; Golberg, D. Cobalt (II, III) oxide hollow structures: Fabrication, properties and applications. J. Mater. Chem. 2012, 22, 23310–23326. [Google Scholar] [CrossRef]
- Man, L.; Niu, B.; Xu, H.; Cao, B.; Wang, J. Microwave hydrothermal synthesis of nanoporous cobalt oxides and their gas sensing properties. Mater. Res. Bull. 2011, 46, 1097–1101. [Google Scholar] [CrossRef]
- Barsan, N.; Weimar, U. Conduction model of metal oxide gas sensors. J. Electroceramics 2001, 7, 143–167. [Google Scholar] [CrossRef]
- Mahajan, S.; Jagtap, S. Metal-oxide semiconductors for carbon monoxide (CO) gas sensing: A review. Appl. Mater. Today 2020, 18, 100483. [Google Scholar] [CrossRef]
- Rebholz, J.; Bonanati, P.; Weimar, U.; Barsan, N. Grain shape influence on semiconducting metal oxide based gas sensor performance: Modeling versus experiment. Anal. Bioanal. Chem. 2014, 406, 3977–3983. [Google Scholar] [CrossRef] [PubMed]
- Yamazoe, N.; Shimanoe, K. Receptor function and response of semiconductor gas sensor. J. Sens. 2009, 2009, 1–21. [Google Scholar] [CrossRef]
- Kim, I.-D.; Rothschild, A.; Tuller, H.L. Advances and new directions in gas-sensing devices. Acta Mater. 2013, 61, 974–1000. [Google Scholar] [CrossRef]
- Barsan, N.; Koziej, D.; Weimar, U. Metal oxide-based gas sensor research: How to? Sens. Actuators B Chem. 2007, 121, 18–35. [Google Scholar] [CrossRef]
- Yamazoe, N. Toward innovations of gas sensor technology. Sens. Actuators B Chem. 2005, 108, 2–14. [Google Scholar] [CrossRef]
- Ramgir, N.S. Electronic nose based on nanomaterials: Issues, challenges, and prospects. Int. Sch. Res. Not. 2013, 2013, 1–21. [Google Scholar] [CrossRef]
- Gutierrez-Osuna, R. Pattern analysis for machine olfaction: A review. IEEE Sens. J. 2002, 2, 189–202. [Google Scholar] [CrossRef]
- Saha, P.K.; Patwary, N.S.; Ahmed, I. A Widespread Study of Diabetes Prediction Using Several Machine Learning Techniques. In Proceedings of the 2019 22nd International Conference on Computer and Information Technology (ICCIT), Dhaka, Bangladesh, 18–20 December 2019; pp. 1–5. [Google Scholar]
- Scott, S.M.; James, D.; Ali, Z. Data analysis for electronic nose systems. Microchim. Acta 2006, 156, 183–207. [Google Scholar] [CrossRef]
- Graves, A.; Liwicki, M.; Fernández, S.; Bertolami, R.; Bunke, H.; Schmidhuber, J. A novel connectionist system for unconstrained handwriting recognition. IEEE Trans. Pattern Anal. Mach. Intell. 2008, 31, 855–868. [Google Scholar] [CrossRef]
- Hong, H.-K.; Kwon, C.H.; Kim, S.-R.; Yun, D.H.; Lee, K.; Sung, Y.K. Portable electronic nose system with gas sensor array and artificial neural network. Sens. Actuators B Chem. 2000, 66, 49–52. [Google Scholar] [CrossRef]
- Sanaeifar, A.; ZakiDizaji, H.; Jafari, A.; de la Guardia, M. Early detection of contamination and defect in foodstuffs by electronic nose: A review. Trac. Trends Anal. Chem. 2017, 97, 257–271. [Google Scholar] [CrossRef]
- Gobbi, E.; Falasconi, M.; Torelli, E.; Sberveglieri, G. Electronic nose predicts high and low fumonisin contamination in maize cultures. Food Res. Int. 2011, 44, 992–999. [Google Scholar] [CrossRef]
- Srivastava, S.; Mishra, G.; Mishra, H.N. Fuzzy controller based E-nose classification of Sitophilus oryzae infestation in stored rice grain. Food Chem. 2019, 283, 604–610. [Google Scholar] [CrossRef]
- Sberveglieri, V.; Carmona, E.N.; Comini, E.; Ponzoni, A.; Zappa, D.; Pirrotta, O.; Pulvirenti, A. A novel electronic nose as adaptable device to judge microbiological quality and safety in foodstuff. BioMed Res. Int. 2014, 2014, 1–6. [Google Scholar] [CrossRef]
- Hidayat, S.N.; Nuringtyas, T.R.; Triyana, K. Electronic Nose Coupled with Chemometrics for Monitoring of Tempeh Fermentation Process. In Proceedings of the 2018 4th International Conference on Science and Technology (ICST), Yogyakarta, Indonesia, 7–8 August 2018; pp. 1–6. [Google Scholar]
- Kovács, Z.; Dalmadi, I.; Lukács, L.; Sipos, L.; Szántai-Kőhegyi, K.; Kókai, Z.; Fekete, A. Geographical origin identification of pure Sri Lanka tea infusions with electronic nose, electronic tongue and sensory profile analysis. J. Chemom. 2010, 24, 121–130. [Google Scholar] [CrossRef]
- Julian, T.; Hidayat, S.N.; Triyana, K. Metal Oxide Semiconductor Based Electronic Nose as Classification and Prediction Instrument for Nicotine Concentration in Unflavoured Electronic Juice. In Proceedings of the 2018 4th International Conference on Science and Technology (ICST), Yogyakarta, Indonesia, 7–8 August 2018; pp. 1–5. [Google Scholar]
- Hong, X.; Wang, J.; Qiu, S. Authenticating cherry tomato juices—Discussion of different data standardization and fusion approaches based on electronic nose and tongue. Food Res. Int. 2014, 60, 173–179. [Google Scholar] [CrossRef]
- Santos, J.P.; Lozano, J. Real time detection of beer defects with a hand held electronic nose. In Proceedings of the 2015 10th Spanish Conference on Electron Devices (CDE), Madrid, Spain, 11–13 February 2015; pp. 1–4. [Google Scholar]
- Sberveglieri, G.; Zambotti, G.; Falasconi, M.; Gobbi, E.; Sberveglieri, V. MOX-NW electronic nose for detection of food microbial contamination. In Proceedings of the 2014 IEEE SENSORS, Valencia, Spain, 2–5 November 2014; pp. 1376–1379. [Google Scholar]
- Jia, W.; Liang, G.; Tian, H.; Sun, J.; Wan, C. Electronic nose-based technique for rapid detection and recognition of moldy apples. Sensors 2019, 19, 1526. [Google Scholar] [CrossRef]
- Guohua, H.; Yuling, W.; Dandan, Y.; Wenwen, D.; Linshan, Z.; Lvye, W. Study of peach freshness predictive method based on electronic nose. Food Control 2012, 28, 25–32. [Google Scholar] [CrossRef]
- Konduru, T.; Rains, G.C.; Li, C. A customized metal oxide semiconductor-based gas sensor array for onion quality evaluation: System development and characterization. Sensors 2015, 15, 1252–1273. [Google Scholar] [CrossRef] [PubMed]
- Ghasemi-Varnamkhasti, M.; Mohammad-Razdari, A.; Yoosefian, S.H.; Izadi, Z.; Rabiei, G. Selection of an optimized metal oxide semiconductor sensor (MOS) array for freshness characterization of strawberry in polymer packages using response surface method (RSM). Postharvest Biol. Technol. 2019, 151, 53–60. [Google Scholar] [CrossRef]
- Zappa, D. Low-Power Detection of Food Preservatives by a Novel Nanowire-Based Sensor Array. Foods 2019, 8, 226. [Google Scholar] [CrossRef] [PubMed]
- Tian, H.; Li, F.; Qin, L.; Yu, H.; Ma, X. Discrimination of chicken seasonings and beef seasonings using electronic nose and sensory evaluation. J. Food Sci. 2014, 79, S2346–S2353. [Google Scholar] [CrossRef] [PubMed]
- Güney, S.; Atasoy, A. Study of fish species discrimination via electronic nose. Comput. Electron. Agric. 2015, 119, 83–91. [Google Scholar] [CrossRef]
- Wijaya, D.R.; Sarno, R.; Daiva, A.F. Electronic nose for classifying beef and pork using Naïve Bayes. In Proceedings of the 2017 International Seminar on Sensors, Instrumentation, Measurement and Metrology (ISSIMM), Surabaya, Indonesia, 25–26 August 2017; pp. 104–108. [Google Scholar]
- Haddi, Z.; Annanouch, F.; Amari, A.; Hadoune, A.; Bouchikhi, B.; ElBari, N. Application of a portable electronic nose device to discriminate and identify cheeses with known percentages of cow’s and goat’s milk. In Proceedings of the SENSORS, 2010 IEEE, Waikoloa, HI, USA, 1–4 November 2010; pp. 771–774. [Google Scholar]
- Wang, B.; Xu, S.; Sun, D.-W. Application of the electronic nose to the identification of different milk flavorings. Food Res. Int. 2010, 43, 255–262. [Google Scholar] [CrossRef]
- Ding, W.; Zhang, Y.; Kou, L.; Jurick, W.M. Electronic nose application for the determination of Penicillin g in Saanen goat milk with Fisher discriminate and multilayer perceptron neural network analyses. J. Food Process. Preserv. 2015, 39, 927–932. [Google Scholar] [CrossRef]
- Tohidi, M.; Ghasemi-Varnamkhasti, M.; Ghafarinia, V.; Mohtasebi, S.S.; Bonyadian, M. Identification of trace amounts of detergent powder in raw milk using a customized low-cost artificial olfactory system: A novel method. Measurement 2018, 124, 120–129. [Google Scholar] [CrossRef]
- Mu, F.; Gu, Y.; Zhang, J.; Zhang, L. Milk Source Identification and Milk Quality Estimation Using an Electronic Nose and Machine Learning Techniques. Sensors 2020, 20, 4238. [Google Scholar] [CrossRef] [PubMed]
- Lerma-García, M.; Cerretani, L.; Cevoli, C.; Simó-Alfonso, E.; Bendini, A.; Toschi, T.G. Use of electronic nose to determine defect percentage in oils. Comparison with sensory panel results. Sens. Actuators B Chem. 2010, 147, 283–289. [Google Scholar] [CrossRef]
- Haddi, Z.; Amari, A.; Ali, A.O.; El Bari, N.; Barhoumi, H.; Maaref, A.; Jaffrezic-Renault, N.; Bouchikhi, B. Discrimination and identification of geographical origin virgin olive oil by an e-nose based on MOS sensors and pattern recognition techniques. Procedia Eng. 2011, 25, 1137–1140. [Google Scholar] [CrossRef]
- Xu, L.; Yu, X.; Liu, L.; Zhang, R. A novel method for qualitative analysis of edible oil oxidation using an electronic nose. Food Chem. 2016, 202, 229–235. [Google Scholar] [CrossRef] [PubMed]
- Gancarz, M.; Wawrzyniak, J.; Gawrysiak-Witulska, M.; Wiącek, D.; Nawrocka, A.; Tadla, M.; Rusinek, R. Application of electronic nose with MOS sensors to prediction of rapeseed quality. Measurement 2017, 103, 227–234. [Google Scholar] [CrossRef]
- Karami, H.; Rasekh, M.; Mirzaee-Ghaleh, E. Qualitative analysis of edible oil oxidation using an olfactory machine. J. Food Meas. Charact. 2020, 14, 2600–2610. [Google Scholar] [CrossRef]
- Huang, L.; Liu, H.; Zhang, B.; Wu, D. Application of electronic nose with multivariate analysis and sensor selection for botanical origin identification and quality determination of honey. Food Bioprocess Technol. 2015, 8, 359–370. [Google Scholar] [CrossRef]
- Heidarbeigi, K.; Mohtasebi, S.S.; Foroughirad, A.; Ghasemi-Varnamkhasti, M.; Rafiee, S.; Rezaei, K. Detection of adulteration in saffron samples using electronic nose. Int. J. Food Prop. 2015, 18, 1391–1401. [Google Scholar] [CrossRef]
- Ghasemi-Varnamkhasti, M.; Amiri, Z.S.; Tohidi, M.; Dowlati, M.; Mohtasebi, S.S.; Silva, A.C.; Fernandes, D.D.; Araujo, M.C. Differentiation of cumin seeds using a metal-oxide based gas sensor array in tandem with chemometric tools. Talanta 2018, 176, 221–226. [Google Scholar] [CrossRef]
- Liu, H.; Zeng, F.K.; Wang, Q.H.; Wu, H.S. Studies on the chemical and flavor qualities of white pepper (Piper nigrum L.) derived from five new genotypes. Eur. Food Res. Technol. 2013, 237, 245–251. [Google Scholar] [CrossRef]
- Banach, U.; Tiebe, C.; Hübert, T. Multigas sensors for the quality control of spice mixtures. Food Control 2012, 26, 23–27. [Google Scholar] [CrossRef]
- Handford, C.E.; Campbell, K.; Elliott, C.T. Impacts of milk fraud on food safety and nutrition with special emphasis on developing countries. Compr. Rev. Food Sci. Food Saf. 2016, 15, 130–142. [Google Scholar] [CrossRef] [PubMed]
- Upadhyay, R.; Sehwag, S.; Mishra, H.N. Electronic nose guided determination of frying disposal time of sunflower oil using fuzzy logic analysis. Food Chem. 2017, 221, 379–385. [Google Scholar] [CrossRef]
- He, J.; Xu, L.; Wang, P.; Wang, Q. A high precise E-nose for daily indoor air quality monitoring in living environment. Integration 2017, 58, 286–294. [Google Scholar] [CrossRef]
- Wongchoosuk, C.; Khunarak, C.; Lutz, M.; Kerdcharoen, T. WiFi electronic nose for indoor air monitoring. In Proceedings of the 2012 9th International Conference on Electrical Engineering/Electronics, Computer, Telecommunications and Information Technology, Phetchaburi, Thailand, 16–18 May 2012; pp. 1–4. [Google Scholar]
- Mahmodi, K.; Mostafaei, M.; Mirzaee-Ghaleh, E. Detection and classification of diesel-biodiesel blends by LDA, QDA and SVM approaches using an electronic nose. Fuel 2019, 258, 116114. [Google Scholar] [CrossRef]
- Bieganowski, A.; Jaromin-Glen, K.; Guz, Ł.; Łagód, G.; Jozefaciuk, G.; Franus, W.; Suchorab, Z.; Sobczuk, H. Evaluating soil moisture status using an e-nose. Sensors 2016, 16, 886. [Google Scholar] [CrossRef]
- Bitter, F.; Müller, B.; Müller, D. Estimation of odour intensity of indoor air pollutants from building materials with a multi-gas sensor system. Build. Environ. 2010, 45, 197–204. [Google Scholar] [CrossRef]
- Leidinger, M.; Sauerwald, T.; Reimringer, W.; Ventura, G.; Schütze, A. Selective detection of hazardous VOCs for indoor air quality applications using a virtual gas sensor array. J. Sens. Sens. Syst. 2014, 3, 253. [Google Scholar] [CrossRef]
- Prajapati, C.S.; Soman, R.; Rudraswamy, S.; Nayak, M.; Bhat, N. Single chip gas sensor array for air quality monitoring. J. Microelectromech. Syst. 2017, 26, 433–439. [Google Scholar] [CrossRef]
- Yi, S.; Tian, S.; Zeng, D.; Xu, K.; Peng, X.; Wang, H.; Zhang, S.; Xie, C. A novel approach to fabricate metal oxide nanowire-like networks based coplanar gas sensors array for enhanced selectivity. Sens. Actuators B Chem. 2014, 204, 351–359. [Google Scholar] [CrossRef]
- Sayago, I.; Aleixandre, M.; Santos, J.P. Development of tin oxide-based nanosensors for electronic nose environmental applications. Biosensors 2019, 9, 21. [Google Scholar] [CrossRef] [PubMed]
- Horsfall, L.A.; Pugh, D.C.; Blackman, C.S.; Parkin, I.P. An array of WO 3 and CTO heterojunction semiconducting metal oxide gas sensors used as a tool for explosive detection. J. Mater. Chem. A 2017, 5, 2172–2179. [Google Scholar] [CrossRef]
- Bieganowski, A.; Józefaciuk, G.; Bandura, L.; Guz, Ł.; Łagód, G.; Franus, W. Evaluation of hydrocarbon soil pollution using e-nose. Sensors 2018, 18, 2463. [Google Scholar] [CrossRef]
- Dorji, U.; Pobkrut, T.; Kerdcharoen, T. Electronic nose based wireless sensor network for soil monitoring in precision farming system. In Proceedings of the 2017 9th International Conference on Knowledge and Smart Technology (KST), Chonburi, Thailand, 1–4 February 2017; pp. 182–186. [Google Scholar]
- Dorji, U.; Pobkrut, T.; Siyang, S.; Chaiyasit, T.; Choden, P.; Kerdcharoen, T. Development of real time smart electronic nose system for monitoring organic abundance in soil. In Proceedings of the 2017 14th International Conference on Electrical Engineering/Electronics, Computer, Telecommunications and Information Technology (ECTI-CON), Phuket, Thailand, 27–30 June 2017; pp. 163–166. [Google Scholar]
- Zhu, L.; Jia, H.; Chen, Y.; Wang, Q.; Li, M.; Huang, D.; Bai, Y. A novel method for soil organic matter determination by using an artificial olfactory system. Sensors 2019, 19, 3417. [Google Scholar] [CrossRef]
- Bourgeois, W.; Burgess, J.E.; Stuetz, R.M. On-line monitoring of wastewater quality: A review. J. Chem. Technol. Biotechnol. Int. Res. Process Environ. Clean Technol. 2001, 76, 337–348. [Google Scholar] [CrossRef]
- Fang, X.; Guo, X.; Shi, H.; Cai, Q. Determination of Ammonia nitrogen in wastewater using electronic nose. In Proceedings of the 2010 4th International Conference on Bioinformatics and Biomedical Engineering, Chengdu, China, 18–20 June 2010; pp. 1–4. [Google Scholar]
- Palasuek, R.; Seesa-ard, T.; Kunarak, C.; Kerdcharoen, T. Electronic nose for water monitoring: The relationship between wastewater quality indicators and odor. In Proceedings of the 2015 12th International Conference on Electrical Engineering/Electronics, Computer, Telecommunications and Information Technology (ECTI-CON), Hua Hin, Thailand, 24–26 June 2015; pp. 1–5. [Google Scholar]
- Moufid, M.; Hofmann, M.; El Bari, N.; Tiebe, C.; Bartholmai, M.; Bouchikhi, B. Wastewater monitoring by means of e-nose, VE-tongue, TD-GC-MS, and SPME-GC-MS. Talanta 2020, 221, 121450. [Google Scholar] [CrossRef] [PubMed]
- Nicolas, J.; Cerisier, C.; Delva, J.; Romain, A.-C. Potential of a network of electronic noses to assess in real time the odour annoyance in the environment of a compost facility. Chem. Eng. Trans. 2012, 30, 133–138. [Google Scholar]
- Suchorab, Z.; Frąc, M.; Guz, Ł.; Oszust, K.; Łagód, G.; Gryta, A.; Bilińska-Wielgus, N.; Czerwiński, J. A method for early detection and identification of fungal contamination of building materials using e-nose. PLoS ONE 2019, 14, e0215179. [Google Scholar] [CrossRef] [PubMed]
- Fahad, H.M.; Shiraki, H.; Amani, M.; Zhang, C.; Hebbar, V.S.; Gao, W.; Ota, H.; Hettick, M.; Kiriya, D.; Chen, Y.-Z. Room temperature multiplexed gas sensing using chemical-sensitive 3.5-nm-thin silicon transistors. Sci. Adv. 2017, 3, e1602557. [Google Scholar] [CrossRef] [PubMed]


| Category | Purpose of Analysis | Manufacturer | No. of Sensors | Material | Pattern Analysis Technique | Ref. |
|---|---|---|---|---|---|---|
| Bakery and Grains | Shelf life | Figaro, Inc | 8 | SnO2 based | PCA | [21] |
| Contamination | SACMI IMOLA scarl, Imola, Italy | 6 | SnO2; WO3; SnO2-Au; SnO2-Ag; SnO2-Mo; SnO2-SiO2 | PCA | [71] | |
| Alpha Soft Fox 2.0, Alpha M.O.S, France | 18 | PCA; MLR | [72] | |||
| Quality | SACMI IMOLA scarl, Imola, Italy | 6 | SnO2; WO3; SnO2-Au; SnO2-Ag; SnO2-Mo; SnO2-SiO2 | PCA | [73] | |
| Quality | Figaro, Inc | 8 | SnO2 based | LDA; SVM; KNN; RF | [74] | |
| Beverages | Contamination | Figaro, Inc | 12 | SnO2 based | PCA | [23] |
| Geographical Origin | Applied Sensor A.G., Sweden | 10 MOSFET;12 MOS | – | PCA, PLS | [75] | |
| Identification | Figaro, Inc | 8 | SnO2 based | PCA; LDA | [76] | |
| Quality | Airsense Analytics, GmBH, Schwerin, Germany | 10 | – | ANOVA; PCA; CA | [77] | |
| SILSENSE | 4 | SnO2; Pd-SnO2 | PCA; ANN | [78] | ||
| Contamination | Figaro, Inc | 5 | SnO2-MoO3; SnO2-MO; SnO2 | PCA; LDA | [79] | |
| Fruits and Vegetables | Identification | Airsense Analytics, GmBH, Schwerin, Germany | 10 | – | – | [80] |
| Quality | 8 | SnO2 | PCA; SR | [81] | ||
| Figaro, Inc. and FIS Inc. | 7 | SnO2, WO3 | PCA; LDA | [82] | ||
| Figaro Engineering, Inc (USA).; Hanwei Electronics Co. (China); FIS (Japan) | 8 | SnO2 based | PCA; LDA; SVM | [83] | ||
| Meat and Fish | Quality | Home-made | 3 | ZnO; Mn doped ZnO; F doped ZnO | PCA; SVM; DBN; Auto-encoder | [22] |
| Contamination | Home-made | 3 | WO3; SnO2; CuO | PCA | [84] | |
| Identification | Alpha MOS Toulouse, France | 18 | Cr2-xTixO3-7; WO3; SnO2 | PCA; DFA; CA | [85] | |
| Figaro Inc. (USA) | 8 | SnO2 based | parameter extraction; sub-sampling | [86] | ||
| Arduino Mega | 8 | – | – | [87] | ||
| Milk and Dairy | Identification | Figaro Inc. | 6 | SnO2 based | PCA; DFA; MANOVA | [88] |
| Fox 4000, Alpha M.O.S. | 18 | – | PCA | [89] | ||
| Airsense Analytics, Schwerin, Germany | 10 | – | LDA; FDA; MLP | [90] | ||
| Figaro Engineering Inc; Hanwei Electronics Co.; FIS Inc. | 8 | SnO2 based | MANOVA; PCA; LDA; SVM; ANFIS | [91] | ||
| Figaro Inc. | 7 | SnO2 based | PCA; LDA; SVM; RF | [92] | ||
| Oils | Contamination | SACMI IMOLA scarl, Imola, Italy | 6 | SnO2; WO3; SnO2-Au; SnO2-Ag; SnO2-Mo; SnO2-SiO2 | LDA; ANN | [93] |
| Geographical Origin | Figaro Inc. | 6 | SnO2 based | PCA; LDA | [94] | |
| Quality | Airsense Analytics, Schwerin, Germany | 10 | – | CA; PCA; LDA | [95] | |
| Fiagaro Engineering (Japan); Ams (USA) | 8 | SnO2 based | PCA | [96] | ||
| – | 8 | – | CA; PCA; PLS; QDA; SVM | [97] | ||
| Spices | Geographical Origin | Alpha M.O.S, France | 18 | SnO2; WO3; Cr2-xTiO3+y | PCA; DFA | [98] |
| Contamination | Hanwei Electronics Co., Ltd., Henan, China | 6 | SnO2 based | PCA; LDA; PCR; PLS; ANN | [99] | |
| Identification | – | 8 | SnO2 based | LDA; PLS; PARAFAC-LDA | [100] | |
| Alpfha M.O.S. | 6 | – | ANOVA; PCA | [101] | ||
| Quality | Karlsruhe Micro Nose | 38 | SnO2 based | PCA; LDA | [102] |
| Sensor Element | Gas Detected | Detection Range (ppm) | Ref |
|---|---|---|---|
| MS1100 | Formaldehyde, Toluene, Organic Solvent | 1–1000 | [105] |
| QS-01 | Hydrogen, Carbon Monoxide, Ethanol, Ammonia | 1–1000 | |
| TGS2611 | Hydrogen, Ethanol, Methane | 500–1000 | |
| TGS2600 | Hydrogen, Carbon Monoxide, Methane, Ethanol, Isobutane | 1–30 | [105,106] |
| TGS2612 | Isobutane, Ethanol, Methane, Propane | 200–1000 | [106] |
| TGS825 | Hydrogen Disulfide | 5–100 | |
| TGS826 | Isobutane, Hydrogen, Ammonia, Ethanol | 30–120 | |
| TGS2602 | Hydrogen, Ammonia, Toluene, Ethanol, Hydrogen Disulfide | 1–30 | [105,106,107] |
| MQ135 | Ammonia, Benzene and Sulfide Steams | 10–10,000 | [107] |
| MQ136 | Sulfur Dioxide | 1–200 | |
| MQ3 | Alcohol | 10–300 | |
| MQ9 | Carbon Monoxide and Combustion Gases | 10–1000 (Carbon Monoxide); 100–10,000 (Combustion Gases) | |
| TGS2620 | Alcohol and Organic Solvents Steam, Isobutane, Hydrogen, Ethanol, Methane, Propane | 50–5000 | [106,107] |
| TGS813 | Methane, Propane and Butane, Hydrogen, Ethanol, Carbon Monoxide | 500–10,000 | |
| TGS822 | Organic Solvents Steam, Isobutane, Ethanol, Methane, Carbon Monoxide, N-Hexane, Benzene, Acetone | 50–5000 | |
| TGS2600-B00 | General Air Contaminants, Hydrogen, Ethanol | 1–30 (Hydrogen) | [108] |
| TGS2602-B00 | Air Contaminants, Toluene, VOCs, Ammonia, Hydrogen Disulfide | 1–30 (Ethanol) | |
| TGS2610-C00 | Butane, Liquified Petroleum Gas (LPG) | 500–10,000 | |
| TGS2610-D00 | Butane, LPG (Carbon Filter) | 500–10,000 | |
| TGS2611-C00 | Methane, Natural Gas | 500–10,000 | |
| TGS2611-E00 | Methane, Natural Gas (Carbon Filter) | 500–10,000 | |
| TGS2620-C00 | Alcohol, Solvent Vapors, Carbon Oxide, Hydrogen | 50–5000 |
Publisher’s Note: MDPI stays neutral with regard to jurisdictional claims in published maps and institutional affiliations. |
© 2021 by the authors. Licensee MDPI, Basel, Switzerland. This article is an open access article distributed under the terms and conditions of the Creative Commons Attribution (CC BY) license (http://creativecommons.org/licenses/by/4.0/).
Share and Cite
John, A.T.; Murugappan, K.; Nisbet, D.R.; Tricoli, A. An Outlook of Recent Advances in Chemiresistive Sensor-Based Electronic Nose Systems for Food Quality and Environmental Monitoring. Sensors 2021, 21, 2271. https://doi.org/10.3390/s21072271
John AT, Murugappan K, Nisbet DR, Tricoli A. An Outlook of Recent Advances in Chemiresistive Sensor-Based Electronic Nose Systems for Food Quality and Environmental Monitoring. Sensors. 2021; 21(7):2271. https://doi.org/10.3390/s21072271
Chicago/Turabian StyleJohn, Alishba T., Krishnan Murugappan, David R. Nisbet, and Antonio Tricoli. 2021. "An Outlook of Recent Advances in Chemiresistive Sensor-Based Electronic Nose Systems for Food Quality and Environmental Monitoring" Sensors 21, no. 7: 2271. https://doi.org/10.3390/s21072271
APA StyleJohn, A. T., Murugappan, K., Nisbet, D. R., & Tricoli, A. (2021). An Outlook of Recent Advances in Chemiresistive Sensor-Based Electronic Nose Systems for Food Quality and Environmental Monitoring. Sensors, 21(7), 2271. https://doi.org/10.3390/s21072271