1. Introduction
During the last years, Human-Machine Interfaces (HMIs) and, especially, Brain-Computer Interfaces (BCIs), have become very active research fields with significant developments and advances in non-clinical areas such as entertainment, home automation or cognitive training [
1]. BCI systems can be defined as the combination of hardware and software in a communication system that monitors the user’s cerebral activity and translates certain characteristics, corresponding to the user’s intentions, to commands for device control [
2]. BCIs present a new communication channel with outer devices without the involvement of peripheral nerves and muscles, allowing users to interact with the environment without any physical activity and using only their thoughts. Therefore, it results in an extremely useful technology for patients with severe motor disabilities. Electroencephalography (EEG) is the most widely used technique for neuroimaging and brain signal acquisition for BCIs. This preference is mainly based on the non-invasive character of this technology, which implies a low risk for the users. Moreover, it shows several advantages such as its high portability and temporal resolution, its relatively low cost, and its ease of use [
1,
3,
4]. The brain activity collected by the EEG encodes the users’ intentions, which can be translated into control commands for interacting with their surroundings. For this purpose, several brain signal patterns have been assessed, where Motor-Imagery (MI) synchronisation/desynchronisation, Steady-State Visual Evoked Potential (SSVEP) and P300 Evoked Potential (P300 EP) are the most common approaches [
1].
The P300 EP is a positive deflection located in the parietal area of the cortex that occurs in the EEG brain activity
after an infrequent or surprising auditory, visual or somatosensory stimuli [
5,
6,
7]. The potential is usually evoked by the “oddball” paradigm, where several stimuli are presented to the subject and one of them is less frequent than the others. Based on this brain response, a specific action can be associated to that stimulus so it will be executed when the P300 is detected. The most common way to employ the P300 EP in BCIs is through visual stimulation, where different elements which users can interact with are, usually, randomly presented on a screen. Users must focus their attention on one of these infrequent elements so that when it appears, the P300 potential will be elicited and BCIs can detect and execute associated actions.
Voluntary eye movements such as blinking, saccades or fixation have also been used as control signals in different HMIs. The electrical signal produced by the eye activity can be measured using the Electrooculography (EOG) technique, also a non-invasive, portable, easy to use and affordable technology [
8]. EOG signals are stronger in amplitude than the EEG ones, so they are easier to detect and more stable across users [
9], which can be an advantage to improve the accuracy of the interface. Consequently, several HMIs have been proposed employing blinking movements as control signals [
9,
10]. The eye can be modelled as a dipole with its positive pole at the cornea and its negative pole at the retina [
8]. When closing and opening the eyelids, that is, blinking, a vertical movement is produced in the eye, which causes a change in the dipole orientation and thus a change in the electric potential field measured by EOG. As a consequence, a blink presents a specific pattern captured by the EOG signal, characterized by two consecutive large peaks, positive and negative, respectively, corresponding to the closing and opening of the eye. These two large peaks are easily recognized from the recorded signal, so HMIs can detect them in order to execute associated actions.
Non-contact methods, such as Videooculography (VOG), have also been successfully applied for eye gaze analysis and blink detection to develop new HMIs [
11,
12]. These detection systems usually employ several cameras that record the user’s eyes and, applying image processing techniques and artificial vision algorithms, they can provide an accurate analysis of the eye state of the user [
13,
14,
15]. However, in comparison with EOG techniques, these VOG methods have a high computational complexity derived from image analysis and classification. This makes it difficult to implement in Single-Board Computers (SBC) integrated into, for example, a smart home environment.
The use of EEG and EOG signals for interaction with home elements is a current challenge. Previous works have developed multi-sensor systems to capture brain or eye activity to detect the user’s intentions [
16,
17,
18,
19,
20,
21]. However, multi-sensor recording devices are usually large and cumbersome, which becomes a problem when used for several hours a day. Single-channel solutions have been proposed in order to overcome this issue [
10,
22,
23,
24]. Recently, we have shown that low-cost systems with only one input electrode are very useful for developing Internet of Things (IoT) applications in smart-home environments [
25]. Keeping up with this idea, in this paper we develop and compare two systems focused on the interaction between users and home elements. The first system is based on the P300 evoked potential, whereas the second one uses eye blinks as control signals. We have developed a Graphical User Interface (GUI) where home elements are displayed in a matrix-form and presented using two different paradigms: (i) home elements are presented one-by-one; (ii) the elements of the same row/column are presented together. Our objective is to determine which combination of system and paradigm offers the best performance in terms of accuracy and time delay.
The paper is organized as follows.
Section 2 summarizes some of the most important works related to the utilization of the P300 potential and voluntary blinks as control signals.
Section 3 shows the two developed interfaces that make use of those control signals and describes the materials and methods employed in the experiments.
Section 4 shows the obtained results. Finally,
Section 5 analyzes these results and
Section 6 presents the most relevant conclusions of this work.
3. Material and Methods
Two different systems have been developed in this study.
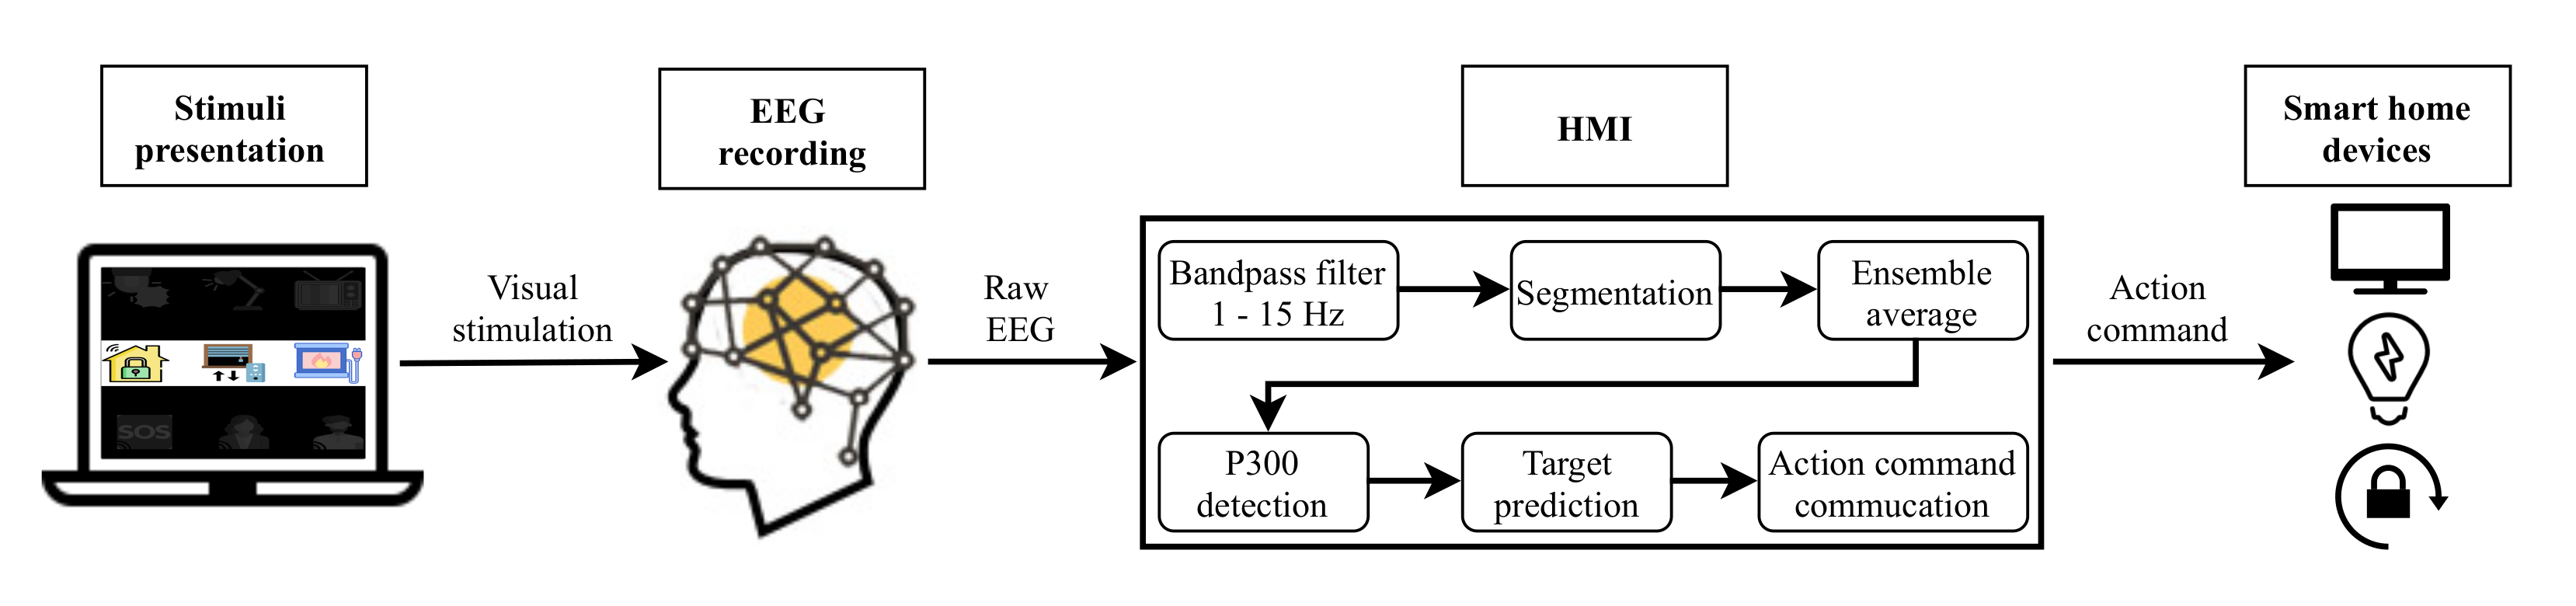
Figure 1 depicts the architecture of the EEG control system based on P300 EP.
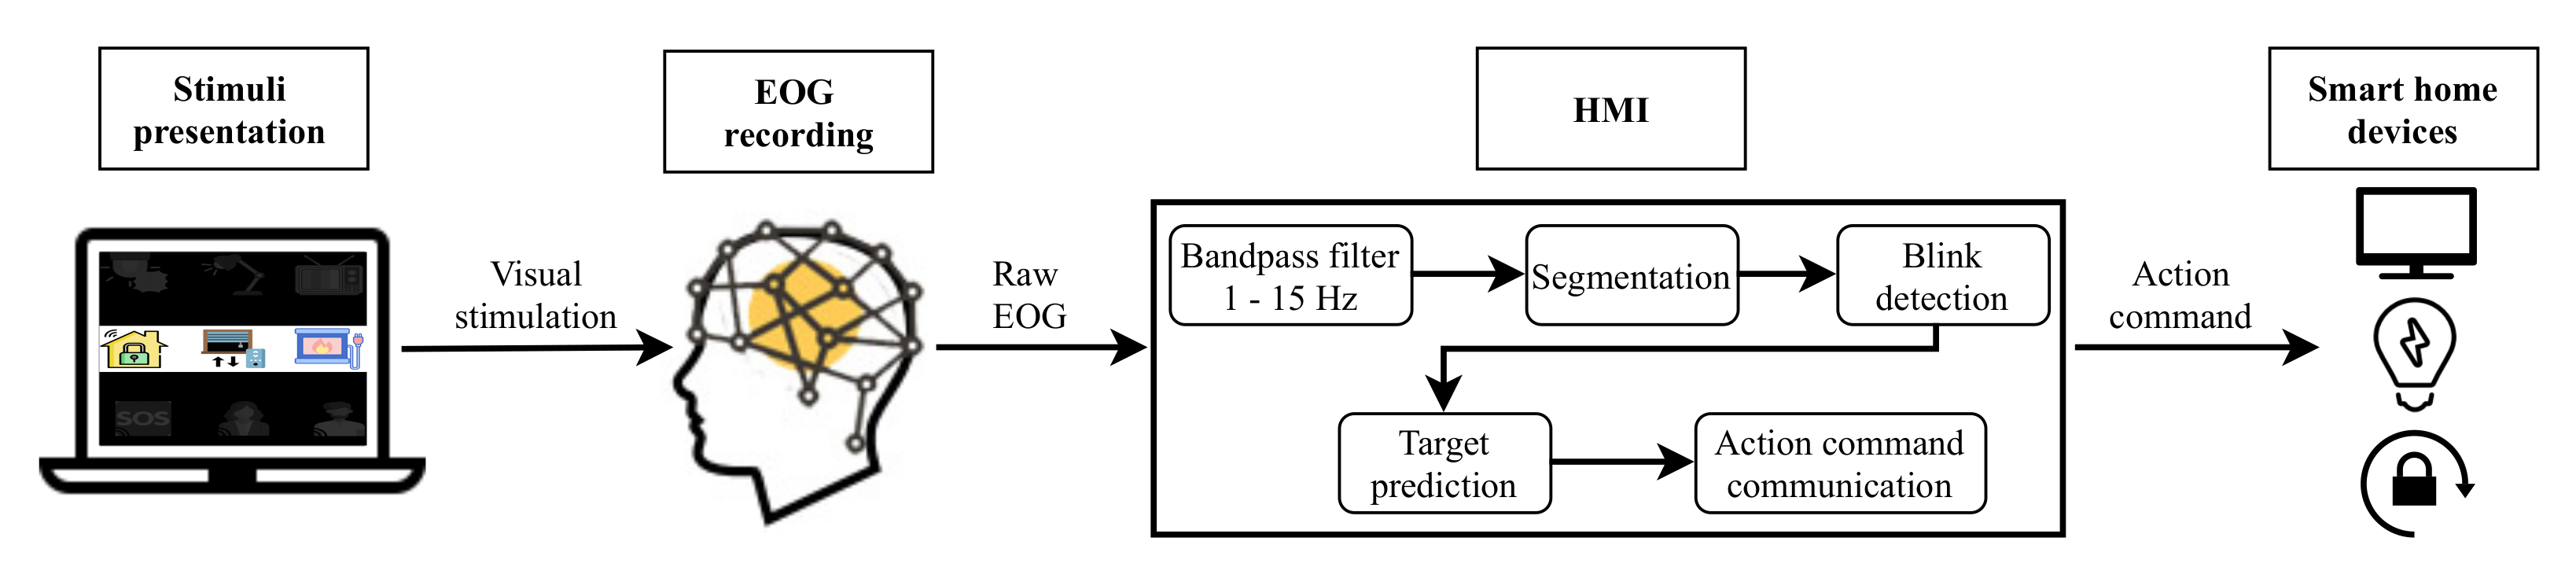
Figure 2 shows the EOG system based on eye blinks. Both systems are made up of four main parts: a GUI for stimuli presentation, a hardware device for EEG/EOG signal recording, the HMI for analyzing the captured signal and converting it into an action command and, finally, household devices for the execution of actions. The following sections describe each of these components.
3.1. Graphical User Interface
As depicted in
Figure 1 and
Figure 2, for both developed systems, the objects that the user can interact with are presented on a laptop screen using a GUI. This stimulation program was designed and developed in Python employing the PsychoPy package [
45].
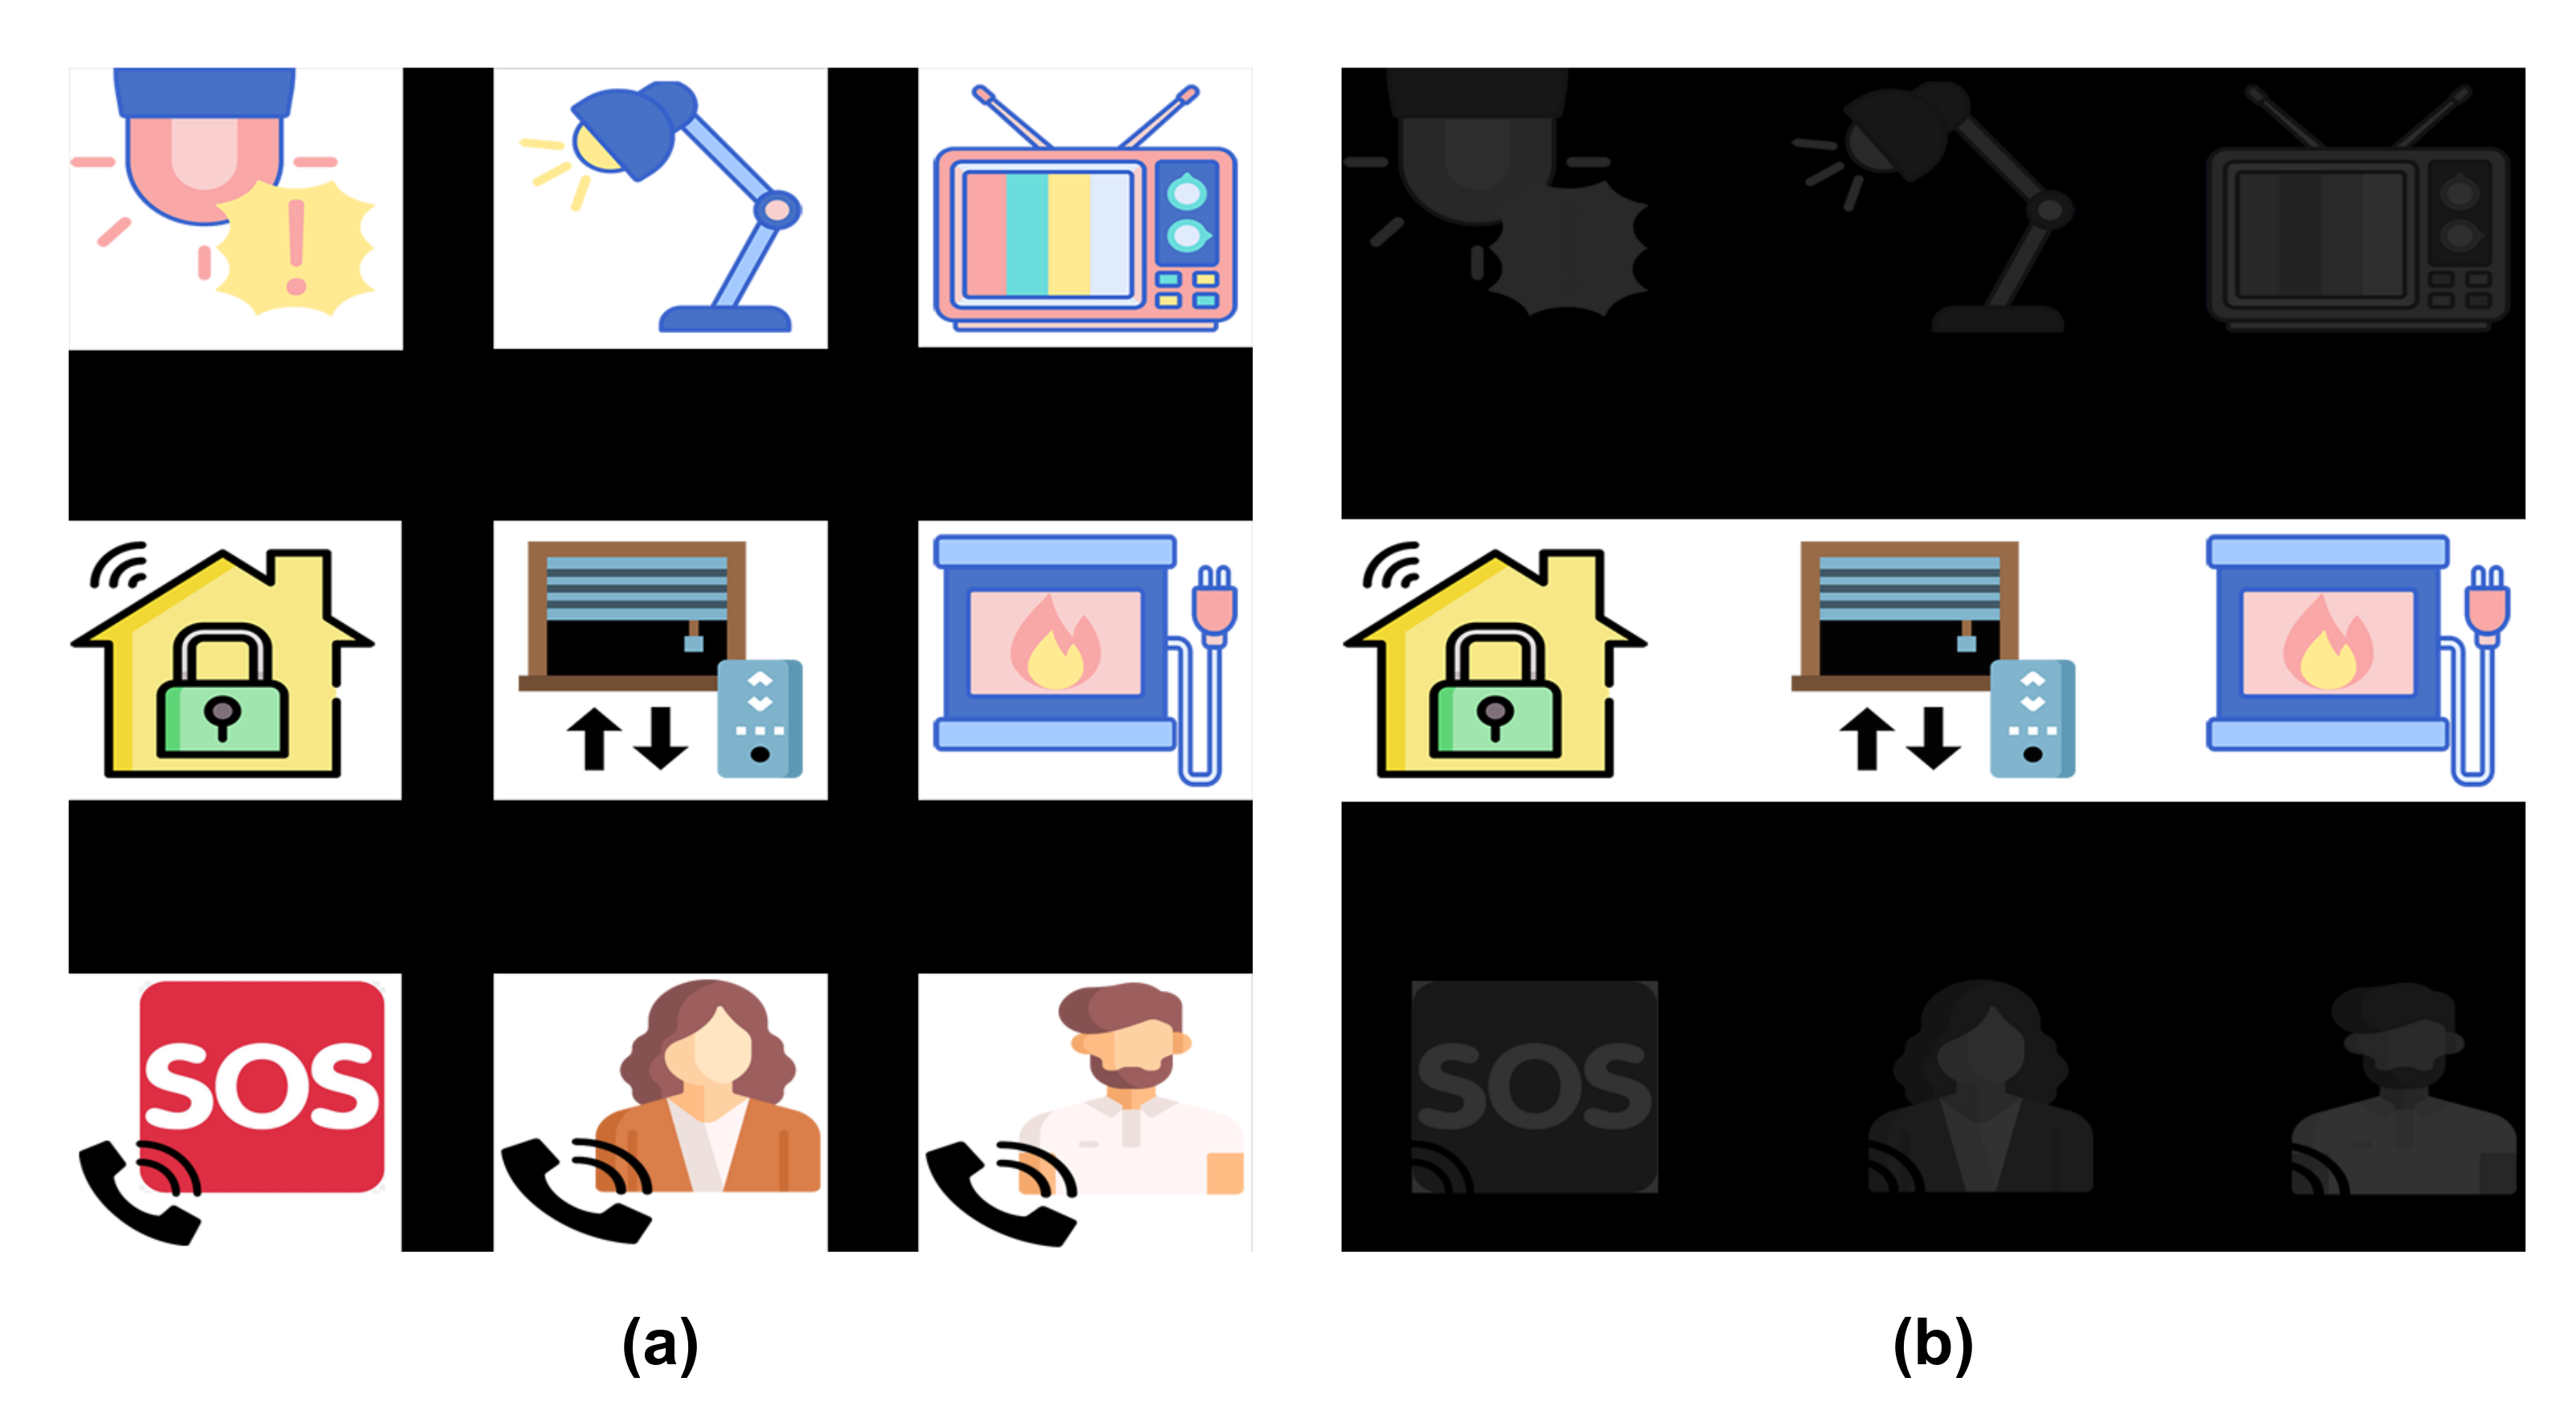
Figure 3 shows an example of the GUI, composed by a
matrix containing nine images describing the objects and control functions to be executed by users. The first two rows correspond to home devices, such as TVs, digital house locks or electric lights, which have a state that can be switched (e.g., on/off or up/down) by selecting it with the HMI. The last row has three possible phone calls: the emergency call (i.e., an SOS number) and two favourite contacts in their phone-book.
Two stimulation paradigms were assessed for the experiments. For the first paradigm, each element of the matrix is intensified one by one. This intensification is randomly performed, but all the elements are intensified the same number of times. Therefore, they will have the same probability of being intensified, that is, . Moreover, an element cannot be intensified two consecutive times.
For the second paradigm, instead of element by element, each row and column of the matrix is intensified. This is also done randomly, and they are intensified the same number of times. Therefore, the probability of one element being intensified at any given time is .
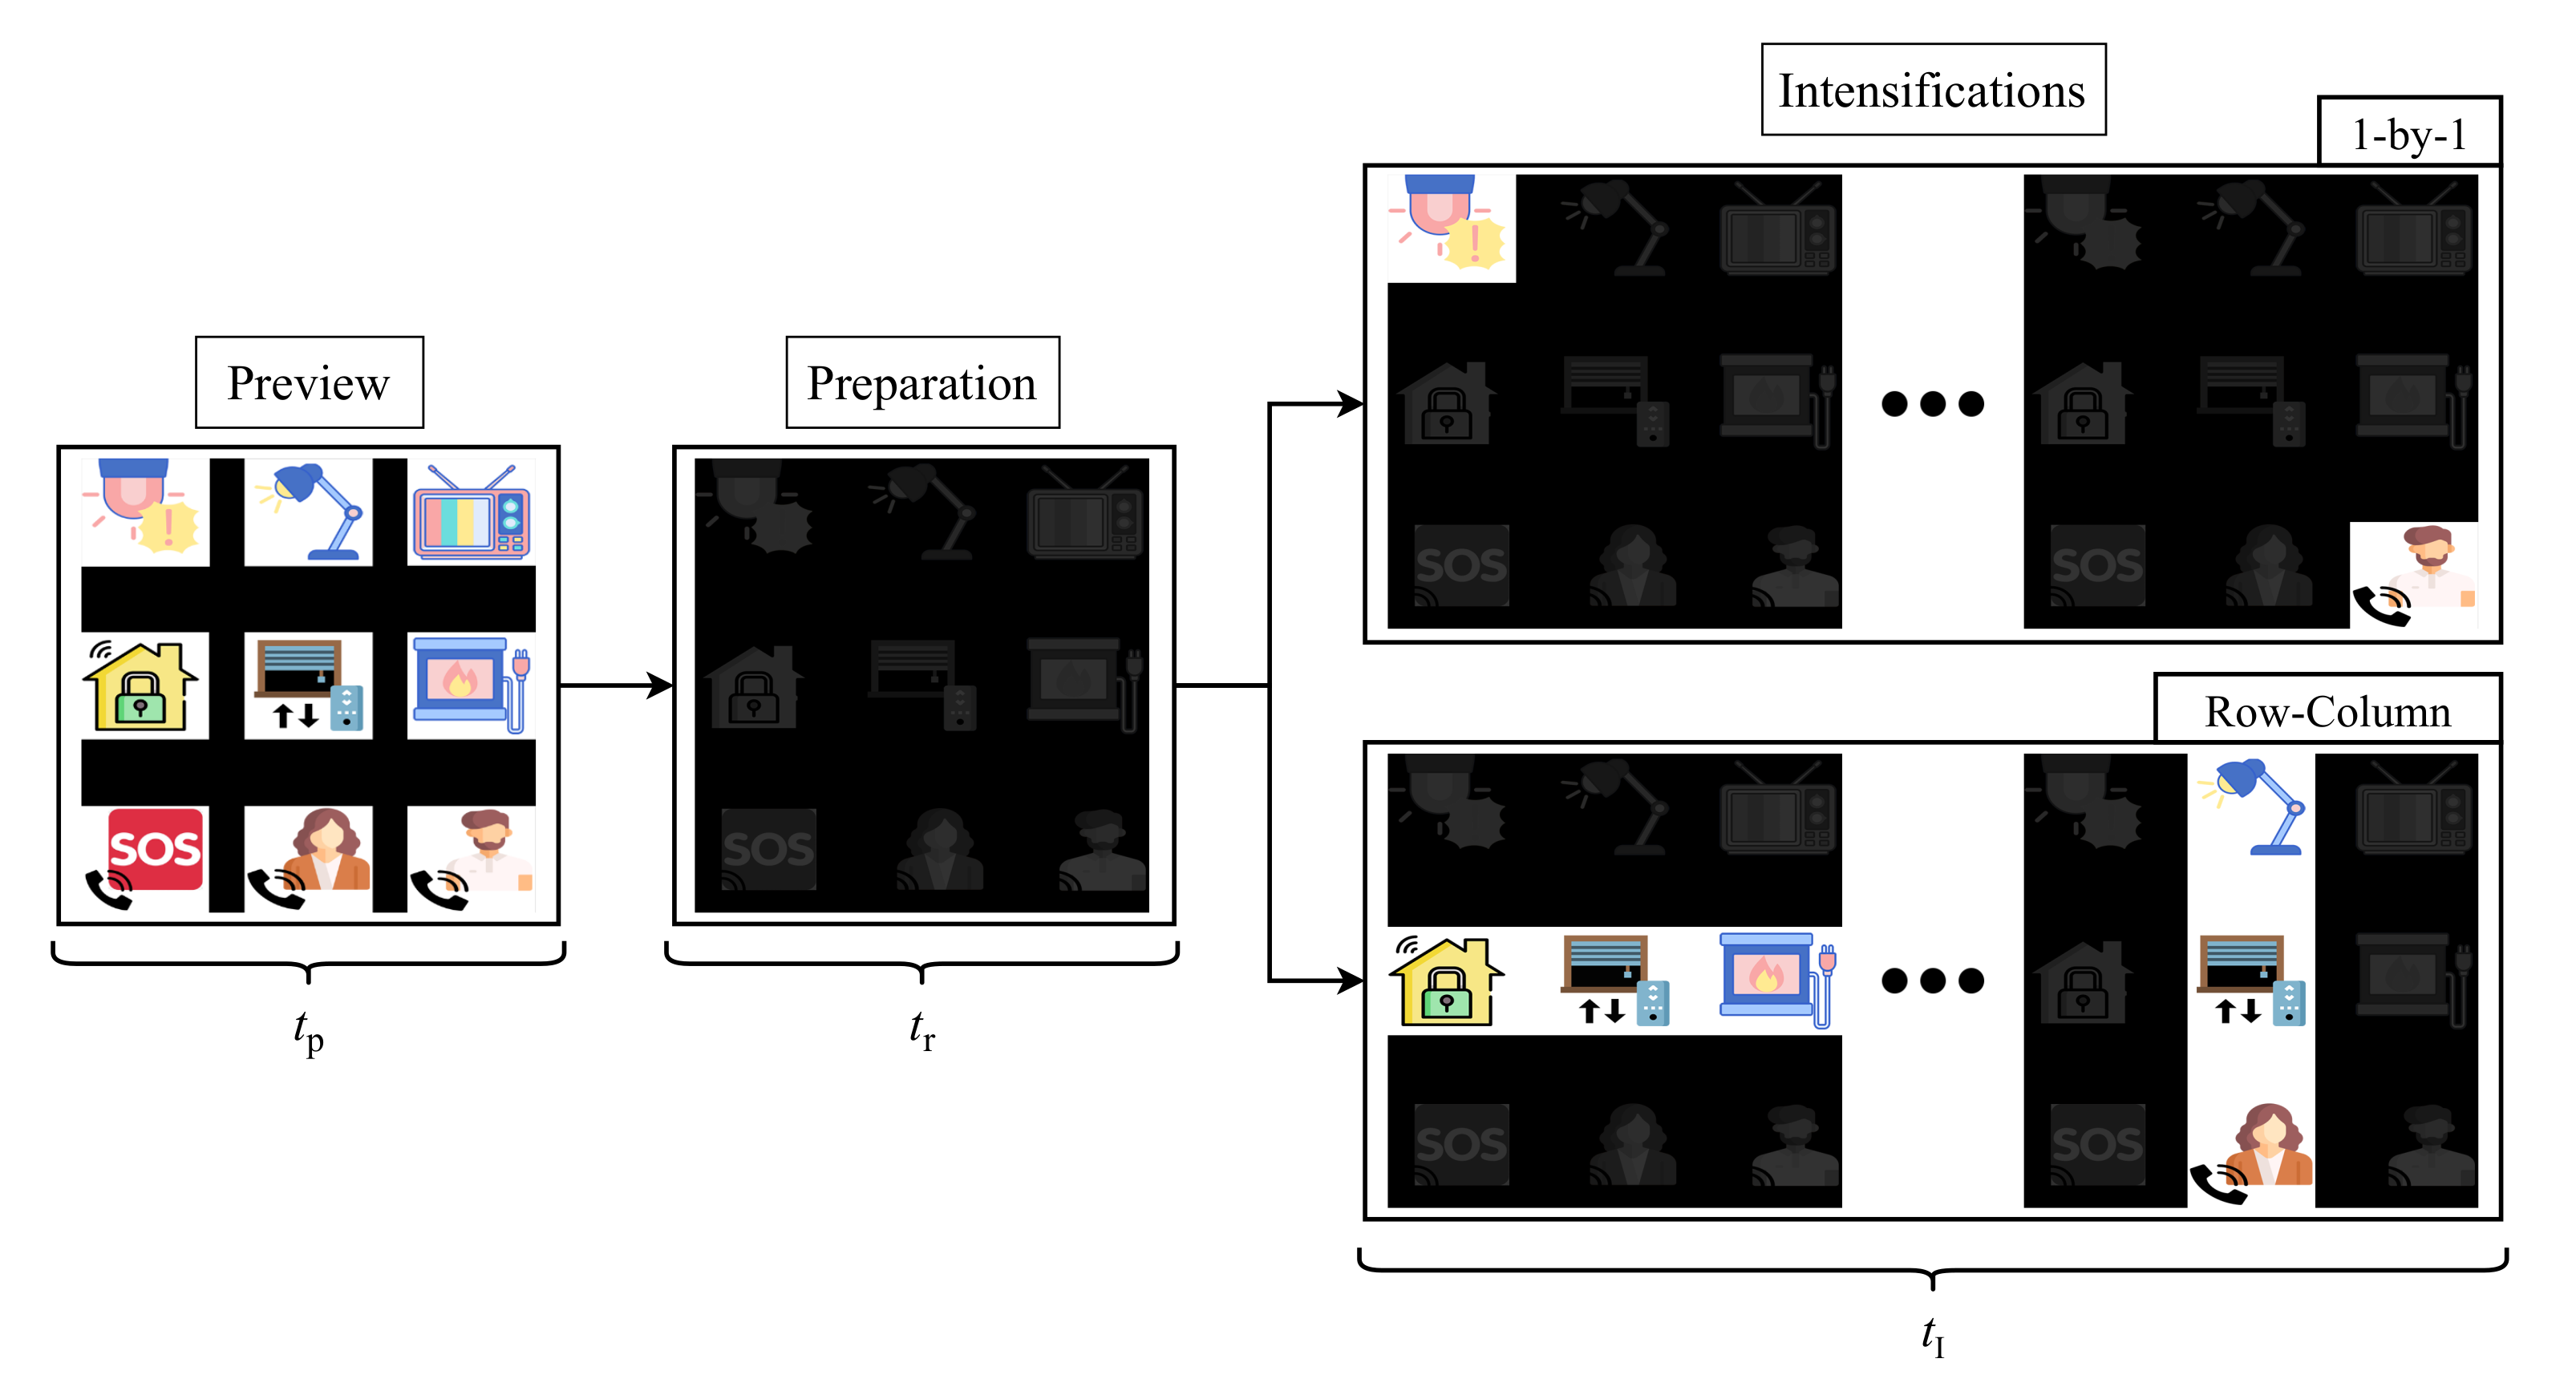
Figure 3 shows both stimulation paradigms: on the left side, the 1-by-1 paradigm with all the elements intensified and, on the right side, the row/column paradigm with the second row intensified.
The developed application for stimuli presentation is configurable and it can be adapted to the user’s requirements. However, in order to obtain comparable results, we have selected the same parameters for all the participants of the study.
Figure 4 shows the stimulation procedure for one run of the experiment. Each run starts with a preview period of
for all the elements of the matrix, so the user can locate its target before the intensifications begin. Following this first step, a dark matrix is shown to the user during
. At this stage, the target must be located and the user must focus his/her gaze on it for the rest of the run. Once this preparation ends, the intesification step starts. The duration of this stage is conditioned by the selected stimulation paradigm (1-by-1 or row/column) and by the recording mode (EEG or EOG), since the number of intensifications and times will vary for each of them. Remember that these intensifications are randomly performed that is, the user does not know the order in which the object or column/row will be intensified. These parameters are explained in detail in the following sections.
3.2. Hardware
EEG and EOG data have been recorded using the OpenBCI Cyton Board with a sampling frequency of
. The Cyton board allows simultaneous recording from eight channels, but only one of them is employed in this study. Two types of electrodes can be employed for capturing the EEG and EOG activity of the user—wet and dry electrodes. Traditionally, wet electrodes have been employed for biopotential recordings [
46]. This procedure implies skin preparation and the use of wet gels or saline liquid to create a conductive path that improves signal quality and reduces skin impedance. However, this gel will eventually dry out, resulting in a poor quality signal and the need for electrode replacement. Moreover, for high-density electrode montages, the procedure can become cumbersome and uncomfortable for the user. To overcome these issues, dry electrodes that do not require any gel application [
47,
48] or semi-dry electrodes that only employ a tiny amount of conductive gel [
49,
50,
51] have been proposed and implemented in HMIs in recent years. However, although these new dry electrodes offer a faster setup time and greater user comfort, they usually present a higher skin impedance than the wet ones [
52,
53,
54]. Since this study aims to analyze the control signals on each user and determine which one offers the best performance, we decided to employ wet electrodes to obtain high-quality and low-impedance signals.
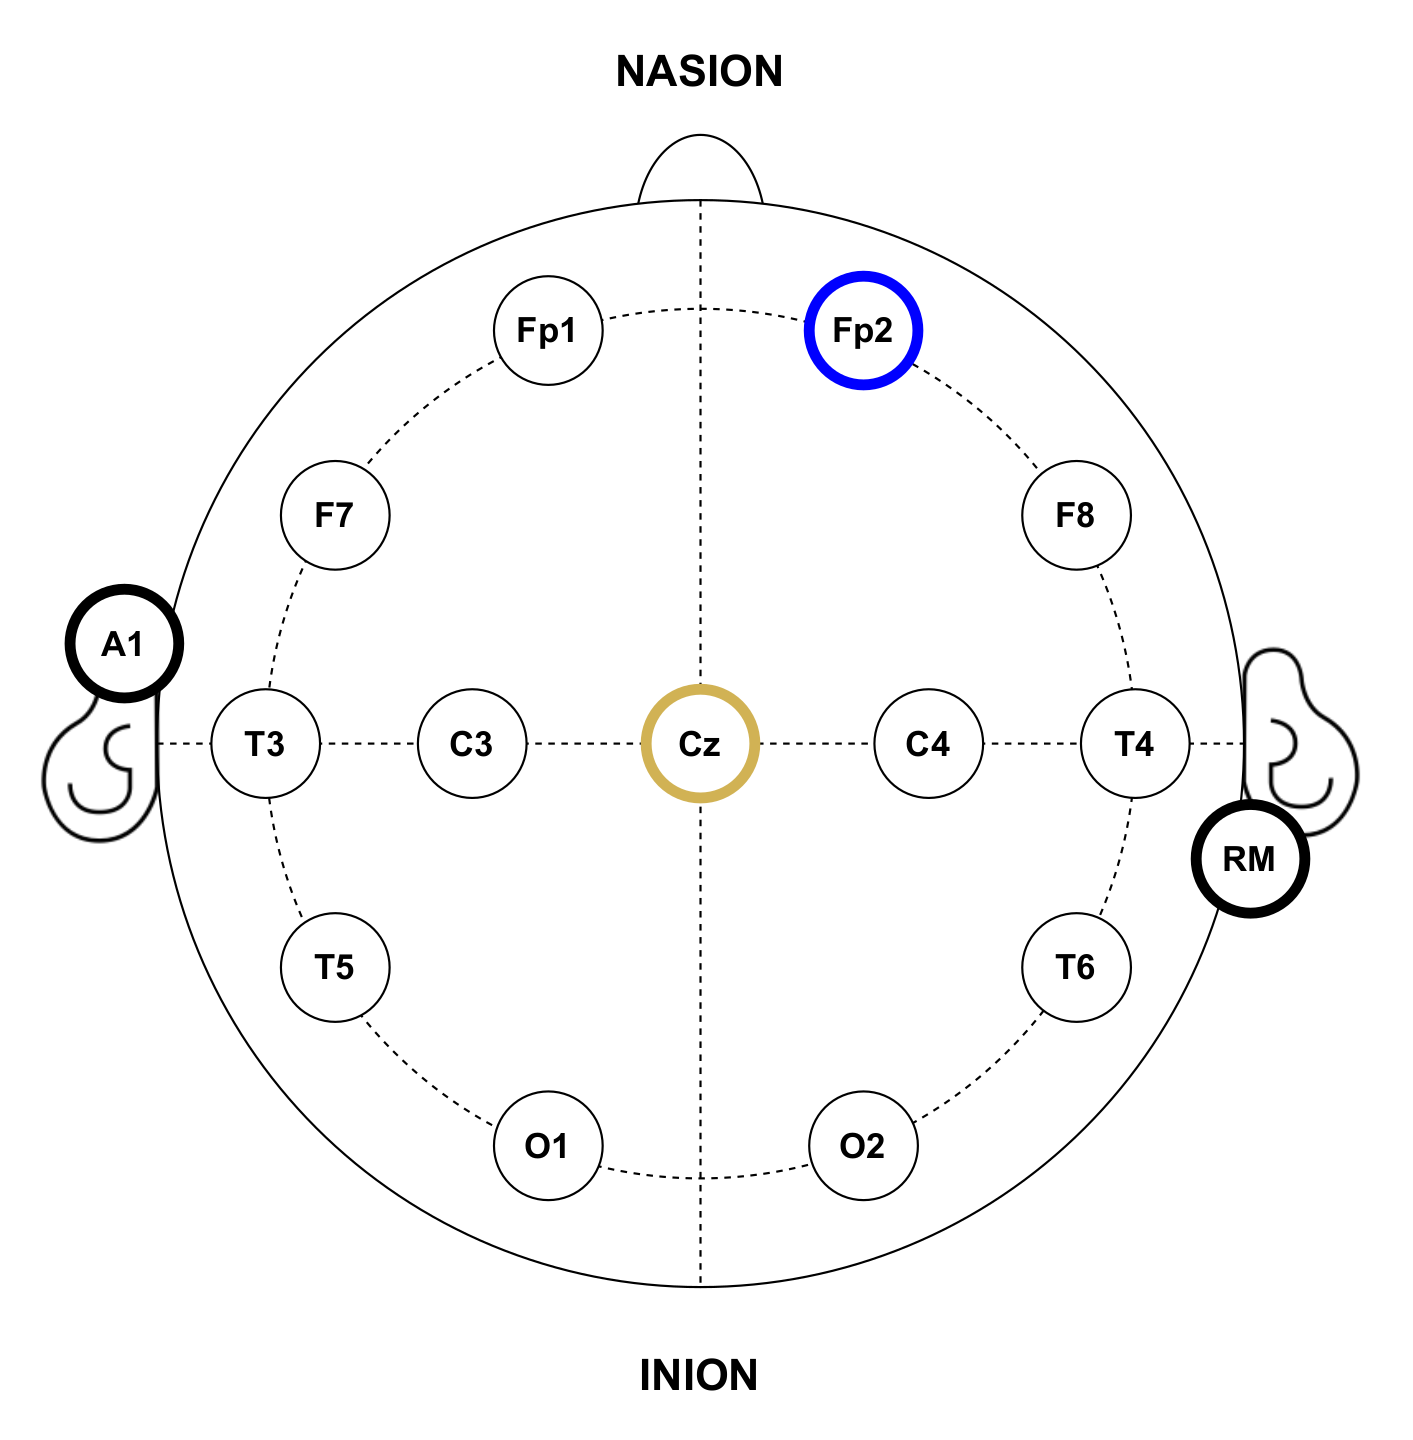
In the experiments, gold cup electrodes were placed in accordance with the 10–20 international system for electrode placement [
55] and attached to the subjects’ scalp using a conductive paste. The electrode-skin impedance was checked to be below
at all the electrodes. Following this placement system, each electrode location is identified by numbers, the even ones representing the right hemisphere and the odd ones the left hemisphere; and letters, corresponding to the lobe and area of the brain where they are placed: pre-frontal (FP), frontal (F), temporal (T), central (C), parietal (P) and occipital (O). For EEG recordings, since the objective is to detect the P300 potential, the electrode for the input channel was located in the Cz position. Conversely, for EOG recordings, the electrode was placed at Fp2 in order to detect activity related to eye blinks. Both recording modes shared reference and ground electrodes, placed at the right mastoid (RM) and the left earlobe (A1), respectively. It is important to note that this electrode location will depend on the purpose of the HMI and the control signals it wants to capture, for example, a BCI that wants to detect the eye state of the user (closed or open eyes) would probably place the input electrodes on the occipital area of the brain where the visual cortex is located [
25].
Figure 5 shows the electrode placement for the experiments.
3.3. EEG Recording and Signal Processing
Classical electrode location for P300-based EEG applications generally contains three typical positions: Fz, Cz and Pz [
56,
57], since the P300 potential is maximally recorded from the midline centroparietal regions [
58]. Therefore, the only channel used by the proposed EEG system shown in
Figure 1 is placed at Cz position. The input signal is filtered using a 16th-order Butterworth infinite response filter between 1 and
.
Evoked potentials appear as event-related responses from the brain to sensory stimulation, such as the one used in this study (visual stimulation). The main challenge to overcome when working with these brain responses is that individual EPs present very low amplitude values, ranging from
to
, whereas the EEG background activity ranges from 10 to
, which causes EPs to be hidden among the background information. Fortunately, EPs are time-locked to stimuli that is, they usually occur with the same latency from the stimulus onset. Conversely, background EEG not related to the stimulus will fluctuate randomly. A widely applied technique that takes advantage of this effect is ensemble averaging, which is based on averaging all the brain responses related to stimuli presentation. In this procedure, the activity time-locked to stimuli onset will remain robust, while the random background EEG will not, so the Event-Related Potentials (ERPs) will appear clearly and the noise will be cancelled [
59,
60].
Consequently, we chose this processing technique for the acquisition of the ERPs and detection of P300 EPs. In order to apply it, the EEG signal is first segmented into epochs that are time-locked to stimuli. Following the criteria introduced by Farewell and Donchin in the original P300-speller [
6], which states that the useful data consisted of the recorded EEG for
after the onset of each intensification, epochs of this duration are extracted after each stimulus presentation. Once all the epochs have been extracted, an ensemble average, that is, the average of all the epochs for each stimulus, is calculated. The recorded EEG signal,
, can thus be segmented according to the
k stimulus to obtain an ensemble of
M epochs, which in the discrete domain would be represented by
N samples.
The ensemble of epochs for the stimulus
k can be represented in a matrix form,
, where each row vector represents the different epochs and each column vector the samples of the recorded EEG.
The size of the resulting matrix will be , where each element represents the sample of the epoch for the stimulus.
The ensemble average for each stimulus,
, can then be easily calculated by averaging all its epochs as follows
Once the ensemble average for each stimulus has been obtained, the P300 potential should clearly appear in the resulting averaged signal for the target stimulus. Therefore, if the HMI is able to automatically detect this P300, it will predict the user’s will without any physical intervention. Several methods have been proposed for detecting the P300 potential [
61]. In this study, we define a P300 window that contains and surrounds the potential, so the peak and area of the averaged signal in this window can be used for prediction [
29]. The elements with the highest area inside the P300 window will be considered as possible targets.
In order to detect the target elements, one prediction criteria was applied for each stimulation paradigm. On the one hand, for the 1-by-1 paradigm, the element with the highest area inside the P300 window was selected as target. However, for the row/column paradigm, the row and column with highest area were selected and the target element was identified as the element in their intersection.
3.4. EOG Recording and Signal Processing
For the EOG system shown in
Figure 2, data are captured employing only one input channel placed on the forehead at the Fp2 position. This electrode location is selected due to the blinking activity being concentrated at the frontal regions [
9]. Then, data is filtered using a 4th-order Butterworth infinite response filter between 1 and
.
Users must blink when their target element is intensified. The purpose of this action is to communicate the objective element to the HMI so it can execute its associated action. This voluntary blink is time-locked to stimuli, since it must appear right after the intensification onset of the target element and before the onset of the next intensification. Taking this into account, the recorded EOG signal can be segmented into epochs of
according to each intensification. An epochs’ ensemble for the stimulus
k can be represented in a matrix form,
, as in (
2), where each row vector of the matrix represents the epoch for stimulus
k and each column vector represents the samples of the recorded EOG signal. Hence, the element
corresponds to the
sample of the
epoch for the
stimulus.
Since EOG activity and, especially, blinking movements present consistent patterns with large potentials, they are easier to detect than EEG brain responses [
9,
36] and, therefore, there is no need to present the stimuli as times as with EEG in order to reduce background noise.
Once the recorded signal has been segmented, the HMI must detect the blinks in the extracted epochs in order to predict the user’s will and execute the desired action. Fortunately, blink movements present clear and characteristic patterns in EOG signals with two consecutive large peaks, positive and negative, respectively, corresponding to the closing and opening of eyes. These large peaks can be easily recognized from background EEG activity, which presents smaller amplitude values [
8,
62]. Consequently, a threshold-based detection algorithm is proposed in this study. Two specific threshold values are defined:
, for the negative peak and,
, for the positive. Each epoch is analyzed and a resulting vector
is constructed, where its
sample follows this criteria,
which represents the threshold vector for the
epoch of the
stimulus.
According to (
4), the observed epochs can be divided into blinking and non-blinking intervals. Blinking intervals will be those between
and
that is, between the closing and opening of eyes, while non-blinking intervals will be those outside these values. The duration for blinking movements ranges from 100 to
[
8,
63], so blinking intervals longer than
are discarded. Thus, it will be considered that a blink is produced in a specific epoch when it contains a valid blinking interval that is, the closing and opening of eyes have been detected in the lapse of
. The BCI can predict the target element by counting the blinks produced on each of its epochs. Depending on the stimulation paradigms, two prediction criteria were applied: for the 1-by-1 paradigm, the element with the same number of blinks as experiment runs was considered the target; for the row/column paradigm, the row and column with the same number of blinks as experiment runs were selected and the target was determined to be the element on their intersection.
3.5. Experimental Procedure
The participant group in our experiments included a total of nine volunteers who agreed to collaborate in this research. The participants indicated that they did not have hearing or visual impairments. Informed consents were obtained from all the participants in order to employ their data in our study.
Table 1 summarizes the information of each subject that took part in the experiments.
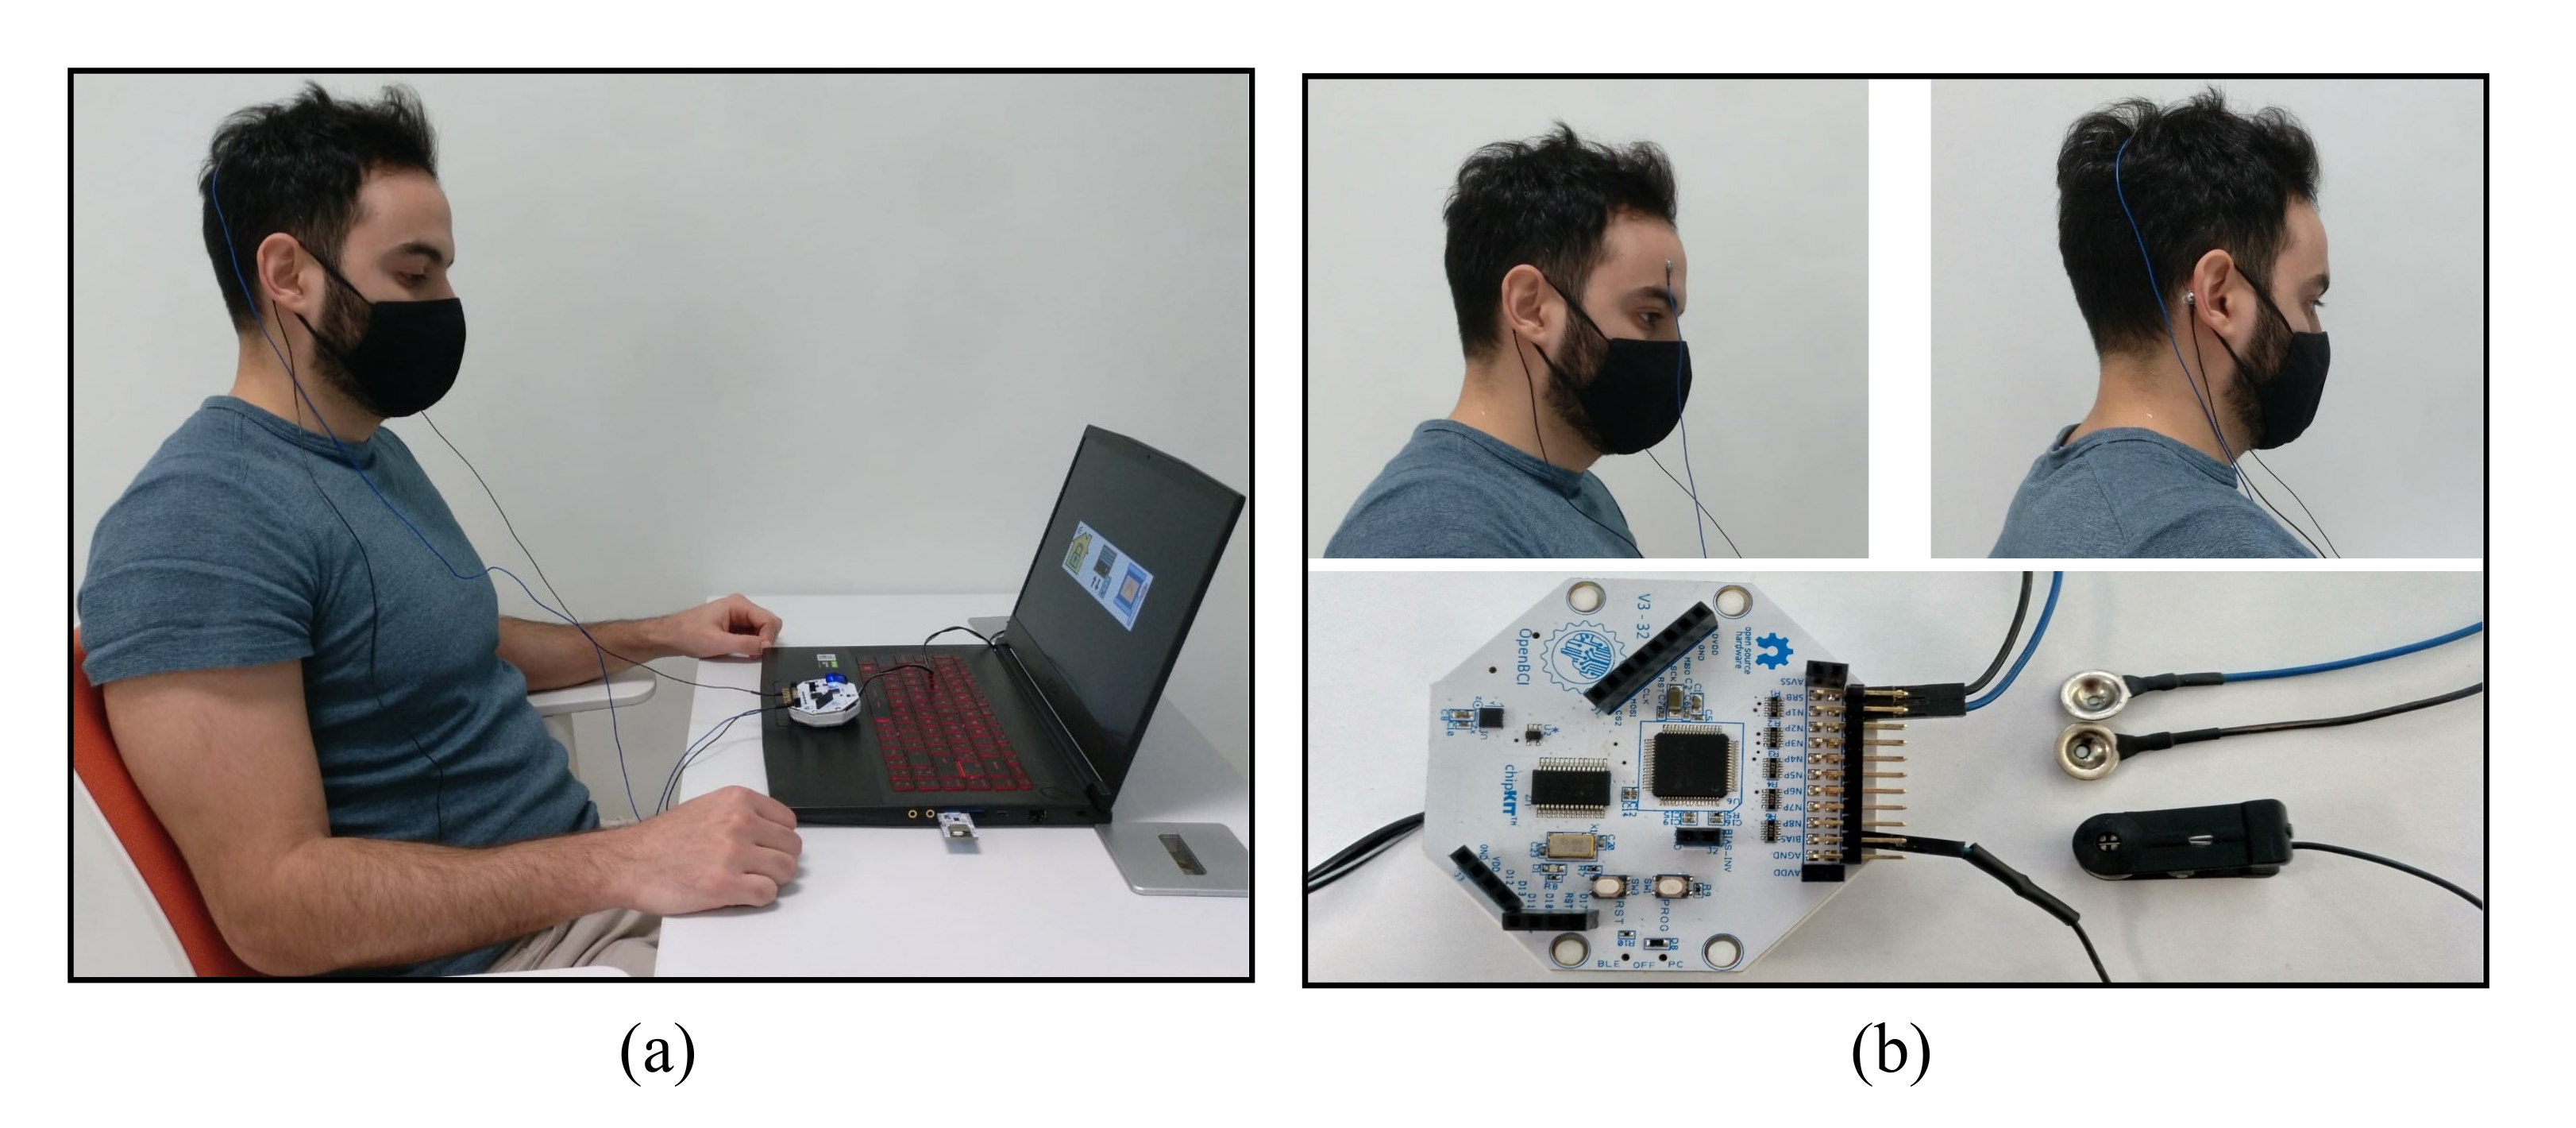
The experiments were carried out in a sound-attenuated room where the participants were invited to sit in a comfortable chair while focusing their attention on a
-inch laptop screen where stimuli were presented.
Figure 6 shows a participant during the P300 recording session, the electrode placement for both experiments and the recording device.
Recording sessions for each participant were divided into four independent experiments, one per each stimulation paradigm and recording mode that is: for the 1-by-1 paradigm with EEG signals, for the row/column paradigm with EEG signals, for the 1-by-1 paradigm with EOG signals and for the row/column paradigm with EOG data.
As shown in
Figure 4, each experiment was divided into runs consisting of three stages: preview, preparation and intensifications. The GUI described in
Section 3.1 was configured with
and
. The duration of the intensification stage,
, was conditioned by four different parameters, as follows,
Number of Stimuli (NS): nine for the 1-by-1 paradigm (one per each element of the matrix) and six for the row/column paradigm (one per each row and column of the matrix).
Number of Instensifications (NI) that is, the number of times that each stimulus is presented to users.
Intensification Time (IT) that is, the time that a stimulus remains intensified.
Inter-Stimuli Interval (ISI), the elapsed time since the stimulus intensification ends to the onset of the next one. During an ISI, any element is intensified: all of them stay dark.
Consequently,
.
Table 2 summarizes the different configurations selected for each experiment type. The same parameters were used for all the participants in the study.
After each run, a rest interval of at least was allowed. The entire experimental session lasted approximately . As the analysis of the collected data is performed offline, no visual feedback is provided to the users when each run ends.
4. Experimental Results
4.1. Signal Analysis
Captured EEG signals from all the participants in this study were analyzed and visually inspected in order to verify that their recordings were correctly performed and that the P300 EP was elicited when the target element was intensified. As previously described, the EEG signal was filtered, epoched and averaged for this purpose.
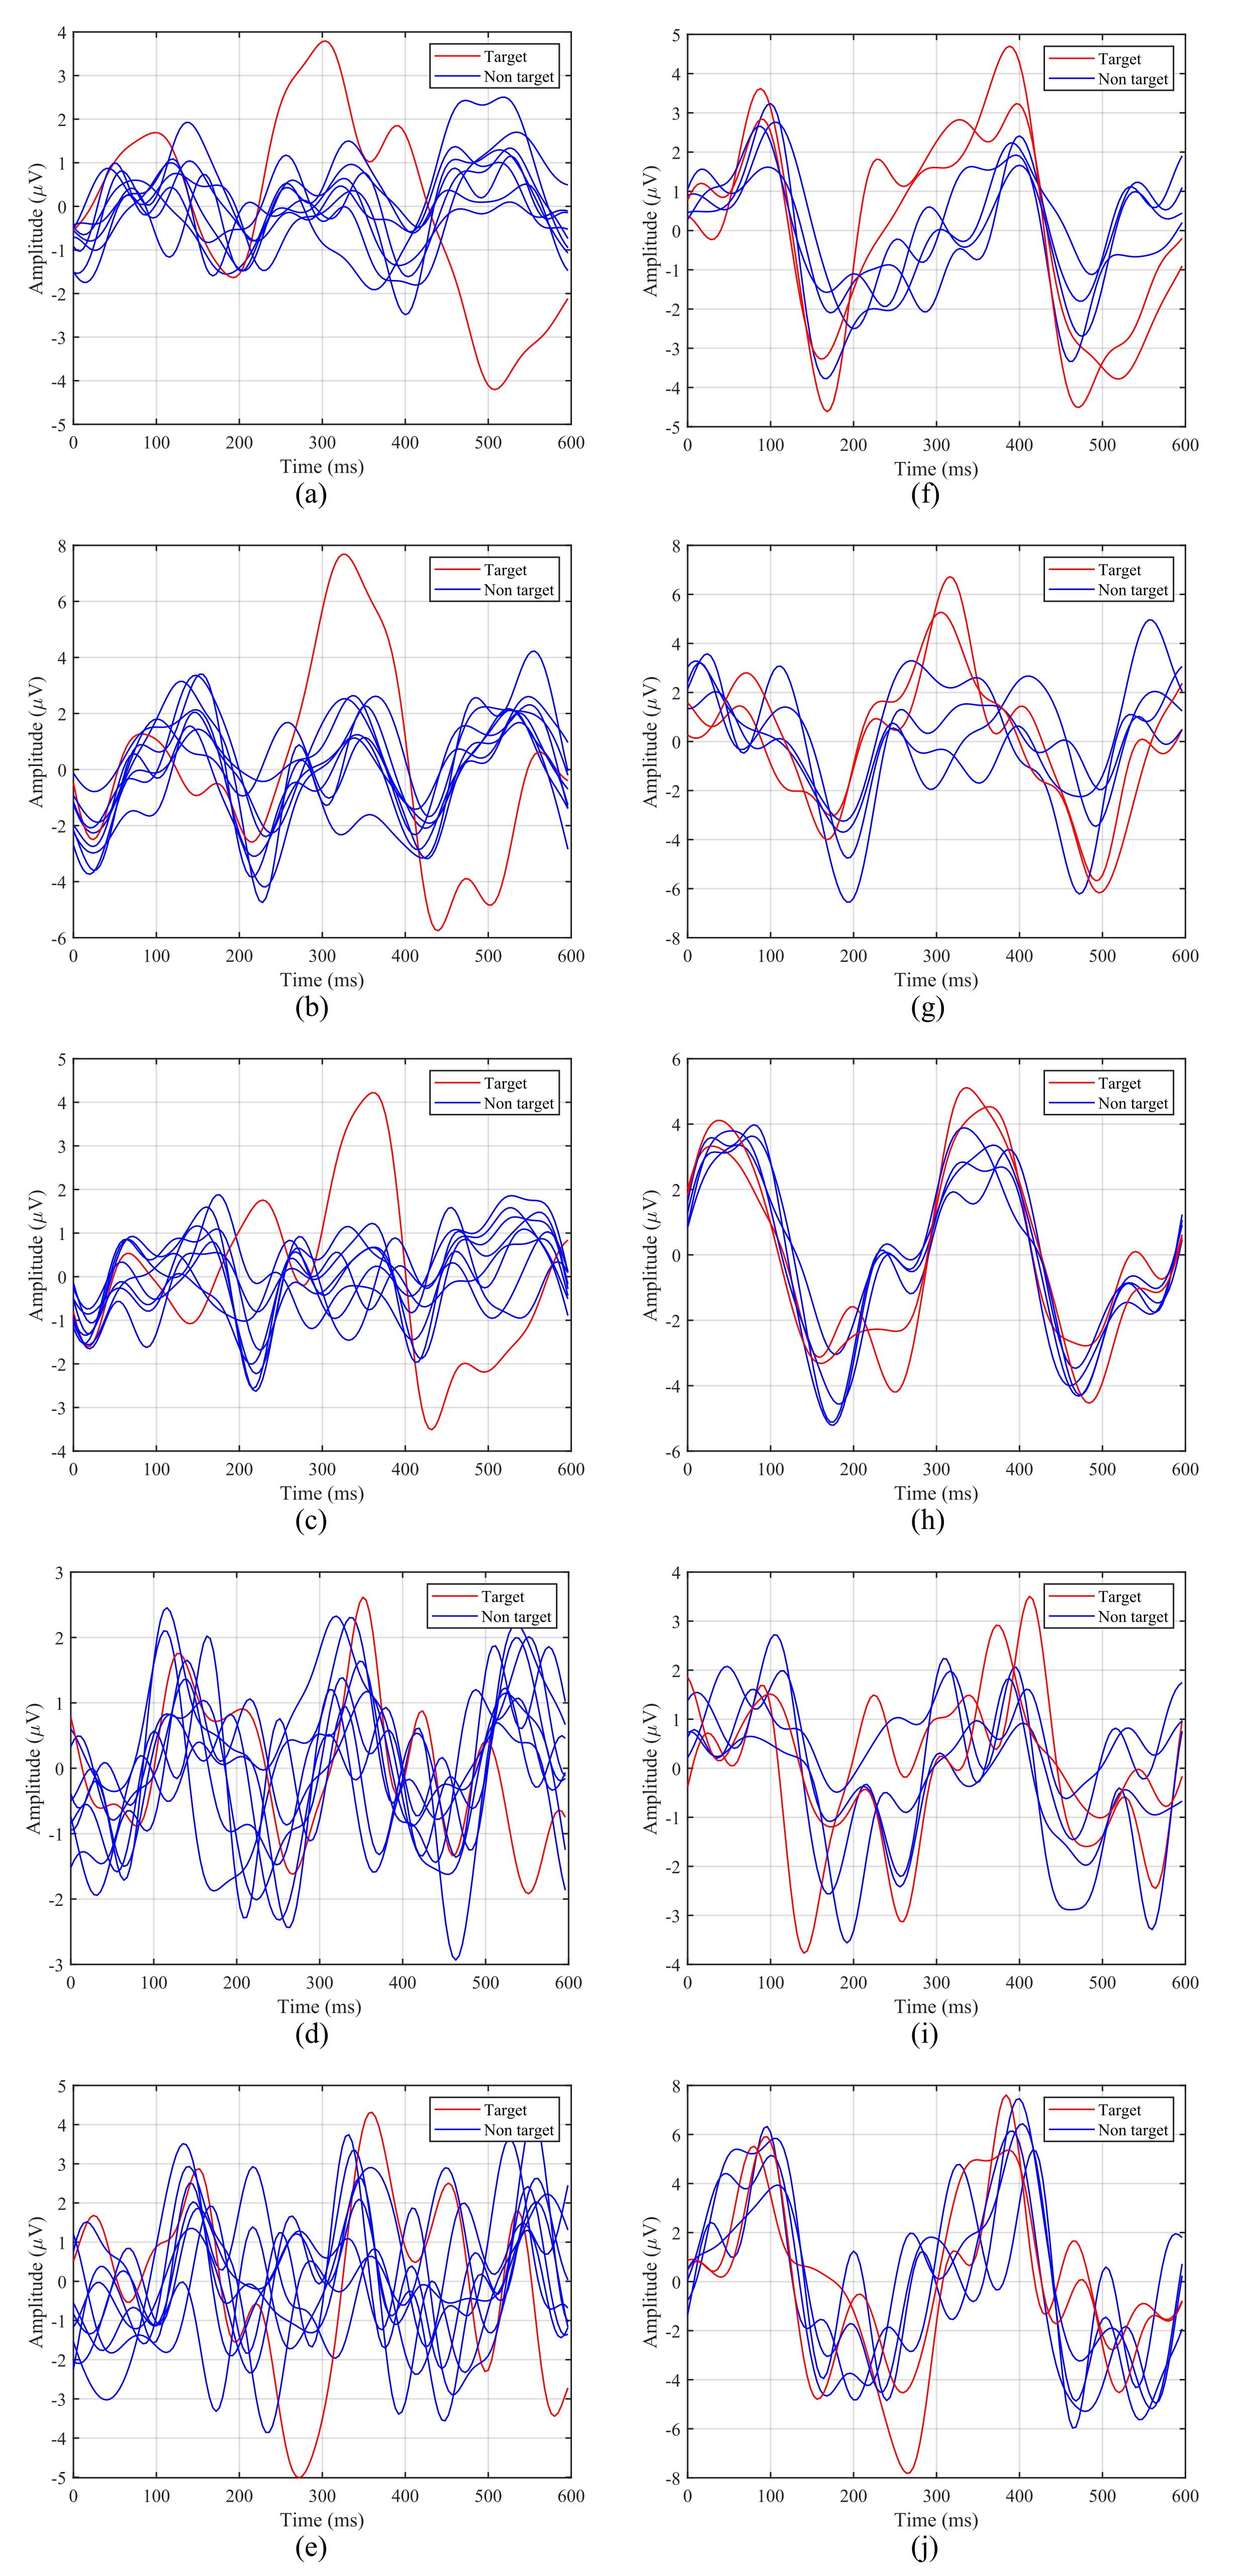
Figure 7 shows the averaged ERPs for the first 5 participants with both intensification paradigms considering only one run of our experiment. The left column contains ERPs for the 1-by-1 paradigm, while the right one corresponds to the row/column paradigm.
The P300 potential appears clearly around
for Subjects 1, 2 and 3 when the target element is intensified, whereas for Subjects 4 and 5, although the potential appears, it is more difficult to distinguish. In addition, it can be observed that the latency, that is, the elapsed time from the stimulus onset to the highest value of the P300 potential curve, varies from one participant to another. For example, for the 1-by-1 paradigm, the first subject (
Figure 7a,f) reaches its highest value at
, whereas for the third subject (
Figure 7c,h) this happens at
. For the first subject the delay also varies for each paradigm, since for the row/column one the peak appears closer to
(
Figure 7f).
Taking this analysis into account, the P300 window, defined by the BCI for the P300 detection and the subsequent target identification, will depend on the latency of the participants for each paradigm. Therefore, the BCI must define a P300 window adapted to each participant and condition, since a general common window would offer poor results.
EOG recordings were also analyzed and visually inspected in order to verify that the data were correctly captured and that the blinks were well represented in the signals.
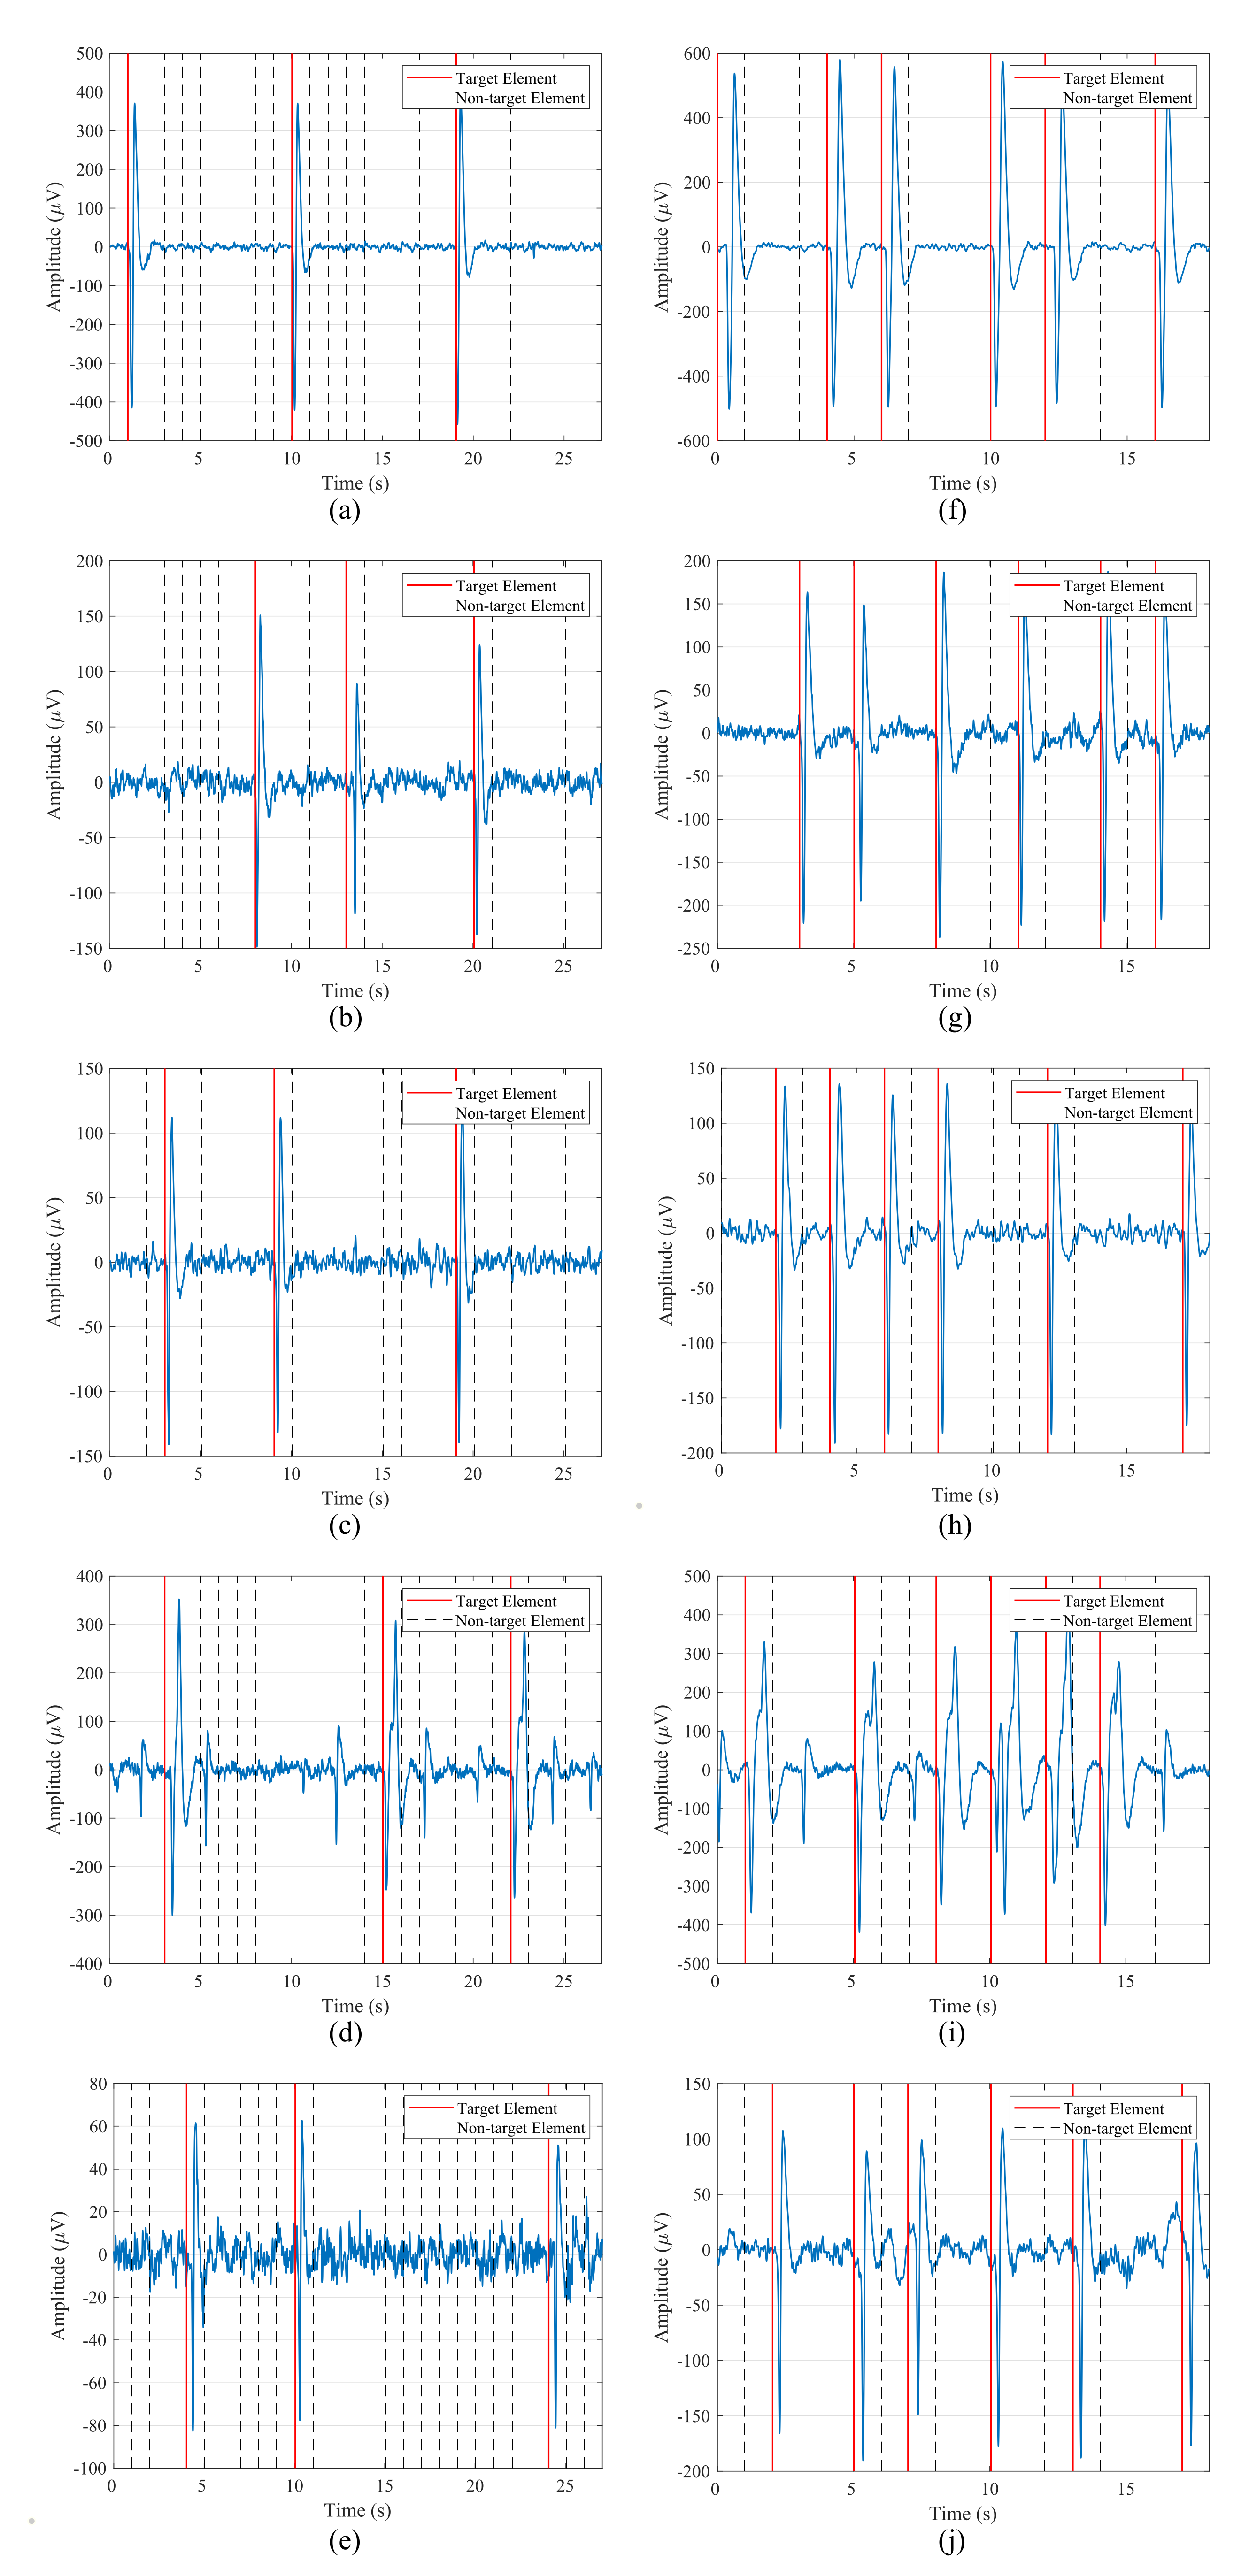
Figure 8 shows data from the first five participants for one run of the blinking experiment and both stimulation paradigms. The left column contains the signal for the 1-by-1 paradigm, while the right one corresponds to the row/column one. The blinks, which are represented by two consecutive large peaks, negative and positive, are clearly distinguishable from the background EEG data captured by the electrode. These voluntary blinks appear right after the intensification onset of the target element, so the user is communicating to the HMI the element that he/she wants to select. It is important to note that the amplitude of these blinks varies for each participant. For example, for the first subject, blink peaks are above
, while for the second subject they appear from 80 to
.
Taking this amplitude variation into account, the threshold value employed by the blink detection algorithm must be subject-dependent. That is, the BCI must define a threshold value for each participant in order to detect the produced blinks in the epochs.
4.2. Classification
High classification accuracy when detecting the element selected by the users is of primary importance for the correct performance of the HMI. Low accuracy would imply the execution of the wrong action in the user’s environment, which could be frustrating, annoying and, in some cases, it could even mean a risk for him/her, for example, if the user needs to call emergency services but the interface does not detect it correctly. Consequently, the accuracy of the classification algorithms presented in this study is assessed and analyzed in order to determine if their results are suitable for the implementation of a reliable HMI with practical applications in a smart-home environment.
Table 3 shows the classification accuracy for each subject, stimulation paradigm and both control signals. This accuracy is calculated according to the number of runs that were correctly classified by the HMI. An accuracy of
is achieved when the interface is able to correctly predict each target element in the eight runs of the experiment.
For the P300 experiments, the 1-by-1 stimulation paradigm presents significantly higher results than the row/column one, with all the participants above and five of them reaching of accuracy. Conversely, the row/column paradigm offers very poor results, with five out of the nine subjects below . In the blinking case, both paradigms achieve similar results, offering high classification rates with comparable average accuracy.
4.3. Response Time
The response time of the HMI is also an important feature to be evaluated. Long response times will produce fatigue, frustration and anxiety in the users, which can lead to a bad performance of the interface and a loss of interest in the system. We must find the shortest response time for the HMI that does not compromise the classification accuracy. Thus, the time response of each stimulation paradigm and control signal was assessed.
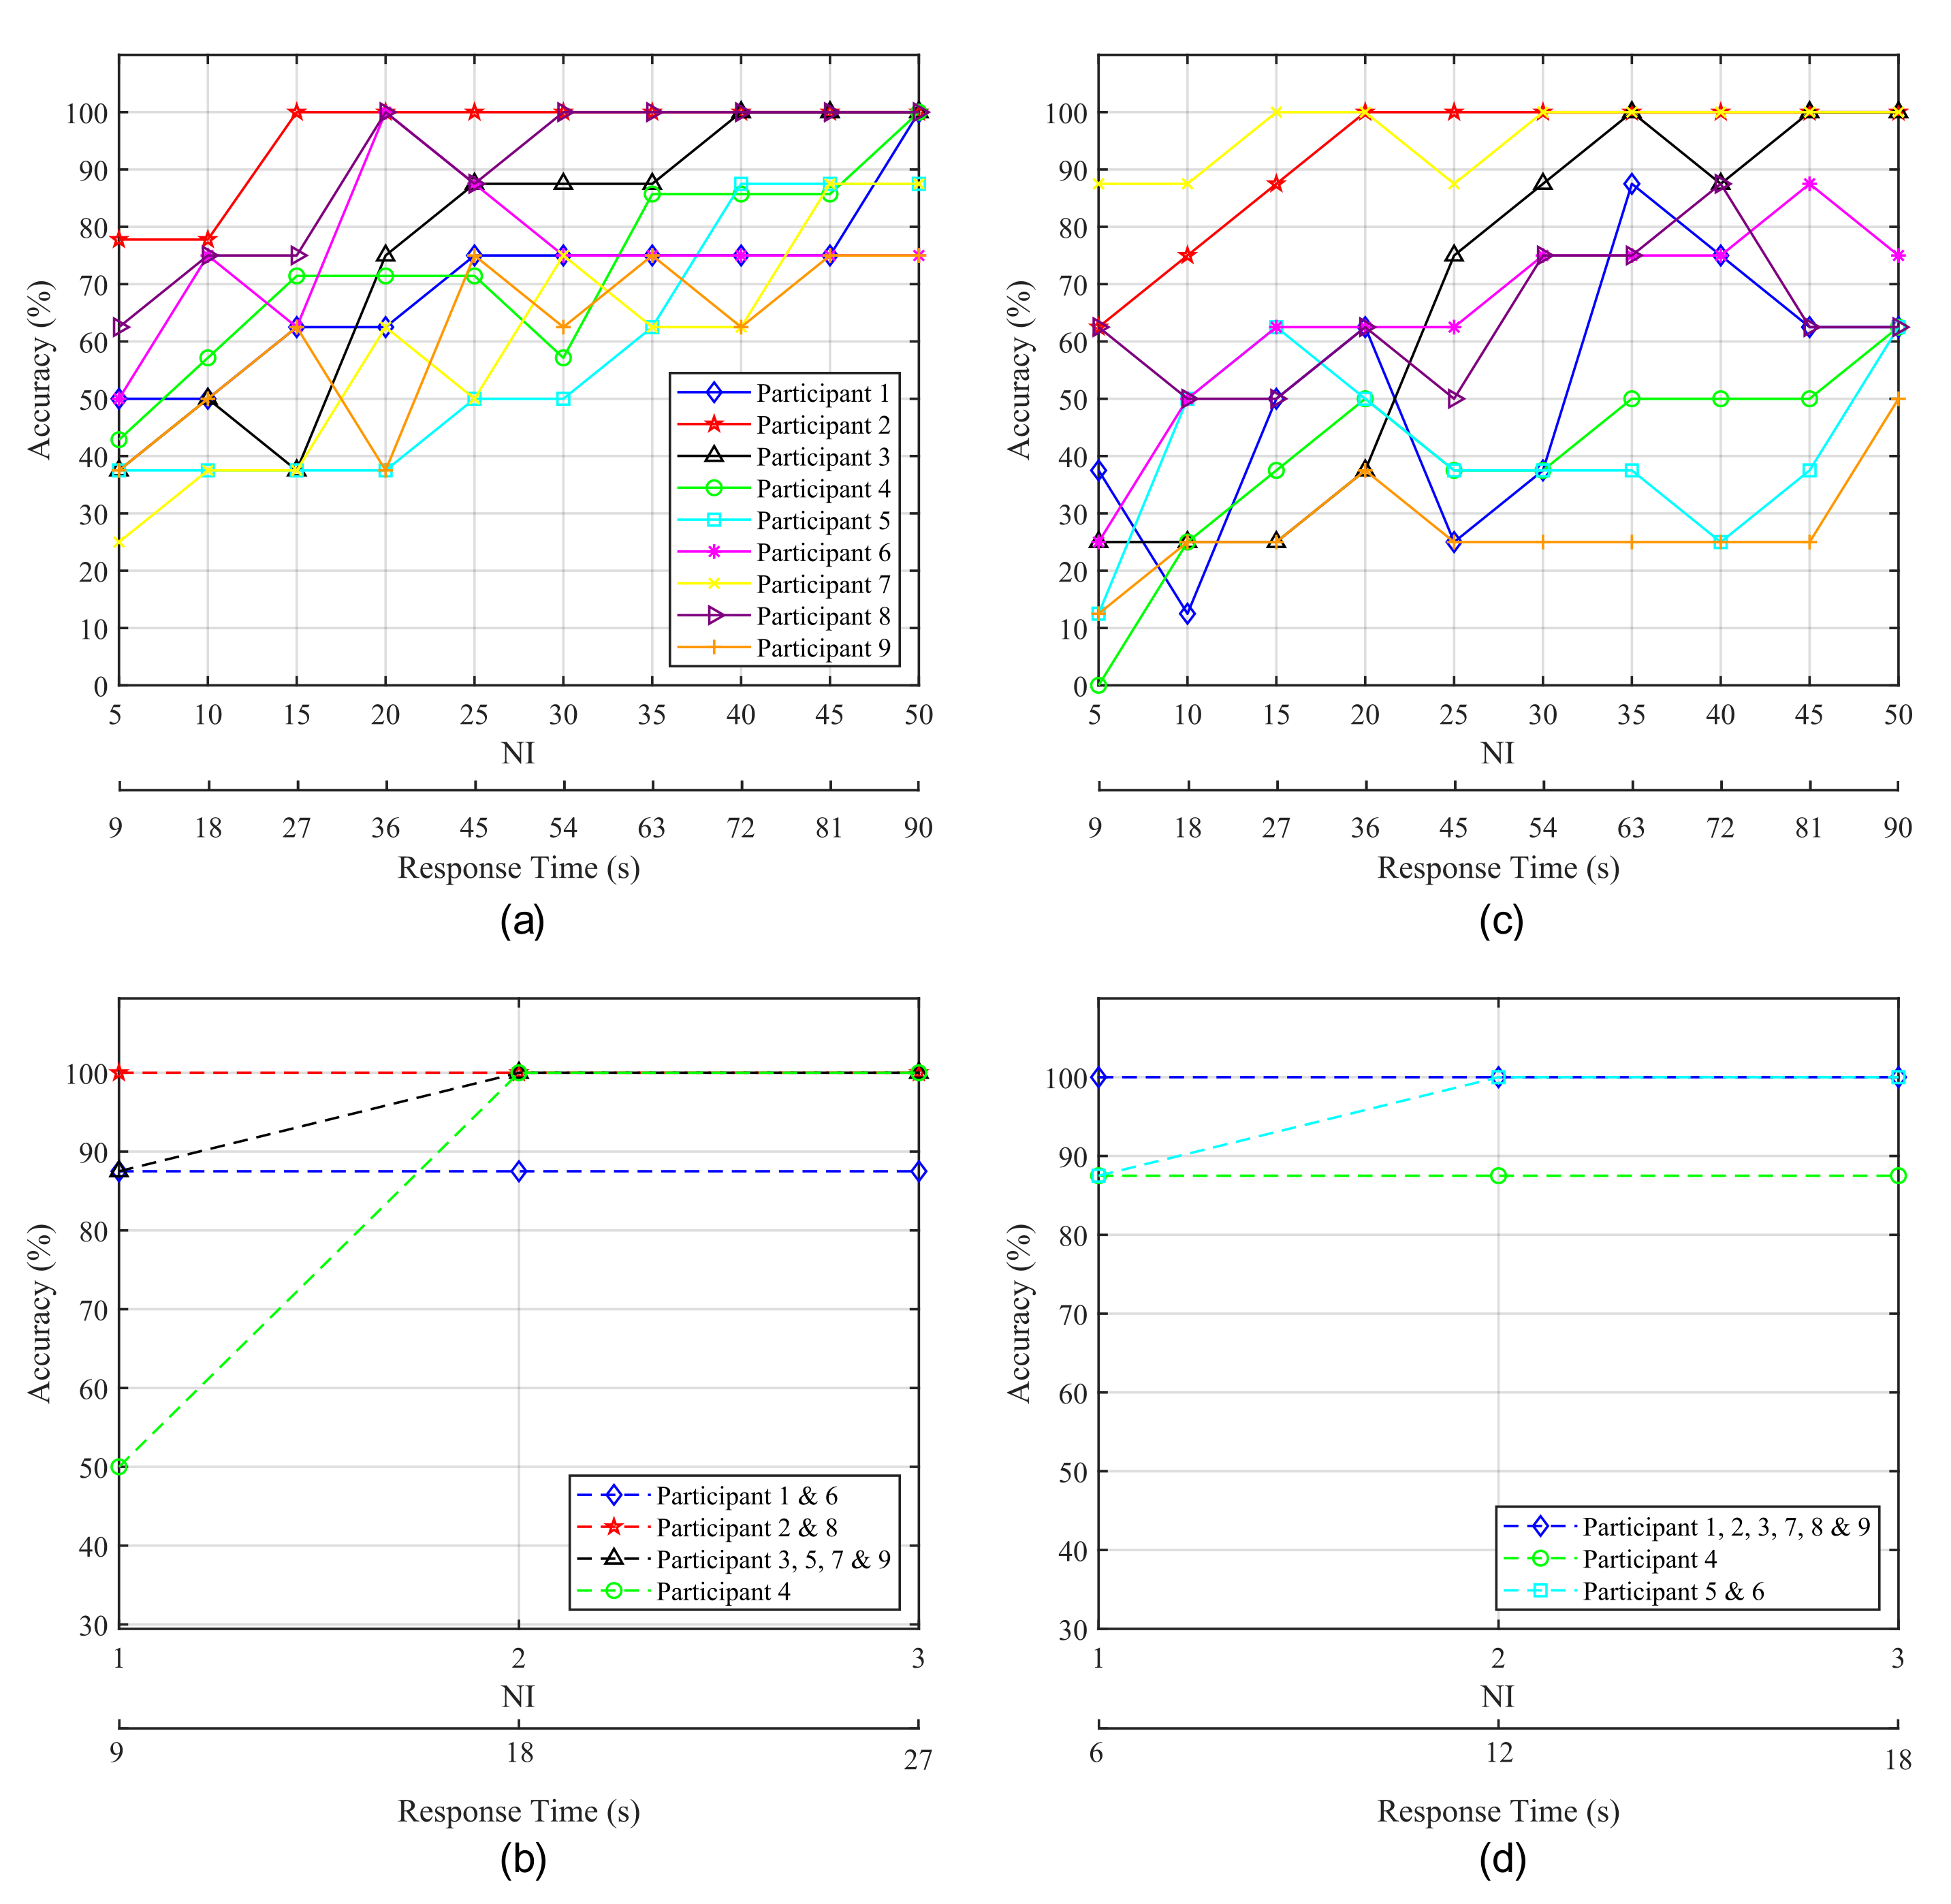
Figure 9 shows the average classification accuracy obtained for each participant as a function of the number of intensifications performed for each stimulus, which is directly related to response time.
Figure 9a,c show the accuracy obtained from the P300 experiments.
Figure 9a shows the results obtained from the 1-by-1 paradigm while
Figure 9c shows those from the row/column paradigm. It is apparent that there exists a trade-off between NI and accuracy of the HMI that is, as NI increases the obtained accuracy improves, and vice versa. This is due to the fact that a higher number of intensifications implies a larger number of epochs for the ensemble average and, therefore, the P300 becomes easier to detect. As a consequence, a higher classification accuracy means longer response times.
From
Figure 9a it can be observed that, for the 1-by-1 paradigm, Subjects 3 and 5 achieved their highest accuracy with
at
. A significant improvement can be seen for Subject 2, who reaches
accuracy at
with only fifteen intensifications, and for Subject 8, who achieves a stable
accuracy at 30 NI. Subject 6 also achieves a stable accuracy with 30 intensifications, but with poorer results. Conversely, for Subjects 1, 4 and 9, all or almost all the possible intensifications are needed to achieve a high and stable performance. In the case of the row/column paradigm (
Figure 9c, lower results are obtained and more time is required to achieve the best performance. Subject 7 is the only one that shows an improvement over the 1-by-1 paradigm. Subject 2 exhibits excellent results, but slower response time than for the 1-by-1 paradigm. Subject 3 also reaches a good accuracy, but the other three subjects do not show a stable behaviour, since their performance drop even when the elapsed time and the number of intensifications increase. Therefore, it becomes difficult to determine which specific response time offers the best accuracy.
Blinking experiments can be also analyzed in order to evaluate the response time of the system. In this case, the delay in the response is also dependent on the number of intensifications performed for each stimulus. It should be noted that, for these experiments, every time the target stimulus is presented, the user must blink in order to communicate its selection to the HMI. Therefore, the higher the NI, the larger the response time and the number of blinks required to select the target element. We must take into account that if a very low number of blinks is employed for this purpose, the false positive rate will increase, since non-voluntary blinks can be misinterpreted as control signals sent by users. If the number of blinks needed to pick the target is higher (e.g., two or three blinks), the interface can employ a double or triple verification system and non-voluntary blinks will probably not be interpreted as voluntary control signals. Therefore, for EOG there also exists a trade-off between response time and reliability, since a large number of blinks for target selection implies a longer response time and a lower false positive rate.
Figure 9b,d show the accuracy of the HMI obtained for EOG experiments as a function of NI and the response time.
Figure 9b shows the results for the 1-by-1 paradigm and
Figure 9d those corresponding to the row/column paradigm. For both cases, some subjects achieve their highest accuracy with one and two intensifications and no improvement is produced when using the maximum NI. However, it can be observed that for one intensification (i.e., only 1 blink for target selection), several subjects show a lower accuracy due to non-voluntary blinks mistaken as control signals. Therefore, two intensifications seem the most suitable option, since mistakes produced by non-voluntary blinks can be avoided and the response time of the system is kept low.
5. Discussion
In this study, we have developed an HMI for environmental control using a single-channel recording system. The P300 potential and eye blinks are compared as control signals in order to determine which one offers the best performance in terms of accuracy and response time. The home elements to be controlled are displayed in a GUI following a matrix-form and presented to users using two different stimulation paradigms: (1) home elements are intensified one by one or (2) all the elements of the same row/column are jointly intensified at the same time. Both interfaces, either the P300-based interface or the blink-based interface, employ only one input channel of the same EEG device to capture the brain/eye user’s activity. In addition, the GUI to show the stimuli is fully configurable and able to implement both paradigms. Thus, both interfaces exhibit similar cost and complexity for their respective implementations in real environments.
Practical and real applications of the HMIs will differ among users according to their degree of muscular control. The P300-based HMI does not require voluntary muscle activation for controlling and communicating with external devices. Thus, their immediate users will be those who suffer a complete locked-in state with a loss of all motor control or whose remaining control is easily fatigued or otherwise unreliable. This user group includes totally paralyzed patients due to, for example, terminal stages of ALS or brainstem stroke, or users suffering from movement disorders that abolish motor control caused by, for example, cerebral palsy [
1]. For these patients, even the most simple HMI for turning on/off a home device is a valuable tool [
7]. However, most potential users have better conventional options for communication. For example, those who retain control of only a single muscle, such as the eyelids, can use it to send control signals in a faster and more accurate way than that provided by EEG-based HMIs [
7]. The results presented in this study agree with this statement, as shown in
Table 3 and
Figure 9, where it is apparent that the blink-based interface offers shorter response times and similar or higher accuracy in classification than the P300-based HMI.
The subjects of this study, all able-bodied with no motor disabilities, indicated their preference for the blink-based interface since it is not as mental-demanding and time-consuming as the P300-based interface. Moreover, they also pointed out they felt with greater control over the system when using blinks as control signals, by marking the target element with voluntary and conscious actions.
From the EEG recordings, depicted in
Figure 7, it is apparent that the latency of the P300 potential varies for each subject. As has been already studied [
64], individual differences on the P300 latency are related to mental function speeds and cognitive capabilities, such that a shorter latency corresponds to a higher cognitive performance [
65,
66]. Moreover, the P300 latency is reduced with children and increases with normal ageing [
64,
67,
68]. It can also be observed in
Figure 7 that the P300 potential appears clearly with the 1-by-1 paradigm, especially for the three first subjects, while for the row/column experiments the P300 curve generated by the target stimulus does not show big differences with respect to other stimuli. A possible explanation for this behaviour is the human perceptual error produced by targeting adjacent rows and columns [
26]. According to this phenomenon, when rows/columns adjacent to desired elements are intensified, they also elicit a P300 potential, which can be confused with the one elicited by the target element. As a consequence, as shown in
Table 3, the row/column paradigm offers a classification accuracy significantly lower than that obtained by the 1-by-1 paradigm, where all the participants achieve an accuracy above
.
Notable differences can also be observed between both paradigms regarding time responses, shown in
Figure 9, in which the 1-by-1 paradigm shows a more stable behaviour and, with
, five of the nine participants are above
. All of the subjects were above
for
.
On the other hand, for the blink detection experiments, the results achieved by both stimulation paradigms are very similar, only varying for three of the subjects and with a close average accuracy of
for the 1-by-1 paradigm and
for the row/column paradigm (see
Table 3). Moreover, since the number of possible stimuli for the row/column paradigm (6) is lower than for the 1-by-1 one (9), the response time for row/column will be shorter, as shown in
Figure 9. This response time can be further reduced if we analyze the reaction time of each participant that is, the elapsed time from the presentation of the target element to the corresponding user blink. In our experiments, the time between the onset of the intensification of one element and the onset of the next one is fixed to
(see
Table 2). However, if the reaction time of a particular subject is faster, the period between two consecutive intensifications can be reduced and, consequently, the final response time of the system will be shorter.
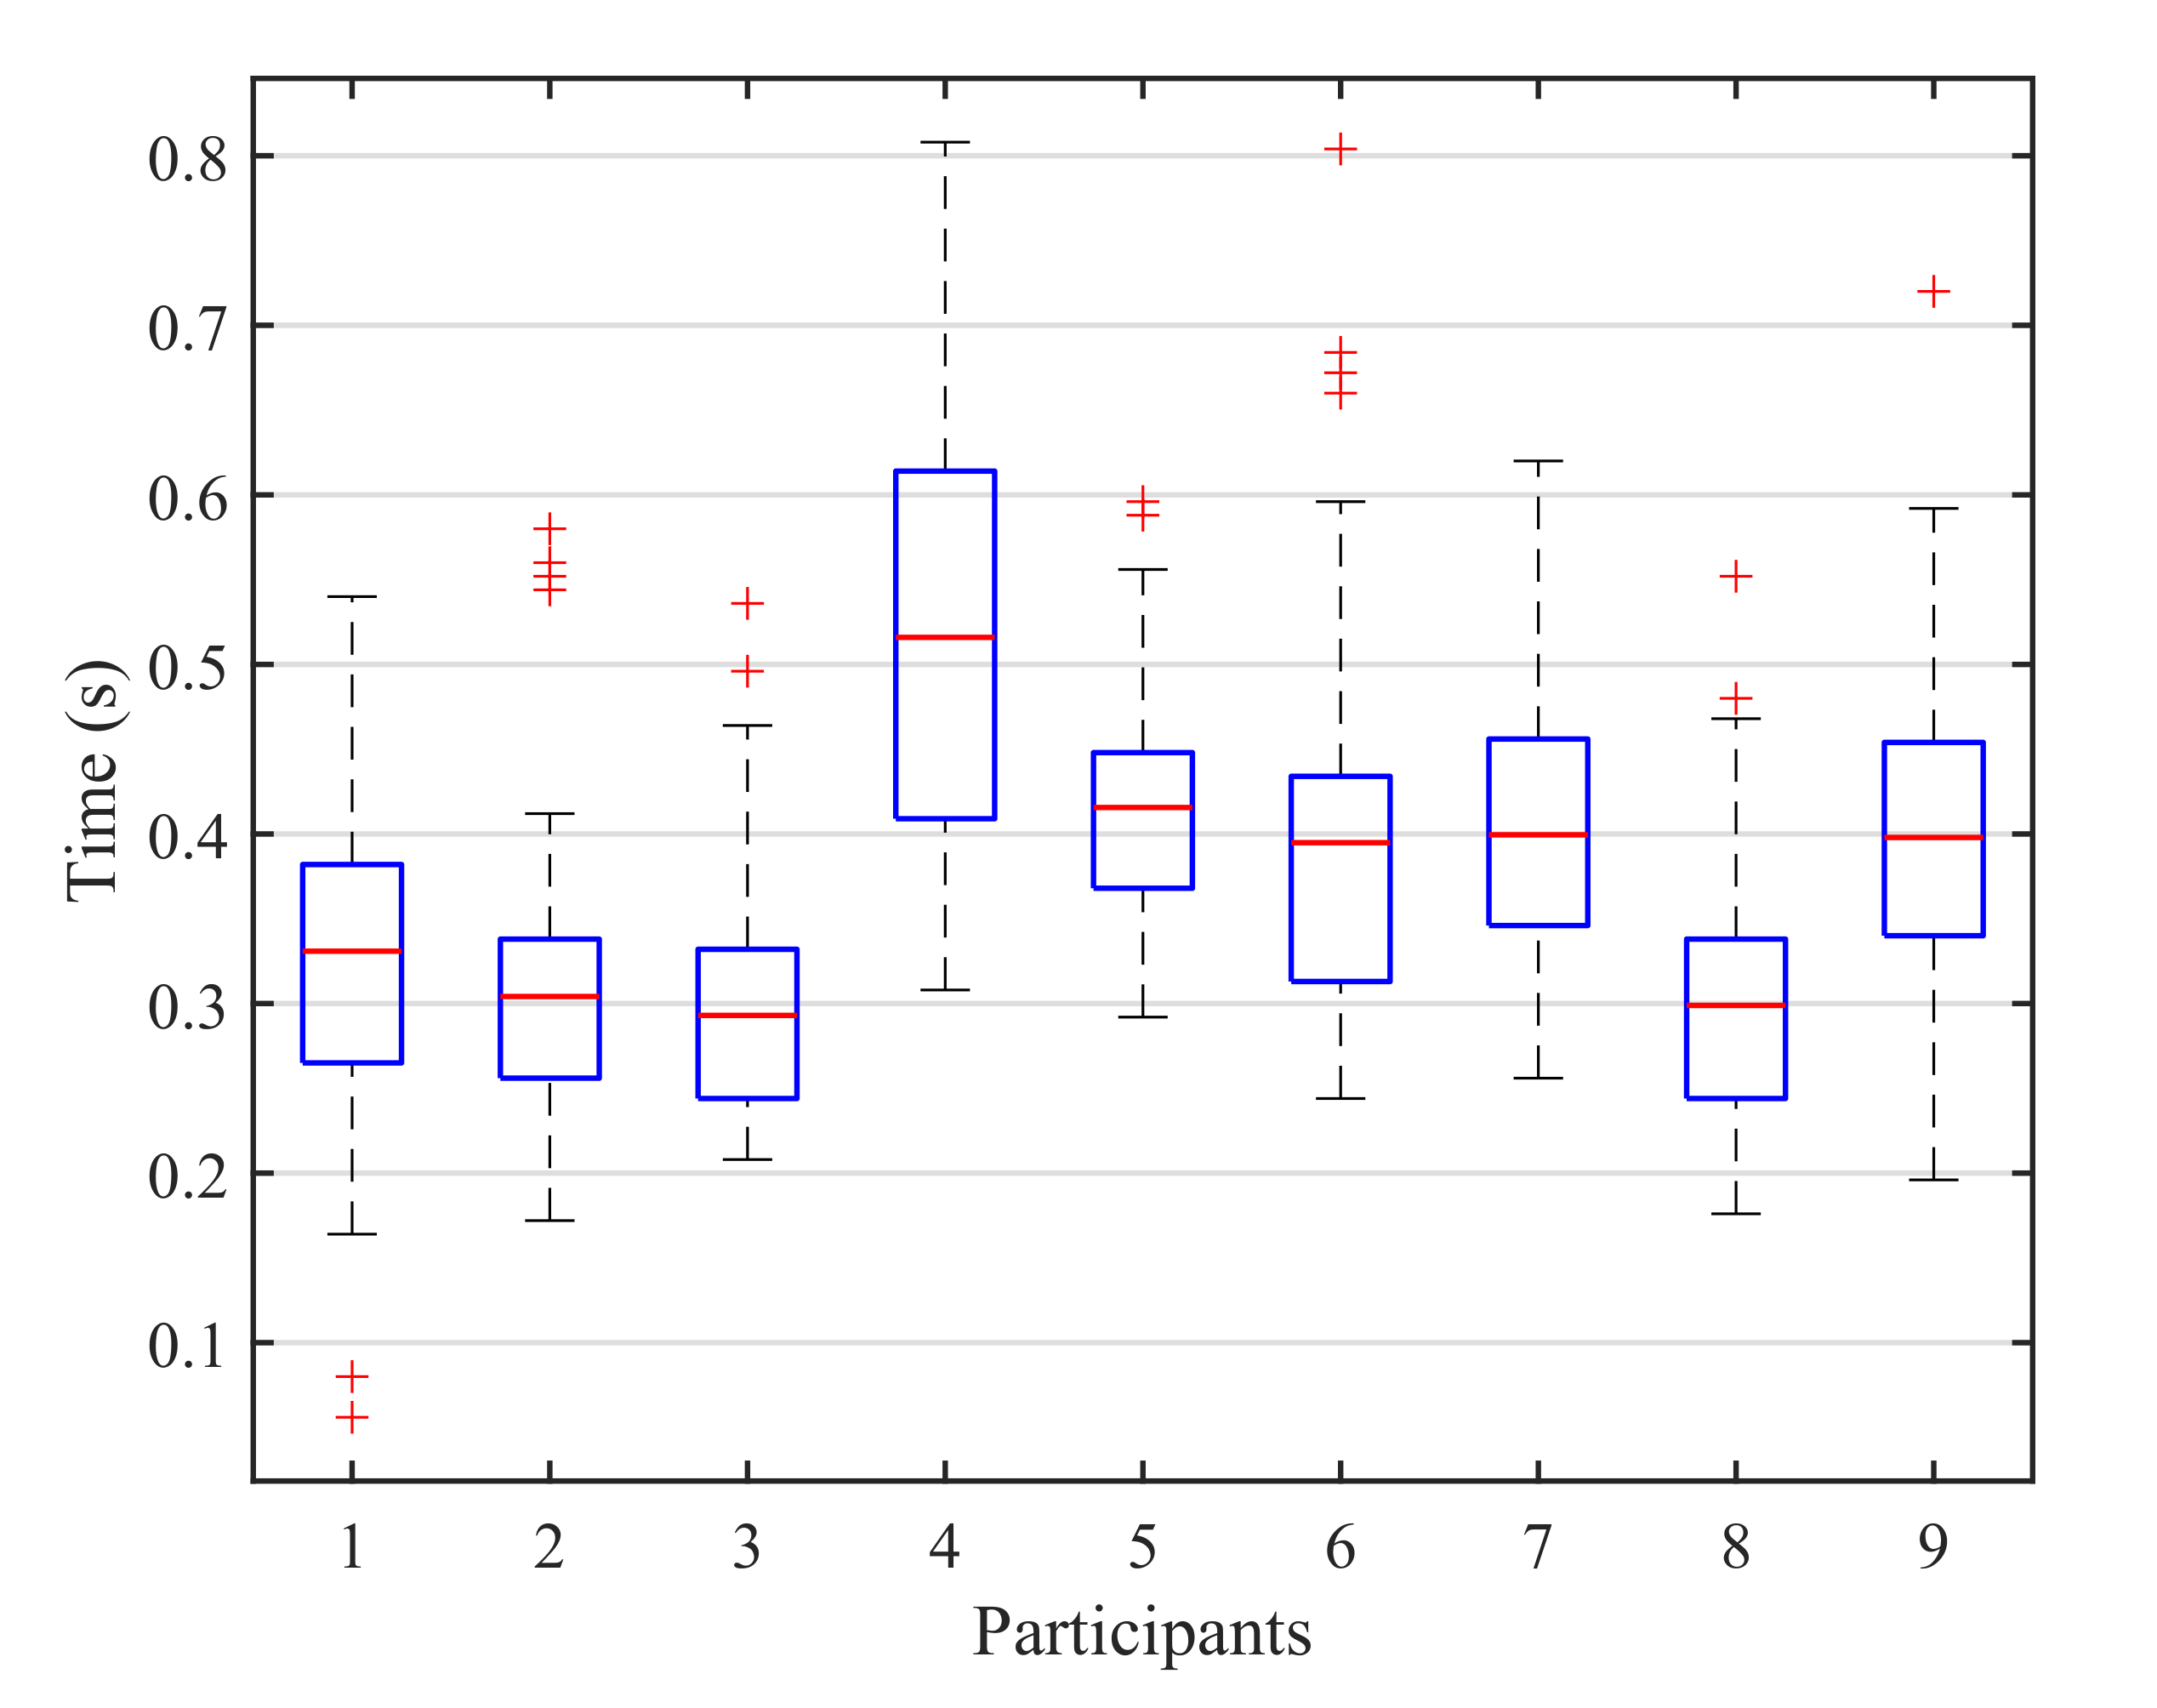
Figure 10 shows a box plot of the reaction times for all the blinks performed by the subjects across all the blinking experiments. On each box, the average response time is marked as the central red line and the bottom and top edges of the box indicate the 25th and 75th percentiles, respectively. The whiskers extend to the maximum and minimum reaction time not considered as outliers. The outliers are individually plotted using the ‘+’ symbol. The median response time for all the subjects is below
, and no blink exceeds
, so the period between two consecutive instensifications could be reduced by at least
, which would also decrease the overall response time of the system.
The proposed HMIs should be implemented in an IoT environment for smart-home control using the shortest response times while providing a high reliability of the system. Practical applications of an HMI and their implementation in real environments are strongly conditioned by their response times and accuracies [
7].
Table 4 shows the shortest response time for both stimulation paradigms and control signals while keeping an average accuracy higher than
. Note that, for the blink-based experiments, although the results achieved by the minimum number of blinks are higher than
, they are not taken into account due to their sensitivity to non-voluntary blinks, which could badly influence the final performance of the HMI. Both stimulation paradigms offer a similar accuracy, but shorter response times are achieved for the row/column paradigm, so it is the most suitable option for a blink-based HMI. Conversely, for the P300 experiments, the row/column paradigm does not achieve an
of accuracy, so the 1-by-1 paradigm, with a response time of
and an accuracy of
, is the preferable option.
The proposed HMI systems can be used for non-critical applications where short response times are not required. The objective of these interfaces is to control basic functions of home devices, such as on/off switching of lights or raising/lowering window blinds. Thus, ensuring that the system performs the correct action is more important than providing a fast response.


 ,
, 


