
Human Body-Related Disease Diagnosis Systems Using CMOS Image Sensors: A Systematic Review

 ,
,  ,
,  , and
, and
Abstract
1. Introduction
- We have conducted a novel systematic review on CIS utilization in disease diagnosis in the medical field.
- We have extracted data and evaluated by specifying the vital parameters required for medical systems performing disease diagnosis shown in Table 2.
- Based on our literature survey, we have tabulated all the available technical specifications related to CMOS image sensors in Appendix A Table A1.
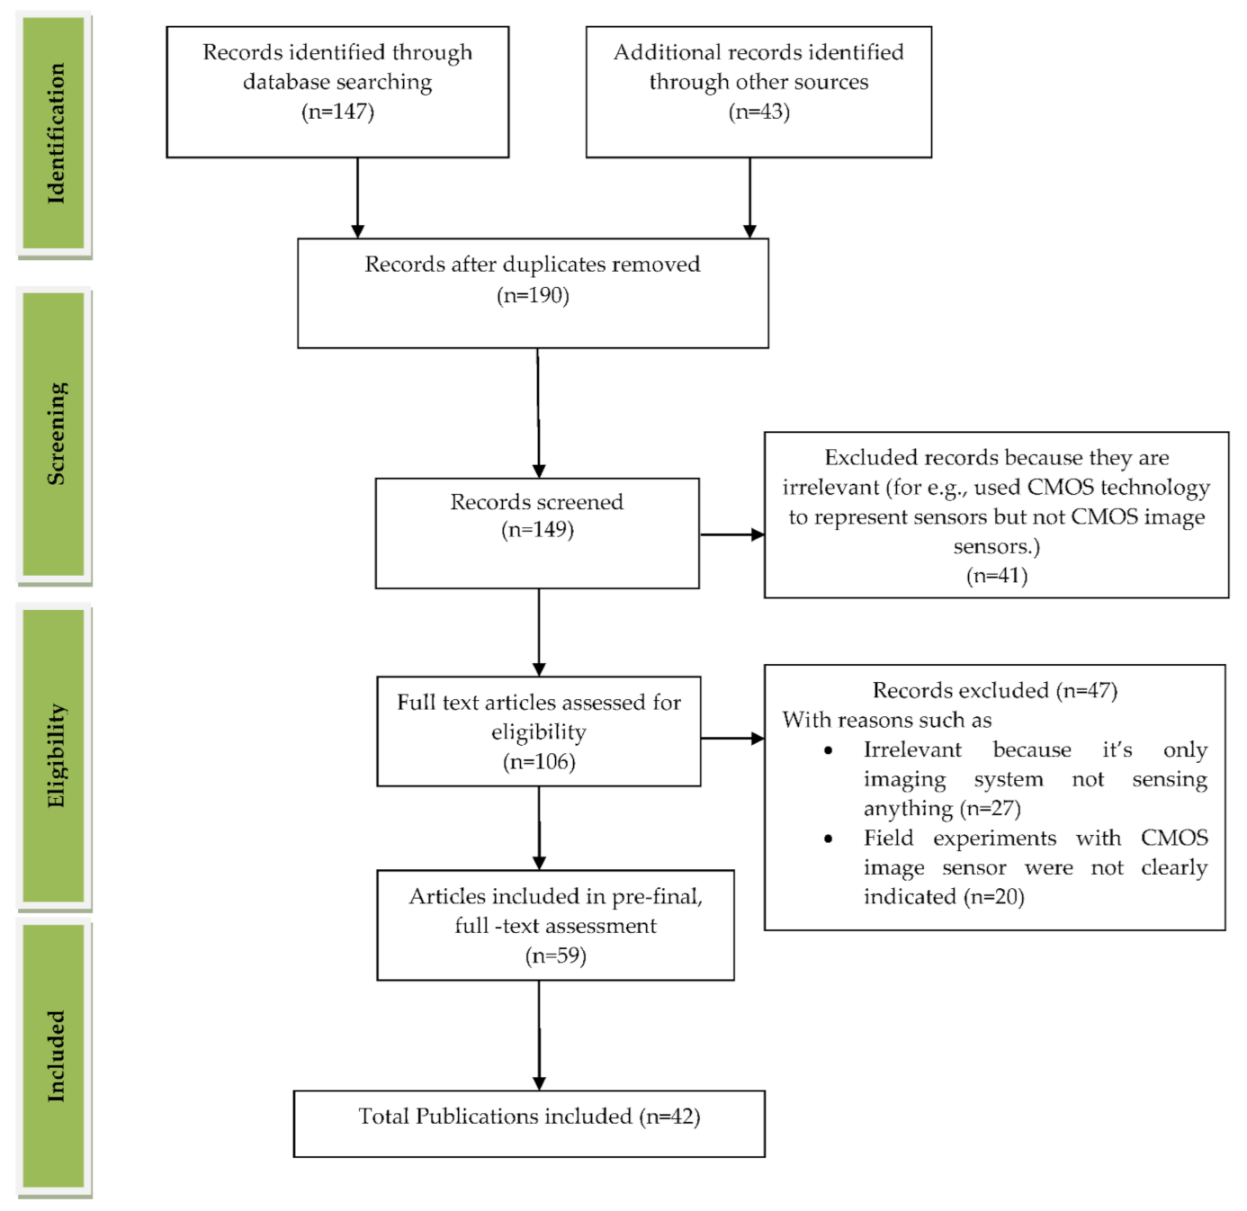
2. Study Selection Methodology
3. Role of CIS in Human Body-Related Disease Diagnosis Systems
3.1. Disease Diagnosis Systems Related to Blood
Summary
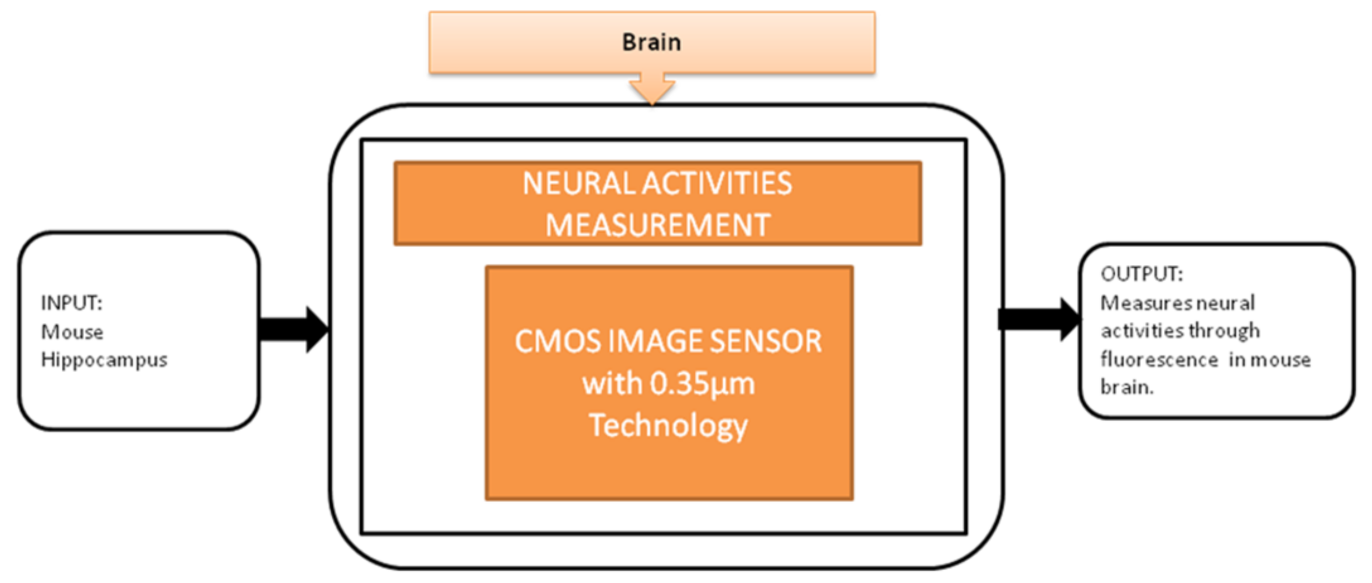
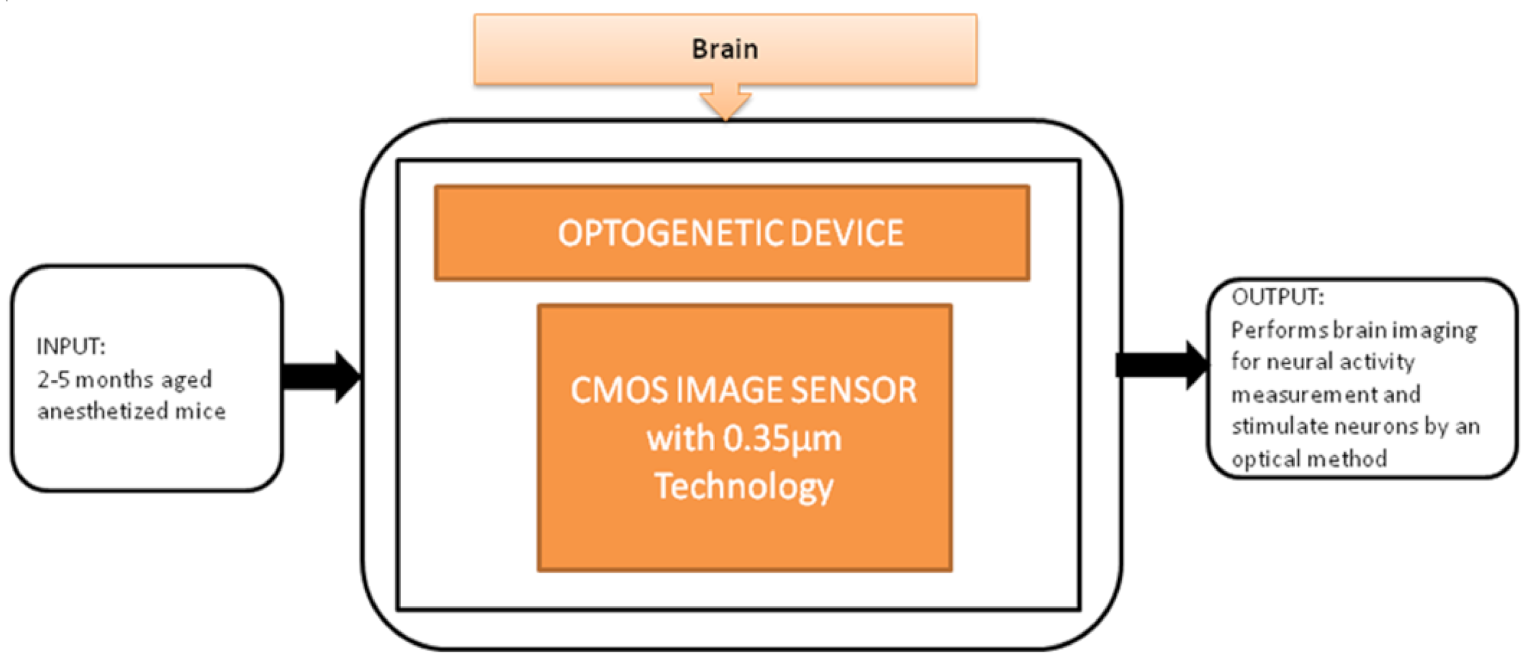
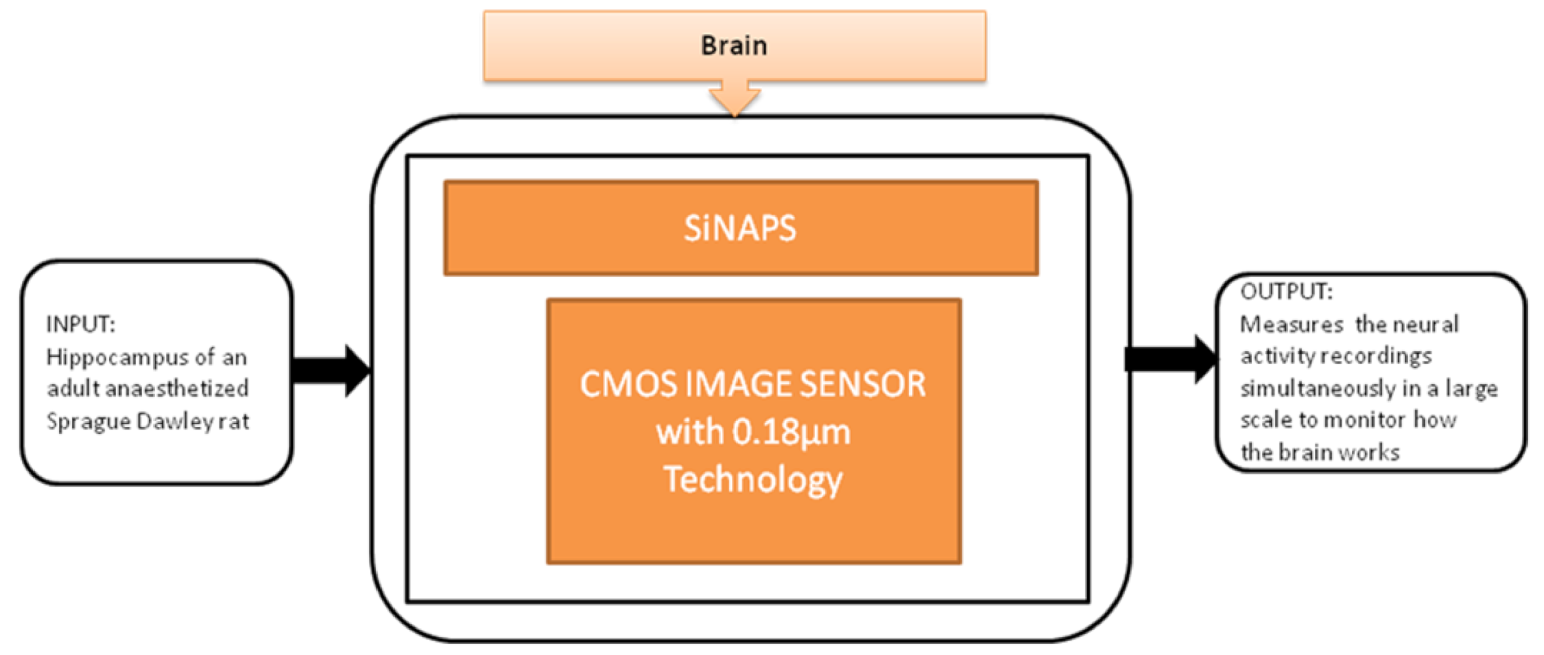
3.2. Disease Diagnosis Systems Related to Brain
Summary
3.3. Disease Diagnosis Systems Related to Skin
Summary
3.4. Disease Diagnosis Systems Related to Intestines
Summary
3.5. Disease Diagnosis Systems Related to Eyes
3.6. Disease Diagnosis Systems Related to Heart
3.7. Disease Diagnosis Systems Related to Lungs
Summary
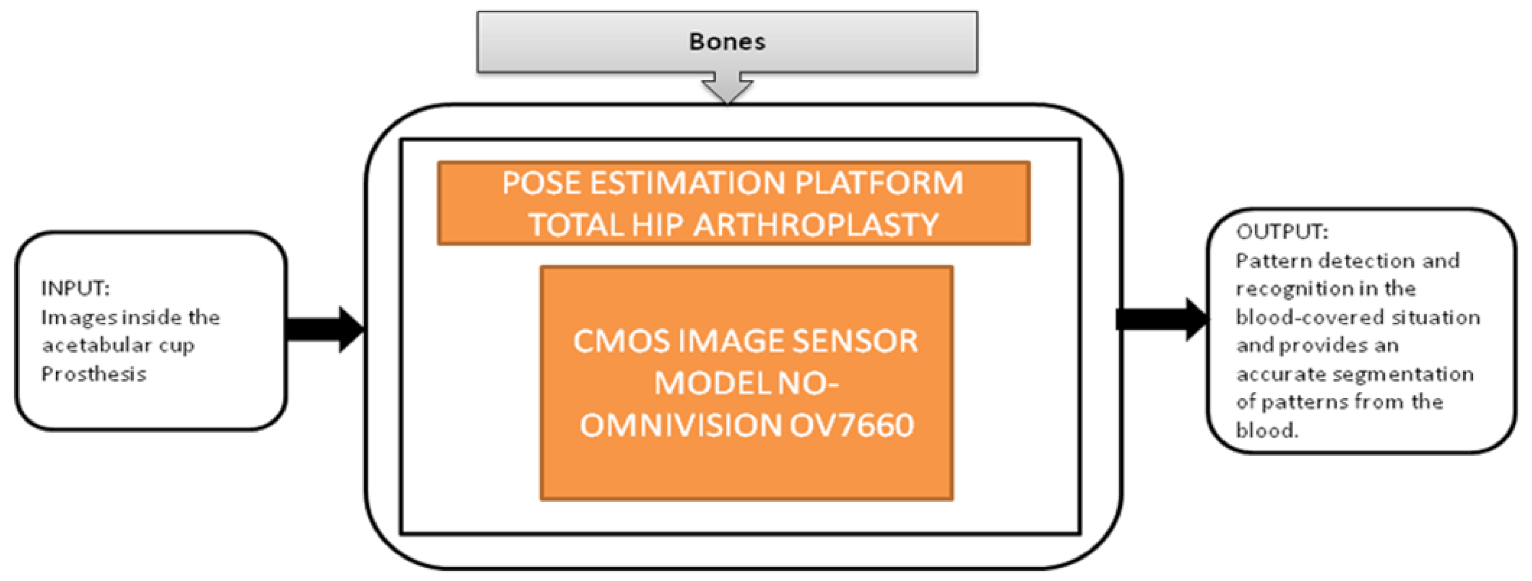
3.8. Disease Diagnosis Systems Related to Bones
Summary
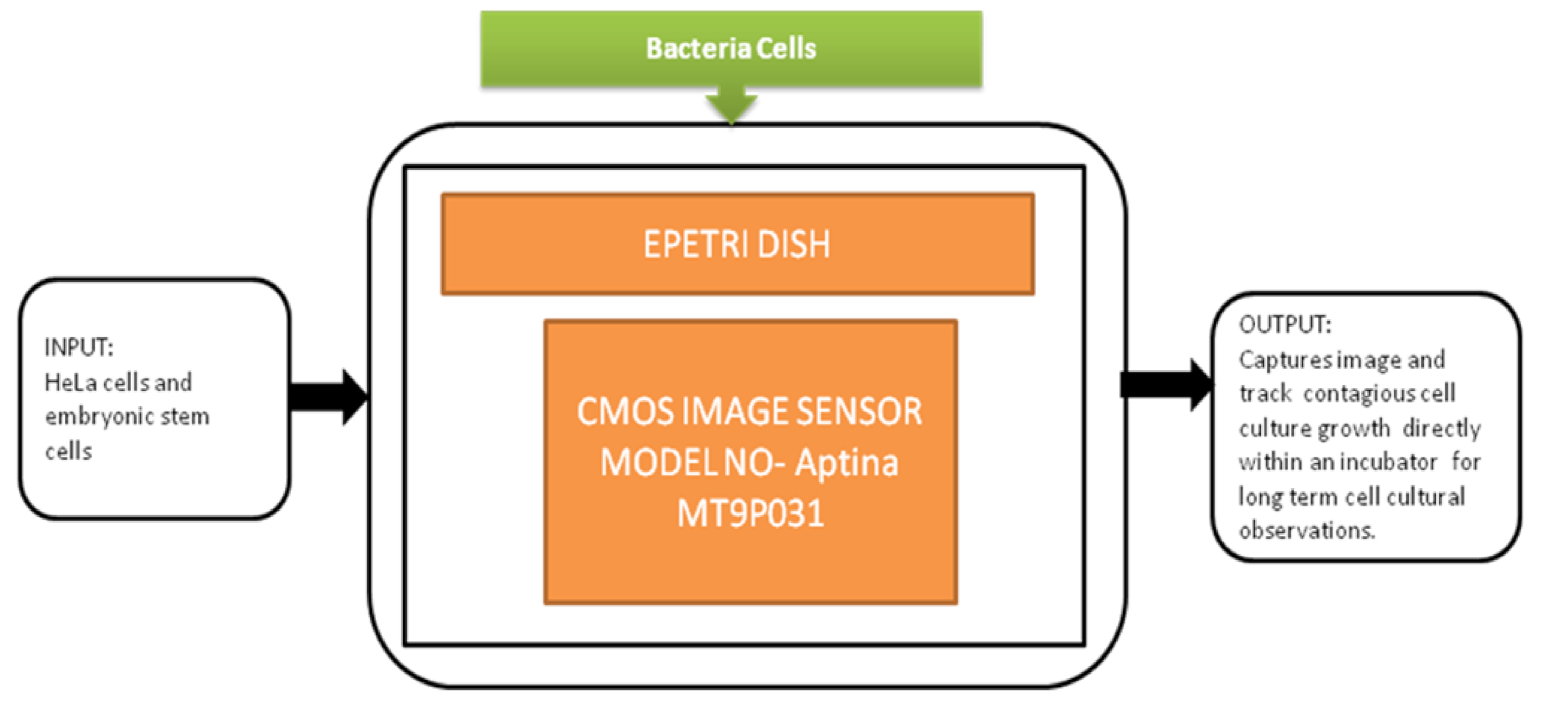
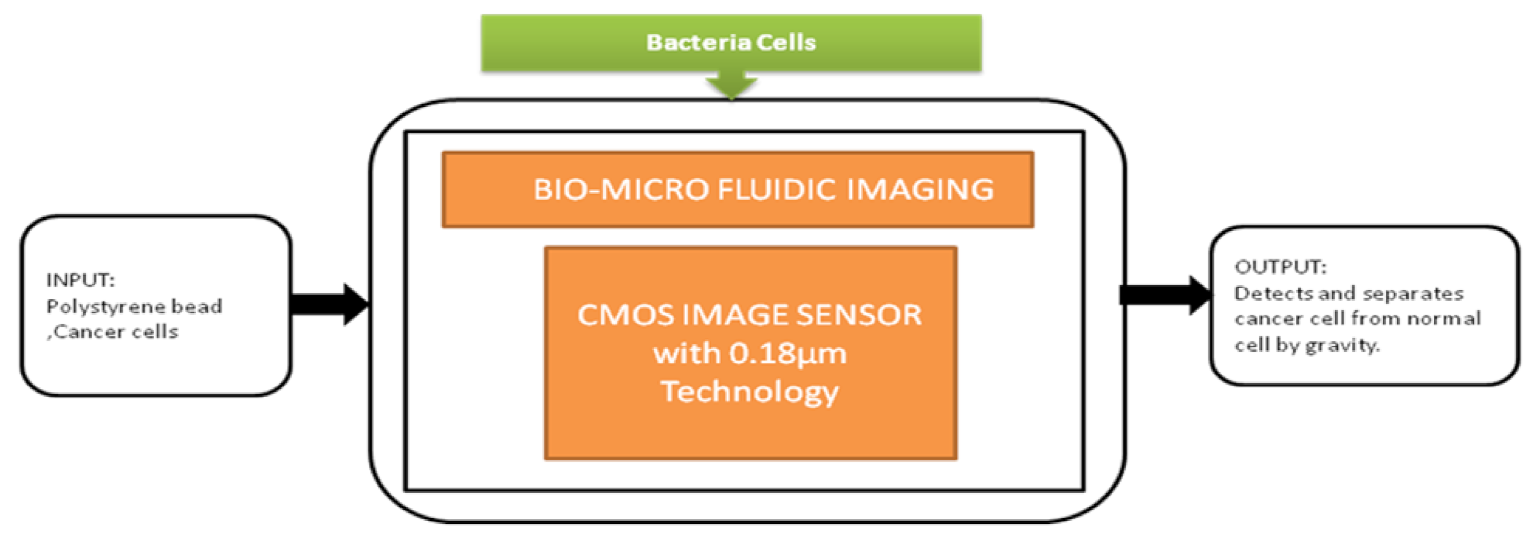
3.9. Disease Diagnosis Systems Related to Bacteria Cells
Summary
4. Data Extraction and Evaluation
5. Discussion
CMOS Image Sensor Models
6. Conclusions
Author Contributions
Funding
Institutional Review Board Statement
Informed Consent Statement
Data Availability Statement
Acknowledgments
Conflicts of Interest
Abbreviations
| CIS | CMOS Image Sensor |
| CMOS | Complementary Metal Oxide Semiconductor |
| CCD | Charge Coupled Device |
| WCE | Wireless Capsule Endoscopy |
| FPS | Frames Per Second |
| dB | Decibel |
| mm | Millimeter |
| µm | Micrometer |
| v/lux.s | Volts per luminance. Second |
| DR | Dynamic Range |
| SNR | Signal to Noise Ratio |
| BSI | Backside-illuminated |
Appendix A

| S. No | Year | CMOS Technology/Camera Module | Pixel Size (µm) | Resolution | Pixel Pitch (µm) | Area | Power (W/mW) | SNR (dB) | Sensitivity (V/lux-s) | Frame Rate (fps) | Dynamic Range (dB) | Fill Factor (%) | Field | Application Name/Target |
|---|---|---|---|---|---|---|---|---|---|---|---|---|---|---|
| 1 | 2014 | 0.35 µm | 7.5 × 7.5 | 120 × 268 | 7.5 | 1048.6 µm × 2700 µm | N/A | N/A | N/A | 58 Hz | N/A | 44% | Implantable | Blood Flow Velocity Detection [15] |
| 2 | 2014 | 0.35 µm | 7.5 × 7.5 | 30 × 60 | 7.5 | 320 µm × 790 µm | N/A | N/A | N/A | 10 fps | N/A | 31% | Implantable | Glucose Sensors [16] |
| 3 | 2011 | MT9P031 | 2.2 × 2.2 | 2592 H × 1944 V | 2.2 | 5.70 mm × 4.28 mm | 381 mW | 38.1 db | 1.4 | 14 fps | 70.1 db | N/A | Medical | Hemoglobin concentration measurement [11] |
| 4 | 2011 | 0.18 µm | 27 × 33 | 32 × 32 | N/A | 1.9 mm × 1.5 mm | 625 µw | N/A | N/A | N/A | N/A | 56% | Medical | Detection of luminescence response from a xerogel sensor array for O2 detection [12] |
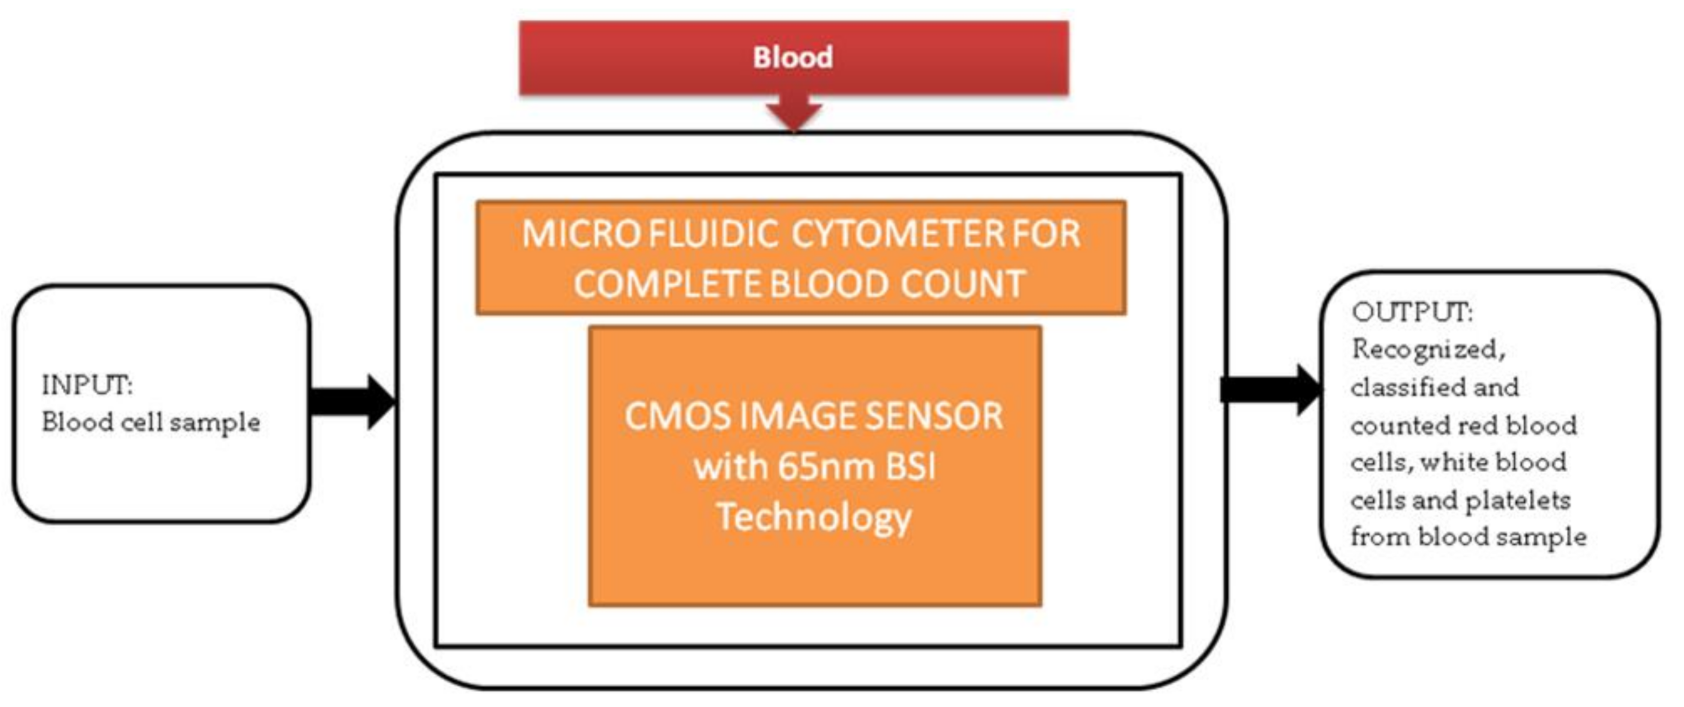
| 5 | 2017 | 65 nm BSI CMOS | 1.1 × 1.1 | 1600 × 2056 | 1.1 | 1.69 mm × 2.24 mm | 182.8 mW | N/A | 1.05 | 45 fps | N/A | N/A | Medical | Microfluidic cytometer for complete blood count [13] |
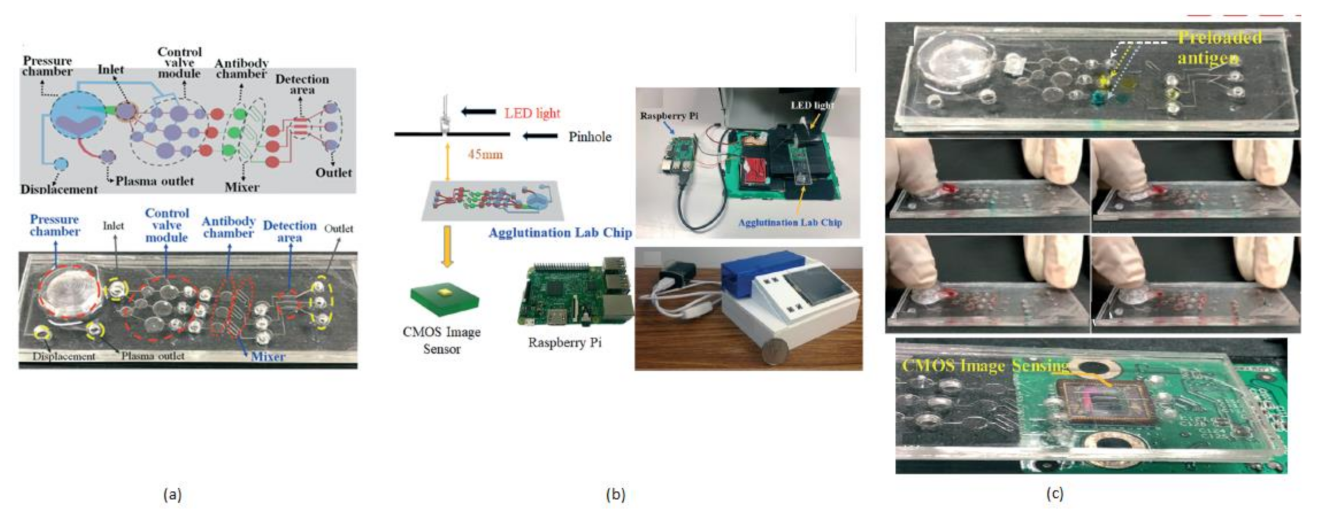
| 6 | 2019 | OV8833 | 1.4 × 1.4 | 3264 × 2448 | 1.4 | 4.6 mm × 3.45 mm | 291 mW | N/A | 0.824 | 24 fps | 67 dB | N/A | Medical | Finger powered agglutination lab chip [14] |
| 7 | 2012 | 0.35 µm | 15 × 7.5 | 128 × 268 | N/A | 2236 µm × 3171 µm | N/A | N/A | N/A | N/A | N/A | N/A | Biomedical | On-chip Bio Imaging sensor [23] |
| 8 | 2012 | 0.35 µm | 7.5 × 7.5 | 30 × 90 (needle), 120 × 268 (planar) | 7.5 | 320 µm × 1025 µm (needle), 1000 µm × 3500 µm (planar) | N/A | N/A | N/A | N/A | N/A | N/A | Implantable | Monitoring Neural Activities [24] |
| 9 | 2013 | 0.35 µm | 7.5 × 7.5 | 60 × 60 | 7.5 | 1.0 mm × 1.0 mm | N/A | N/A | N/A | N/A | N/A | 30% | Implantable | Wireless Imager for Intra Brain Image Transmission [25] |
| 10 | 2017 | 0.35 µm | 7.5 × 7.5 | 260 × 244 | 7.5 | 2200 × 2500 | N/A | N/A | N/A | 20 to 70 hz | N/A | N/A | Implantable | Optogenetic Device [26] |
| 11 | 2018 | 0.18 µm | N/A | 512 × 512 | 28 | 330 µm × 120 µm | N/A | N/A | N/A | N/A | N/A | N/A | Implantable | SiNAPS for Large Scale Neuro Recordings [27] |
| 12 | 2019 | 0.15 µm | 2.2 × 2.2 | 256 × 256 | 2 | 10.42 mm × 3.55 mm | N/A | N/A | N/A | 3 0 fps | N/A | N/A | Implantable | Spatiotemporal pH Recording [28] |
| 13 | 2018 | 0.18 µm | 30 × 50 | 16 × 128 | 18 | 480 × 6400 µm | 115 µW | N/A | N/A | N/A | N/A | N/A | Implantable | Positron Imaging in Rat Brain [29] |
| 14 | 2013 | N/A | 5.6 × 5.6 | 640 × 480 | 5.6 | 11.43 mm × 11.43 mm | N/A | N/A | N/A | N/A | N/A | N/A | Medical | Active Personal Dosimeter [30] |
| 15 | 2013 | N/A | N/A | 320 × 240 | N/A | N/A | 40 mw | 53 dB | N/A | 24 fps | N/A | 25% | Biomedical | Wireless Capsule Endoscopy [32] |
| 16 | 2012 | 0.18 µm | N/A | 96 × 96 | 23 | 3 mm × 4 mm | 6 µW | N/A | N/A | 5 fps | N/A | N/A | Biomedical | Endomicroscope Applications [33] |
| 17 | 2009 | N/A | 2.2 × 2.2 | 648 × 488 | 2.2 | 1.43 mm × 1.07 mm | 80 mw | >36.5 db | 1.1 | 30 fps | 64 db | N/A | Medical | Disposable Endoscopic Applications [31] |
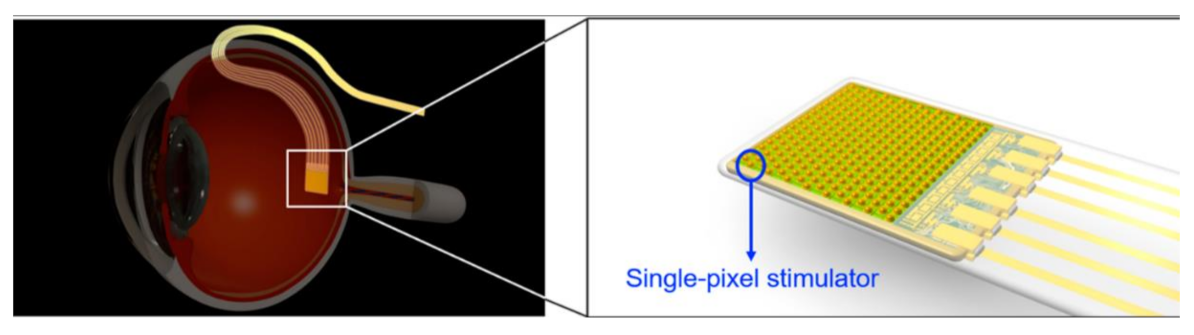
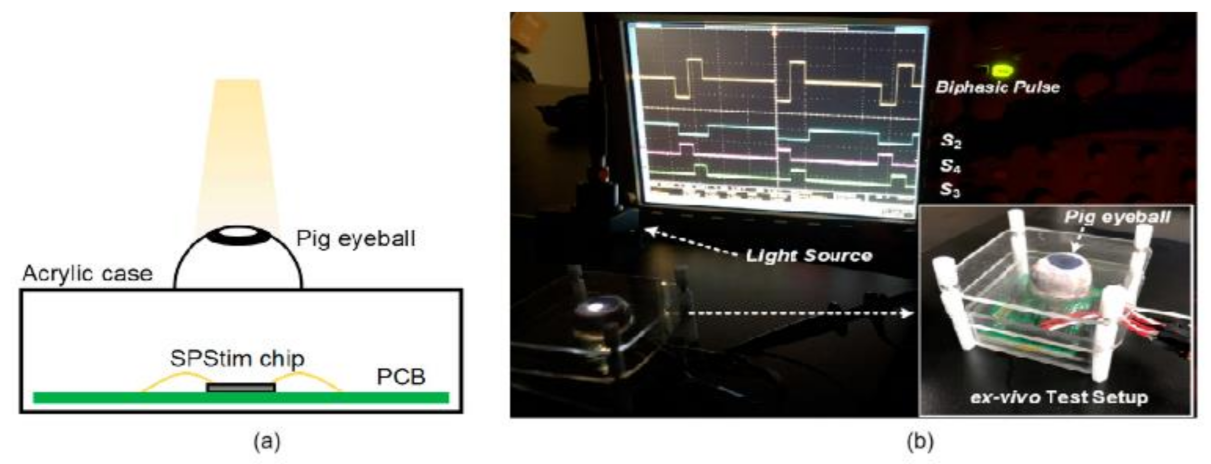
| 18 | 2019 | 0.35 µm | 114 × 117 | 64 × 64 | N/A | 4.3 mm × 3.2 mm | N/A | N/A | N/A | N/A | N/A | N/A | Biomedical | Stimulator for a sub retinal prosthesis [35] |
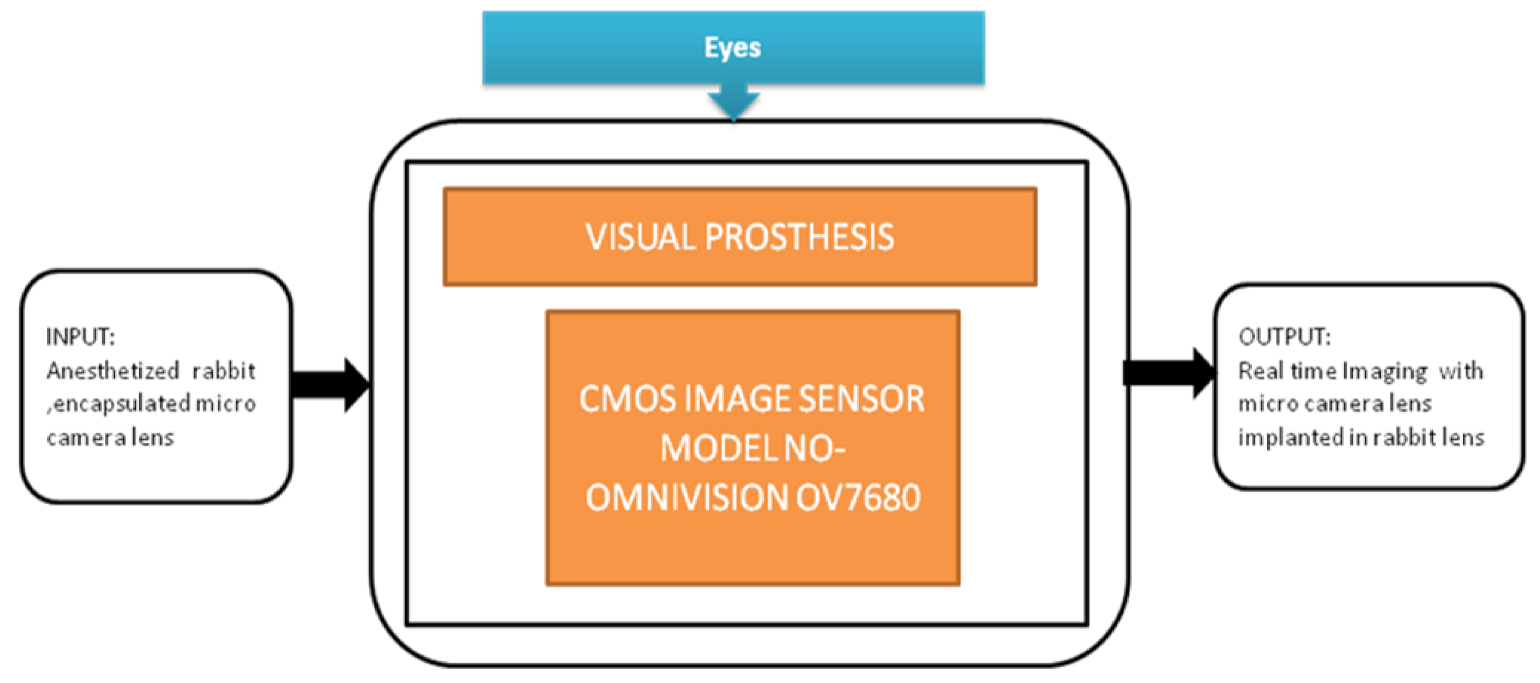
| 19 | 2010 | OV7680 | 2.2 × 2.2 | 640 × 480 | 2.2 | 1443.2 µm × 1082.4 µm | 20 mW | N/A | 0.56 | 30 fps | N/A | N/A | Implantable | Visual Prosthesis [36] |
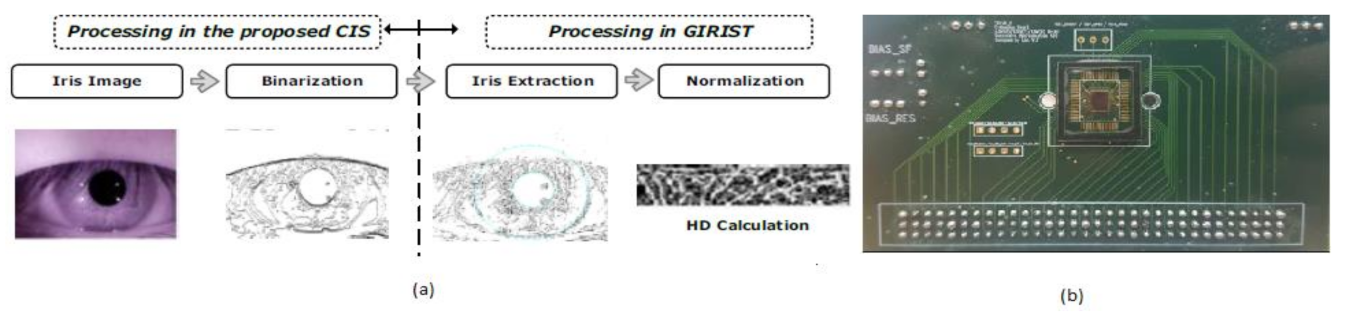
| 20 | 2018 | 0.18 µm | 2.84 mm × 2.84 mm | 174 × 144 | 2.84 | 1.72 mm × 1.65 mm | 12.36 mw | N/A | N/A | 520 fps | N/A | N/A | Medical | Iris detection for biometric applications [34] |
| 21 | 2020 | Grasshopper 3 camera with Sony IMX174 | 5.86 × 5.86 | 1920 × 1200 | 5.86 | 11.43 mm × 11.43 mm | N/A | N/A | 10.45 | 48 fps | 67.55 dB | N/A | Medical | COVID-19 severity detection [38] |
| 22 | 2020 | SONY α6100 | N/A | 6000 × 4000 | N/A | 23.5 mm × 15.6 mm | N/A | N/A | N/A | 120 fps | N/A | N/A | Medical | COVID-19 Cytokine storm monitoring [39] |
| 23 | 2020 | NAC Memrecam HX-5 | N/A | 2560 × 1920 | N/A | N/A | N/A | N/A | N/A | 35 fps | N/A | N/A | Medical | COVID-19 risk assessment [40] |
| 24 | 2021 | Smartphone | N/A | N/A | N/A | N/A | N/A | N/A | N/A | N/A | N/A | N/A | Medical | COVID-19 Saliva test [41] |
| 25 | 2016 | N/A | N/A | 240 × 240 | N/A | N/A | N/A | N/A | N/A | 8 fps | N/A | N/A | Implantable | Artificial Knee Implant Surgeries [43] |
| 26 | 2019 | 0.18 µm, OV7660 | 15 × 15 | 200 × 200 | 15 | 3.5 mm × 3.5 mm | N/A | N/A | N/A | N/A | N/A | 60% | Medical | Total Hip Arthroplasty Surgery [42] |
| 27 | 2011 | MT9P031 | 2.2 × 2.2 | 2592 × 1944 | 2.2 | 5.70 mm × 4.28 mm | N/A | 38.1 | 1.4 | 14 fps | 70.1 db | N/A | Biomedical | ePetri Dish [45] |
| 28 | 2011 | 0.18 µm | 50 × 50 | 2520 × 2560 | 50 | 12.8 cm × 12.8 cm | N/A | N/A | N/A | 30 fps | 65 | N/A | Biomedical | DynAMITe (Dynamic range Adjustable for Medical Imaging Technology) for Bio-Medical Imaging [46] |
| 29 | 2012 | 0.18 µm | 10 × 10 | 128 × 128 | 10 | 2.5 mm × 5.0 mm | N/A | N/A | N/A | 1750 fps | N/A | N/A | Biomedical | Bio-micro fluidic imaging system for cancer cell detection [47] |
| 30 | 2014 | MT9P031 | 2.2 × 2.2 | 2592 × 1944 | 2.2 | 5.70 mm × 4.28 mm | 381 mw | 38.1 db | 1.4 | 14 fps | 70.1 db | N/A | Biomedical | ELISA detector [48] |
| 31 | 2017 | 0.11 µm | 22.4 × 22.4 | 128 × 128 | 22.4 | 7.0 mm × 9.3 mm | N/A | N/A | N/A | 45 fps | – | N/A | Biomedical | Real-Time Fluorescence Lifetime Imaging Microscopy [49] |
| 32 | 2019 | LT225 | 5.5 × 5.5 | 2048 × 1088 | 5.5 | 43 mm × 43 mm | N/A | N/A | N/A | 170 fps | 56.4 | N/A | Biomedical | Quantifying Protein Dynamics [50] |
| 33 | 2014 | MT9P031 | 2.2 × 2.2 | 2592 × 1944 | 2.2 | 5.702 mm × 4.277 mm | 381 mW | 38.1 db | 1.4 | 30 fps | 70.1 | N/A | Medical | Bio Film Detection [44] |
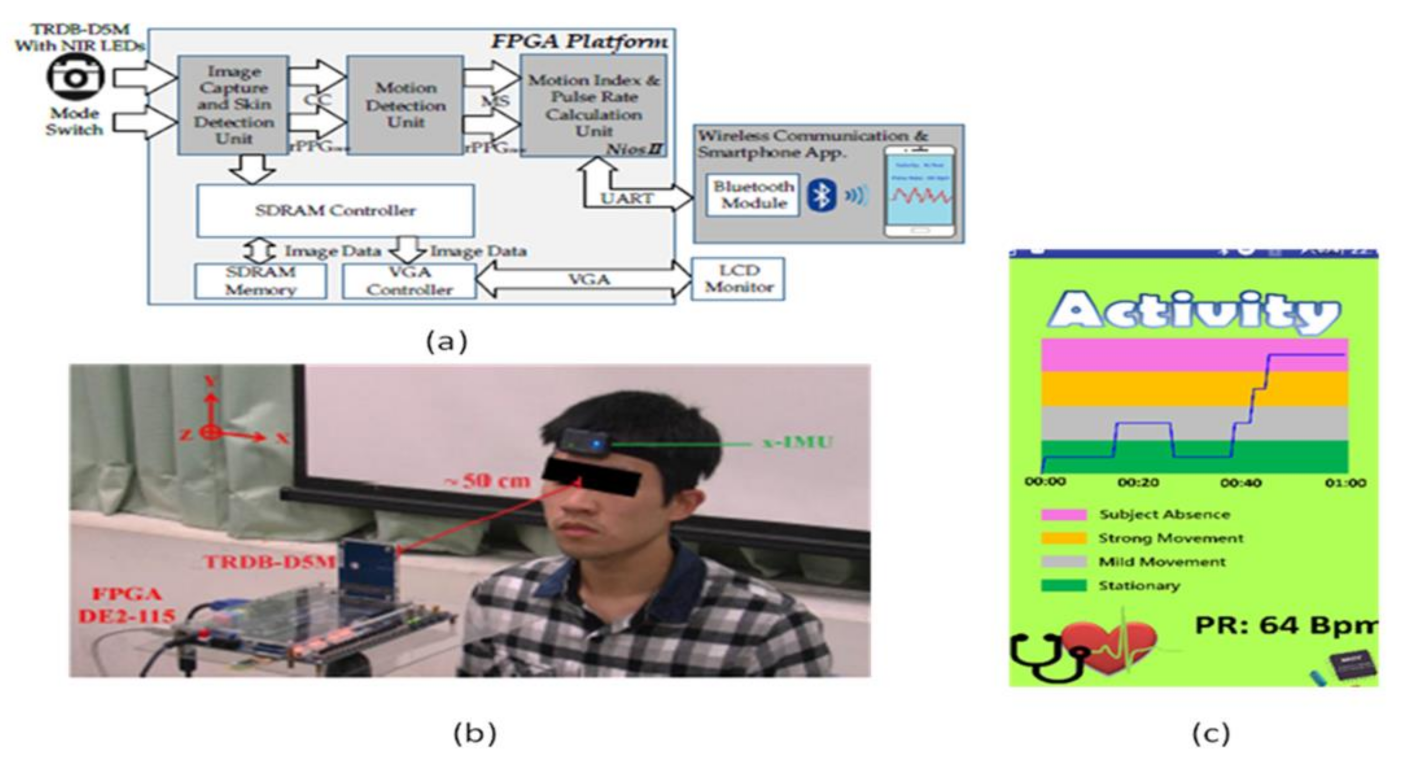
| 34 | 2017 | TRDB_D5M | 2.2 × 2.2 | 2592 × 1944 | 2.2 | 5.702 mm × 4.277 mm | N/A | 38.1 db | N/A | 70 fps | 70.1 db | N/A | Medical | Noncontact Heart rate detection [37] |
References
- Heart Disease Statistics 2021. Available online: https://www.singlecare.com/blog/news/heart-disease-statistics (accessed on 2 January 2021).
- Feigin, V.L.; Vos, T.; Alahdab, F.; Amit, A.M.L.; Bärnighausen, T.W.; Beghi, E.; Beheshti, M.; Chavan, P.P.; Criqui, M.H.; Desai, R. Burden of Neurological Disorders Across the US from 1990–2017: A Global Burden of Disease Study. JAMA Neurol. 2021, 78, 165–176. [Google Scholar]
- Facts and Statistics 2020—Leukemia and Lymphomia Society. Available online: https://www.lls.org/facts-and-statistics/facts-and-statistics-overview/facts-and-statistics (accessed on 5 January 2021).
- Statistics about Diabetes—American Diabetes Association. Available online: https://www.diabetes.org/resources/statistics/statistics-about-diabetes (accessed on 5 January 2021).
- National Statistics—Centers for Disease Control and Prevention. Available online: https://www.cdc.gov/arthritis/data_statistics/national-statistics.html (accessed on 23 December 2020).
- Skin Cancer Incidence Rates—American Academy of Dermatology Association. Available online: https://www.aad.org/media/stats-skin-cancer (accessed on 23 December 2020).
- Fast Facts of Common Eye Disorders—Centers for Disease Control and Prevention. Available online: https://www.cdc.gov/visionhealth/basics/ced/fastfacts.html (accessed on 29 December 2020).
- Digestive Diseases—Centers for Disease Control and Prevention. Available online: https://www.cdc.gov/nchs/fastats/digestive-diseases.html (accessed on 27 December 2020).
- Humbert, M.V.; Christodoulides, M. Atypical, yet not infrequent, infections with Neisseria species. Pathogens 2020, 9, 10. [Google Scholar] [CrossRef]
- Moher, D.; Liberati, A.; Tetzlaff, J.; Altman, D.G. Preferred reporting items for systematic reviews and meta-analyses: The PRISMA statement. Int. J. Surg. 2010, 8, 336–341. [Google Scholar] [CrossRef]
- Kim, D.-S.; Choi, J.-H.; Nam, M.-H.; Yang, J.-W.; Pak, J.J.; Seo, S. LED and CMOS image sensor based hemoglobin concentration measurement technique. Sens. Actuators B Chem. 2011, 157, 103–109. [Google Scholar] [CrossRef]
- Daivasagaya, D.S.; Yao, L.; Yung, K.Y.; Hajj-Hassan, M.; Cheung, M.C.; Chodavarapu, V.P.; Bright, F.V. Contact CMOS imaging of gaseous oxygen sensor array. Sens. Actuators B Chem. 2011, 157, 408–416. [Google Scholar] [CrossRef] [PubMed]
- Liu, X.; Huang, X.; Jiang, Y.; Xu, H.; Guo, J.; Hou, H.W.; Yan, M.; Yu, H. A Microfluidic Cytometer for Complete Blood Count With a 3.2-Megapixel, 1.1- μm-Pitch Super-Resolution Image Sensor in 65-nm BSI CMOS. IEEE Trans. Biomed. Circuits Syst. 2017, 11, 794–803. [Google Scholar] [CrossRef]
- Lu, C.H.; Shih, T.-S.; Shih, P.-C.; Pendharkar, G.P.; Liu, C.-H.; Chen, C.-K.; Hsu, L.; Chang, H.-Y.; Yang, C.-L. Finger-powered agglutination lab chip with CMOS image sensing for rapid point-of-care diagnosis applications. Lab Chip 2020, 20, 424–433. [Google Scholar] [CrossRef] [PubMed]
- Haruta, M.; Kitsumoto, C.; Sunaga, Y.; Takehara, H.; Noda, T.; Sasagawa, K.; Tokuda, T.; Ohta, J. An implantable CMOS device for blood-flow imaging during experiments on freely moving rats. Jpn. J. Appl. Phys. 2014, 53, 04EL05. [Google Scholar] [CrossRef]
- Tokuda, T.; Takahashi, M.; Uejima, K.; Masuda, K.; Kawamura, T.; Ohta, Y.; Motoyama, M.; Noda, T.; Sasagawa, K.; Okitsu, T.; et al. CMOS image sensor-based implantable glucose sensor using glucose-responsive fluorescent hydrogel. Biomed. Opt. Express 2014, 5, 3859–3870. [Google Scholar] [CrossRef] [PubMed]
- Devadhasan, J.P.; Kim, S. CMOS image sensor based HIV diagnosis: A smart system for point-of-care approach. BioChip J. 2013, 7, 258–266. [Google Scholar] [CrossRef]
- Devadhasan, J.P.; Oh, H.; Choi, C.S.; Kim, S. Whole blood glucose analysis based on smartphone camera module. J. Biomed. Opt. 2015, 20, 117001. [Google Scholar] [CrossRef] [PubMed]
- Hussain, I.; Das, M.; Ahamad, K.U.; Nath, P. Water salinity detection using a smartphone. Sens. Actuators B Chem. 2017, 239, 1042–1050. [Google Scholar] [CrossRef]
- Devadhasan, J.P.; Kim, D.; Lee, D.Y.; Kim, S. Smartphone coupled handheld array reader for real-time toxic gas detection. Anal. Chim. Acta 2017, 984, 168–176. [Google Scholar] [CrossRef]
- Lee, J.; Song, J.; Choi, J.-H.; Kim, S.; Kim, U.; Nguyen, V.-T.; Lee, J.-S.; Joo, C. A Portable Smartphone-linked Device for Direct, Rapid and Chemical-Free Hemoglobin Assay. Sci. Rep. 2020, 10, 1–10. [Google Scholar] [CrossRef]
- Zhu, H.; Sencan, I.; Wong, J.; Dimitrov, S.; Tseng, D.; Nagashima, K.; Ozcan, A. Cost-effective and rapid blood analysis on a cell-phone. Lab Chip 2013, 13, 1282–1288. [Google Scholar] [CrossRef]
- Tokuda, T.; Kimura, H.; Miyatani, T.; Maezawa, Y.; Kobayashi, T.; Noda, T.; Sasagawa, K.; Ohta, J. CMOS on-chip bio-imaging sensor with integrated micro light source array for optogenetics. Electron. Lett. 2012, 48, 312–314. [Google Scholar] [CrossRef]
- Ohta, J.; Kitsumoto, C.; Noda, T.; Sasagawa, K.; Tokuda, T.; Motoyama, M.; Ohta, Y.; Kobayashi, T.; Ishikawa, Y.; Shiosaka, S. A micro imaging device for measuring neural actvities in the mouse deep brain with minimal invasiveness. In Proceedings of the 2012 IEEE Biomedical Circuits and Systems Conference (BioCAS), Hsinchu, Taiwan, 28–30 November 2012; pp. 244–247. [Google Scholar]
- Sasagawa, K.; Ishii, Y.; Yokota, S.; Matsuda, T.; Davis, P.; Zhang, B.; Li, K.; Noda, T.; Tokuda, T.; Ohta, J. Implantable image sensor based on intra-brain image transmission. In Proceedings of the 2013 35th Annual International Conference of the IEEE Engineering in Medicine and Biology Society (EMBC), Osaka, Japan, 3–7 July 2013; pp. 1863–1866. [Google Scholar]
- Haruta, M.; Kamiyama, N.; Nakajima, S.; Motoyama, M.; Kawahara, M.; Ohta, Y.; Yamasaki, A.; Takehara, H.; Noda, T.; Sasagawa, K. Implantable optogenetic device with CMOS IC technology for simultaneous optical measurement and stimulation. Jpn. J. Appl. Phys. 2017, 56, 057001. [Google Scholar] [CrossRef]
- Angotzi, G.N.; Boi, F.; Lecomte, A.; Miele, E.; Malerba, M.; Zucca, S.; Casile, A.; Berdondini, L. SiNAPS: An implantable active pixel sensor CMOS-probe for simultaneous large-scale neural recordings. Biosens. Bioelectron. 2019, 126, 355–364. [Google Scholar] [CrossRef]
- Lee, Y.-N.; Kimura, Y.; Nakamura, Y.; Noda, T.; Takahashi, K.; Sawada, K. Insertable 256 × 256 ion image sensor for spatiotemporal pH recording. In Proceedings of the 2019 IEEE Biomedical Circuits and Systems Conference (BioCAS), Nara, Japan, 17–19 October 2019; pp. 1–4. [Google Scholar]
- Heymes, J.; Ammour, L.; Bautista, M.; Bertolone, G.; Dorokhov, A.; Fieux, S.; Gensolen, F.; Goffe, M.; Hu-Guo, C.; Kachel, M.; et al. Implantable CMOS pixel sensor for positron imaging in rat brain. Nucl. Instrum. Methods Phys. Res. Sect. A 2018, 911, 19–24. [Google Scholar] [CrossRef]
- Conti, E.; Placidi, P.; Biasini, M.; Bissi, L.; Calandra, A.; Checcucci, B.; Chiocchini, S.; Cicioni, R.; Di Lorenzo, R.; DiPilato, A.C.; et al. Use of a CMOS Image Sensor for an Active Personal Dosimeter in Interventional Radiology. IEEE Trans. Instrum. Meas. 2013, 62, 1065–1072. [Google Scholar] [CrossRef]
- Covi, D.; Cavallotti, C.; Vatteroni, M.; Clementel, L.; Valdastri, P.; Menciassi, A.; Dario, P.; Sartori, A. Miniaturized digital camera system for disposable endoscopic applications. Procedia Chem. 2009, 1, 1223–1226. [Google Scholar] [CrossRef]
- Turcza, P.; Duplaga, M. Hardware-Efficient Low-Power Image Processing System for Wireless Capsule Endoscopy. IEEE J. Biomed. Health Inform. 2013, 17, 1046–1056. [Google Scholar] [CrossRef] [PubMed]
- Wang, T.; Huang, X.; Yan, M.; Yu, H.; Yeo, K.S.; Cevik, I.; Ay, S. A 96 × 96 1 V ultra-low power CMOS image sensor for biomedical application. In Proceedings of the 2012 IEEE Asia Pacific Conference on Circuits and Systems, Kaohsiung, Taiwan, 2–5 December 2012; pp. 13–16. [Google Scholar]
- Park, K.; Song, M.; Kim, S.Y. The Design of a Single-Bit CMOS Image Sensor for Iris Recognition Applications. Sensors 2018, 18, 669. [Google Scholar] [CrossRef] [PubMed]
- Kang, H.; Abbasi, W.H.; Kim, S.-W.; Kim, J. Fully Integrated Light-Sensing Stimulator Design for Subretinal Implants. Sensors 2019, 19, 536. [Google Scholar] [CrossRef] [PubMed]
- Zhou, C.; Tao, C.; Chai, X.; Sun, Y.; Ren, Q. Implantable Imaging System for Visual Prosthesis. Artif. Organs 2010, 34, 518–522. [Google Scholar] [CrossRef] [PubMed]
- Lin, Y.-C.; Chou, N.-K.; Lin, G.-Y.; Li, M.-H.; Lin, Y.-H. A Real-Time Contactless Pulse Rate and Motion Status Monitoring System Based on Complexion Tracking. Sensors 2017, 17, 1490. [Google Scholar] [CrossRef]
- McRae, M.P.; Simmons, G.W.; Christodoulides, N.J.; Lu, Z.; Kang, S.K.; Fenyo, D.; Alcorn, T.; Dapkins, I.P.; Sharif, I.; Vurmaz, D.; et al. Clinical decision support tool and rapid point-of-care platform for determining disease severity in patients with COVID-19. Lab Chip 2020, 20, 2075–2085. [Google Scholar] [CrossRef]
- Song, Y.; Ye, Y.; Su, S.-H.; Stephens, A.; Cai, T.; Chung, M.-T.; Han, M.K.; Newstead, M.W.; Yessayan, L.; Frame, D.; et al. A digital protein microarray for COVID-19 cytokine storm monitoring. Lab Chip 2021, 21, 331–343. [Google Scholar] [CrossRef]
- Shao, S.; Zhou, D.; He, R.; Li, J.; Zou, S.; Mallery, K.; Kumar, S.; Yang, S.; Hong, J. Risk assessment of airborne transmission of COVID-19 by asymptomatic individuals under different practical settings. J. Aerosol Sci. 2021, 151, 105661. [Google Scholar] [CrossRef]
- Ning, B.; Yu, T.; Zhang, S.; Huang, Z.; Tian, D.; Lin, Z.; Niu, A.; Golden, N.; Hensley, K.; Threeton, B.; et al. A smartphone-read ultrasensitive and quantitative saliva test for COVID-19. Sci. Adv. 2021, 7, eabe3703. [Google Scholar] [CrossRef]
- Hussain, S.M.; Farrukh, F.U.D.; Su, S.; Wang, Z.; Chen, H. CMOS Image Sensor Design and Image Processing Algorithm Implementation for Total Hip Arthroplasty Surgery. IEEE Trans. Biomed. Circuits Syst. 2019, 13, 1383–1392. [Google Scholar] [CrossRef]
- Xiang, S.; Bie, Z.; Jiang, H.; Wang, Z.; Jia, W. A wireless image acquisition system for artificial knee implant surgeries. In Proceedings of the 2016 IEEE 59th International Midwest Symposium on Circuits and Systems (MWSCAS), Abu Dhabi, United Arab Emirates, 16–19 October 2016; pp. 1–4. [Google Scholar]
- Kwak, Y.H.; Lee, J.; Lee, J.; Kwak, S.H.; Oh, S.; Paek, S.-H.; Ha, U.-H.; Seo, S. A simple and low-cost biofilm quantification method using LED and CMOS image sensor. J. Microbiol. Methods 2014, 107, 150–156. [Google Scholar] [CrossRef]
- Zheng, G.; Lee, S.A.; Antebi, Y.; Elowitz, M.B.; Yang, C. The ePetri dish, an on-chip cell imaging platform based on subpixel perspective sweeping microscopy (SPSM). Proc. Natl. Acad. Sci. USA 2011, 108, 16889–16894. [Google Scholar] [CrossRef] [PubMed]
- Esposito, M.; Anaxagoras, T.; Fant, A.; Wells, K.; Konstantinidis, A.; Osmond, J.P.F.; Evans, P.M.; Speller, R.D.; Allinson, N.M. DynAMITe: A wafer scale sensor for biomedical applications. J. Instrum. 2011, 6, C12064. [Google Scholar] [CrossRef]
- Wang, T.; Huang, X.; Jia, Q.; Yan, M.; Yu, H.; Yeo, K.S. A super-resolution CMOS image sensor for bio-microfluidic imaging. In Proceedings of the 2012 IEEE Biomedical Circuits and Systems Conference (BioCAS), Hsinchu, Taiwan, 28–30 November 2012; pp. 388–391. [Google Scholar]
- Lee, J.; Kwak, Y.H.; Paek, S.-H.; Han, S.; Seo, S. CMOS image sensor-based ELISA detector using lens-free shadow imaging platform. Sens. Actuators B Chem. 2014, 196, 511–517. [Google Scholar] [CrossRef]
- Seo, M.-W.; Shirakawa, Y.; Masuda, Y.; Kawata, Y.; Kagawa, K.; Yasutomi, K.; Kawahito, S. 4.3 A programmable sub-nanosecond time-gated 4-tap lock-in pixel CMOS image sensor for real-time fluorescence lifetime imaging microscopy. In Proceedings of the 2017 IEEE International Solid-State Circuits Conference (ISSCC), San Francisco, CA, USA, 5–9 February 2017; pp. 70–71. [Google Scholar]
- Feng, R.; Gruebele, M.; Davis, C.M. Quantifying protein dynamics and stability in a living organism. Nat. Commun. 2019, 10, 1179. [Google Scholar] [CrossRef]
- Wu, T.-F.; Yen, T.M.; Han, Y.; Chiu, Y.-J.; Lin, E.Y.-S.; Lo, Y.-H. A light-sheet microscope compatible with mobile devices for label-free intracellular imaging and biosensing. Lab Chip 2014, 14, 3341–3348. [Google Scholar] [CrossRef]
- Roda, A.; Michelini, E.; Cevenini, L.; Calabria, D.; Calabretta, M.M.; Simoni, P. Integrating Biochemiluminescence Detection on Smartphones: Mobile Chemistry Platform for Point-of-Need Analysis. Anal. Chem. 2014, 86, 7299–7304. [Google Scholar] [CrossRef]
- Haefeli, M.; Elfering, A. Pain assessment. Eur. Spine J. 2006, 15, S17–S24. [Google Scholar] [CrossRef]
- Sukhavasi, S.B.; Sukhavasi, S.B.; Elleithy, K.; Abuzneid, S.; Elleithy, A. CMOS Image Sensors in Surveillance System Applications. Sensors 2021, 21, 488. [Google Scholar] [CrossRef]


| Description | |
|---|---|
| Disease diagnosis | Default value 10.0 is assigned to every system that helps diagnose diseases like anemia, arthritis, brain disorders, etc., related to the human body. |
| Testing method | Every system needs to follow one of the testing methods such as in vivo, in vitro, or both to perform disease diagnosis. |
| Remote sensing | Remote sensing of a system allows doctors to monitor patients’ health status by accessing information timely about their health status or their vital signs without the need for physical presence. |
| Analysis type | The system that is physically implemented or embedded in an application involved in disease diagnosis is considered real time. The system that involves the only simulation cannot be considered real time. |
| Pain level | The pain scale helps doctors decide accurate diagnosis and treatment plans to select medical devices for disease diagnosis. |
| System | Related To | Helps in Disease Diagnosis | Score | Testing Method | Score | Remote Sensing | Score | Real Time or Not Real Time | Score | Pain Level | Pain Scale | Total Score |
|---|---|---|---|---|---|---|---|---|---|---|---|---|
| Hemoglobin measurement [11] | Blood | Anemia | 10 | In vitro | 6 | No | 5 | Yes | 10 | Severe | 7 | 78 |
| Oxygen detection in blood [12] | Blood | Diabetes mellitus | 10 | In vitro | 6 | No | 5 | Yes | 10 | Moderate | 6 | 76 |
| Microfluidic cytometer [13] | Blood | Cardiovascular diseases | 10 | In vitro | 6 | No | 5 | Yes | 10 | Moderate | 6 | 76 |
| Finger powered agglutination lab chip [14] | Blood | Bacterial infection | 10 | In vitro | 6 | No | 5 | Yes | 10 | Moderate | 5 | 74 |
| Blood flow velocity detection [15] | Blood | Peripheral artery disease | 10 | In vivo | 8 | No | 5 | Yes | 10 | Severe | 9 | 86 |
| Glucose sensing [16] | Blood | Diabetes mellitus | 10 | both | 10 | Yes | 10 | Yes | 10 | Moderate | 5 | 92 |
| HIV diagnosis [17] | Blood | HIV | 10 | In vitro | 6 | Yes | 10 | Yes | 10 | Severe | 7 | 88 |
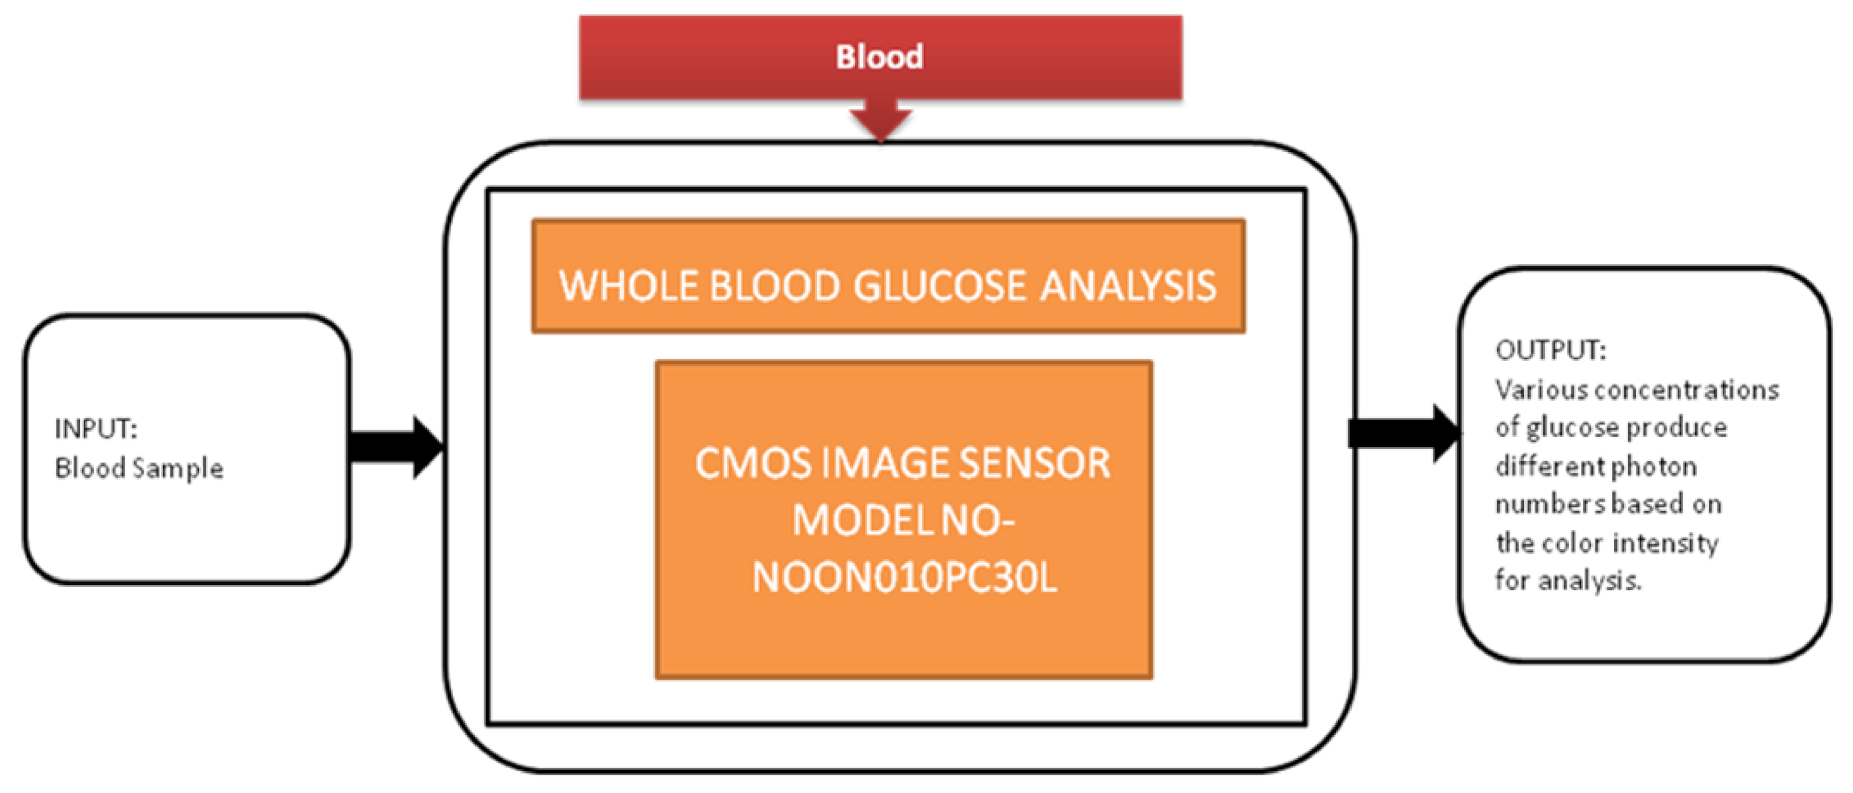
| Whole blood glucose analysis [18] | Blood | Diabetes mellitus | 10 | In vitro | 6 | No | 5 | Yes | 10 | Severe | 7 | 78 |
| Water salinity detection [19] | Blood | Diabetes mellitus | 10 | In vitro | 6 | Yes | 10 | Yes | 10 | None | 0 | 74 |
| Real-time toxic gas detection [20] | Blood | Leukemia | 10 | In vitro | 6 | Yes | 10 | Yes | 10 | Moderate | 5 | 84 |
| Portable chemical-free hemoglobin assay [21] | Blood | Anemia | 10 | In vitro | 6 | Yes | 10 | Yes | 10 | Moderate | 6 | 86 |
| Blood analysis [22] | Blood | Anemia | 10 | In vitro | 6 | Yes | 10 | Yes | 10 | Moderate | 6 | 86 |
| On-chip bioimaging [23] | Brain | Brain disorders | 10 | both | 10 | No | 5 | Yes | 10 | Severe | 9 | 90 |
| Neural activities measurement [24] | Brain | Brain disorders | 10 | In vivo | 8 | No | 5 | Yes | 10 | Severe | 8 | 84 |
| Intra brain image transmission [25] | Brain | Brain disorders | 10 | In vivo | 8 | Yes | 10 | Yes | 10 | Severe | 9 | 96 |
| Optogenetic device [26] | Brain | Brain disorders | 10 | In vivo | 8 | No | 5 | Yes | 10 | Severe | 10 | 88 |
| SiNAPS [27] | Brain | Brain disorders | 10 | In vivo | 8 | No | 5 | Yes | 10 | Severe | 9 | 86 |
| pH recording [28] | Brain | Brain disorders | 10 | In vitro | 6 | No | 5 | Yes | 10 | Severe | 7 | 78 |
| Positron imaging [29] | Brain | Brain disorders | 10 | In vivo | 8 | Yes | 10 | Yes | 10 | Severe | 9 | 96 |
| Active personal dosimeter [30] | Skin | Skin cancer | 10 | N/A | 0 | Yes | 10 | Yes | 10 | Mild | 1 | 64 |
| Disposable endoscopic application [31] | Intestines | GI tract diseases | 10 | In vivo | 8 | No | 5 | Yes | 10 | Severe | 8 | 84 |
| Wireless capsule endoscopy [32] | Intestines | GI tract diseases | 10 | In vivo | 8 | Yes | 10 | Yes | 10 | Severe | 8 | 94 |
| Endomicroscopic application [33] | Intestines | GI tract diseases | 10 | In vivo | 8 | No | 5 | No | 5 | Severe | 8 | 74 |
| IRIS application [34] | Eyes | N/A | 0 | N/A | 0 | Yes | 10 | No | 5 | None | 0 | 32 |
| Subretinal Implanted chip [35] | Eyes | Retinal diseases | 10 | Ex vivo | 6 | No | 5 | Yes | 10 | Severe | 10 | 84 |
| Visual Prosthesis [36] | Eyes | Retinal diseases | 10 | In vivo | 8 | No | 5 | Yes | 10 | Severe | 10 | 88 |
| Contactless pulse rate detection [37] | Heart | Shortness of breath | 10 | N/A | 0 | Yes | 10 | Yes | 10 | None | 0 | 62 |
| COVID-19 severity detection [38] | Lungs | COVID-19 | 10 | In vitro | 6 | No | 5 | Yes | 10 | Severe | 7 | 78 |
| COVID-19 Cytokine storm monitoring [39] | Lungs | COVID-19 | 10 | In vitro | 6 | No | 5 | Yes | 10 | Severe | 7 | 78 |
| COVID-19 risk assessment [40] | Lungs | COVID-19 | 10 | In vitro | 6 | No | 5 | Yes | 10 | None | 0 | 64 |
| COVID-19 Saliva test [41] | Lungs | COVID-19 | 10 | In vitro | 6 | No | 5 | Yes | 10 | None | 0 | 64 |
| Pose estimation platform for total hip arthroplasty [42] | Bones | Arthritis | 10 | In vivo | 8 | Yes | 10 | Yes | 10 | Severe | 9 | 96 |
| Knee Implants [43] | Bones | Arthritis | 10 | In vivo | 8 | Yes | 10 | Yes | 10 | Severe | 9 | 96 |
| Biofilm detection [44] | Bacteria Cells | GI tract diseases | 10 | In vivo | 8 | No | 5 | Yes | 10 | Severe | 8 | 84 |
| ePetri dish [45] | Bacteria Cells | Tissue damage | 10 | In vitro | 6 | Yes | 10 | Yes | 10 | Severe | 7 | 88 |
| DynAMITE [46] | Bacteria Cells | Breast cancer | 10 | N/A | 0 | No | 5 | Yes | 10 | Severe | 9 | 70 |
| Biomicrofluidic imaging [47] | Bacteria Cells | Cancer | 10 | In vitro | 6 | No | 5 | Yes | 10 | Severe | 8 | 80 |
| ELISA detector [48] | Bacteria Cells | Listeriosis | 10 | In vitro | 6 | No | 5 | Yes | 10 | Severe | 7 | 78 |
| FLIM [49] | Bacteria Cells | Hepatitis | 10 | In vitro | 6 | No | 5 | Yes | 10 | Severe | 7 | 78 |
| Quantifying protein dynamics [50] | Bacteria Cells | Cancer | 10 | both | 10 | No | 5 | Yes | 10 | Severe | 9 | 90 |
| Intracellular imaging and biosensing [51] | Bacteria Cells | Cancer | 10 | In vitro | 6 | No | 5 | Yes | 10 | Severe | 7 | 78 |
| Biochemiluminescence detection [52] | Bacteria Cells | Cholestatic liver disease | 10 | In vitro | 6 | No | 5 | Yes | 10 | Severe | 7 | 78 |
| CMOS Technology/Image Sensor Model/Camera Module | Bacteria Cells | Blood | Bones | Brain | Eyes | Heart | Intestines | Lungs | Skin | Grand Total |
|---|---|---|---|---|---|---|---|---|---|---|
| 65 nm BSI CMOS | 1 | 1 | ||||||||
| 0.11 µm | 1 | 1 | ||||||||
| 0.15 µm | 1 | 1 | ||||||||
| 0.18 µm | 2 | 1 | 1 | 2 | 1 | 1 | 8 | |||
| 0.35 µm | 2 | 4 | 1 | 7 | ||||||
| Apple iPhone Smartphone | 1 | 1 | ||||||||
| Apple iPhone 5s Smartphone | 1 | 1 | ||||||||
| Grasshopper 3 camera with Sony IMX174 | 1 | 1 | ||||||||
| LT225 | 1 | 1 | ||||||||
| MT9P031 | 3 | 1 | 4 | |||||||
| Not mentioned | 1 | 2 | 1 | 4 | ||||||
| NAC Memrecam HX-5 | 1 | 1 | ||||||||
| NOON010PC30L | 2 | 2 | ||||||||
| OV7680 | 1 | 1 | ||||||||
| OV8833 | 1 | 1 | ||||||||
| Samsung Galaxy S8 Smartphone | 1 | 1 | ||||||||
| Samsung Galaxy SII Smartphone | 1 | 1 | ||||||||
| Samsung S4 Smartphone | 1 | 1 | ||||||||
| Samsung Galaxy S9 Smartphone | 1 | 1 | ||||||||
| Sony Xperia E3 Smartphone | 1 | 1 | ||||||||
| SONY α6100 | 1 | 1 | ||||||||
| TRDB_D5M | 1 | 1 | ||||||||
| Grand Total | 9 | 12 | 2 | 7 | 3 | 1 | 3 | 4 | 1 | 42 |
Publisher’s Note: MDPI stays neutral with regard to jurisdictional claims in published maps and institutional affiliations. |
© 2021 by the authors. Licensee MDPI, Basel, Switzerland. This article is an open access article distributed under the terms and conditions of the Creative Commons Attribution (CC BY) license (http://creativecommons.org/licenses/by/4.0/).
Share and Cite
Sukhavasi, S.B.; Sukhavasi, S.B.; Elleithy, K.; Abuzneid, S.; Elleithy, A. Human Body-Related Disease Diagnosis Systems Using CMOS Image Sensors: A Systematic Review. Sensors 2021, 21, 2098. https://doi.org/10.3390/s21062098
Sukhavasi SB, Sukhavasi SB, Elleithy K, Abuzneid S, Elleithy A. Human Body-Related Disease Diagnosis Systems Using CMOS Image Sensors: A Systematic Review. Sensors. 2021; 21(6):2098. https://doi.org/10.3390/s21062098
Chicago/Turabian StyleSukhavasi, Suparshya Babu, Susrutha Babu Sukhavasi, Khaled Elleithy, Shakour Abuzneid, and Abdelrahman Elleithy. 2021. "Human Body-Related Disease Diagnosis Systems Using CMOS Image Sensors: A Systematic Review" Sensors 21, no. 6: 2098. https://doi.org/10.3390/s21062098
APA StyleSukhavasi, S. B., Sukhavasi, S. B., Elleithy, K., Abuzneid, S., & Elleithy, A. (2021). Human Body-Related Disease Diagnosis Systems Using CMOS Image Sensors: A Systematic Review. Sensors, 21(6), 2098. https://doi.org/10.3390/s21062098