
Quantifying Step Count and Oxygen Consumption with Portable Technology during the 2-Min Walk Test in People with Lower Limb Amputation


Abstract
1. Introduction
2. Materials and Methods
2.1. Participants
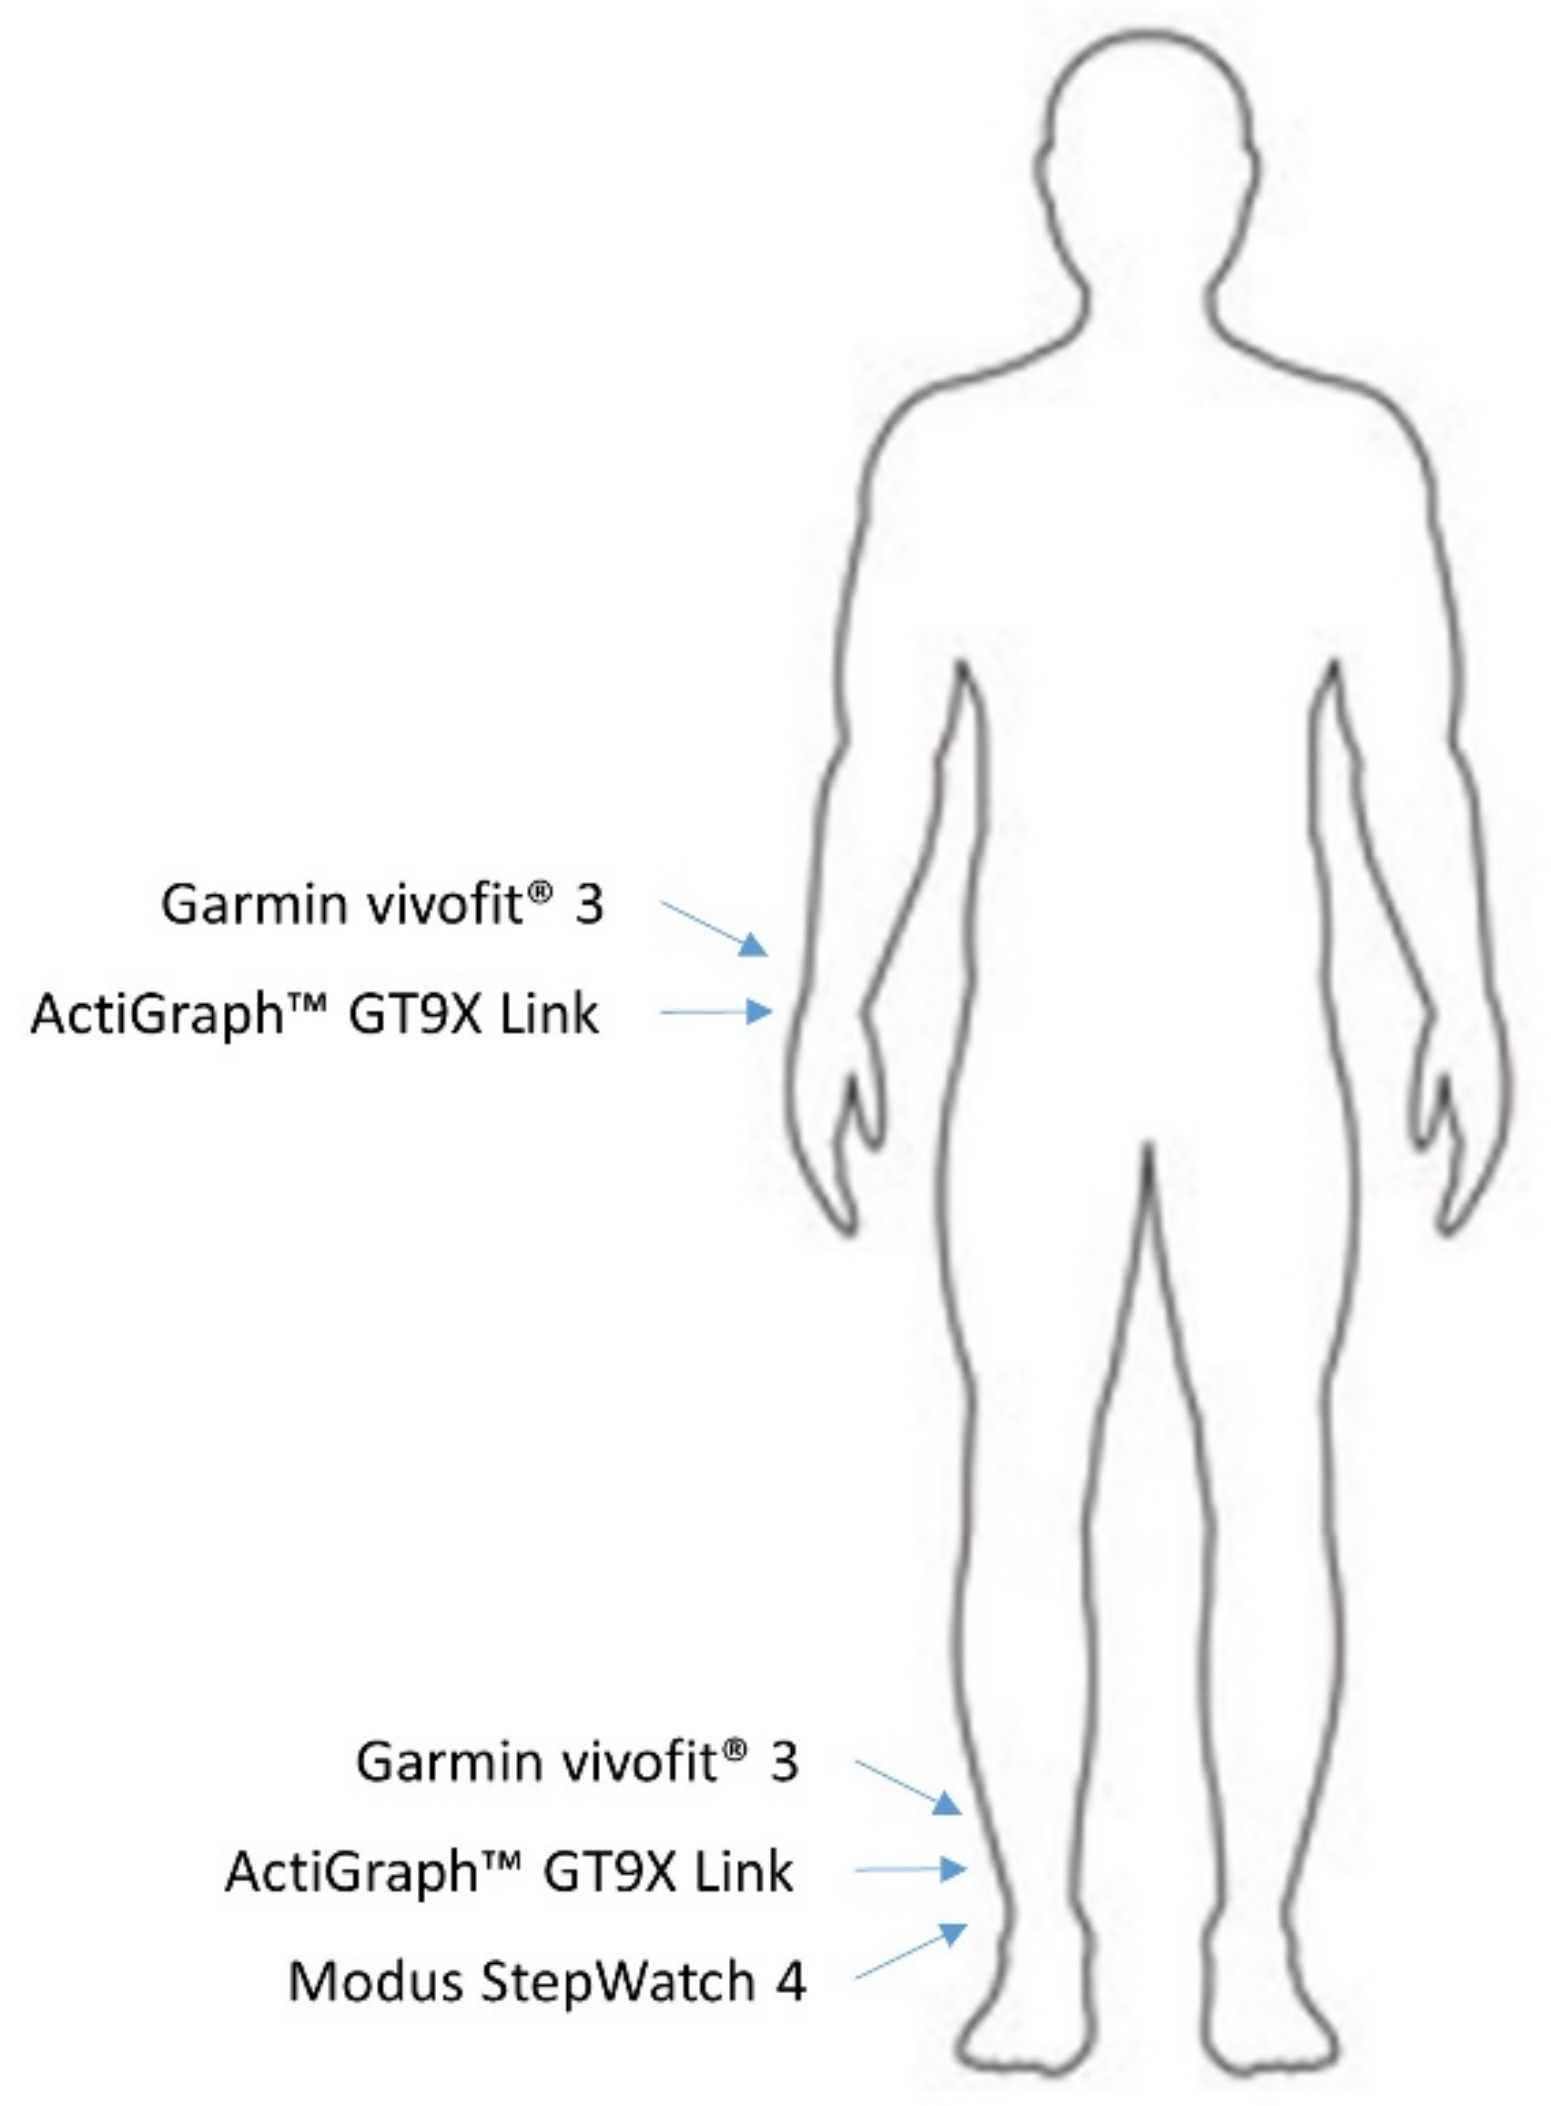
2.2. Activity Monitor Placement
2.3. Metabolic Analyzer
2.4. Two-Minute Walk Test
2.5. Statistical Analysis
3. Results
3.1. Step Count and Metabolic Variables
3.2. Activity Monitors
4. Discussion
Limitations
5. Conclusions
Author Contributions
Funding
Institutional Review Board Statement
Informed Consent Statement
Acknowledgments
Conflicts of Interest
References
- Ziegler-Graham, K.; MacKenzie, E.J.; Ephraim, P.L.; Travison, T.G.; Brookmeyer, R. Estimating the Prevalence of Limb Loss in the United States: 2005 to 2050. Arch. Phys. Med. Rehabil. 2008, 89, 422–429. [Google Scholar] [CrossRef]
- Fortington, L.; Geertzen, J.; van Netten, J.; Postema, K.; Rommers, G.; Dijkstra, P. Short and Long Term Mortality Rates after a Lower Limb Amputation. Eur. J. Vasc. Endovasc. Surg. 2013, 46, 124–131. [Google Scholar] [CrossRef]
- Rowe, V.L.; Lee, W.; Weaver, F.A.; Etzioni, D. Patterns of treatment for peripheral arterial disease in the United States: 1996–2005. J. Vasc. Surg. 2009, 49, 910–917. [Google Scholar] [CrossRef] [PubMed]
- Narres, M.; Kvitkina, T.; Claessen, H.; Droste, S.; Schuster, B.; Morbach, S.; Rümenapf, G.; Van Acker, K.; Icks, A. Incidence of lower extremity amputations in the diabetic compared with the non-diabetic population: A systematic review. PLoS ONE 2017, 12, e0182081. [Google Scholar] [CrossRef] [PubMed]
- Pollmanns, J.; Weyermann, M.; Geraedts, M.; Drösler, S.E. Krankenhausfälle und Amputationen bei Diabetes mellitus-Zeitreihen und Unterschiede auf kleinräumiger Ebene in Deutschland. Bundesgesundheitsblatt Gesundh. Gesundh. 2018, 61, 1462–1471. [Google Scholar] [CrossRef] [PubMed]
- Kurowski, J.R.; Nedkoff, L.; Schoen, D.E.; Knuiman, M.; Norman, P.E.; Briffa, T.G. Temporal trends in initial and recurrent lower extremity amputations in people with and without diabetes in Western Australia from 2000 to 2010. Diabetes Res. Clin. Pract. 2015, 108, 280–287. [Google Scholar] [CrossRef]
- Van Netten, J.J.; Sacco, I.C.; Lavery, L.A.; Monteiro-Soares, M.; Rasmussen, A.; Raspovic, A.; Bus, S.A. Treatment of modifiable risk factors for foot ulceration in persons with diabetes: A systematic review. Diabetes/Metab. Res. Rev. 2020, 36, e3271. [Google Scholar] [CrossRef]
- Thorud, J.C.; Plemmons, B.; Buckley, C.J.; Shibuya, N.; Jupiter, D.C. Mortality After Nontraumatic Major Amputation Among Patients with Diabetes and Peripheral Vascular Disease: A Systematic Review. J. Foot Ankle Surg. 2016, 55, 591–599. [Google Scholar] [CrossRef]
- Claessen, H.; Avalosse, H.; Van Hul, C.; Doggen, K.; Dumont, I.; Felix, P.; Van Acker, K.; Icks, A.; Guillaume, J.; Narres, M.; et al. Decreasing rates of major lower-extremity amputation in people with diabetes but not in those without: A nationwide study in Belgium. Diabetologia 2018, 61, 1966–1977. [Google Scholar] [CrossRef]
- Webster, J.B.; Hakimi, K.N.; Williams, R.M.; Turner, A.P.; Norvell, D.C.; Czerniecki, J.M. Prosthetic fitting, use, and satisfaction following lower-limb amputation: A prospective study. J. Rehabil. Res. Dev. 2012, 49, 1493. [Google Scholar] [CrossRef]
- Pell, J.; Donnan, P.; Fowkes, F.; Ruckley, C. Quality of life following lower limb amputation for peripheral arterial disease. Eur. J. Vasc. Surg. 1993, 7, 448–451. [Google Scholar] [CrossRef]
- Davie-Smith, F.; Paul, L.; Nicholls, N.; Stuart, W.P.; Kennon, B. The impact of gender, level of amputation and diabetes on prosthetic fit rates following major lower extremity amputation. Prosthet. Orthot. Int. 2017, 41, 19–25. [Google Scholar] [CrossRef]
- Wurdeman, S.R.; Stevens, P.M.; Campbell, J.H. Mobility Analysis of AmpuTees (MAAT I). Prosthet. Orthot. Int. 2018, 42, 498–503. [Google Scholar] [CrossRef]
- Migaou, H.; Kalai, A.; Hassine, Y.H.; Jellad, A.; Boudokhane, S.; Frih, Z.B.S. Quality of Life Associated Factors in a North African Sample of Lower Limbs Amputees. Ann. Rehabil. Med. 2019, 43, 321–327. [Google Scholar] [CrossRef]
- Boutwell, E.; Stine, R.; Hansen, A.; Tucker, K.; Gard, S. Effect of prosthetic gel liner thickness on gait biomechanics and pressure distribution within the transtibial socket. J. Rehabil. Res. Dev. 2012, 49, 227–240. [Google Scholar] [CrossRef]
- Klute, G.K.; Glaister, B.C.; Berge, J.S. Prosthetic liners for lower limb amputees: A review of the literature. Prosthet. Orthot. Int. 2010, 34, 146–153. [Google Scholar] [CrossRef] [PubMed]
- Miyata, Y.; Sasaki, K.; Guerra, G.; Rattanakoch, J. Sustainable, affordable and functional: Reimagining prosthetic liners in resource limited environments. Disabil. Rehabil. 2020, 1–7. [Google Scholar] [CrossRef] [PubMed]
- Alley, R.D.; Williams, T.W., III; Albuquerque, M.J.; Altobelli, D.E. Prosthetic sockets stabilized by alternating areas of tissue compression and release. J. Rehabil. Res. Dev. 2011, 48, 679–696. [Google Scholar] [CrossRef] [PubMed]
- Paterno, L.; Ibrahimi, M.; Gruppioni, E.; Menciassi, A.; Ricotti, L. Sockets for Limb Prostheses: A Review of Existing Technologies and Open Challenges. IEEE Trans. Biomed. Eng. 2018, 65, 1996–2010. [Google Scholar] [CrossRef]
- Fatone, S.; Caldwell, R. Northwestern University Flexible Subischial Vacuum Socket for persons with transfemoral amputation—Part 1. Prosthet. Orthot. Int. 2017, 41, 237–245. [Google Scholar] [CrossRef] [PubMed]
- Ali, S.; Abu Osman, N.A.; Arifin, N.; Gholizadeh, H.; Razak, N.A.A.; Abas, W.A.B.W. Comparative Study between Dermo, Pelite, and Seal-In X5 Liners: Effect on Patient’s Satisfaction and Perceived Problems. Sci. World J. 2014, 2014, 1–8. [Google Scholar] [CrossRef]
- Gholizadeh, H.; Lemaire, E.; Eshraghi, A. The evidence-base for elevated vacuum in lower limb prosthetics: Literature review and professional feedback. Clin. Biomech. 2016, 37, 108–116. [Google Scholar] [CrossRef] [PubMed]
- Laschowski, B.; Andrysek, J. Electromechanical Design of Robotic Transfemoral Prostheses. In Proceedings of the ASME 2018 International Design Engineering Technical Conferences and Computers and Information in Engineering Conference, Quebec City, QC, Canada, 2 November 2018; p. 5. [Google Scholar]
- Endo, K.; Swart, E.; Herr, H. An artificial gastrocnemius for a transtibial prosthesis. In Proceedings of the 2009 Annual International Conference of the IEEE Engineering in Medicine and Biology Society, Minneapolis, MN, USA, 2–6 September 2009; pp. 5034–5037. [Google Scholar] [CrossRef]
- Montgomery, J.R.; Grabowski, A.M. Use of a powered ankle–foot prosthesis reduces the metabolic cost of uphill walking and improves leg work symmetry in people with transtibial amputations. J. R. Soc. Interface 2018, 15, 20180442. [Google Scholar] [CrossRef] [PubMed]
- Gaunaurd, I.; Spaulding, S.E.; Amtmann, D.; Salem, R.; Gailey, R.; Morgan, S.J.; Hafner, B.J. Use of and confidence in administering outcome measures among clinical prosthetists. Prosthet. Orthot. Int. 2015, 39, 314–321. [Google Scholar] [CrossRef]
- Smith, J.D.; Guerra, G.; Burkholder, B.G. The validity and accuracy of wrist-worn activity monitors in lower-limb prosthesis users. Disabil. Rehabil. 2019, 42, 3182–3188. [Google Scholar] [CrossRef]
- Van Velzen, J.M.; Van Bennekom, C.A.M.; Polomski, W.; Slootman, J.R.; Van Der Woude, L.H.V.; Houdijk, H. Physical capacity and walking ability after lower limb amputation: A systematic review. Clin. Rehabil. 2006, 20, 999–1016. [Google Scholar] [CrossRef] [PubMed]
- Brooks, D.; Parsons, J.; Hunter, J.P.; Devlin, M.; Walker, J. The 2-minute walk test as a measure of functional improvement in persons with lower limb amputation. Arch. Phys. Med. Rehabil. 2001, 82, 1478–1483. [Google Scholar] [CrossRef] [PubMed]
- Resnik, L.; Borgia, M. Reliability of Outcome Measures for People with Lower-Limb Amputations: Distinguishing True Change from Statistical Error. Phys. Ther. 2011, 91, 555–565. [Google Scholar] [CrossRef] [PubMed]
- Paul, S.S.; Tiedemann, A.; Hassett, L.M.; Ramsay, E.; Kirkham, C.; Chagpar, S.; Sherrington, C. Validity of the Fitbitactivity tracker for measuring steps in community-dwelling older adults. BMJ Open Sport Exerc. Med. 2015, 1, e000013. [Google Scholar] [CrossRef] [PubMed]
- Fulk, G.D.; Combs, S.A.; Danks, K.A.; Nirider, C.D.; Raja, B.; Reisman, D.S. Accuracy of 2 Activity Monitors in Detecting Steps in People with Stroke and Traumatic Brain Injury. Phys. Ther. 2014, 94, 222–229. [Google Scholar] [CrossRef]
- Briseno, G.G.; Smith, J.D. Pedometer Accuracy in Persons Using Lower-Limb Prostheses. JPO J. Prosthet. Orthot. 2014, 26, 87–92. [Google Scholar] [CrossRef]
- Halsne, E.G.; Waddingham, M.G.; Hafner, B.J. Long-term activity in and among persons with transfemoral amputation. J. Rehabil. Res. Dev. 2013, 50, 515–530. [Google Scholar] [CrossRef]
- Chadwell, A.; Diment, L.; Micó-Amigo, M.; Ramírez, D.Z.M.; Dickinson, A.; Granat, M.; Kenney, L.; Kheng, S.; Sobuh, M.; Ssekitoleko, R.; et al. Technology for monitoring everyday prosthesis use: A systematic review. J. Neuroeng. Rehabil. 2020, 17, 1–26. [Google Scholar] [CrossRef]
- Ladlow, P.; Nightingale, T.E.; McGuigan, M.P.; Bennett, A.N.; Phillip, R.; Bilzon, J.L.J. Impact of anatomical placement of an accelerometer on prediction of physical activity energy expenditure in lower-limb amputees. PLoS ONE 2017, 12, e0185731. [Google Scholar] [CrossRef]
- Sears, T.; Avalos, E.; Lawson, S.; McAlister, I. Wrist-Worn Physical Activity Trackers Tend to Underestimate Steps During Walking. Int. J. Exerc. Sci. 2017, 10, 764–773. [Google Scholar]
- Reid, L.; Thomson, P.; Besemann, M.; Dudek, N. Going places: Does the two-minute walk test predict the six-minute walk test in lower extremity amputees? J. Rehabil. Med. 2015, 47, 256–261. [Google Scholar] [CrossRef]
- Węgrzynowska-Teodorczyk, K.; Mozdzanowska, D.; Josiak, K.; Siennicka, A.; Nowakowska, K.; Banasiak, W.; Jankowska, E.A.; Ponikowski, P.; Woźniewski, M. Could the two-minute step test be an alternative to the six-minute walk test for patients with systolic heart failure? Eur. J. Prev. Cardiol. 2016, 23, 1307–1313. [Google Scholar] [CrossRef]
- Gremeaux, V.; Damak, S.; Troisgros, O.; Feki, A.; Laroche, D.; Perennou, D.; Benaim, C.; Casillas, J.-M. Selecting a test for the clinical assessment of balance and walking capacity at the definitive fitting state after unilateral amputation. Prosthet. Orthot. Int. 2012, 36, 415–422. [Google Scholar] [CrossRef] [PubMed]
- Gaunaurd, I.; Kristal, A.; Horn, A.; Krueger, C.; Muro, O.; Rosenberg, A.; Gruben, K.; Kirk-Sanchez, N.; Pasquina, P.; Gailey, R. The Utility of the 2-Minute Walk Test as a Measure of Mobility in People with Lower Limb Amputation. Arch. Phys. Med. Rehabil. 2020, 101, 1183–1189. [Google Scholar] [CrossRef]
- Gibbons, W.J.; Fruchter, N.; Sloan, S.; Levy, R.D. Reference Values for a Multiple Repetition 6-Minute Walk Test in Healthy Adults Older than 20 Years. J. Cardiopulm. Rehabil. 2001, 21, 87–93. [Google Scholar] [CrossRef] [PubMed]
- Burr, J.F.; Bredin, S.S.D.; Faktor, M.D.; Warburton, D.E.R. The 6-Minute Walk Test as a Predictor of Objectively Measured Aerobic Fitness in Healthy Working-Aged Adults. Phys. Sportsmed. 2011, 39, 133–139. [Google Scholar] [CrossRef] [PubMed]
- Mänttäri, A.; Suni, J.; Sievänen, H.; Husu, P.; Vähä-Ypyä, H.; Valkeinen, H.; Tokola, K.; Vasankari, T. Six-minute walk test: A tool for predicting maximal aerobic power (VO2 max) in healthy adults. Clin. Physiol. Funct. Imaging 2018, 38, 1038–1045. [Google Scholar] [CrossRef]
- Raso, V.; Matsudo, S.M.M.; De Santana, M.G.; Boscolo, R.A.; Viana, V.A.R.; Grassmann, V.; Tufik, S.; De Mello, M.T. Exercise and non-exercise aerobic power prediction models using six-minute walk test. Med. Express 2016, 3. [Google Scholar] [CrossRef]
- Riley, M.; McParland, J.; Stanford, C.F.; Nicholls, D.P. Oxygen consumption during corridor walk testing in chronic cardiac failure. Eur. Heart J. 1992, 13, 789–793. [Google Scholar] [CrossRef]
- Faggiano, P.; D’Aloia, A.; Gualeni, A.; Lavatelli, A.; Giordano, A. Assessment of oxygen uptake during the 6-minute walking test in patients with heart failure: Preliminary experience with a portable device. Am. Heart J. 1997, 134, 203–206. [Google Scholar] [CrossRef]
- Czerniecki, J.M.; Morgenroth, D.C. Metabolic energy expenditure of ambulation in lower extremity amputees: What have we learned and what are the next steps? Disabil. Rehabil. 2015, 39, 143–151. [Google Scholar] [CrossRef]
- Vincent, W. Statistics in Kinesiology, 3rd ed.; Human Kinetics: Champaign, IL, USA, 2004. [Google Scholar]
- Bland, J.M.; Altman, D.G. Statistical methods for assessing agreement between two methods of clinical measurement. Lancet 1986, 1, 307–310. [Google Scholar] [CrossRef]
- Parker, K.; Kirby, R.L.; Adderson, J.; Thompson, K. Ambulation of People with Lower-Limb Amputations: Relationship Between Capacity and Performance Measures. Arch. Phys. Med. Rehabil. 2010, 91, 543–549. [Google Scholar] [CrossRef]
- Rau, B.; Bonvin, F.; de Bie, R. Short-term effect of physiotherapy rehabilitation on functional performance of lower limb amputees. Prosthet. Orthot. Int. 2007, 31, 258–270. [Google Scholar] [CrossRef] [PubMed]
- Selman, J.P.; De Camargo, A.A.; Santos, J.; Lanza, F.C.; Corso, S.D. Reference Equation for the 2-Minute Walk Test in Adults and the Elderly. Respir. Care 2013, 59, 525–530. [Google Scholar] [CrossRef] [PubMed]
- Frlan-Vrgoc, L.; Vrbanić, T.S.-L.; Kraguljac, D.; Kovacević, M. Functional outcome assessment of lower limb amputees and prosthetic users with a 2-minute walk test. Coll. Antropol. 2011, 35, 1215–1218. [Google Scholar] [PubMed]
- Göktepe, A.S.; Cakir, B.; Yilmaz, B.; Yazicioglu, K. Energy Expenditure of Walking with Prostheses. Prosthet. Orthot. Int. 2010, 34, 31–36. [Google Scholar] [CrossRef]
- Torburn, L.; Powers, C.M.; Guiterrez, R.; Perry, J. Energy expenditure during ambulation in dysvascular and traumatic below-knee amputees: A comparison of five prosthetic feet. J. Rehabil. Res. Dev. 1995, 32, 111–119. [Google Scholar]
- McDonald, C.L.; Kramer, P.A.; Morgan, S.J.; Halsne, E.G.; Cheever, S.M.; Hafner, B.J. Energy expenditure in people with transtibial amputation walking with crossover and energy storing prosthetic feet: A randomized within-subject study. Gait Posture 2018, 62, 349–354. [Google Scholar] [CrossRef]
- Williams, M.R.; Herr, H.; D’Andrea, S. Metabolic effects of using a variable impedance prosthetic knee. J. Rehabil. Res. Dev. 2016, 53, 1079–1088. [Google Scholar] [CrossRef]
- Smith, J.D.; Martin, P.E. Effects of Prosthetic Mass Distribution on Metabolic Costs and Walking Symmetry. J. Appl. Biomech. 2013, 29, 317–328. [Google Scholar] [CrossRef]
- Vetrovsky, T.; Siranec, M.; Marencakova, J.; Tufano, J.J.; Capek, V.; Bunc, V.; Belohlavek, J. Validity of six consumer-level activity monitors for measuring steps in patients with chronic heart failure. PLoS ONE 2019, 14, e0222569. [Google Scholar] [CrossRef]
- Johnson, M.; Meltz, K.; Hart, K.; Schmudlach, M.; Clarkson, L.; Borman, K. Validity of the Actical activity monitor for assessing steps and energy expenditure during walking. J. Sports Sci. 2014, 33, 769–776. [Google Scholar] [CrossRef] [PubMed]
- Schneider, P.L.; Crouter, S.E.; Lukajic, O.; Bassett, J.R., Jr. Accuracy and reliability of 10 pedometers for measuring steps over a 400-m walk. Med. Sci. Sports Exerc. 2003, 35, 1779–1784. [Google Scholar] [CrossRef] [PubMed]
- Arch, E.S.; Sions, J.M.; Horne, J.; Bodt, B.A. Step count accuracy of StepWatch and FitBit One™ among individuals with a unilateral transtibial amputation. Prosthet. Orthot. Int. 2018, 42, 518–526. [Google Scholar] [CrossRef] [PubMed]
- Treacy, D.; Hassett, L.; Schurr, K.; Chagpar, S.; Paul, S.S.; Sherrington, C. Validity of Different Activity Monitors to Count Steps in an Inpatient Rehabilitation Setting. Phys. Ther. 2017, 97, 581–588. [Google Scholar] [CrossRef] [PubMed]
- Schaffer, S.D.; Holzapfel, S.D.; Fulk, G.; Bosch, P.R. Step count accuracy and reliability of two activity tracking devices in people after stroke. Physiother. Theory Pract. 2017, 33, 788–796. [Google Scholar] [CrossRef] [PubMed]
- Höchsmann, C.; Knaier, R.; Eymann, J.; Hintermann, J.; Infanger, D.; Schmidt-Trucksäss, A. Validity of activity trackers, smartphones, and phone applications to measure steps in various walking conditions. Scand. J. Med. Sci. Sports 2018, 28, 1818–1827. [Google Scholar] [CrossRef]
- Albaum, E.; Quinn, E.; Sedaghatkish, S.; Singh, P.; Watkins, A.; Musselman, K.; Williams, J. Accuracy of the Actigraph wGT3x-BT for step counting during inpatient spinal cord rehabilitation. Spinal Cord 2019, 57, 571–578. [Google Scholar] [CrossRef]
- Anderson, J.L.; Yoward, L.S.; Green, A.J. A study investigating the validity of an accelerometer in quantification of step count in adult hospital inpatients recovering from critical illness. Clin. Rehabil. 2019, 33, 936–942. [Google Scholar] [CrossRef]
- Riel, H.; Rathleff, C.R.; Kalstrup, P.M.; Madsen, N.K.; Pedersen, E.S.; Pape-Haugaard, L.B.; Villumsen, M. Comparison between Mother, ActiGraph wGT3X-BT, and a hand tally for measuring steps at various walking speeds under controlled conditions. PeerJ 2016, 4, e2799. [Google Scholar] [CrossRef]
- Borg, G.A. Psychophysical bases of perceived exertion. Med. Sci. Sports Exerc. 1982, 14, 377–381. [Google Scholar] [CrossRef]
- Haskell, W.L.; Lee, I.M.; Pate, R.R.; Powell, K.E.; Blair, S.N.; Franklin, B.A.; Macera, C.A.; Heath, G.W.; Thompson, P.D.; Bauman, A. Physical activity and public health: Updated recommendation for adults from the American College of Sports Medicine and the American Heart Association. Med. Sci. Sports Exerc. 2007, 39, 1423–1434. [Google Scholar] [CrossRef]
- Su, P.-F.; Gard, S.A.; Lipschutz, R.D.; Kuiken, T.A. Differences in Gait Characteristics Between Persons with Bilateral Transtibial Amputations, Due to Peripheral Vascular Disease and Trauma, and Able-Bodied Ambulators. Arch. Phys. Med. Rehabil. 2008, 89, 1386–1394. [Google Scholar] [CrossRef]


| Characteristics | Total (N = 35) | Male (n = 19) | Female (n = 16) |
|---|---|---|---|
| Age (years) | 48.5 ± 14.8 | 52.2 ± 14.6 | 46.5 ± 15.1 |
| Height (cm) | 171.0 ± 8.5 | 176.5 ± 5.7 | 164.4 ± 6.2 |
| Weight (kg) | 86.0 ± 24.6 | 99.1 ± 21.8 | 70.5 ± 18.0 |
| BMI (kg/m2) | 29.2 ± 7.2 | 31.8 ± 6.9 | 26.1 ± 6.3 |
| Amputation Duration (y) | 9.5 ± 8.7 | 7.4 ± 5.4 | 12.1 ± 11.1 |
| Classification | |||
| Right Transtibial | 15 | 11 | 4 |
| Left Transtibial | 8 | 3 | 5 |
| Right Transfemoral | 2 | 1 | 1 |
| Left Transfemoral | 7 | 4 | 3 |
| Bilateral Transtibial | 3 | 0 | 3 |
| Parameter | Total (N = 35) | Males (n = 19) | Females (n = 16) |
|---|---|---|---|
| Steps | 220.0 ± 24.3 | 212.1 ± 19.9 | 229.4 ± 26.2 * |
| Cadence (steps/m) | 110.0 ± 12.1 | 106.0 ± 9.9 | 114.7 ± 13.1 * |
| Distance Walked (m) | 147.02 ± 25.9 | 144.4 ± 24.6 | 150.2 ± 27.8 |
| Speed (m/min) | 73.5 ± 12.9 | 72.2 ± 12.3 | 75.1 ± 13.8 |
| VO2 (mL/kg/min) | 8.9 ± 2.9 | 8.3 ± 1.6 | 9.7 ± 3.9 |
| Heart Rate (b/min) | 102.8 ± 19.4 | 98.5 ± 18.7 | 108.1 ± 19.6 |
| RPE | 10.1 ± 2.2 | 9.7 ± 1.9 | 10.5 ± 2.4 |
| Parameter | Unilateral Transtibial (n = 23) | Unilateral Transfemoral (n = 9) | Bilateral Transtibial (n = 3) |
|---|---|---|---|
| Steps | 228.0 ± 21.9 | 203.2 ± 23.2 * | 209 ± 19.9 |
| Cadence (steps/m) | 114.0 ± 10.9 | 101.6 ± 11.6 * | 104.5 ± 9.9 |
| Distance Walked (m) | 154.1 ± 27.6 | 136.6 ± 16.0 | 124.0 ± 10.2 |
| Speed (m/min) | 77.0 ± 13.8 | 68.3 ± 8.0 | 62.0 ± 5.1 |
| VO2 (mL/kg/min) | 8.5 ± 3.1 | 10.6 ± 2.7 | 8.0 ± 1.2 |
| Heart Rate (b/min) | 103.1 ± 18.9 | 103.7 ± 24.3 | 96.9 ± 10.4 |
| RPE | 10.1 ± 2.2 | 10.0 ± 2.5 | 10.0 ± 1.7 |
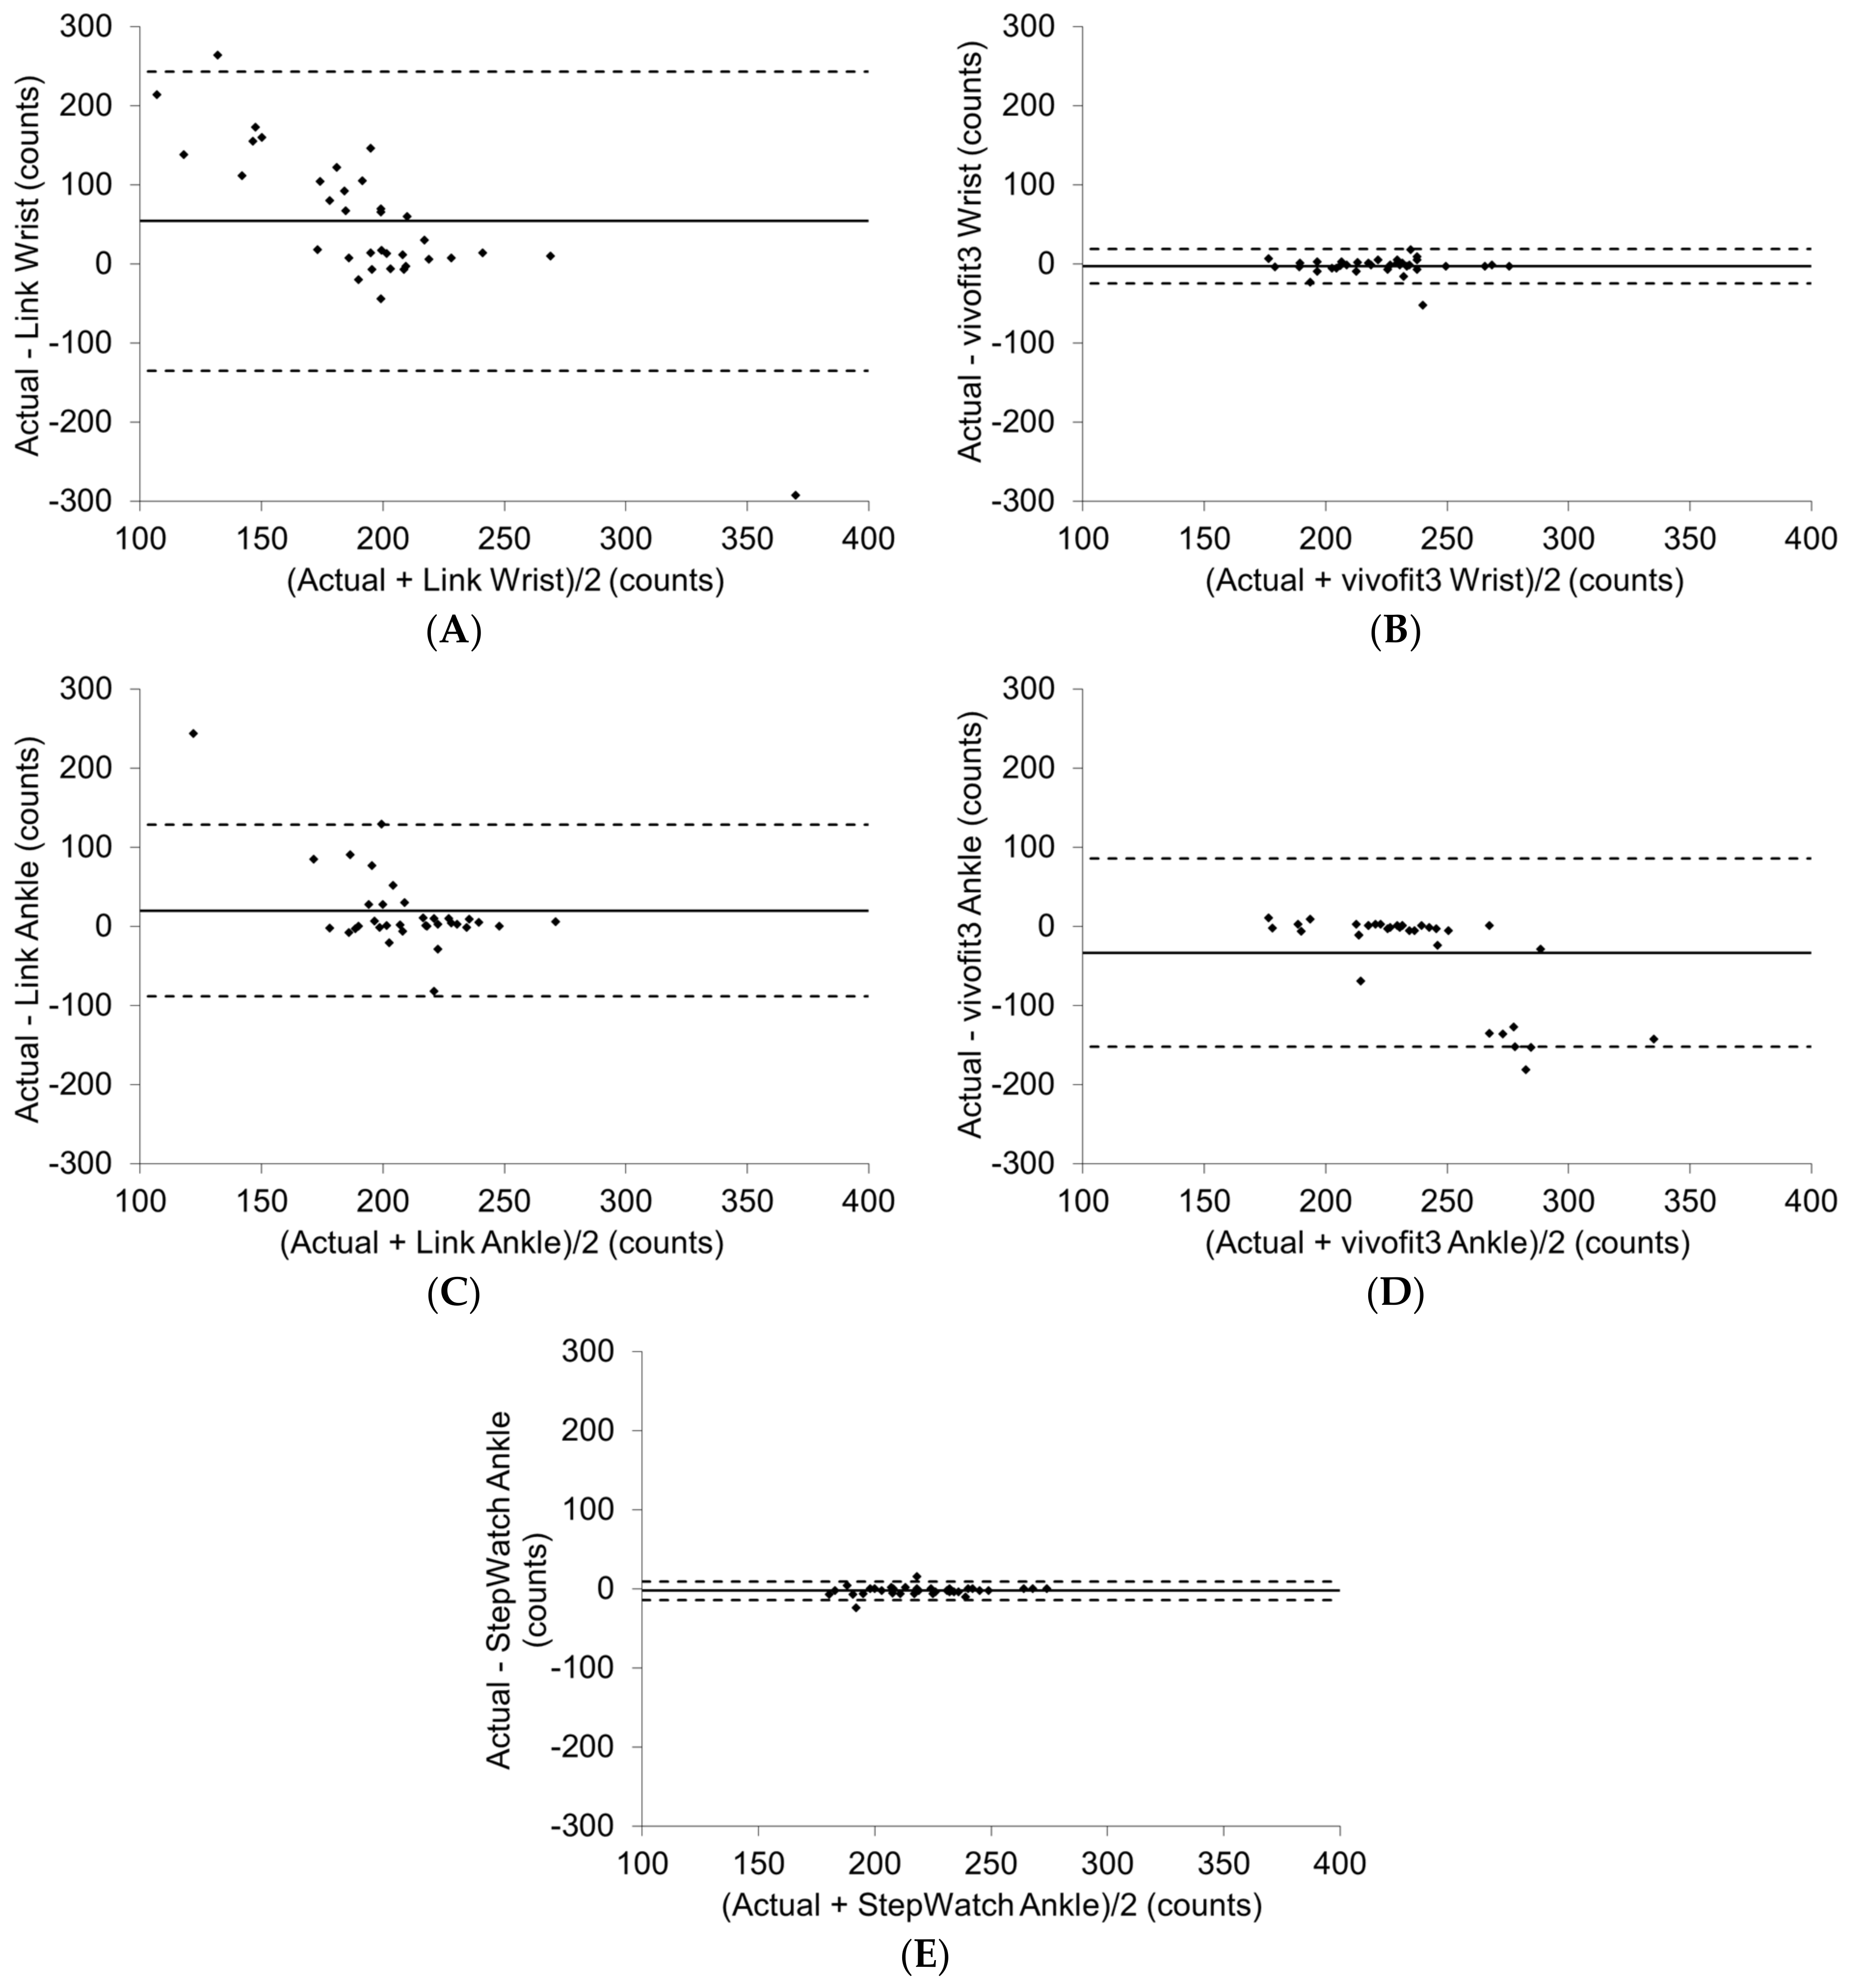
| Parameter | Step Counts (N = 35) | ICC | 95% Confidence Interval |
|---|---|---|---|
| AC | 220.0 ± 24.3 | ----- | ---------- |
| LW | 165.7 ± 89.4 * | 0.005 | −0.256 to 0.299 |
| VW | 222.8 ± 24.6 | 0.895 | 0.802 to 0.945 |
| LA | 198.5 ± 47.9 | 0.111 | −0.202 to 0.418 |
| VA | 253.2 ± 59.8 * | 0.122 | −0.141 to 0.398 |
| SA | 222.4 ± 23.2 | 0.967 | 0.929 to 0.984 |
| Parameter | Percent Error | Mean Error | 95% Limit of Agreement |
|---|---|---|---|
| LW | −24.6 | 54.2 ± 94.5 | −134.8 to 243.3 |
| VW | 1.3 | −2.8 ± 11.0 | −24.9 to 19.2 |
| LA | −9.1 | 20.1 ± 54.4 | −88.7 to 128.9 |
| VA | 15.1 | −33.2 ± 59.5 | −152.2 to 85.8 |
| SA | 1.1 | −2.3 ± 5.7 | −13.8 to 9.1 |
Publisher’s Note: MDPI stays neutral with regard to jurisdictional claims in published maps and institutional affiliations. |
© 2021 by the authors. Licensee MDPI, Basel, Switzerland. This article is an open access article distributed under the terms and conditions of the Creative Commons Attribution (CC BY) license (http://creativecommons.org/licenses/by/4.0/).
Share and Cite
Smith, J.D.; Guerra, G. Quantifying Step Count and Oxygen Consumption with Portable Technology during the 2-Min Walk Test in People with Lower Limb Amputation. Sensors 2021, 21, 2080. https://doi.org/10.3390/s21062080
Smith JD, Guerra G. Quantifying Step Count and Oxygen Consumption with Portable Technology during the 2-Min Walk Test in People with Lower Limb Amputation. Sensors. 2021; 21(6):2080. https://doi.org/10.3390/s21062080
Chicago/Turabian StyleSmith, John D., and Gary Guerra. 2021. "Quantifying Step Count and Oxygen Consumption with Portable Technology during the 2-Min Walk Test in People with Lower Limb Amputation" Sensors 21, no. 6: 2080. https://doi.org/10.3390/s21062080
APA StyleSmith, J. D., & Guerra, G. (2021). Quantifying Step Count and Oxygen Consumption with Portable Technology during the 2-Min Walk Test in People with Lower Limb Amputation. Sensors, 21(6), 2080. https://doi.org/10.3390/s21062080