
Gated Graph Attention Network for Cancer Prediction


Abstract
1. Introduction
- It is highly efficient. Being aware the fact that the algorithm is based on the two matrices (feature matrix and adjacency matrix) of the graph, the operation of the self-attention may be parallelised across all edges, and the computation of output features can be parallelised across all nodes. There is no need for eigen decomposition or dense matrix calculation.
- It allows input graphs with different structures, so that the model can learn automatically without considering the graph structure.
- It uses node features for similarity calculations, rather than the structural properties of nodes, in which no need for a prior understanding of the graphical structure.
- We propose a hybrid feature selection algorithm to select the gene features, so as to reduce noise and ensure the effectiveness of genes datasets.
- We propose a novel GGAT for cancer prediction, which can fully mine the semantic information of graph structure (the relevance between samples). According to our knowledge, we are the first to apply GM to graph attentional network.
- Compared with some of the traditional algorithms and some latest neural network models, our model gains the best accuracy on the experiment datasets. And through the comparative analysis of various experiments, the validity and interpretability of our model are verified.
2. Related Work
2.1. Machine Learning Methods for Cancer Prediction
2.2. Deep Learning Methods for Cancer Prediction
3. Method
3.1. Data Collection and Preprocessing
3.1.1. Feature Selection
- logFC—Fold Change after log2 transformation. Fold Change, or FC, is the multiple of expression difference between samples;
- logCPM—CPM after log2 transformation. CPM value is used to filter low expression genes;
- LR—likelihood ratio statistics;
- PValue—p-value of difference significance; and
- FDR—the p-value corrected by FDR.
3.1.2. Graph Construction
3.2. Gated Graph Attention Network (GGAT)
3.2.1. 2 Kinds of AMs in GGAT
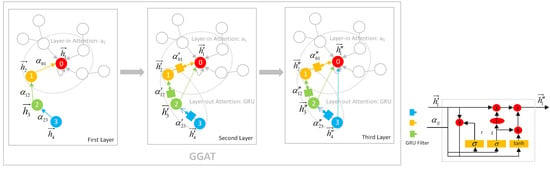
3.2.2. Demonstration of the GGAT’s Operation
- In the first layer, each node aggregates its own and 1-hop neighbours’ information using layer-in attention. At this point, the Node 0 aggregates its own information 0 and its neighbour Node 1’s information 1, so it contains information 0, 1; the Node 1 aggregates its own information 1 and its 1-hop neighbour Node 2’s information 2, so it contains information 1, 2; Node 2 and Node 3 are similar to Node 1.
- In the second layer, each node aggregates via layer-in attention and layer-out attention simultaneously. At this point, in addition to the information 0, 1 collected in the first layer, Node 0 continues to aggregate the information of its neighbour Node 1 filtered by the gates, i.e., (1, 2) (The parentness indicates a transform by the gates. For example, (1, 2) indicates the gated version of information from 1, 2; ((3, 4)) indicates the information from 3, 4 that is filtered by the gates twice), so Node 0 contains information 0, 1, (1, 2) at this time. In addition to the information collected in the first layer 1, 2, Node 1 continues to aggregate the information of its neighbour Node 2 filtered by the gates, that is, (2, 3), so Node 1 contains information 1, 2, (2, 3) currently; Node 2 and Node 3 are similar to Node 1.
- The operation of the third layer is the identical to that of the second layer.
3.2.3. Other Facts about GGAT
- measure the dependence of long-distance nodes;
- take into account the different importance of each node in multi-hop neighbourhood;
- aggregate as much semantic information as possible; and
- fully mine the correlation between samples.
4. Experiment
4.1. Experiment Design and Setup
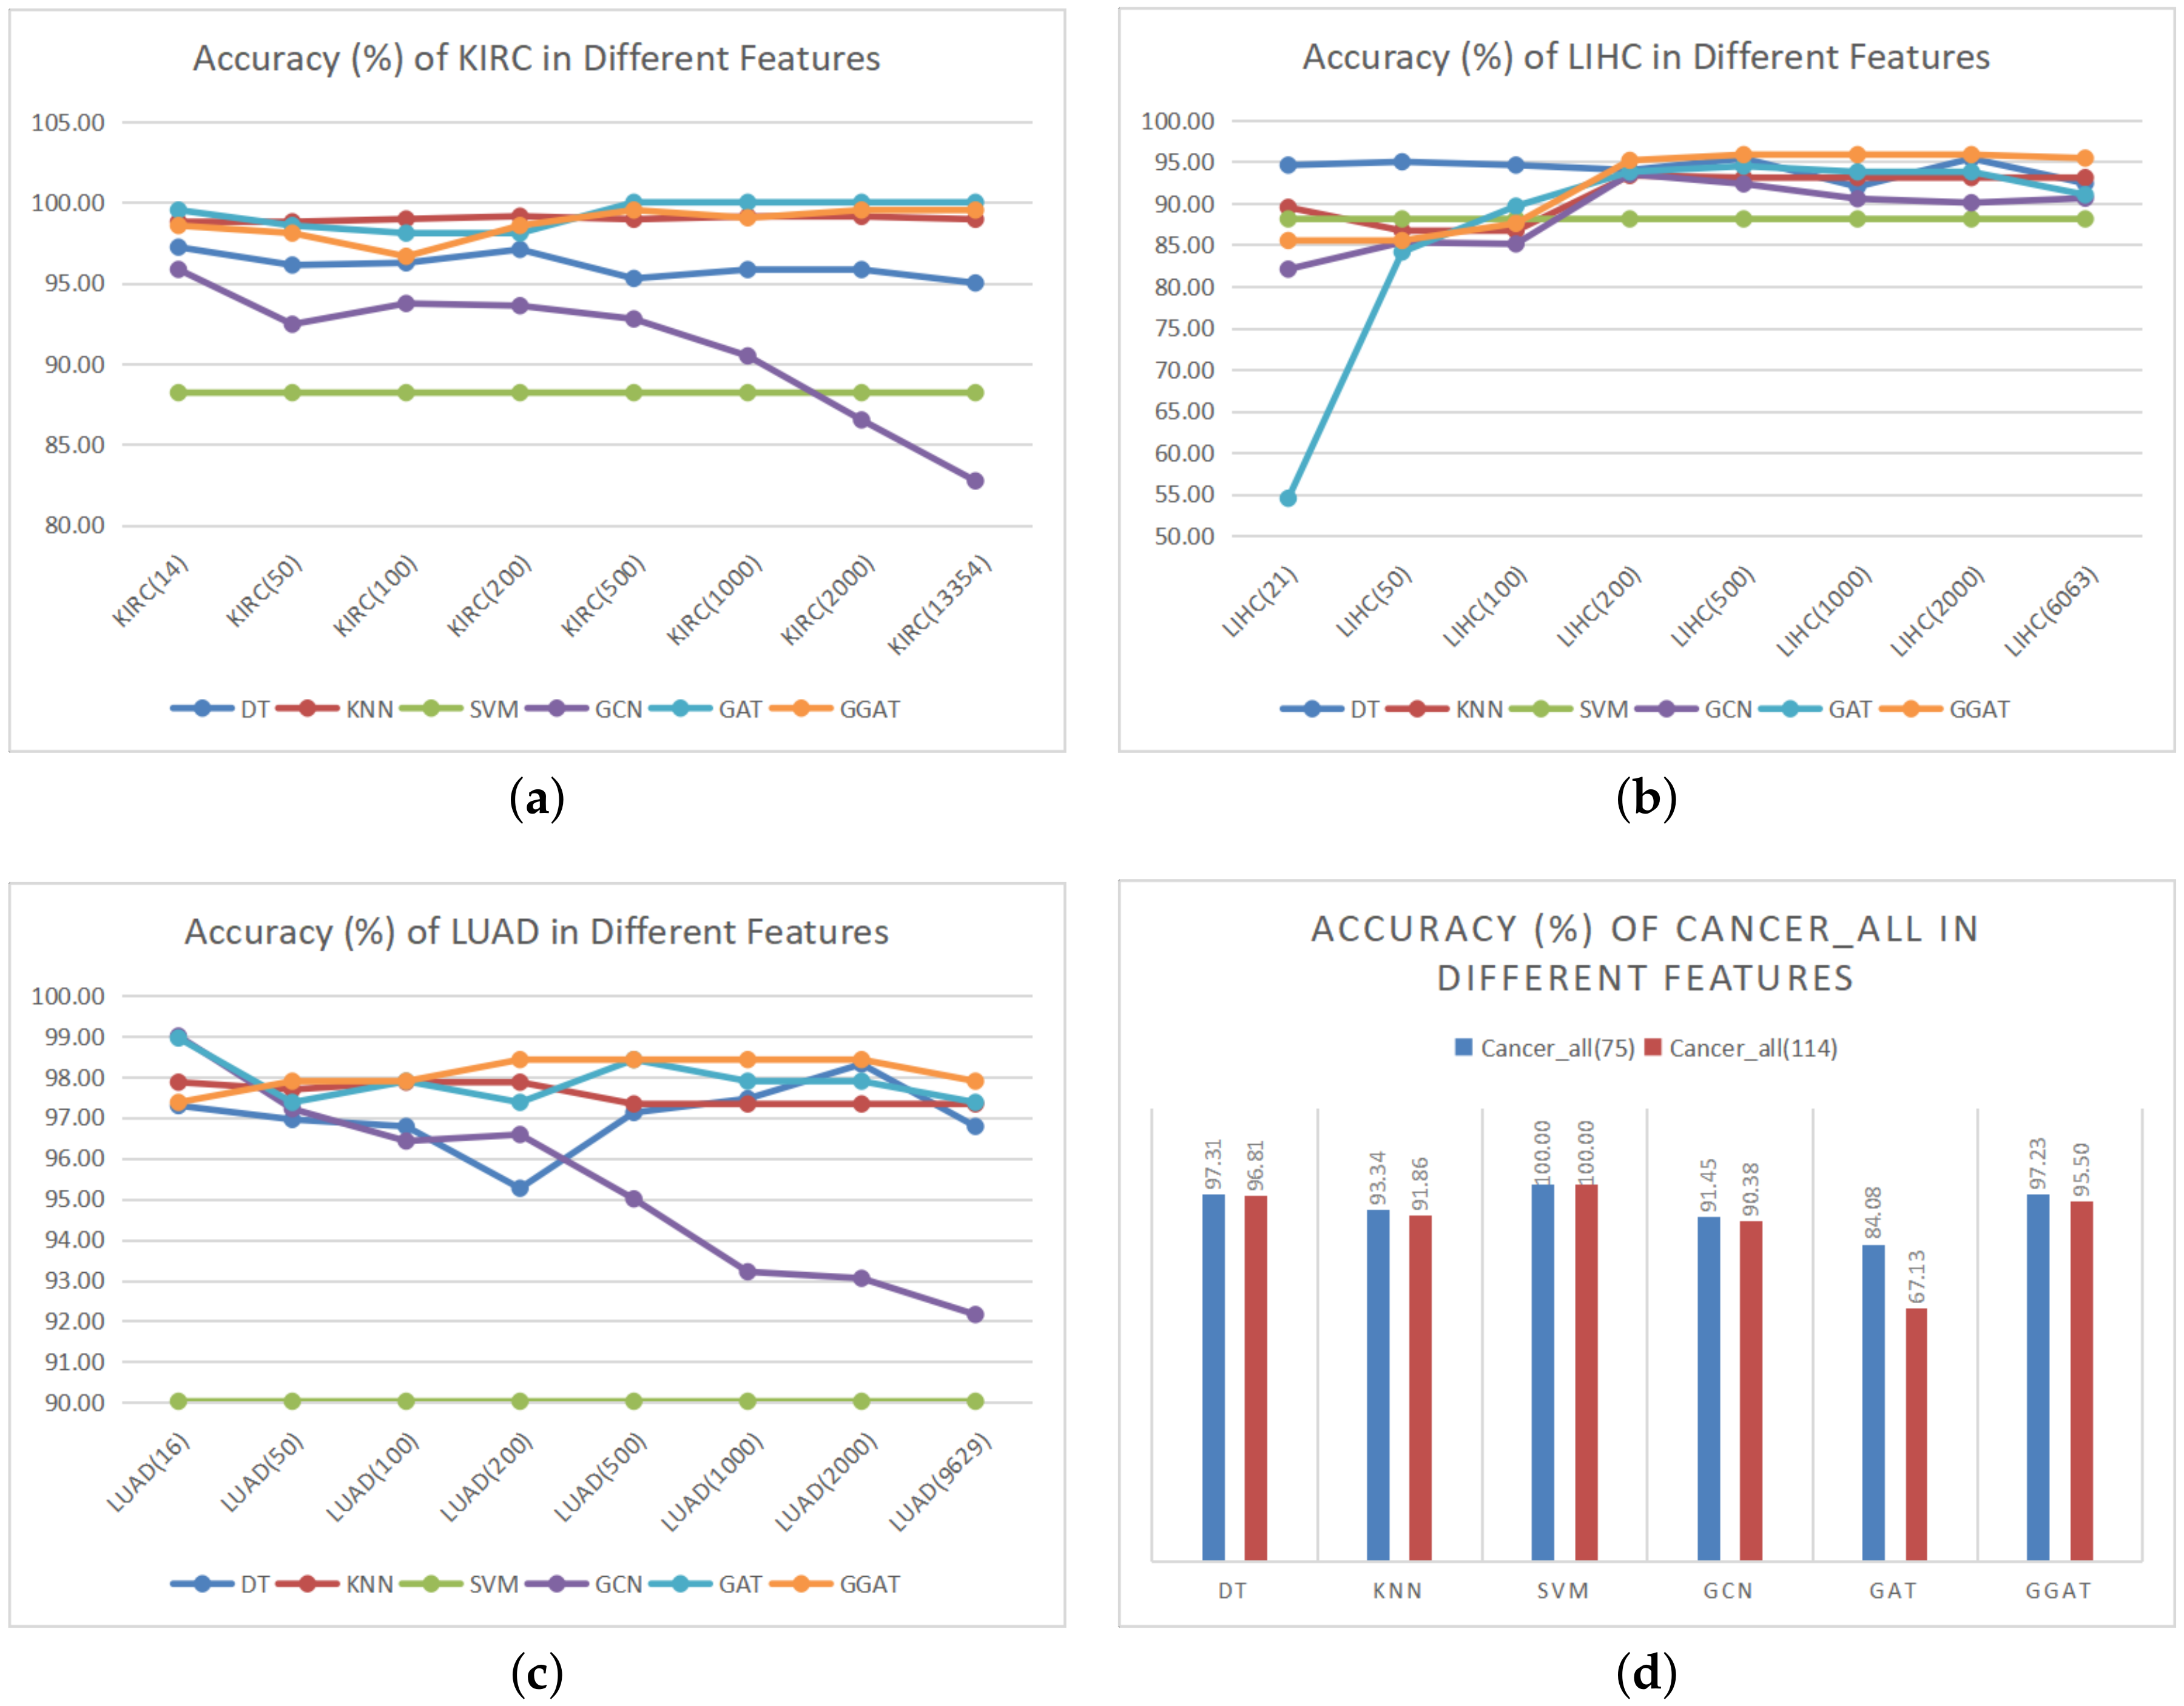
- Evaluation on the Hybrid Feature Selection Algorithm. We performed the prediction task over different versions of feature numbers, of KIRC, LIHC, LUAD [including the Optimal Feature Number (OFN), 50, 100, 200, 500, 1000, 2000, and Initial Feature Number(IFN) versions] and Cancer_all (including OFN and IFN versions) to verify the effectiveness of our proposed hybrid feature selection algorithm (Section 3.1.1).
- Evaluation on the GGAT’s Performance. We compared the accuracy (%) and training time (seconds) among GGAT and other models. In order to verify the effectiveness and performance of our GGAT model, we also utilised the combined cancer dataset (Cancer_all) to investigate the accuracy and training time of the multi-category classification task (3 categories) under large data scale.
- Evaluation on the GGAT’s Validity and Interpretability. Among these models for comparison, the traditional machine learning methods include K-Nearest Neighbor, Support Vector Machine and Decision Tree, and neural network models include GCN and GAT.
4.2. Introduction of Datasets
4.3. Experimental Results
4.3.1. Effectiveness of the Hybrid Feature Selection Algorithm
- Our hybrid feature selection algorithm has no effect on SVM. We suppose that the way we construct the graph makes the datasets unfriendly to SVM. It has been pointed out in preceding section that we chose the average Euclidean distance to measure whether there is a link between two nodes, whereas the graph constructed by the average value may not be suitable for every model. In the future research, this threshold can be used as a parameter to train and optimize, so as to achieve the value of the specific model, which makes our feature selection algorithm more universal.
- GCN does not clearly show the advantage of our feature selection algorithm in LIHC. Firstly, we found that the LIHC dataset resulted in more unstable experimental accuracy in multiple models, compared to other datasets: the error rate of which is relatively high (within the acceptable range). Furthermore, there may be the same problems as described in the above point.
- GAT and GGAT do not highlight the advantages of our feature selection algorithm as well. We hold the belief that feature selection is for better information extraction. However, as a matter of fact, both GAT and GGAT utilise the AM, which is equivalent to feature selection in an indirect manner, that is, the AM in the both models plays the same role as feature selection. In addition, our model introduces GM, which may help to carry out better attention through rigorous information selection and filtering.
4.3.2. Effectiveness of GGAT
- In general, to the best of our knowledge, our proposed model GGAT achieves the best overall results on most of the datasets, which verifies the effectiveness of our model. Specifically, the comparisons on sensitivity and specificity show that our model achieves the stablest effects on predicting three cancer types, among the listed graph convolution models.
- The previous data processing method and the characteristics of the datasets itself indeed improved the effectiveness of a number of certain algorithms, e.g., SVM on Cancer_all and GAT on KIRC.
- The more features, the higher effectiveness we found of GAT and GGAT. As is mentioned above, both the GAT and GGAT introduce AM which play the same role as feature selection. Therefore, more information may be selected and aggregated by the AM if more features are given, thus better results may be obtained. In particular, our model introduces gates, which assists to select and filter information that is more important and effective, and to make the node classification more accurate.
- On the contrary, the more features, the lower efficiency of the traditional algorithm. A conclusion can be drawn that the feature selection algorithm may greatly help the traditional classification algorithms to learn and calculate more effectively, and most importantly, reduce the training time.
4.3.3. Evaluation on the Interpretability of GGAT
5. Conclusions and Future Work
Author Contributions
Funding
Institutional Review Board Statement
Informed Consent Statement
Data Availability Statement
Acknowledgments
Conflicts of Interest
References
- Bray, F.; Ferlay, J.; Soerjomataram, I.; Siegel, R.L.; Torre, L.A.; Jemal, A. Global cancer statistics 2018: GLOBOCAN estimates of incidence and mortality worldwide for 36 cancers in 185 countries. CA Cancer J. Clin. 2018, 68, 394–424. [Google Scholar] [CrossRef]
- Ning, W.; Shuo, L.; Lei, Y.; Xi, Z.; Yan-nan, Y.; Hui-chao, L.; Jia-fu, J. Interpretation on the report of Global Cancer Statistics 2018. Electron. J. Compr. Cancer Ther. 2019, 5, 87–97. [Google Scholar]
- Rongtao, Z.; Changli, Z.; Zhangxian, Y. Ten Methods of Traditional Chinese Medical Cancer Prevention. Mod. Distance Educ. Chin. Tradit. Chin. Med. 2008, 12, 1463–1464. [Google Scholar]
- Yifu, G. Review of the application and advantages and disadvantages of sequencing technology in gene diagnosis. Hereditas:bjing 2014, 36, 1121–1130. [Google Scholar]
- Demsar, J.; Zupan, B.; Kattan, M.W.; Beck, J.R.; Bratko, I. Naive Bayesian-based nomogram for prediction of prostate cancer recurrence. Stud. Health Technol. Inform. 1999, 68, 436–441. [Google Scholar]
- Hong, J.H.; Cho, S.B. Multi-class cancer classification with OVR-support vector machines selected by naive Bayes classifier. In Proceedings of the International Conference on Neural Information Processing, Hong Kong, China, 3–6 October 2006; Springer: Berlin, Germany, 2006; pp. 155–164. [Google Scholar]
- Sarkar, M.; Leong, T.Y. Application of K-nearest neighbors algorithm on breast cancer diagnosis problem. In Proceedings of the AMIA Symposium. American Medical Informatics Association, Los Angeles, CA, USA, 4–8 November 2000; p. 759. [Google Scholar]
- Yoo, S.H.; Cho, S.B. Optimal gene selection for cancer classification with partial correlation and k-nearest neighbor classifier. In Proceedings of the Pacific Rim International Conference on Artificial Intelligence, Auckland, New Zealand, 9–13 August 2004; Springer: Berlin, Germany, 2004; pp. 713–722. [Google Scholar]
- Li, C.; Zhang, S.; Zhang, H.; Pang, L.; Lam, K.; Hui, C.; Zhang, S. Using the K-nearest neighbor algorithm for the classification of lymph node metastasis in gastric cancer. Comput. Math. Methods Med. 2012, 2012, 876545. [Google Scholar] [CrossRef] [PubMed]
- Jerez-Aragonés, J.M.; Gómez-Ruiz, J.A.; Ramos-Jiménez, G.; Muñoz-Pérez, J.; Alba-Conejo, E. A combined neural network and decision trees model for prognosis of breast cancer relapse. Artif. Intell. Med. 2003, 27, 45–63. [Google Scholar] [CrossRef]
- Razavi, A.R.; Gill, H.; Åhlfeldt, H.; Shahsavar, N. Predicting metastasis in breast cancer: Comparing a decision tree with domain experts. J. Med. Syst. 2007, 31, 263–273. [Google Scholar] [CrossRef]
- Yeh, J.Y.; Wu, T.H. Cascade of genetic algorithm and decision tree for cancer classification on gene expression data. Expert Syst. 2010, 27, 201–218. [Google Scholar] [CrossRef]
- Lee, Y.J.; Mangasarian, O.; Wolberg, W. Breast cancer survival and chemotherapy: A support vector machine analysis. DIMACS Ser. Discret. Math. Theor. Comput. Sci. 2000, 55, 1–10. [Google Scholar]
- Liu, W.; Shen, P.; Qu, Y.; Xia, D. Fast algorithm of support vector machines in lung cancer diagnosis. In Proceedings of the International Workshop on Medical Imaging and Augmented Reality, Hong Kong, China, 10–12 June 2001; pp. 188–192. [Google Scholar]
- Liu, H.; Zhang, R.; Luan, F.; Yao, X.; Liu, M.; Hu, Z.; Fan, B.T. Diagnosing breast cancer based on support vector machines. J. Chem. Inf. Comput. Sci. 2003, 43, 900–907. [Google Scholar] [CrossRef][Green Version]
- Valentini, G.; Muselli, M.; Ruffino, F. Cancer recognition with bagged ensembles of support vector machines. Neurocomputing 2004, 56, 461–466. [Google Scholar] [CrossRef]
- Nguyen, H.N.; Vu, T.N.; Ohn, S.Y.; Park, Y.M.; Han, M.Y.; Kim, C.W. Feature elimination approach based on random forest for cancer diagnosis. In Proceedings of the Mexican International Conference on Artificial Intelligence, Apizaco, Mexico, 13–17 November 2006; Springer: Berlin, Germany, 2006; pp. 532–542. [Google Scholar]
- Okun, O.; Priisalu, H. Random forest for gene expression based cancer classification: Overlooked issues. In Proceedings of the Iberian Conference on Pattern Recognition and Image Analysis, Girona, Spain, 6–8 June 2007; Springer: Berlin, Germany, 2007; pp. 483–490. [Google Scholar]
- Maliha, S.K.; Ema, R.R.; Ghosh, S.K.; Ahmed, H.; Mollick, M.R.J.; Islam, T. Cancer Disease Prediction Using Naive Bayes, K-Nearest Neighbor and J48 algorithm. In Proceedings of the 2019 10th International Conference on Computing, Communication and Networking Technologies (ICCCNT), Kanpur, India, 6–8 July 2019; IEEE: Piscataway, NJ, USA, 2019; pp. 1–7. [Google Scholar]
- Toğaçar, M.; Ergen, B. Deep learning approach for classification of breast cancer. In Proceedings of the 2018 International Conference on Artificial Intelligence and Data Processing (IDAP), Malatya, Turkey, 28–30 September 2018; IEEE: Piscataway, NJ, USA, 2018; pp. 1–5. [Google Scholar]
- LeCun, Y.; Bengio, Y.; Hinton, G. Deep learning. Nature 2015, 521, 436–444. [Google Scholar] [CrossRef] [PubMed]
- Selvathi, D.; Poornila, A.A. Deep learning techniques for breast cancer detection using medical image analysis. In Biologically Rationalized Computing Techniques for Image Processing Applications; Springer: Berlin, Germany, 2018; pp. 159–186. [Google Scholar]
- Munir, K.; Elahi, H.; Ayub, A.; Frezza, F.; Rizzi, A. Cancer diagnosis using deep learning: A bibliographic review. Cancers 2019, 11, 1235. [Google Scholar] [CrossRef] [PubMed]
- Wu, B.; Kausar, T.; Xiao, Q.; Wang, M.; Wang, W.; Fan, B.; Sun, D. FF-CNN: An efficient deep neural network for mitosis detection in breast cancer histological images. In Proceedings of the Annual Conference on Medical Image Understanding and Analysis, Edinburgh, UK, 11–13 July 2017; Springer: Berlin, Germany, 2017; pp. 249–260. [Google Scholar]
- Gao, F.; Wu, T.; Li, J.; Zheng, B.; Ruan, L.; Shang, D.; Patel, B. SD-CNN: A shallow-deep CNN for improved breast cancer diagnosis. Comput. Med. Imaging Graph. 2018, 70, 53–62. [Google Scholar] [CrossRef]
- Wang, Y.; Sun, L.; Ma, K.; Fang, J. Breast cancer microscope image classification based on CNN with image deformation. In Proceedings of the International Conference Image Analysis and Recognition, Póvoa de Varzim, Portugal, 27–29 June 2018; Springer: Berlin, Germany, 2018; pp. 845–852. [Google Scholar]
- Wang, Z.; Li, M.; Wang, H.; Jiang, H.; Yao, Y.; Zhang, H.; Xin, J. Breast cancer detection using extreme learning machine based on feature fusion with CNN deep features. IEEE Access 2019, 7, 105146–105158. [Google Scholar] [CrossRef]
- Duran-Lopez, L.; Dominguez-Morales, J.P.; Conde-Martin, A.F.; Vicente-Diaz, S.; Linares-Barranco, A. PROMETEO: A CNN-Based Computer-Aided Diagnosis System for WSI Prostate Cancer Detection. IEEE Access 2020, 8, 128613–128628. [Google Scholar] [CrossRef]
- Chiang, J.H.; Chao, S.Y. Modeling human cancer-related regulatory modules by GA-RNN hybrid algorithms. BMC Bioinform. 2007, 8, 1–13. [Google Scholar] [CrossRef]
- Moitra, D.; Mandal, R.K. Automated AJCC staging of non-small cell lung cancer (NSCLC) using deep convolutional neural network (CNN) and recurrent neural network (RNN). Health Inf. Sci. Syst. 2019, 7, 1–12. [Google Scholar] [CrossRef]
- Lane, N.; Kahanda, I. DeepACPpred: A Novel Hybrid CNN-RNN Architecture for Predicting Anti-Cancer Peptides. In Proceedings of the International Conference on Practical Applications of Computational Biology & Bioinformatics, L’Aquila, Italy, 16–19 June 2020; Springer: Berlin, Germany, 2020; pp. 60–69. [Google Scholar]
- Bronstein, M.M.; Bruna, J.; LeCun, Y.; Szlam, A.; Vandergheynst, P. Geometric deep learning: Going beyond euclidean data. IEEE Signal Process. Mag. 2017, 34, 18–42. [Google Scholar] [CrossRef]
- Kipf, T.N.; Welling, M. Semi-supervised classification with graph convolutional networks. arXiv 2016, arXiv:1609.02907. [Google Scholar]
- Veličković, P.; Cucurull, G.; Casanova, A.; Romero, A.; Lio, P.; Bengio, Y. Graph attention networks. arXiv 2017, arXiv:1710.10903. [Google Scholar]
- Cho, K.; Van Merriënboer, B.; Gulcehre, C.; Bahdanau, D.; Bougares, F.; Schwenk, H.; Bengio, Y. Learning phrase representations using RNN encoder-decoder for statistical machine translation. arXiv 2014, arXiv:1406.1078. [Google Scholar]
- Lu, M.; Fan, Z.; Xu, B.; Chen, L.; Zheng, X.; Li, J.; Znati, T.; Mi, Q.; Jiang, J. Using machine learning to predict ovarian cancer. Int. J. Med. Inform. 2020, 141, 104195. [Google Scholar] [CrossRef] [PubMed]
- Arora, M.; Dhawan, S.; Singh, K. Data Driven Prognosis of Cervical Cancer Using Class Balancing and Machine Learning Techniques. EAI Endorsed Trans. Energy Web 2020, 7, e2. [Google Scholar] [CrossRef]
- Chiu, H.J.; Li, T.H.S.; Kuo, P.H. Breast Cancer–Detection System Using PCA, Multilayer Perceptron, Transfer Learning, and Support Vector Machine. IEEE Access 2020, 8, 204309–204324. [Google Scholar] [CrossRef]
- Montelongo González, E.E.; Reyes Ortiz, J.A.; González Beltrán, B.A. Machine Learning Models for Cancer Type Classification with Unstructured Data. Computación y Sistemas 2020, 24. [Google Scholar] [CrossRef]
- Shiqi, L.; Jun, Z.; Shuxun, W. Research on Colorectal Cancer Prediction and Survival Analysis with Data Fusion Based on Deep Learning. In Proceedings of the 9th International Workshop on Computer Science and Engineering (WCSE 2019), Hong Kong, China, 15–17 June 2019. [Google Scholar]
- Zhou, Y.; Graham, S.; Alemi Koohbanani, N.; Shaban, M.; Heng, P.A.; Rajpoot, N. Cgc-net: Cell graph convolutional network for grading of colorectal cancer histology images. In Proceedings of the IEEE/CVF International Conference on Computer Vision Workshops, Seoul, Korea, 27–28 October 2019. [Google Scholar]
- Schulte-Sasse, R.; Budach, S.; Hnisz, D.; Marsico, A. Graph Convolutional networks improve the prediction of cancer driver genes. In Proceedings of the International Conference on Artificial Neural Networks, Munich, Germany, 17–19 September 2019; Springer: Berlin, Germany, 2019; pp. 658–668. [Google Scholar]
- Wang, C.; Guo, J.; Zhao, N.; Liu, Y.; Liu, X.; Liu, G.; Guo, M. A Cancer Survival Prediction Method Based on Graph Convolutional Network. IEEE Trans. Nanobiosci. 2019, 19, 117–126. [Google Scholar] [CrossRef] [PubMed]
- Ramirez, R.; Chiu, Y.C.; Hererra, A.; Mostavi, M.; Ramirez, J.; Chen, Y.; Huang, Y.; Jin, Y.F. Classification of Cancer Types Using Graph Convolutional Neural Networks. Front. Phys. 2020, 8, 203. [Google Scholar] [CrossRef]
- Guyon, I.; Weston, J.; Barnhill, S.; Vapnik, V. Gene selection for cancer classification using support vector machines. Mach. Learn. 2002, 46, 389–422. [Google Scholar] [CrossRef]
- Vaswani, A.; Shazeer, N.; Parmar, N.; Uszkoreit, J.; Jones, L.; Gomez, A.N.; Kaiser, L.; Polosukhin, I. Attention is all you need. arXiv 2017, arXiv:1706.03762. [Google Scholar]


| Layer/Node | 0 | 1 | 2 | 3 |
|---|---|---|---|---|
| First Layer | 0, 1 | 1, 2 | 2, 3 | 3, ♡ |
| Second Layer | 0, 1, (1, 2) | 1, 2, (2, 3) | 2, 3, (3) | 3, ♡, (♡) |
| Third Layer | 0, 1, (1, 2),(1, 2, (2, 3)) | 1, 2, (2, 3),(2, 3, (3)) | 2, 3, (3), (3, ♡, (♡)) | 3, ♡, (♡) |
| Dataset | After Preprocessing | After Primary Selection (Original Feature Number) | After Exact Selection (Optimal Feature Number) |
|---|---|---|---|
| KIRC | 610 × 35,208 | 610 × 13,354 | 610 × 14 |
| LIHC | 421 × 29,609 | 421 × 6063 | 421 × 21 |
| LUAD | 592 × 35,734 | 592 × 9629 | 592 × 16 |
| Cancer_all | 1442 × 114 | 1442 × 114 | 1442 × 75 |
| Dataset | Shape | Cancer Samples | Normal Samples | Classes |
|---|---|---|---|---|
| KIRC | 610 × 500 | 538 | 72 | 2 |
| LIHC | 421 × 500 | 371 | 50 | 2 |
| LUAD | 592 × 500 | 533 | 59 | 2 |
| Cancer_all | 1442 × 75 | 1442 | 0 | 3 |
| Cora | 2708 × 1433 | 0 | 2708 | 7 |
| Dataset | Nodes | Edges | Training Set | Validation Set | Test Set |
|---|---|---|---|---|---|
| KIRC | 610 | 105,428 | 40% | 40% | 20% |
| LIHC | 421 | 55,155 | 40% | 40% | 20% |
| LUAD | 592 | 107,975 | 40% | 40% | 20% |
| Cancer_all | 1442 | 638,719 | 40% | 40% | 20% |
| Cora | 2708 | 5429 | 140 entities | 300 entities | 1000 entities |
| Model/Datasets | KIRC(14) | LIHC(21) | LUAD(16) | Cancer_all(75) | Cora |
|---|---|---|---|---|---|
| DT | 97.22 | 94.60 | 97.29 | 97.31 | - |
| KNN | 98.79 | 89.51 | 97.86 | 91.86 | - |
| SVM | 88.20 | 88.12 | 90.03 | 99.00 | - |
| GCN | 95.84 | 82.07 | 98.99 | 91.45 | 83.40 |
| GAT | 99.52 | 54.48 | 98.95 | 84.08 | 84.30 |
| GGAT | 98.56 | 85.52 | 97.37 | 97.23 | 85.40 |
| Model/Datasets | KIRC(14) | LIHC(21) | LUAD(16) |
|---|---|---|---|
| GCN | 97.05/94.23 | 83.32/86.70 | 98.79/98.54 |
| GAT | 99.07/100.0 | 15.38/100.0 | 98.23/100.0 |
| GGAT | 100.0/99.06 | 73.08/100.0 | 100.0/96.46 |
| Model/Datasets | KIRC(13354) | LIHC(6063) | LUAD(9629) | Cancer_all(114) |
|---|---|---|---|---|
| DT | 95.00 | 92.40 | 96.78 | 96.81 |
| KNN | 98.95 | 93.09 | 97.33 | 93.34 |
| SVM | 88.20 | 88.12 | 90.03 | 99.00 |
| GCN | 82.73 | 90.62 | 92.16 | 90.38 |
| GAT | 100.00 | 91.03 | 97.37 | 67.13 |
| GGAT | 99.52 | 95.44 | 97.89 | 95.50 |
| Model/Datasets | KIRC(13354) | LIHC(6063) | LUAD(9629) |
|---|---|---|---|
| GCN | 92.02/74.26 | 91.00/90.28 | 82.72/90.14 |
| GAT | 100.0/100.0 | 86.57/94.87 | 98.70/96.46 |
| GGAT | 99.06/100.0 | 98.51/93.59 | 98.70/97.35 |
| Model/Datasets | KIRC(50) | LIHC(50) | LUAD(50) |
|---|---|---|---|
| DT | 96.11 | 95.00 | 96.95 |
| KNN | 98.79 | 86.70 | 97.69 |
| SVM | 88.20 | 88.12 | 90.03 |
| GCN | 92.44 | 85.31 | 97.21 |
| GAT | 98.56 | 84.14 | 97.37 |
| GGAT | 98.09 | 85.52 | 97.89 |
| Model/Datasets | KIRC(100) | LIHC(100) | LUAD(100) |
|---|---|---|---|
| DT | 96.25 | 94.60 | 96.78 |
| KNN | 98.97 | 89.70 | 97.86 |
| SVM | 88.20 | 88.12 | 90.03 |
| GCN | 93.73 | 85.11 | 96.42 |
| GAT | 98.09 | 89.66 | 97.89 |
| GGAT | 96.65 | 87.59 | 97.89 |
| Model/Datasets | KIRC(200) | LIHC(200) | LUAD(200) |
|---|---|---|---|
| DT | 97.08 | 94.00 | 95.26 |
| KNN | 99.14 | 93.35 | 97.86 |
| SVM | 88.20 | 88.12 | 90.03 |
| GCN | 93.59 | 93.52 | 96.58 |
| GAT | 98.09 | 93.79 | 97.37 |
| GGAT | 98.56 | 95.17 | 98.42 |
| Model/Datasets | KIRC(500) | LIHC(500) | LUAD(500) |
|---|---|---|---|
| DT | 95.28 | 95.40 | 97.12 |
| KNN | 98.95 | 93.10 | 97.33 |
| SVM | 88.20 | 88.12 | 90.03 |
| GCN | 92.77 | 92.34 | 95.00 |
| GAT | 100.00 | 94.48 | 98.42 |
| GGAT | 99.52 | 95.86 | 98.42 |
| Model/Datasets | KIRC(1000) | LIHC(1000) | LUAD(1000) |
|---|---|---|---|
| DT | 95.83 | 92.00 | 97.46 |
| KNN | 99.12 | 93.10 | 97.33 |
| SVM | 88.20 | 88.12 | 90.03 |
| GCN | 90.48 | 90.55 | 93.21 |
| GAT | 100.00 | 93.79 | 97.89 |
| GGAT | 99.04 | 95.86 | 98.42 |
| Model/Datasets | KIRC(2000) | LIHC(2000) | LUAD(2000) |
|---|---|---|---|
| DT | 95.83 | 95.40 | 98.31 |
| KNN | 99.12 | 93.10 | 97.33 |
| SVM | 88.20 | 88.12 | 90.03 |
| GCN | 86.51 | 90.07 | 93.05 |
| GAT | 100.00 | 93.79 | 97.89 |
| GGAT | 99.52 | 95.86 | 98.42 |
Publisher’s Note: MDPI stays neutral with regard to jurisdictional claims in published maps and institutional affiliations. |
© 2021 by the authors. Licensee MDPI, Basel, Switzerland. This article is an open access article distributed under the terms and conditions of the Creative Commons Attribution (CC BY) license (http://creativecommons.org/licenses/by/4.0/).
Share and Cite
Qiu, L.; Li, H.; Wang, M.; Wang, X. Gated Graph Attention Network for Cancer Prediction. Sensors 2021, 21, 1938. https://doi.org/10.3390/s21061938
Qiu L, Li H, Wang M, Wang X. Gated Graph Attention Network for Cancer Prediction. Sensors. 2021; 21(6):1938. https://doi.org/10.3390/s21061938
Chicago/Turabian StyleQiu, Linling, Han Li, Meihong Wang, and Xiaoli Wang. 2021. "Gated Graph Attention Network for Cancer Prediction" Sensors 21, no. 6: 1938. https://doi.org/10.3390/s21061938
APA StyleQiu, L., Li, H., Wang, M., & Wang, X. (2021). Gated Graph Attention Network for Cancer Prediction. Sensors, 21(6), 1938. https://doi.org/10.3390/s21061938