1. Introduction
The aim of this work is to develop a small-sized and lightweight broadband ground-penetrating radar (GPR) antenna. Generally, a larger antenna can provide resonances in a lower frequency range, enabling better penetration, and has broader bandwidth to achieve more accurate detection—these are, of course, desirable properties for GPR application. However, through the work presented in this article, the authors want to fill the niche of electrically small ground-penetrating radar antennas. Any application that needs a low-cost planar antenna smaller than that of the state of the art with improved bandwidth may find the described antenna design useful. The proposed antenna can be integrated into a small unmanned aerial vehicle (UAV) for searching for and rescuing victims trapped under collapsed buildings after gas explosions or earthquakes by detecting the periodic Doppler shift caused by human chest movements due to respiration. This research was part of the German research project
(the German acronym for flying localization system for searching for and rescuing trapped people). In previous work, a bi-quad-antenna was designed [
1]. In addition to antenna development, the project also included research on the processing of breathing signals [
1,
2], a weight-optimized rescue-radar module [
3], a weight- and efficiency-optimized multicopter [
4], partially autonomous flight control [
4], vision-based autonomous landing [
5,
6], and scenario development for emergency exercises [
7]. For lightweight UAV applications, to ensure a certain flight time or to fulfill certain take-off weight regulations, it is essential to reduce the payload weight as much as possible. In our case, the maximum take-off weight of the project UAV is defined as 5 kg. To ensure a flight time of 60 min, the maximum allowed payload weight is 500 g, with a weight budget of 50 g for the two radar antennas.
For the application of the described quick survivor detection radar, the antenna is required to have a low frequency of operation for good penetration through the ground, to have sufficient bandwidth for the acquisition of distance information, and to be lightweight and miniaturized for integration into a UAV.
Metallic objects can reflect almost all of the incident radio-frequency (RF) waves. The interface between two dielectric media can also reflect RF waves due to the impedance mismatch. Based on that, a GPR can detect things underneath a surface. Detecting a human body underneath a collapsed building is a very complex scenario for GPR. A collapsed building consists of many different materials, including wood, brick, concrete, reinforcing steel, and all possible furniture. If some survivors are trapped in it, they may have an air cavity to breath. These different materials and cavities diffusely reflect and attenuate the transmitted RF waves.
The most frequently used antenna type for broadband radar applications is the horn antenna, regardless of if the radar is ultra-wideband (UWB) pulse radar [
8,
9,
10], frequency-modulated continuous-wave (FMCW) radar [
11], step-frequency continuous-wave (SFCW) radar [
12], or pseudo-noise (PN) radar [
13]. Moreover, horn antennas have a very high directivity. Lightweight versions of horn antennas can be found in UAV applications for landmine detection [
14,
15]. The Vivaldi antenna, as a planar version of the horn antenna, has significantly reduced weight comparing to the classic horn antenna. In recent years, more research has integrated Vivaldi antennas into a UAV for GPR applications, such as landmine detection [
16,
17]. The maximum radiation of all kinds of horn antennas is directed nearly along the central axis of symmetry to the opening [
18]. The opening can be covered with a dielectric material to protect the antenna from the environment. For GPR applications, if the permittivity of the dielectric material and the permittivity of the ground material are the same, the impedance match is optimal. Similarly, the maximum radiation of a Vivaldi antenna is directed along the axis of symmetry. Therefore, for ground penetration, regardless of if the incidence is normal or oblique, only the front edge of the antenna patch touches the ground, which leads to the situation that the main wave first propagates into the air. Most of the radiation is reflected by the air–ground interface.
Another often-used broadband antenna type is the spiral antenna [
13,
19,
20]. In contrast to the horn antenna, the spiral antenna is planar and can touch the ground completely. Miniaturized spiral antennas were studied in [
21,
22]. The sinuous antenna, as another type of planar broadband antenna, could also be applied as a GPR antenna [
23].
If the GPR measures during flight, most of the RF waves transmitted by the antenna cannot penetrate, but will be directly reflected by the ground surface. If the antennas are planar and are mounted under the landing gear of the UAV as feet, when the UAV lands, the antennas can directly touch and couple to the ground without an air gap, so that more RF energy can penetrate the ground to detect the weak chest vibrations of trapped victims. By landing, the UAV motor and devices that are unrelated to the measurement can also be turned off to avoid possible interference caused by the UAV itself.
How can a planar antenna be made small? The most direct way is to use a substrate with high permittivity so that the wavelength is short [
24]. An antenna is electrically small when its dimensions are much smaller than the wavelength in the propagation medium. The principle of making an electrically small antenna is lowering the resonance frequency without increasing the dimensions [
25]. However, there are some fundamental physical limitations for small antennas. Depending on different criteria, radiation modes, and antenna types, the fundamental limitations are expressed differently [
26,
27]. The most common way to express the limitations is by deriving the lowest achievable quality factor
Q because
Q is the ratio of stored energy to radiated energy. For example, for the lowest-order transverse magnetic (TM) mode mode, the lowest achievable
Q is
where
,
k is the wavenumber, and
r is the radius of the spherical circumference of the antenna [
27]. Within those limitations, the most basic technique for making an antenna electrically small is to improve the space utilization efficiency, as implemented in the fractal antenna [
18]. Increasing the number of radiation modes around the operation center frequency or the utilization of metamaterials can also result in electrically small antennas [
25].
How can the bandwidth of a planar antenna be increased? Since the quality factor
Q of an antenna at a resonance frequency
is reciprocal to the fractional bandwidth
[
18],
and
are the upper and lower frequency limits of the bandwidth, with
as the center frequency. Lowering
Q leads to an increase in the bandwidth. In [
28], some general approaches were summarized about how to make a planar broadband antenna: In addition to lowering
Q, using an impedance-matching network and introducing multiple resonances were suggested.
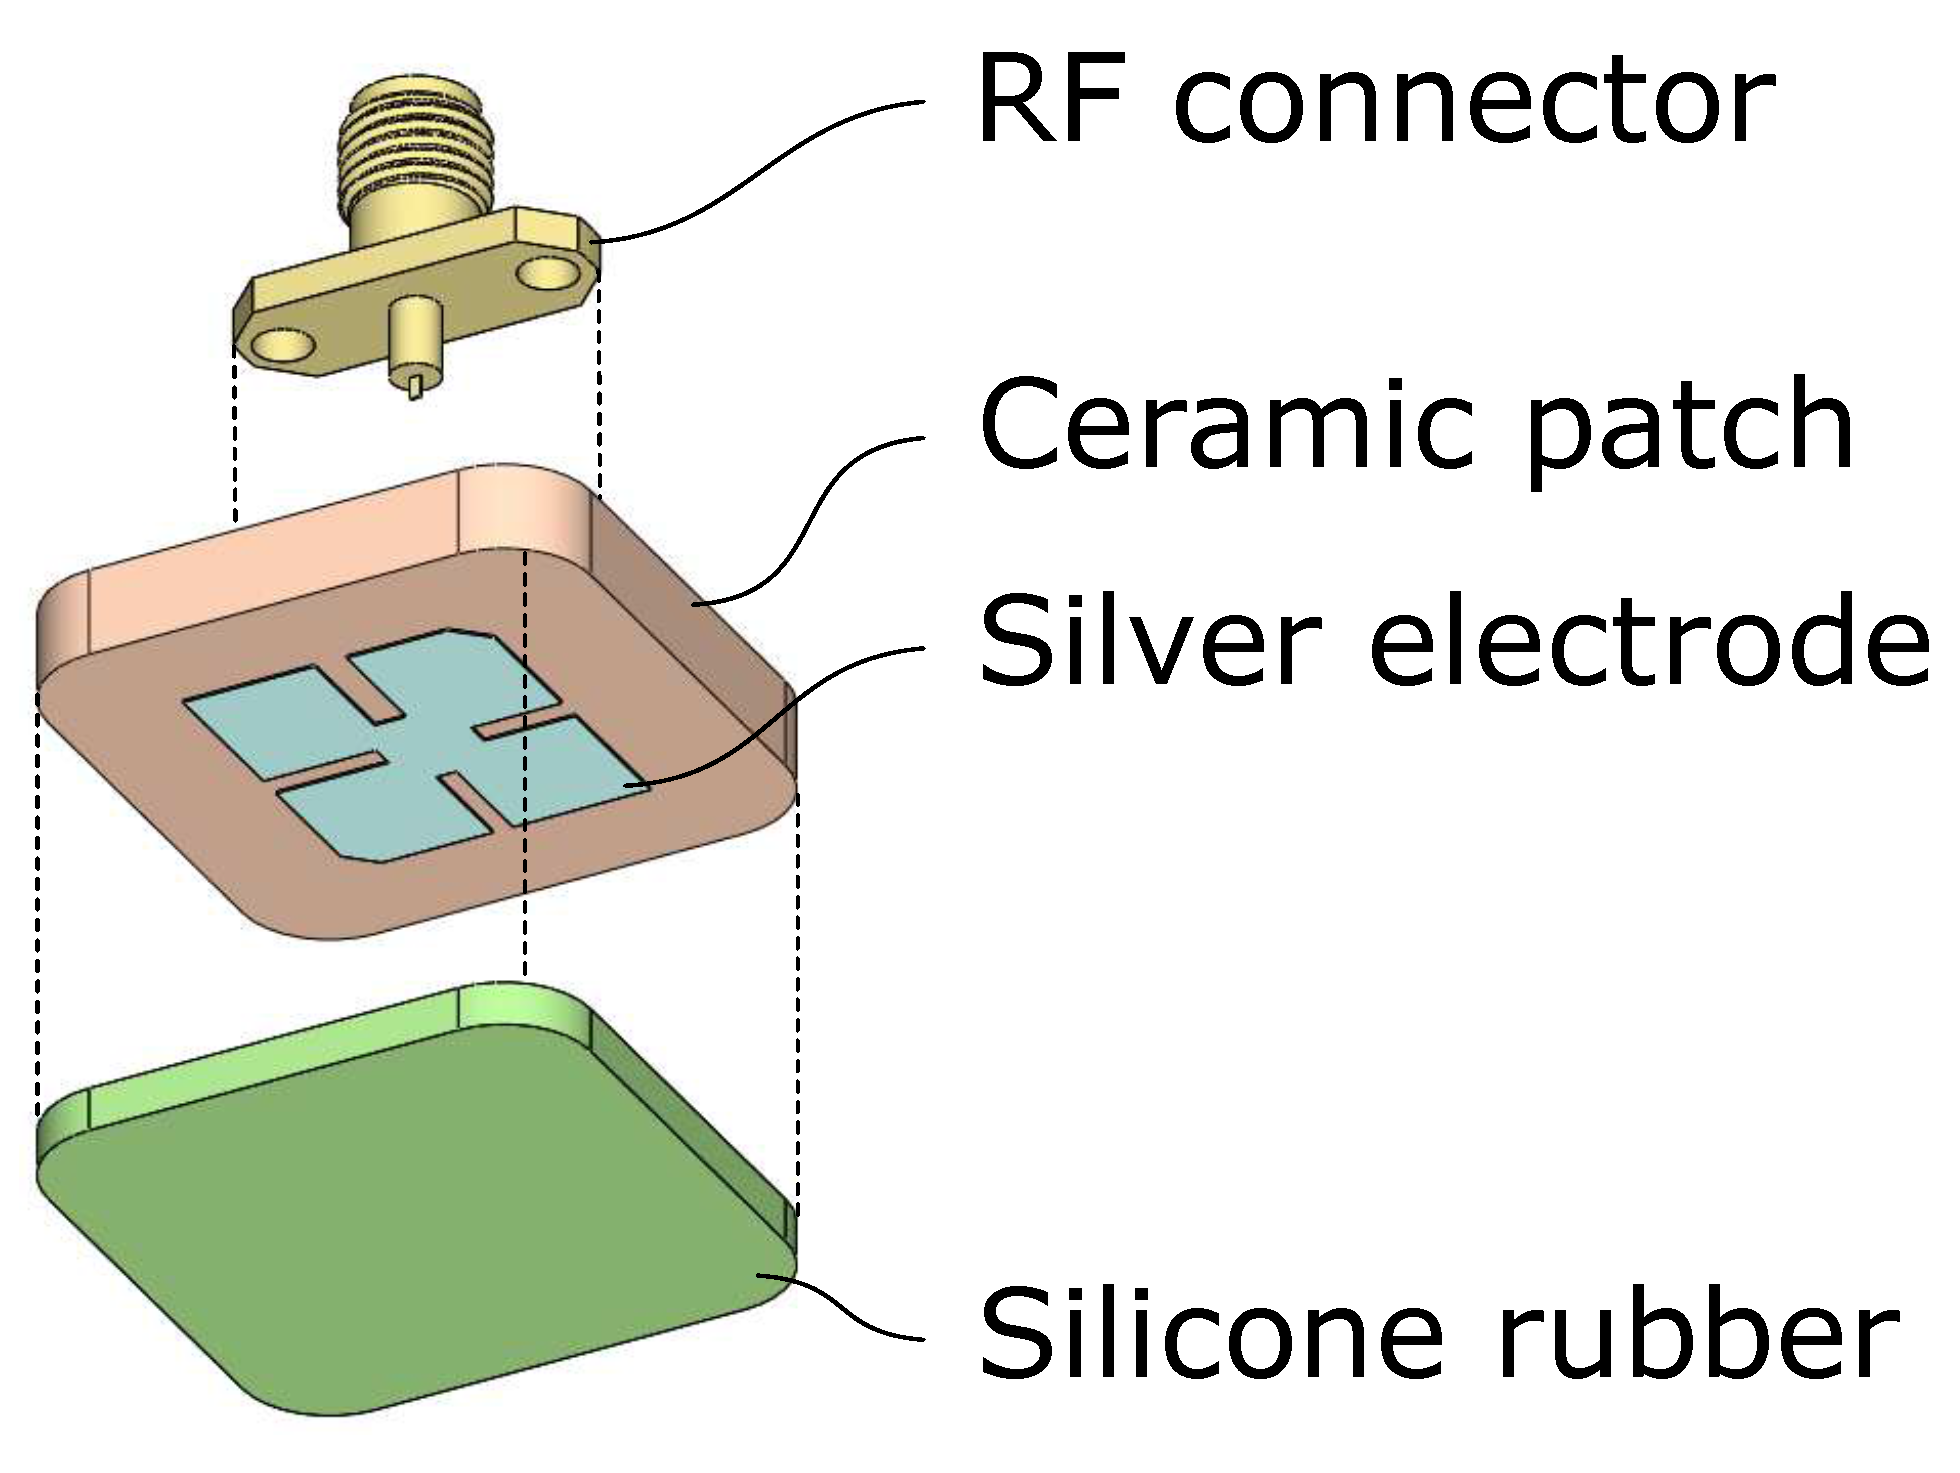
In this article, an electrically small planar patch antenna is proposed. The authors comprehensively took all of the above-mentioned factors into consideration and applied as many techniques as possible within the restrictions defined by the application. The design procedure in this work was systematically documented and is meant to provide a useful design guideline for small broadband ground-penetrating patch antennas. Two antennas of the proposed design—one for transmitting and one for receiving—were installed as the feet of a UAV and could completely touch the ground when the UAV landed (as in
Figure 1), which enabled a direct coupling to the ground. The landing gear of the UAV had three adaptable legs, and each foot could land on a different surface with a minimum area of 2.5 ×
cm
2 without causing an air gap between the antenna and the ground.
This article is organized as follows. In
Section 2, according to the application requirements, the design procedure is defined; the six subsections sequentially introduce the design and optimization methods. Based on the finite element method (FEM), each subsection analyzes the simulated return loss results of the intermediate design. In
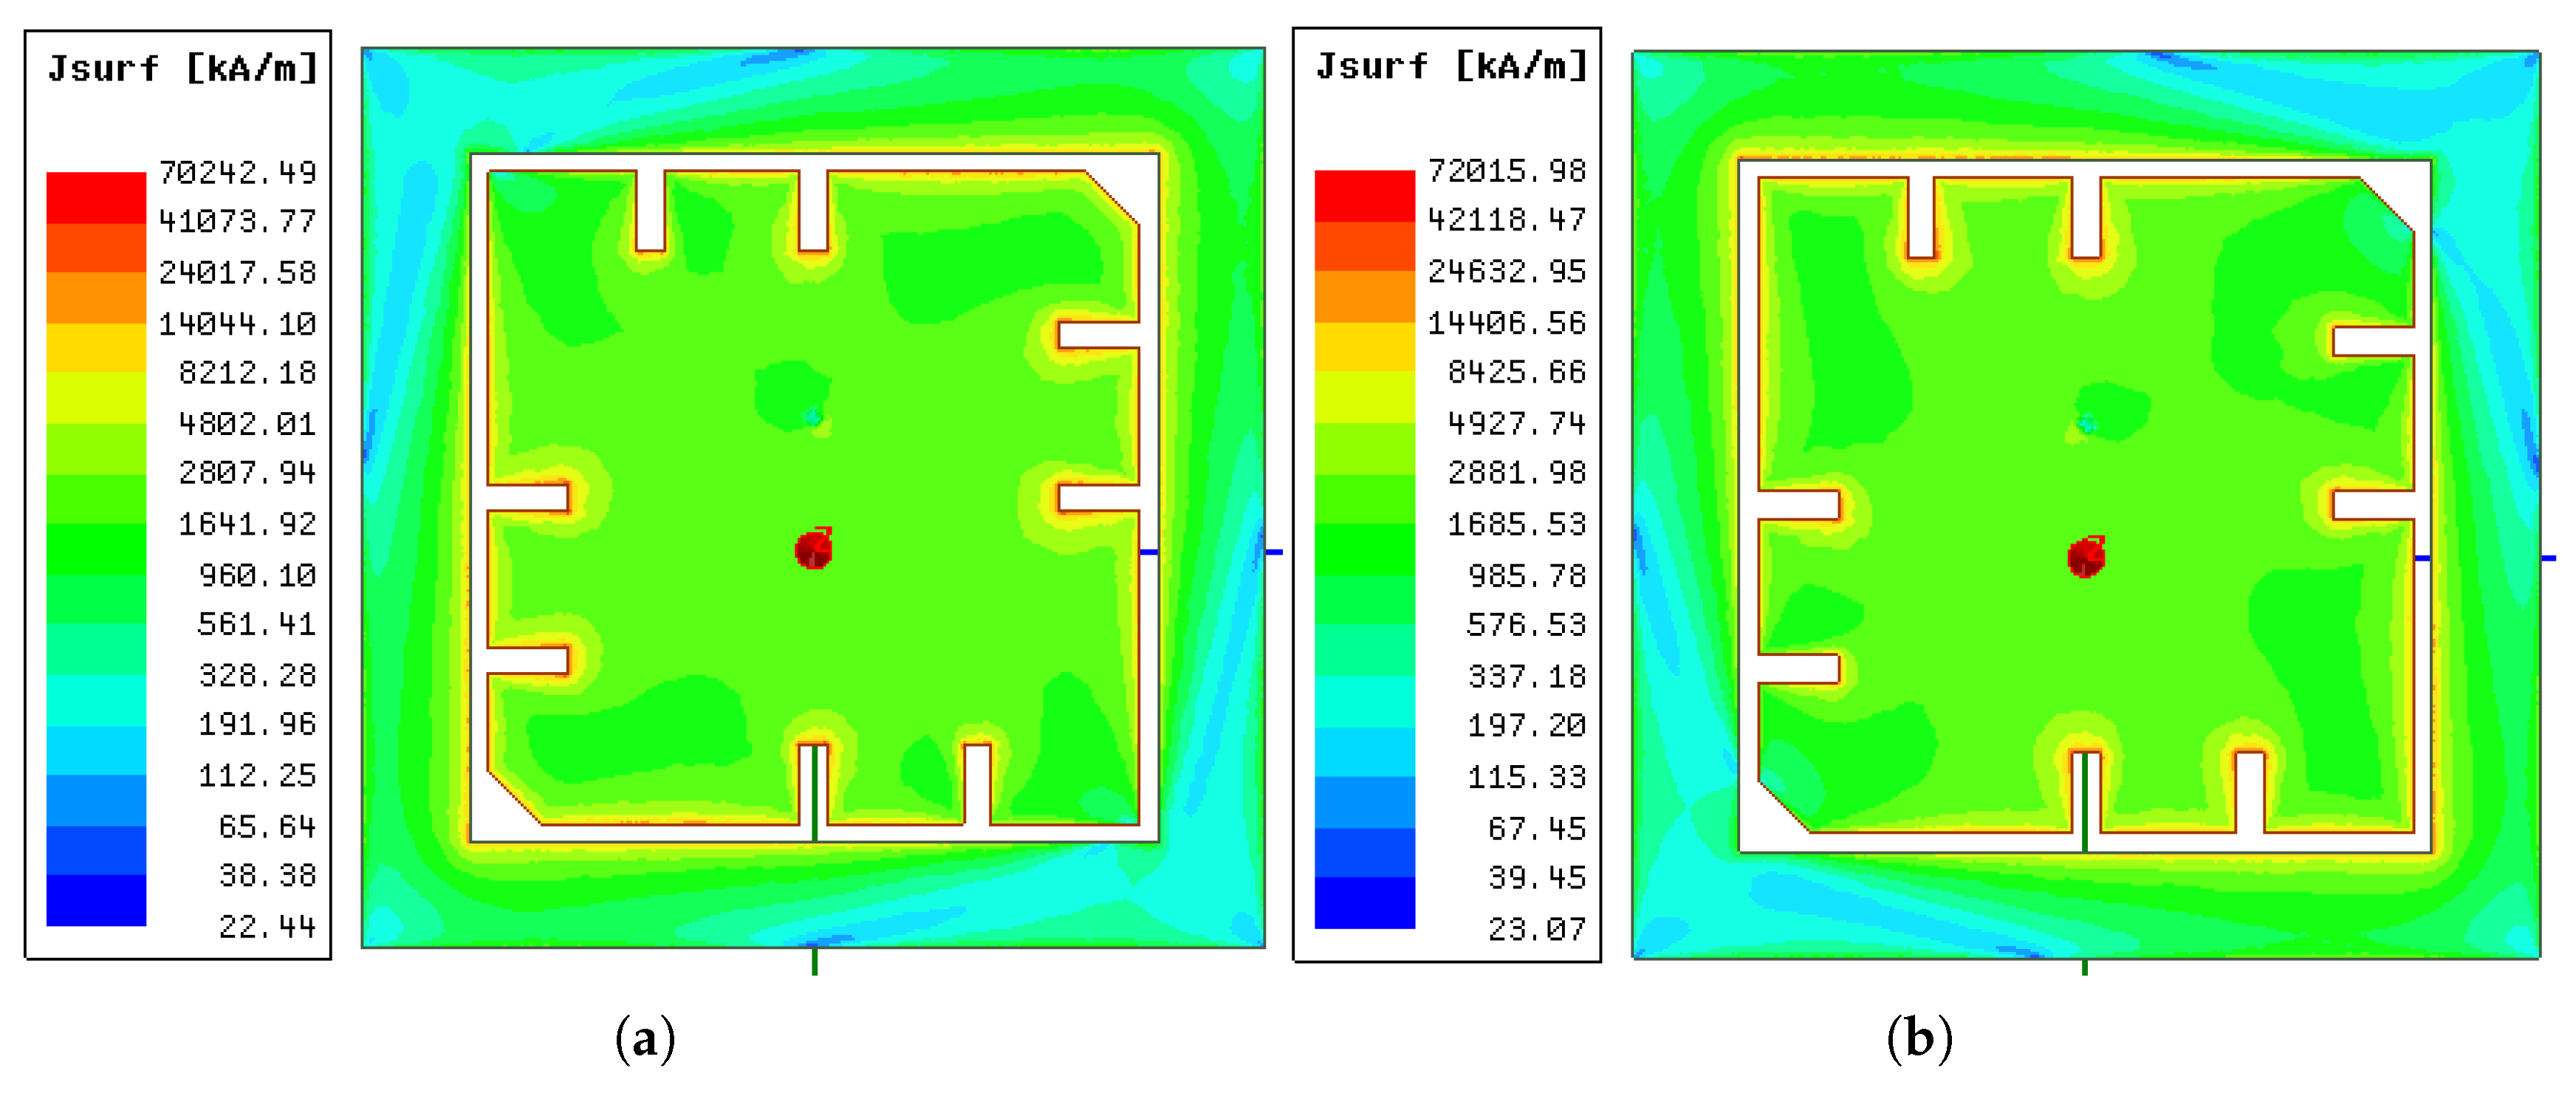
Section 3, the results of the proposed antenna are presented with its detailed dimensions, eigenmodes, radiation patterns, surface current, electric (E-) field and magnetic (H-) field. The return losses from simulations and measurements are compared. A commercial antenna of a similar frequency range is compared with the proposed antenna. In
Section 4, the main work of this article is summarized and the conclusions are given.
2. Design Procedure
For good ground penetration, which means less attenuation, the resonance frequency of the antenna should be as low as possible. The radar transmitting power
P at distance
z is related to the power
at the Tx-antenna
by [
29]
The ohmic attenuation coefficient
is material and frequency dependent. For common ground materials, such as sand (dry, moist, or wet) and clay, the
increases nonlinearly and monotonically with increasing radar frequency [
30].
To estimate a survivor’s range, a bandwidth is needed. The range resolution
is inversely proportional to the radar’s operating bandwidth
[
19]:
where
c is the electromagnetic wave velocity in a medium. Increasing the bandwidth increases the range resolution. However, for the same substrate material and the same antenna design, simply scaling the antenna dimensions will scale the
and the
proportionally, which leaves the fractional bandwidth
[
29]:
which leaves the fractional bandwidth
FBW unchanged. Therefore, a broader absolute bandwidth
is easier to achieve if the antenna resonates in a higher frequency range. Over the course of this study, the authors were granted permission to use the RF spectrum from
to
GHz by the BNetzA (Federal Network Agency, Bonn, Germany) for research on civil search and rescue. This frequency range provides a compromise between penetration depth and depth resolution.
Considering the requirements of the application on a UAV, the specifications of the antenna are roughly defined as follows:
The fundamental resonance frequency is around GHz;
Good electromagnetic coupling to common ground/building materials;
As of a large bandwidth as possible;
Light weight and small size.
In the following, the guidelines for the design procedure are given in the form of an instruction manual.
2.1. Choose an Existing Antenna with a Lower Resonance Frequency
At the beginning of the research, the authors looked for high-permittivity material suppliers for antenna substrates. However, the substrate material parameters are often not stable and the antenna manufacturing for every design iteration is very time consuming.
In this study, the substrate was extracted from a commercially available 915 MHz patch antenna [
31]. The antenna is a rectangular cuboid with rounded corners, as can be seen in
Figure 2. The size of the rectangular cuboid is 25 × 25 × 4 mm
3, and the radius of the rounded corners is 4 mm. There is a 19 × 19 mm
2 silver square patch with two diagonally truncated corners on the front side of the antenna. The back side is fully covered with a silver ground plane. There is a feeding pin located at
mm from the center point, which goes through the substrate.
The diagonally truncated corners create two orthogonal modes of resonance, making it a classic design of a single-feed circular polarized patch antenna. The earliest publication in which this design was theoretically analyzed is [
32]. Later on, based on this basic design, many optimization studies have been reported—for example, by adding cuts on the edges to lower the resonance frequency [
33] or by utilizing a U-slot to improve the impedance matching of a thick substrate with the air [
34].
The Abracon 915 MHz antenna has a simple design. Within its original patch dimensions, new patterns could be designed and analyzed with the assistance of an RF simulation tool. The extra part could be removed by laser milling. Details about laser milling are described in
Section 2.6. The simulation environment that was used in this work was the ANSYS High-Frequency Structure Simulator (HFSS). All of the simulations in this work used the discrete frequency sweep type for more accurate results.
2.2. Extract the Substrate Permittivity Using an Iterative FEM Simulation
For further simulations, it is necessary to have all of the important material parameters of the substrate. As the substrate was designed to be used as antenna substrate, we assumed that the relative magnetic permeability is 1, the conductivity is 0, and the dielectric loss tangent is 0. The only important parameter remaining unknown is the relative permittivity .
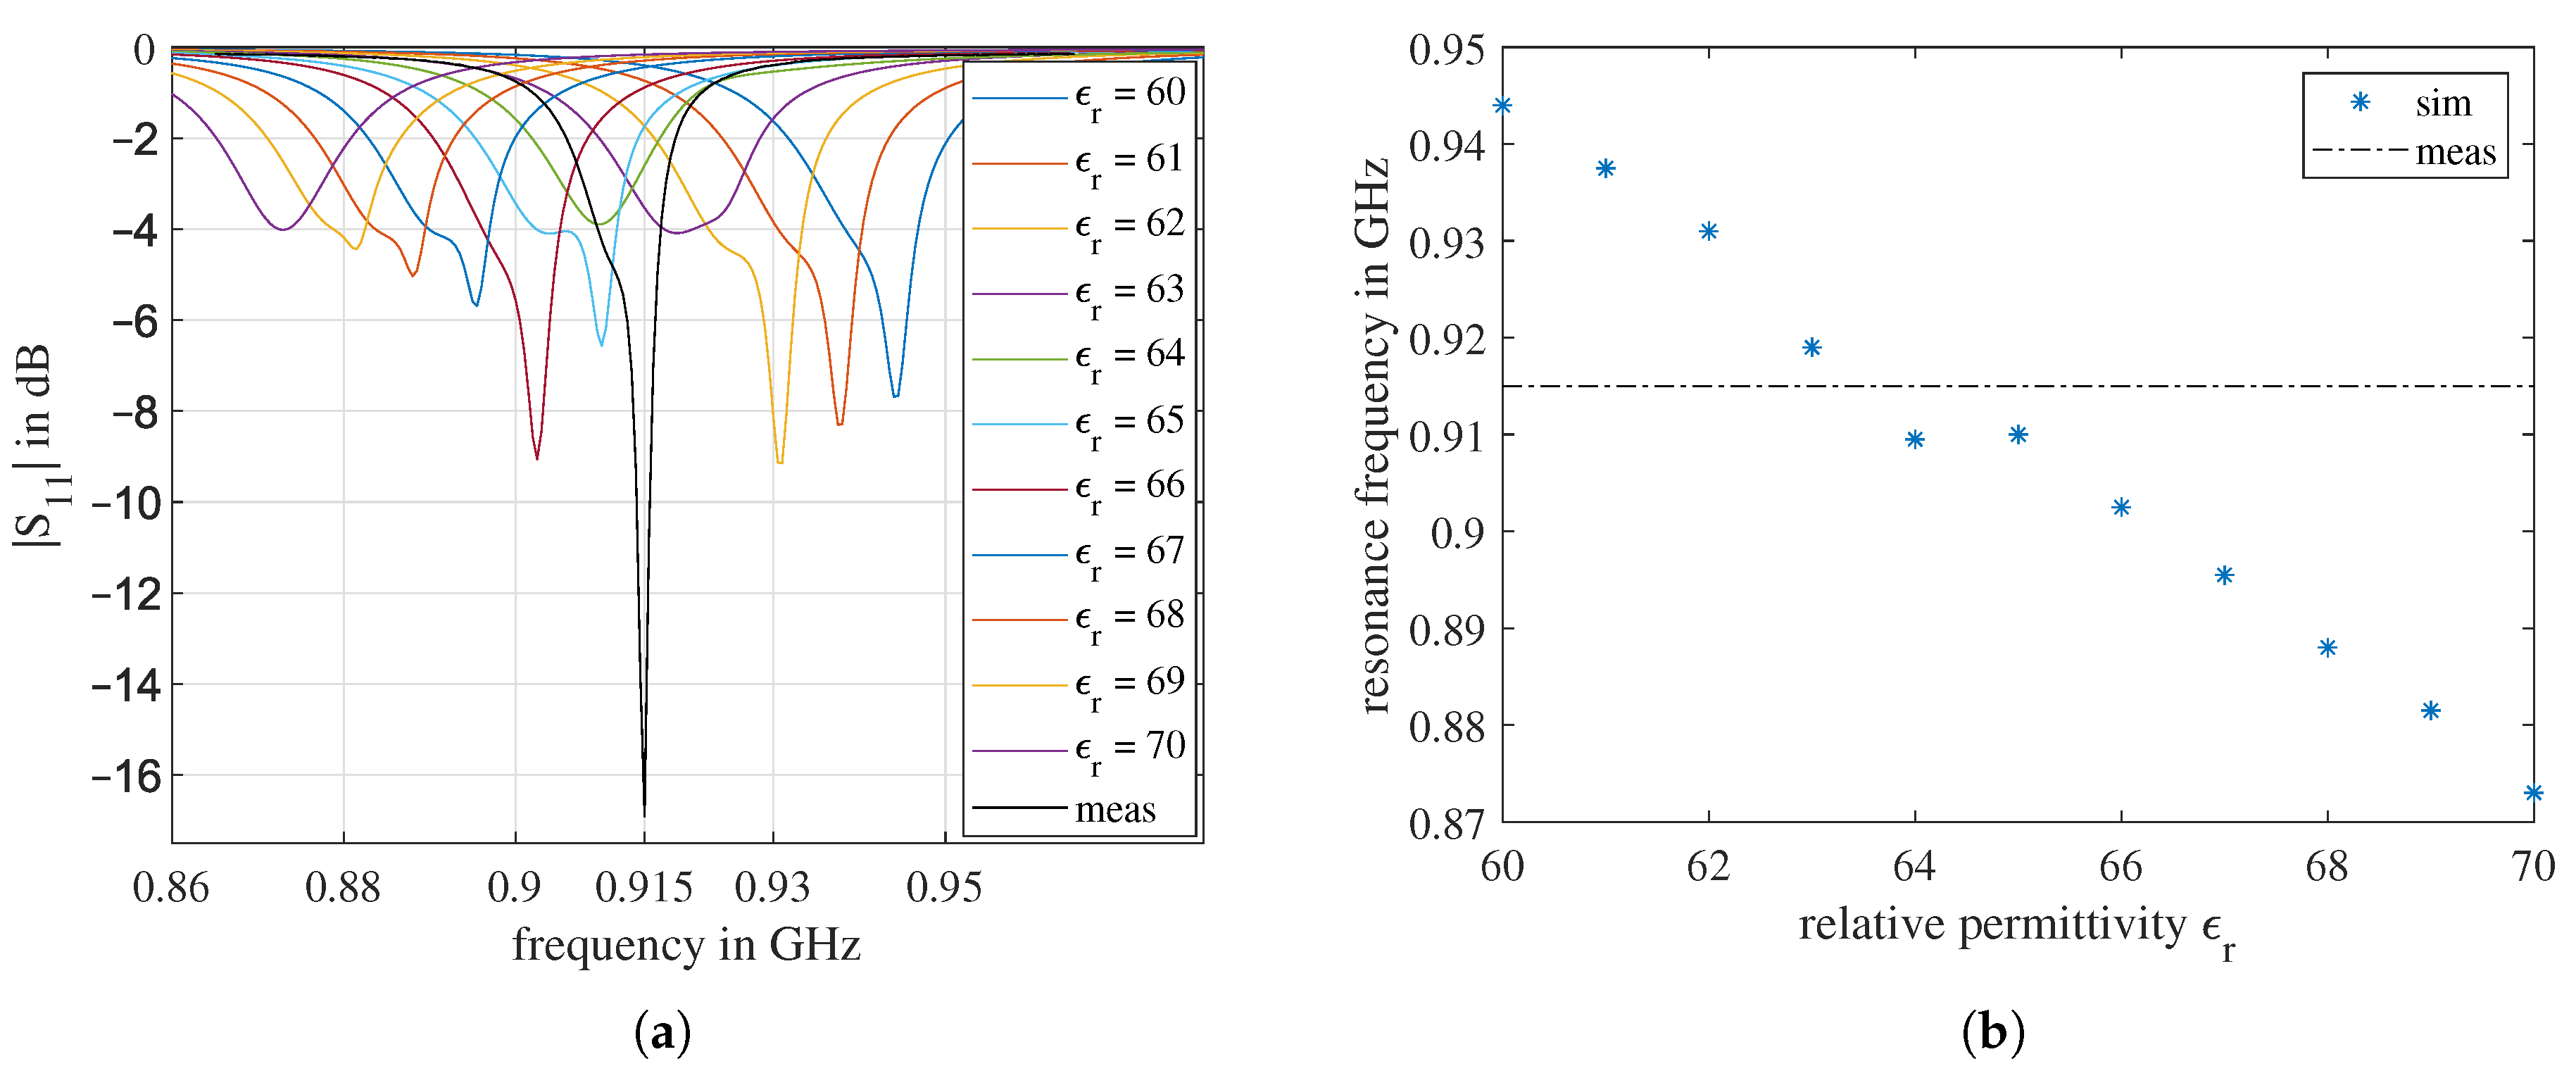
The center frequency given in the data sheet is 915 MHz, which was also confirmed by the network analyzer measurement: The black curve in
Figure 3a shows the magnitude of the
coefficient of the unmodified antenna.
The propagation speed of electromagnetic waves in a medium depends on the relative permittivity
and the relative permeability
. Since antenna substrates are dielectric materials, the
is always one. The relative permittivity
of the substrate at
915 MHz can be estimated using the equation:
where
L is the longest possible current path on the patch surface, which is approximately the circumference of the patch. For the original patch
20 mm = 80 mm, so that
The exact antenna model in
Figure 2 was established in the HFSS. The
was set as a project variable and swept from 60 to 70. The
curves obtained from the simulation are shown in
Figure 3a. The minima of the
curves are the resonance frequencies
in
Figure 3b. It is easy to conclude from the results that, with increasing
, the antenna resonance frequency decreases. The only exception happens at
. However, in comparison with
Figure 3a, it can be seen that from
to
, a new resonance appears, but the center of the resonating frequency band continuously moves to the left, which matches the tendency.
According to
Figure 3, the
of the antenna substrate at 915 MHz should be between 63 and 64. However, due to dispersion, the
at
GHz has a different value. Since the dielectric dispersion function of this substrate material is unknown, for each simulation, a constant value is used. Therefore, a short-term simulation, fabrication, and measurement in a loop is essential to extract more accurate material parameters. After several iterations, it was observed that simulations with
match the measurement around
GHz best; therefore, we used
for further simulations. The intermediate results of the simulation and measurement iterations to extract this value are tedious and not relevant to the main part of this work; thus, the description of this part is omitted.
2.3. Estimate the Necessary Patch Dimensions for Air-Coupled Scenarios
In order to increase the resonance frequency from 930 MHz to GHz, the patch size should be reduced. From some initial simulations, we found out that in addition to the patch width , the patch center position xOffset and the width of the diagonal corners’ truncation also have dramatic an impact on the antenna’s resonance frequency .
Thus, we chose these three as key dimension parameters for simulation and analysis, as illustrated in
Figure 4a. It should be emphasized here that, because the pin is built into the substrate, by changing the
xOffset, we are changing the position of the feeding pin relative to the patch center. The
xOffset of the original antenna is 0.
The side view of the antenna simulation model is shown in
Figure 4b. The antenna is surrounded by a
75 mm
3 box. The surface of this box is defined as a radiation boundary. The antenna patch is on the upper surface of the substrate. Therefore, the upper half of the box is the forward wave propagation medium with a relative permittivity of
. The lower half of the box is the backward wave propagation medium, which is air, so the
is always 1. In an air-coupled scenario,
. In the ground-penetrating scenario, depending on the ground material, the
is different and is always larger than 1.
In the air-coupled simulation, the
was swept from 11 to 14 mm, the
xOffset was swept from 2 to 0 mm, and the the
was swept from
to 2 mm. All three parameters were changed with a step size of
mm. In total, there were
iterations in this simulation. The minimum peak of the calculated
curve was defined as the resonance frequency
. The
values of all 140 iterations are summarized in
Figure 5. In five separate boxes, corresponding to five different
xOffset values, the resonance frequency is plotted against the four-color-coded
values. Using seven different symbols, the impact of
is also shown.
As expected, for the same
xOffset and the same
, the resonance frequency
decreases when the
increases. Additionally, in most cases, for the same
, when the
rises, the
also rises. However, no conclusion about the impact of
xOffset on
could be drawn from
Figure 5.
The two horizontal dotted lines in
Figure 5 mark the frequency band between
and
GHz that we were permitted to use for this project. The
values of the simulations with
=
and 13 mm were mainly in this frequency range. Hence, we focused on more simulations for patch widths in this range.
2.4. Estimate the Necessary Patch Dimensions for Ground-Coupled Scenarios
From the literature, it can be found that the relative permittivity of common building materials, such as concrete and bricks, depends on age and RF. For the frequency range that we are working in, the relative permittivity of those materials varies from 2 to 9 [
30,
35,
36,
37]. To simplify the problem, we assumed that the
of the ground material is constant in the frequency range of interest and repeated the simulations from
Section 2.3 for
, and 6, respectively. A summary of the resonance frequency depending on the three key dimension parameters for
is shown in
Figure 6. The results of
and 6 can be found in
Appendix A,
Figure A1. Compared to
Figure 5, the resonance frequencies of all the iterations were lower when the antenna was touching the ground. For the ground material of
, the results of
mm exhibited resonance frequencies closest to
GHz.
2.5. Increase the Bandwidth
There are many techniques for increasing the antenna bandwidth. We researched the following techniques.
2.5.1. Bandwidth Extension by Tuning the Geometric Parameters and Feeding Point Position
From the simulation in
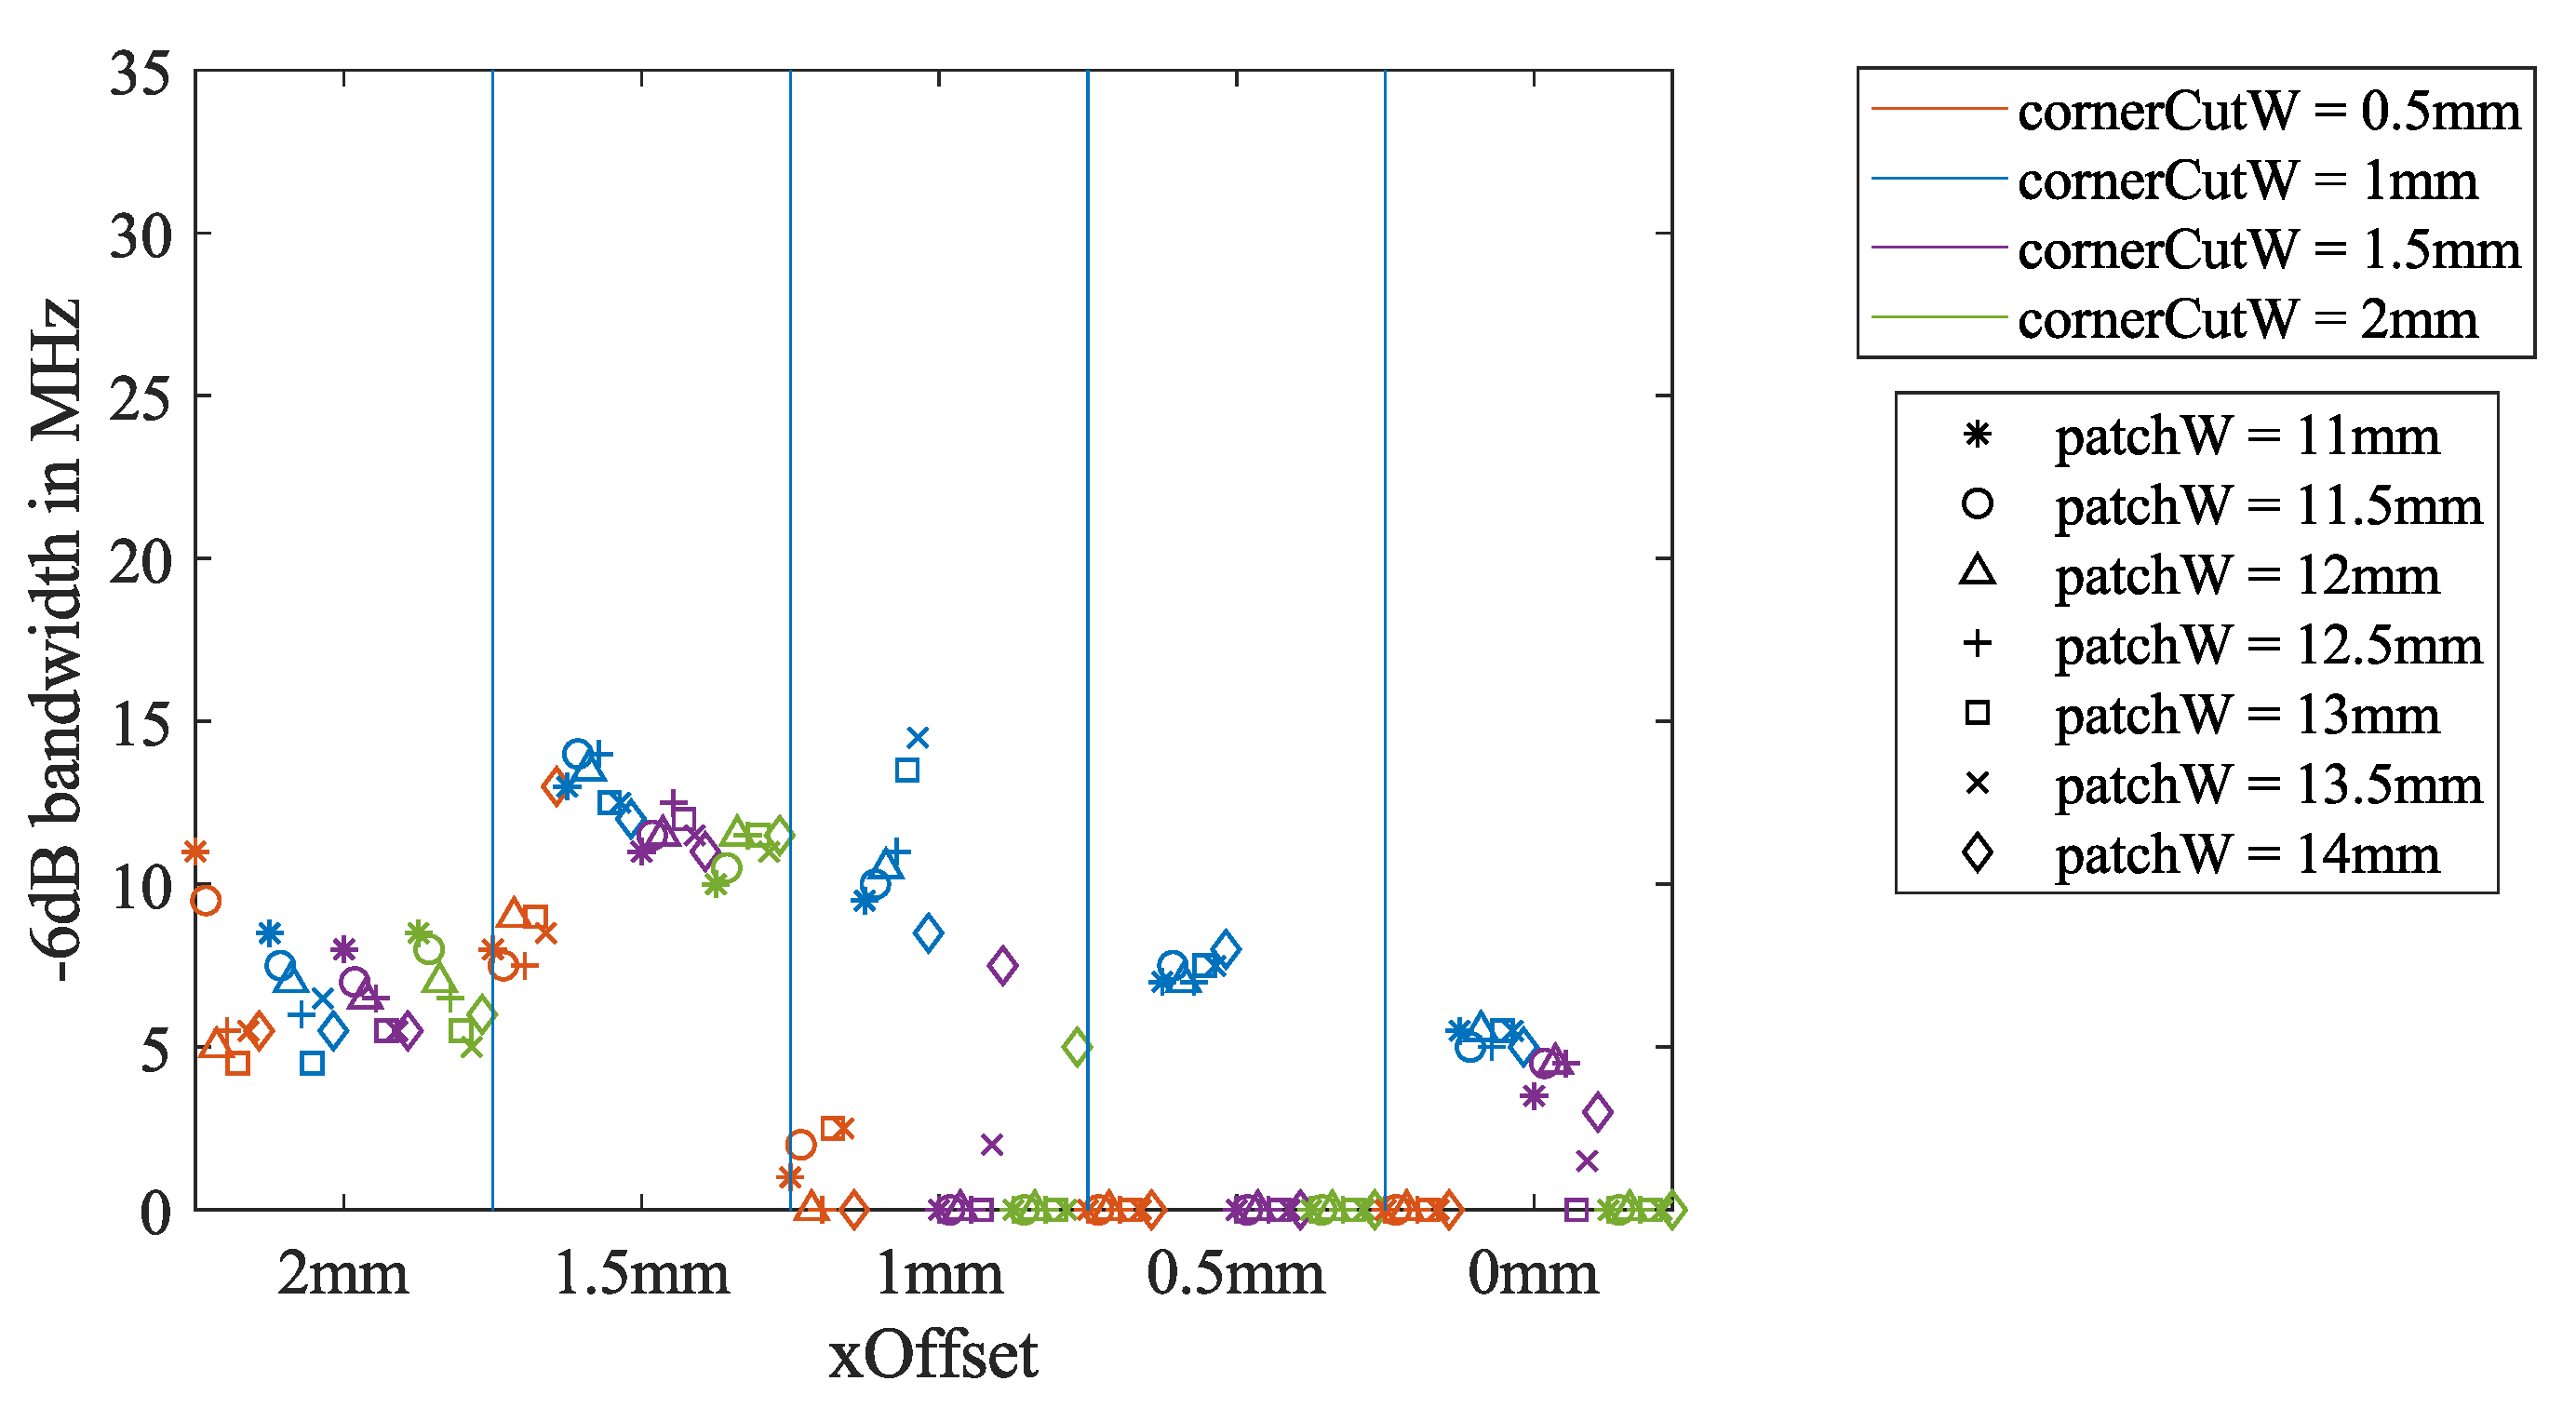
Section 2.3, the influence of the three key dimension parameters on the return loss bandwidth could be analyzed as well. The
dB bandwidth is summarized in
Figure 7, and the
dB bandwidth is summarized in
Figure 8. For
xOffset = 2 and
mm, the
dB bandwidth is reduced when the
increases. For
xOffset =
mm, the relationship is the opposite. Other dependencies of the bandwidth on the three parameters are hard to identify.
For the dB bandwidth, the inverse proportionality to can hardly be observed from the xOffset= 2 mm section. For xOffset = 1, , and 0 mm, many iterations have no dB bandwidth. However, all of the blue markers for 1 mm have the dB bandwidth in all of the xOffset sections. In addition, the blue markers have the largest dB bandwidth for xOffset = and 1 mm.
The dependency of the return loss bandwidth on the three key parameters for the ground-coupled scenario with
can be found in
Appendix A,
Figure A2. As shown in
Figure A2b, for
, the iterations with
1 mm also exhibit a relatively broad
dB bandwidth for
xOffset =
mm. For
xOffset = 1 mm, the iterations of
and 2 mm present wider bandwidths than those of
1 mm, but for
=
mm, with which the resonance frequency is closest to
GHz, the difference is very small. Thus, we define
=
mm and
1 mm and choose
xOffset =
and 1 mm for further comparison.
In
Figure 9, eight return loss curves from the simulations described in
Section 2.3 and
Section 2.4 are presented. The results for
xOffset =
mm are in blue and those for 1 mm are in red. It is common to both cases that, when the ground material
increases, the antenna resonance is enhanced and the resonance frequency decreases. Even though the bandwidth of
xOffset =
mm is always wider, the two resonances are far from each other in comparison to the
xOffset = 1 mm iterations. For
xOffset = 1 mm, the two resonances are close enough and sufficient to produce one enhanced continuous bandwidth. A continuous bandwidth allows the radar to be operated as an SFCW radar with a flexible frequency step choice. Therefore, we choose
xOffset = 1 mm for further optimization.
2.5.2. Bandwidth Extension Using Cuts on the Patch Edges
Adding small cuts on the patch edges could increase the current path length and, thus, decrease the fundamental resonance frequency. This is the same principle as that for the fractal antennas [
18]. The cuts may also introduce some neighboring resonances of the antenna; therefore, we systematically add cuts on the antenna patch edges and analyze if the bandwidth improves.
As shown in
Figure 10, we add two cuts on each edge. For the upper edge, one cut is located in the middle, and the second one is in the middle of the left half of the edge. The cuts are distributed symmetrically around the patch center. The idea of this design is to keep the circular polarization property of the original design. The width of the cuts is a constant value of
mm; their length is the variable
a and varies from 0 to 3 mm.
The simulation results can be seen in
Figure 11. From the patch with no cuts to the patch with the smallest cuts of
mm, the resonance jumps firstly to a higher frequency, then decreases with increasing
a. The bandwidth remains almost the same until
mm, then starts to grow, and reaches its maximum
dB bandwidth by
mm. Here, the two basic resonances are a slightly apart from each other and almost equally strong. At
3 mm, the first resonance is weakened, and the
dB bandwidth drops. We choose
2 mm to proceed because, for this value, the two resonances are still very close to each other and the useful bandwidth is centered closest to
GHz.
2.5.3. Bandwidth Extension Using a Parasitic Radiator
The bandwidth could be enlarged by adding some parasitic radiators adjacent to the driving element. In [
38], the additional passive radiators were rectangular patches, which had a similar size to that of the active one in the center. It was shown in [
39] that the bandwidth could be broader even when the parasitic elements were gap-coupled to the non-radiating edges of the driving patch. In [
40], the active patch was round, and the parasitic one had a ring shape and encircled the active patch. In [
41], the active patch had an elliptical ring shape and encircled the passive patch. In all of these designs, the parasitic patches were very close to the active patch, and they coupled electromagnetically to the active one through a small gap. In most cases, the parasitic elements had a similar size to that of the driving patch, which means that their resonances were close to each other, but not the same. If all adjacent resonances are close enough to combine, a wider bandwidth can be achieved.
Within the design constraints, a square-shaped ring was selected as the parasitic radiator for this design study. As shown in
Figure 12, two new geometric parameters are defined:
describes the width of the ring and
describes the width of the gap between the original patch and the parasitic ring.
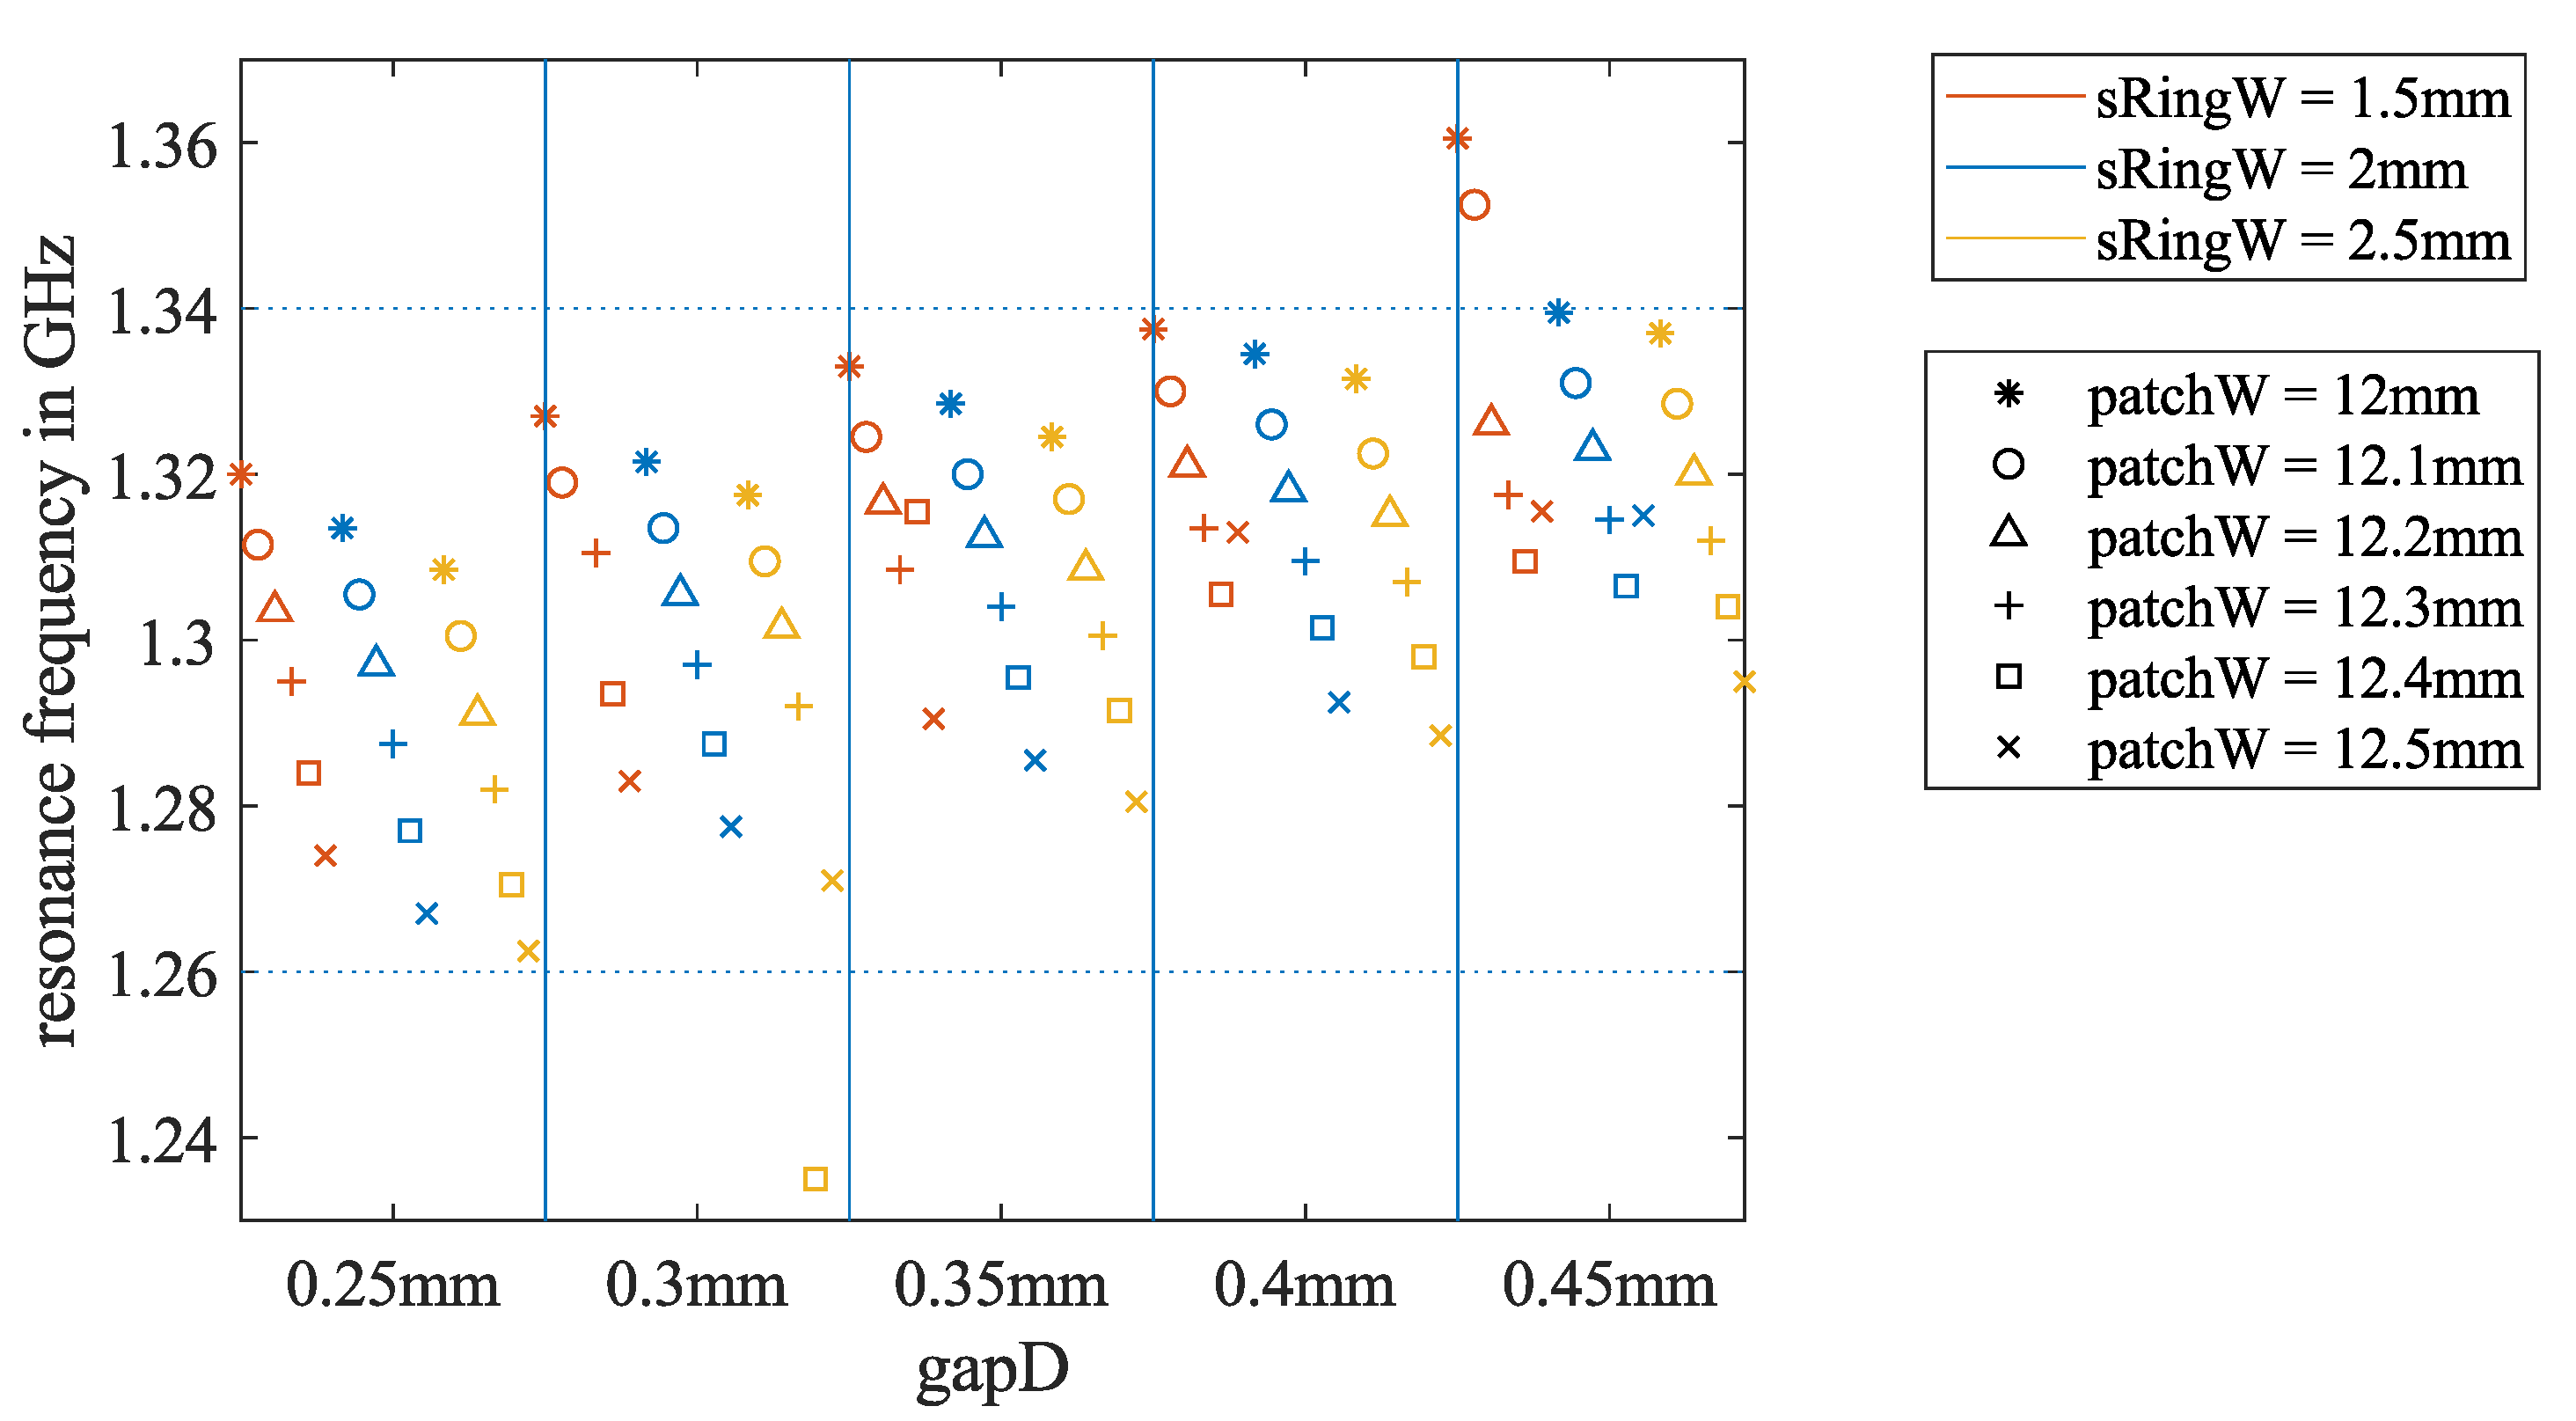
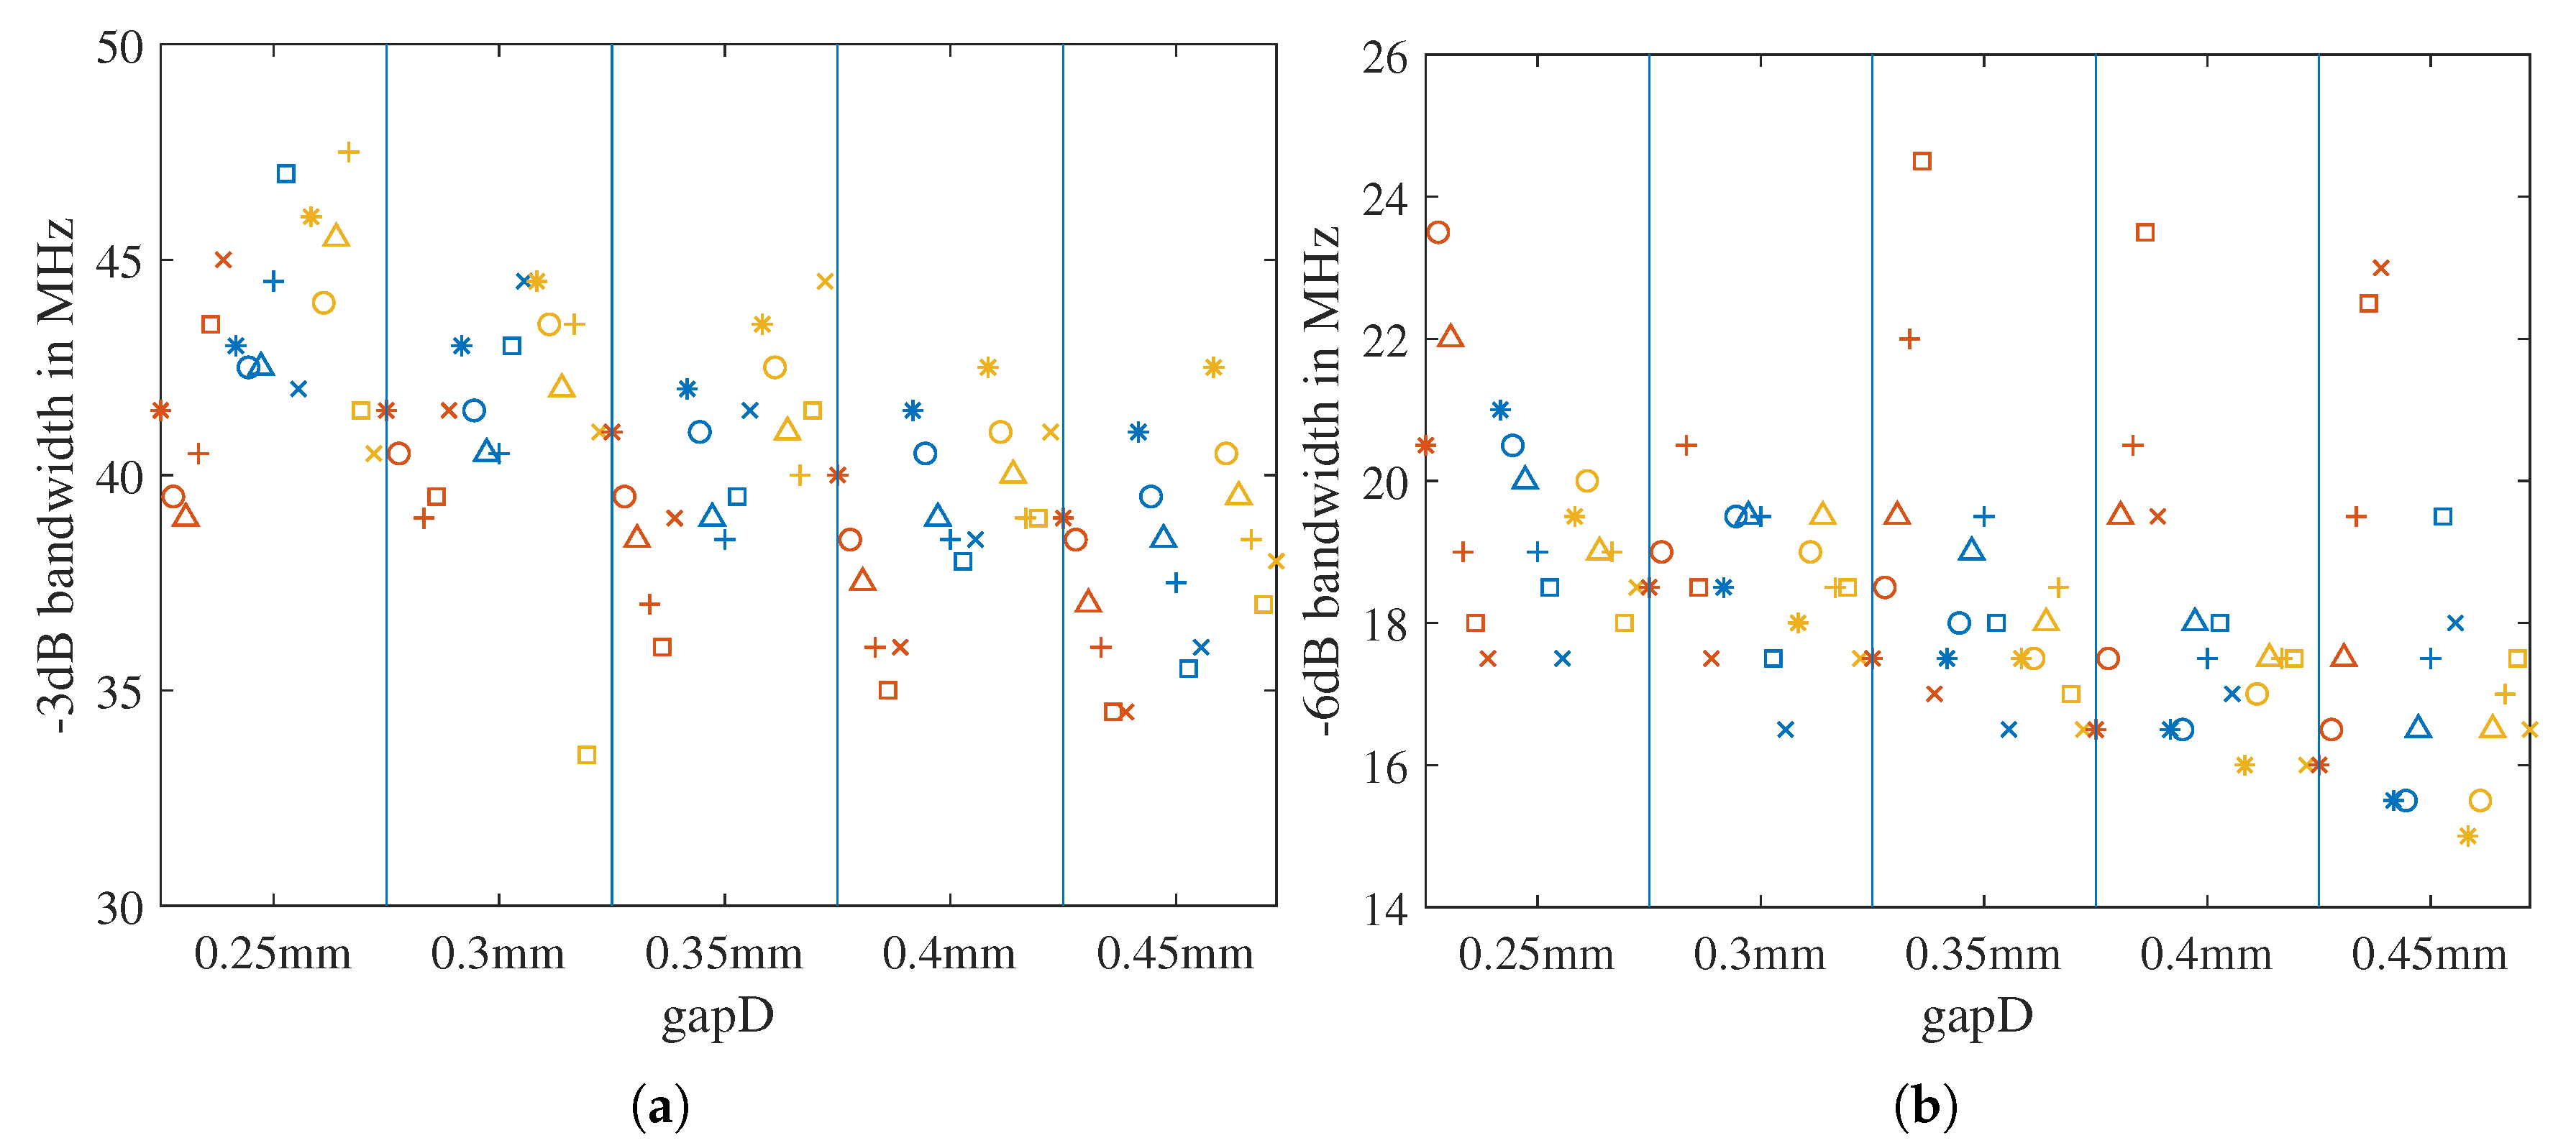
The parametric simulation results can be seen in
Figure 13 and
Figure 14. From the results, we come to the following observations: With increasing gap width
, the resonance frequency
increases, and the bandwidth mainly decreases. With a thicker ring width
, the
drops and the
dB bandwidth increases, but the
dB bandwidth decreases. Considering the advantages and disadvantages for the resonance frequency position and the bandwidth value, we choose
mm,
2 mm, and
mm for the final design.
The main results of applying the three bandwidth improvement techniques are summarized in
Figure 15a, and the exact values are in
Table 1. For the final design, the simulation was repeated for touching a material box with
. As shown in
Figure 15b, the radiating bandwidth of the ground-coupled simulation was shifted to the left in comparison to the air-coupled simulation, as expected. However, for the final design, the
dB bandwidths of both situations were within the granted
GHz band. The bandwidths of the final and original designs are summarized in
Table 2.
2.6. Optimization with a Short-Term Simulation, Fabrication, and Measurement in a Loop
As mentioned in
Section 2.2, due to dielectric dispersion, the relative permittivity of the substrate at the specified
GHz differs from the permittivity at the working frequency 915 MHz of the original antenna. Using a short-term loop of simulation, fabrication, and measurement, almost-realistic material parameters can be derived, and a foundation for more accurate simulations can be set. Moreover, fabrication at an early stage will help researchers learn the limits of accuracy in the fabrication. Delicate simulation steps beyond the accuracy of fabrication cannot be implemented and verified.
One possibility to quickly and accurately modify an existing antenna is by using laser milling. Our institute is equipped with an ultraviolet pulse laser marking machine from Trumpf: a TruMark Station 5000 combined with a TruMark 6330 laser. On the part of the antenna patch that was irradiated by the pulse laser, the silver was oxidized, turned black, and lost its conductivity, as can be seen in the specimen on the right-hand side in
Figure 16. The main parameters of the applied laser milling process are listed in
Table 3.


