
Nano-Scale Stiffness and Collagen Fibril Deterioration: Probing the Cornea Following Enzymatic Degradation Using Peakforce-QNM AFM


Abstract
1. Introduction
2. Materials and Methods
2.1. Tissue Samples
2.2. Enzymatic Treatment
2.3. PFQNM-AFM Method
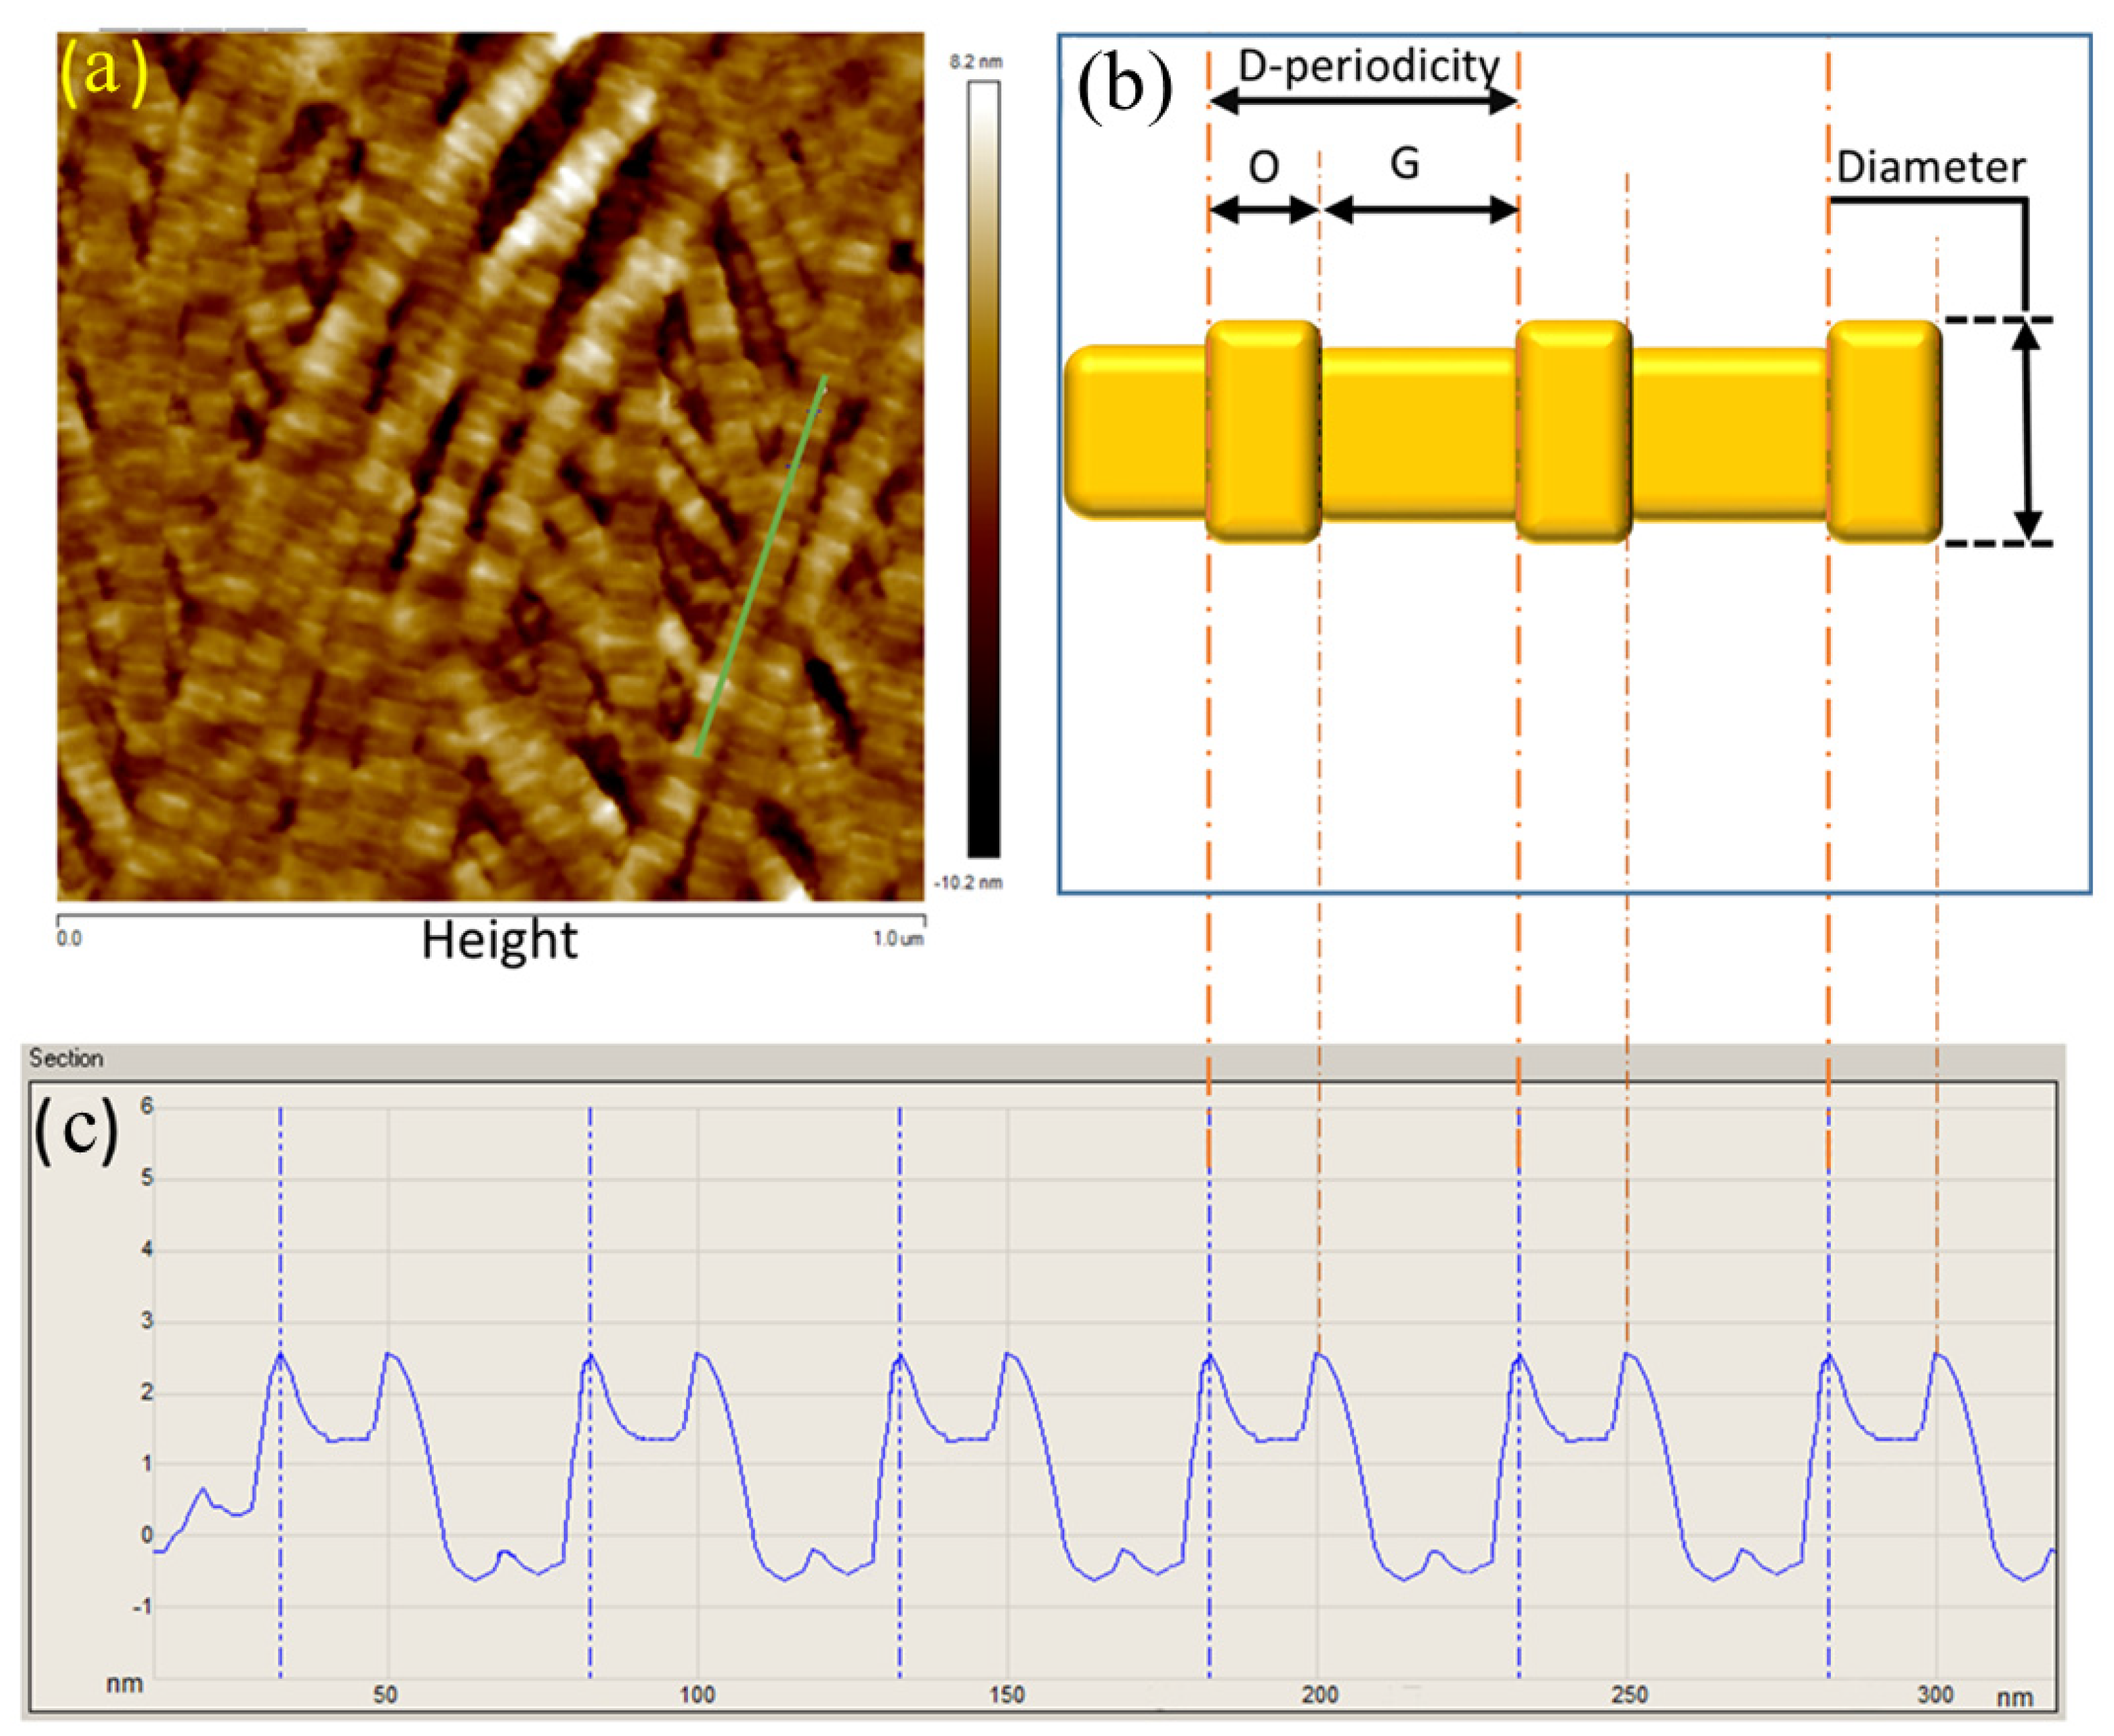
2.4. Collagen Fibril Analysis
2.5. Glycosaminoglycans Quantification
2.6. Data analysis and Statistics
3. Results
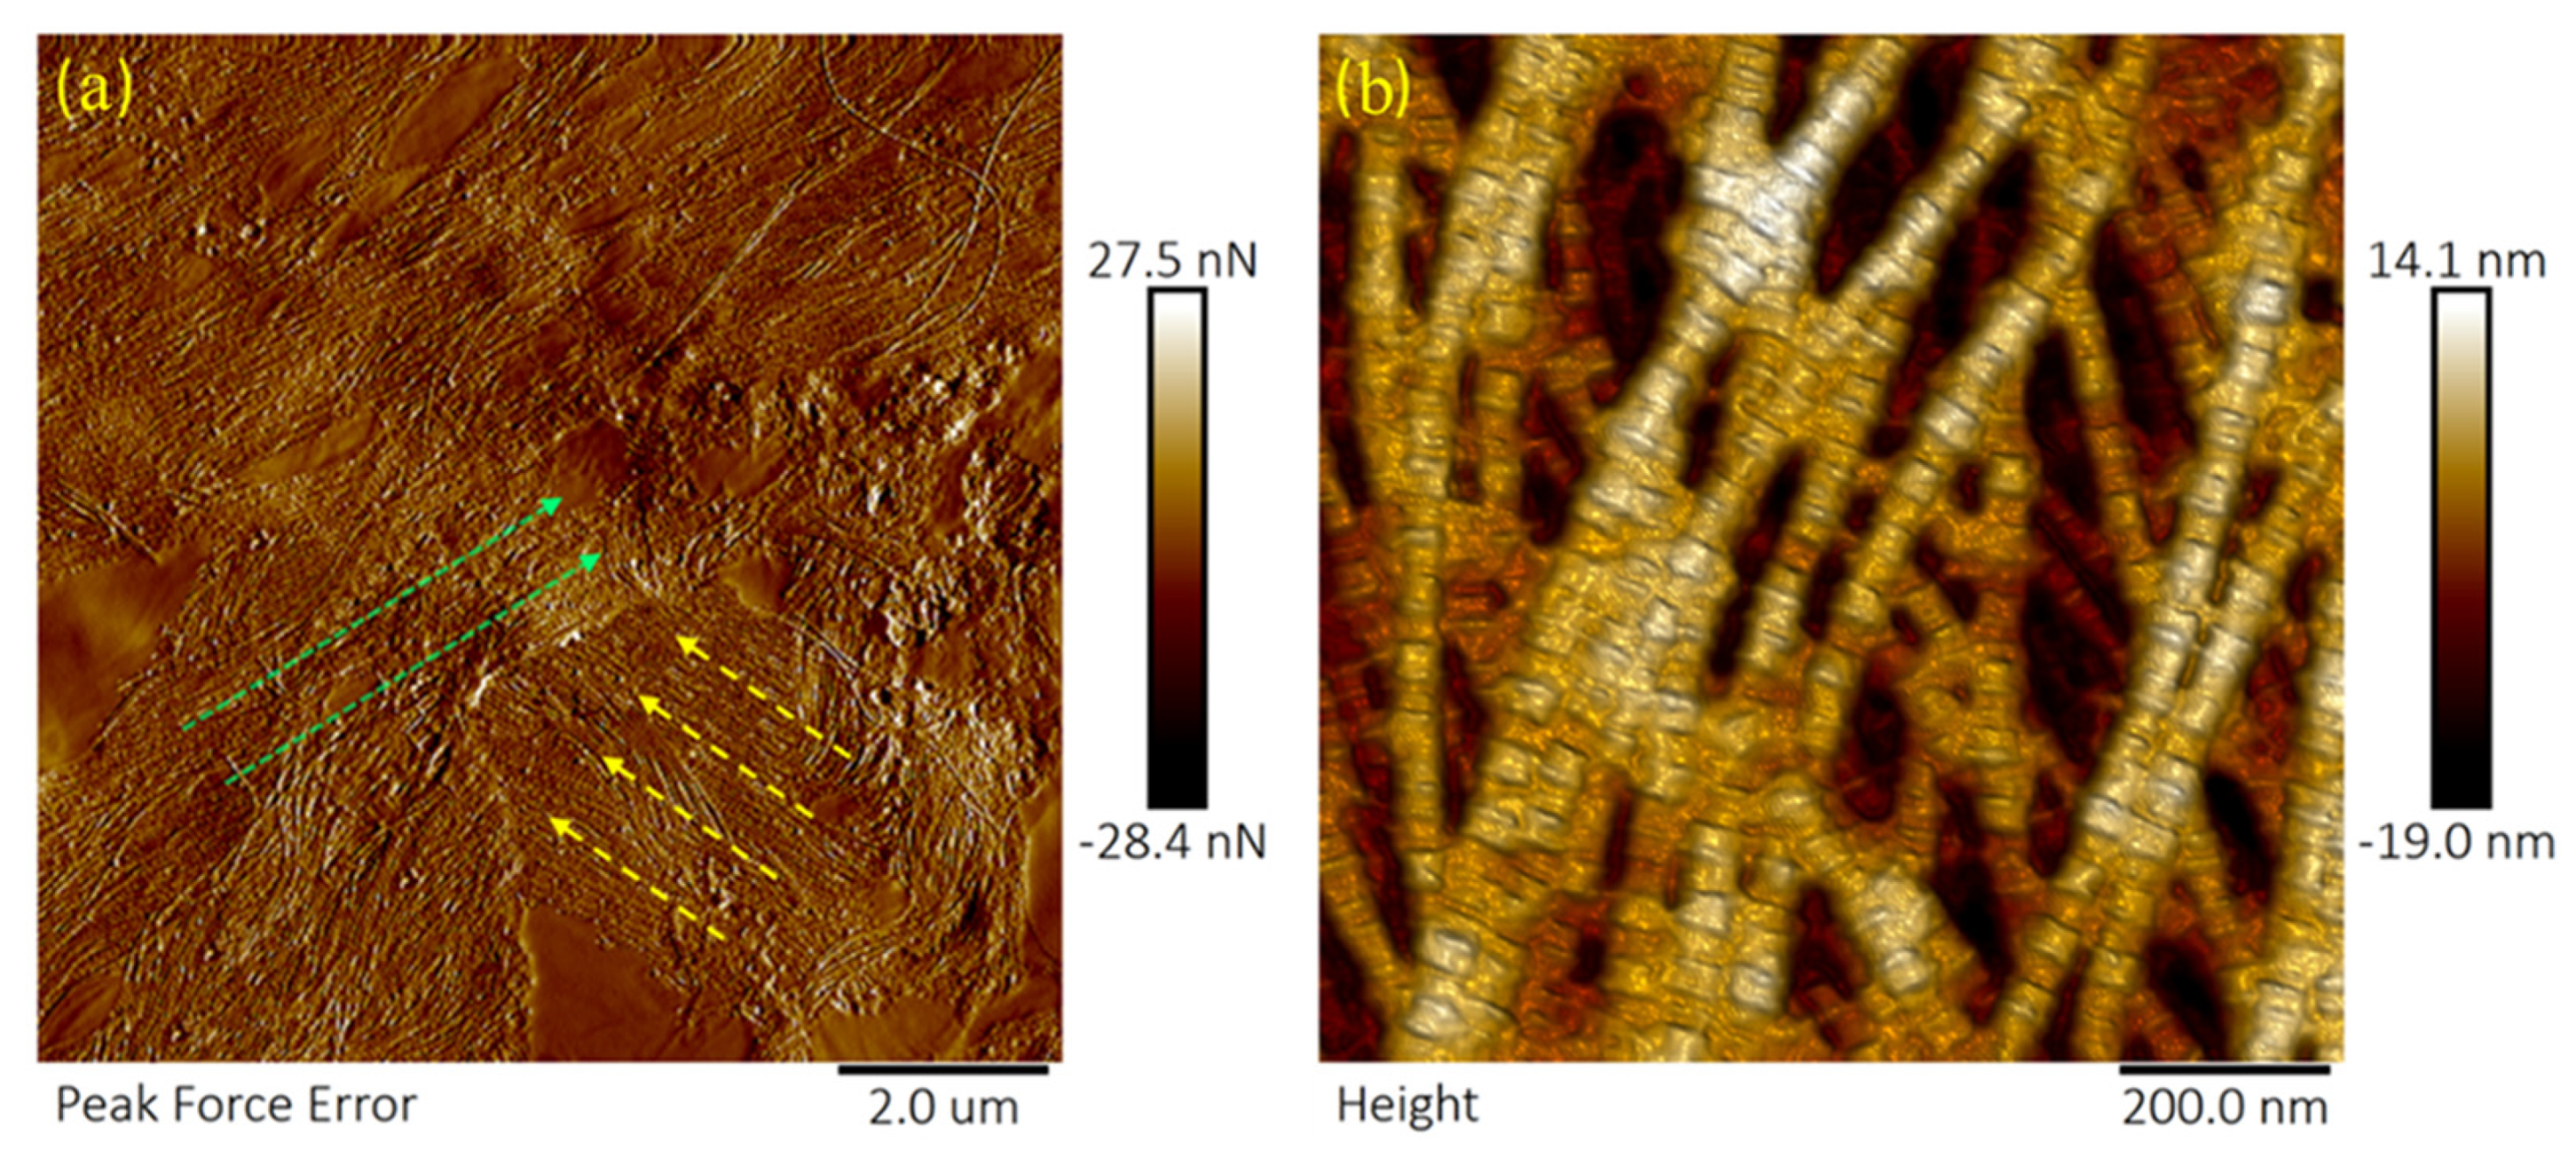
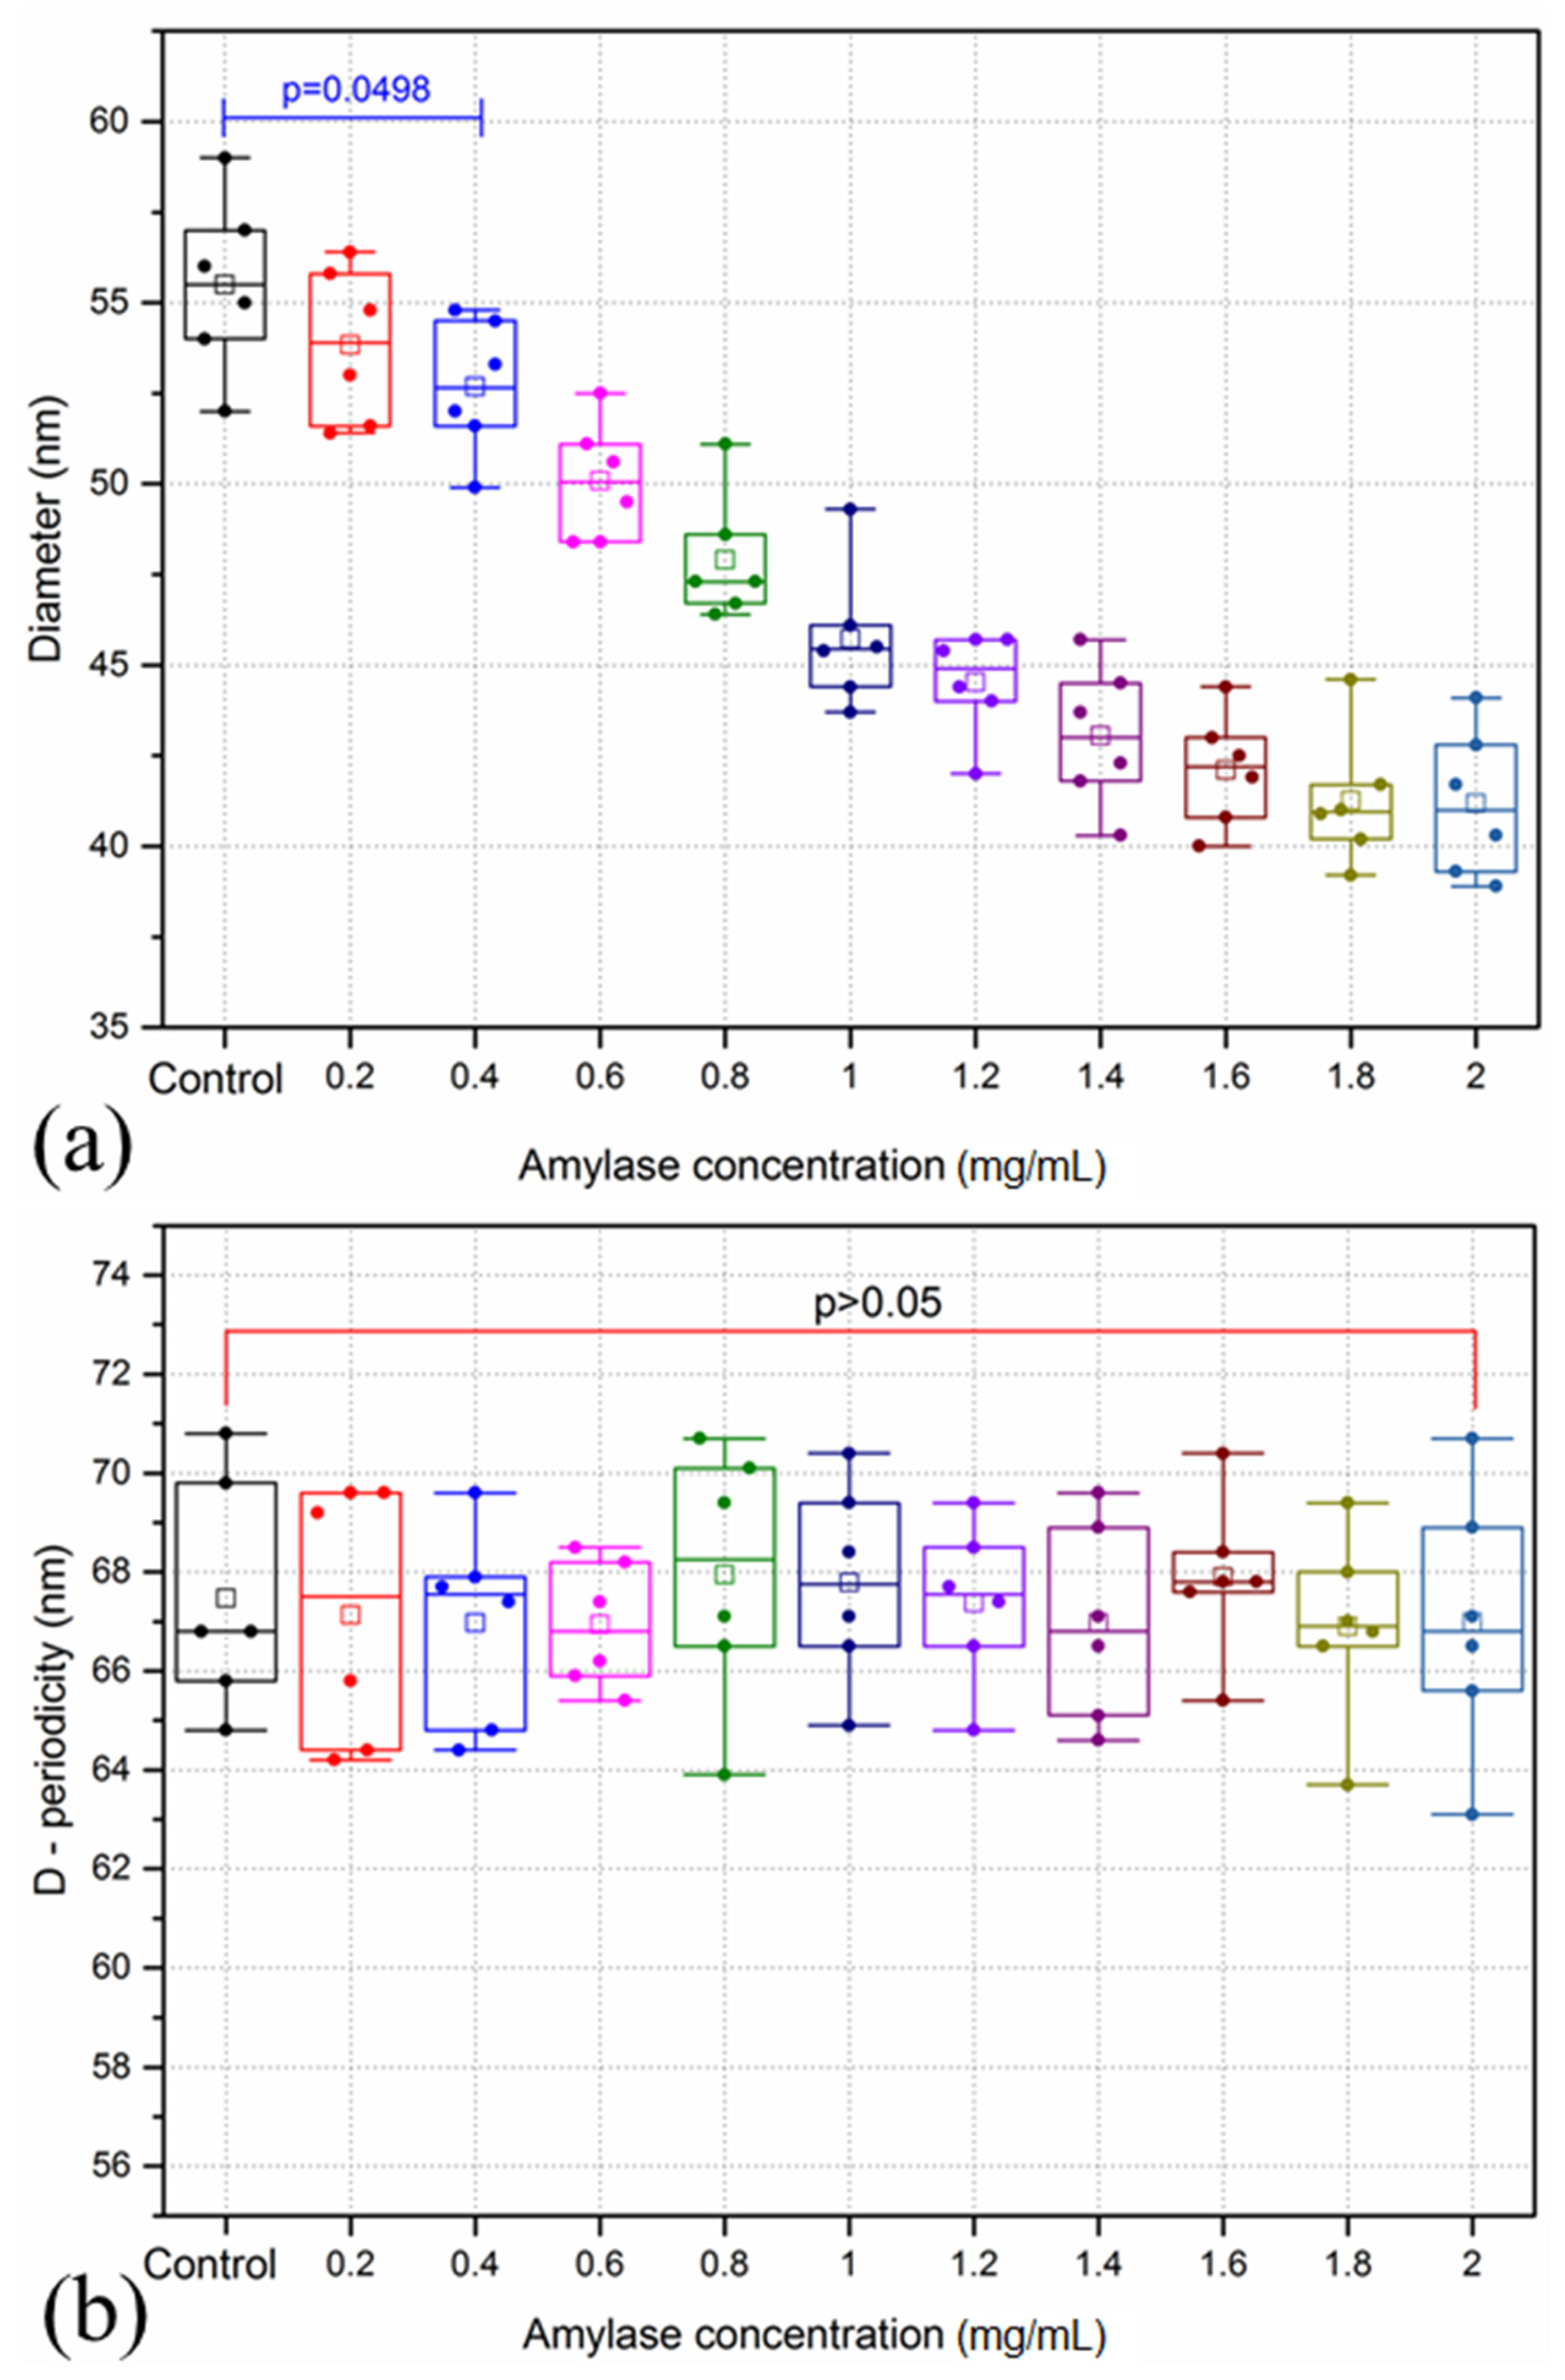
3.1. Amylase Group
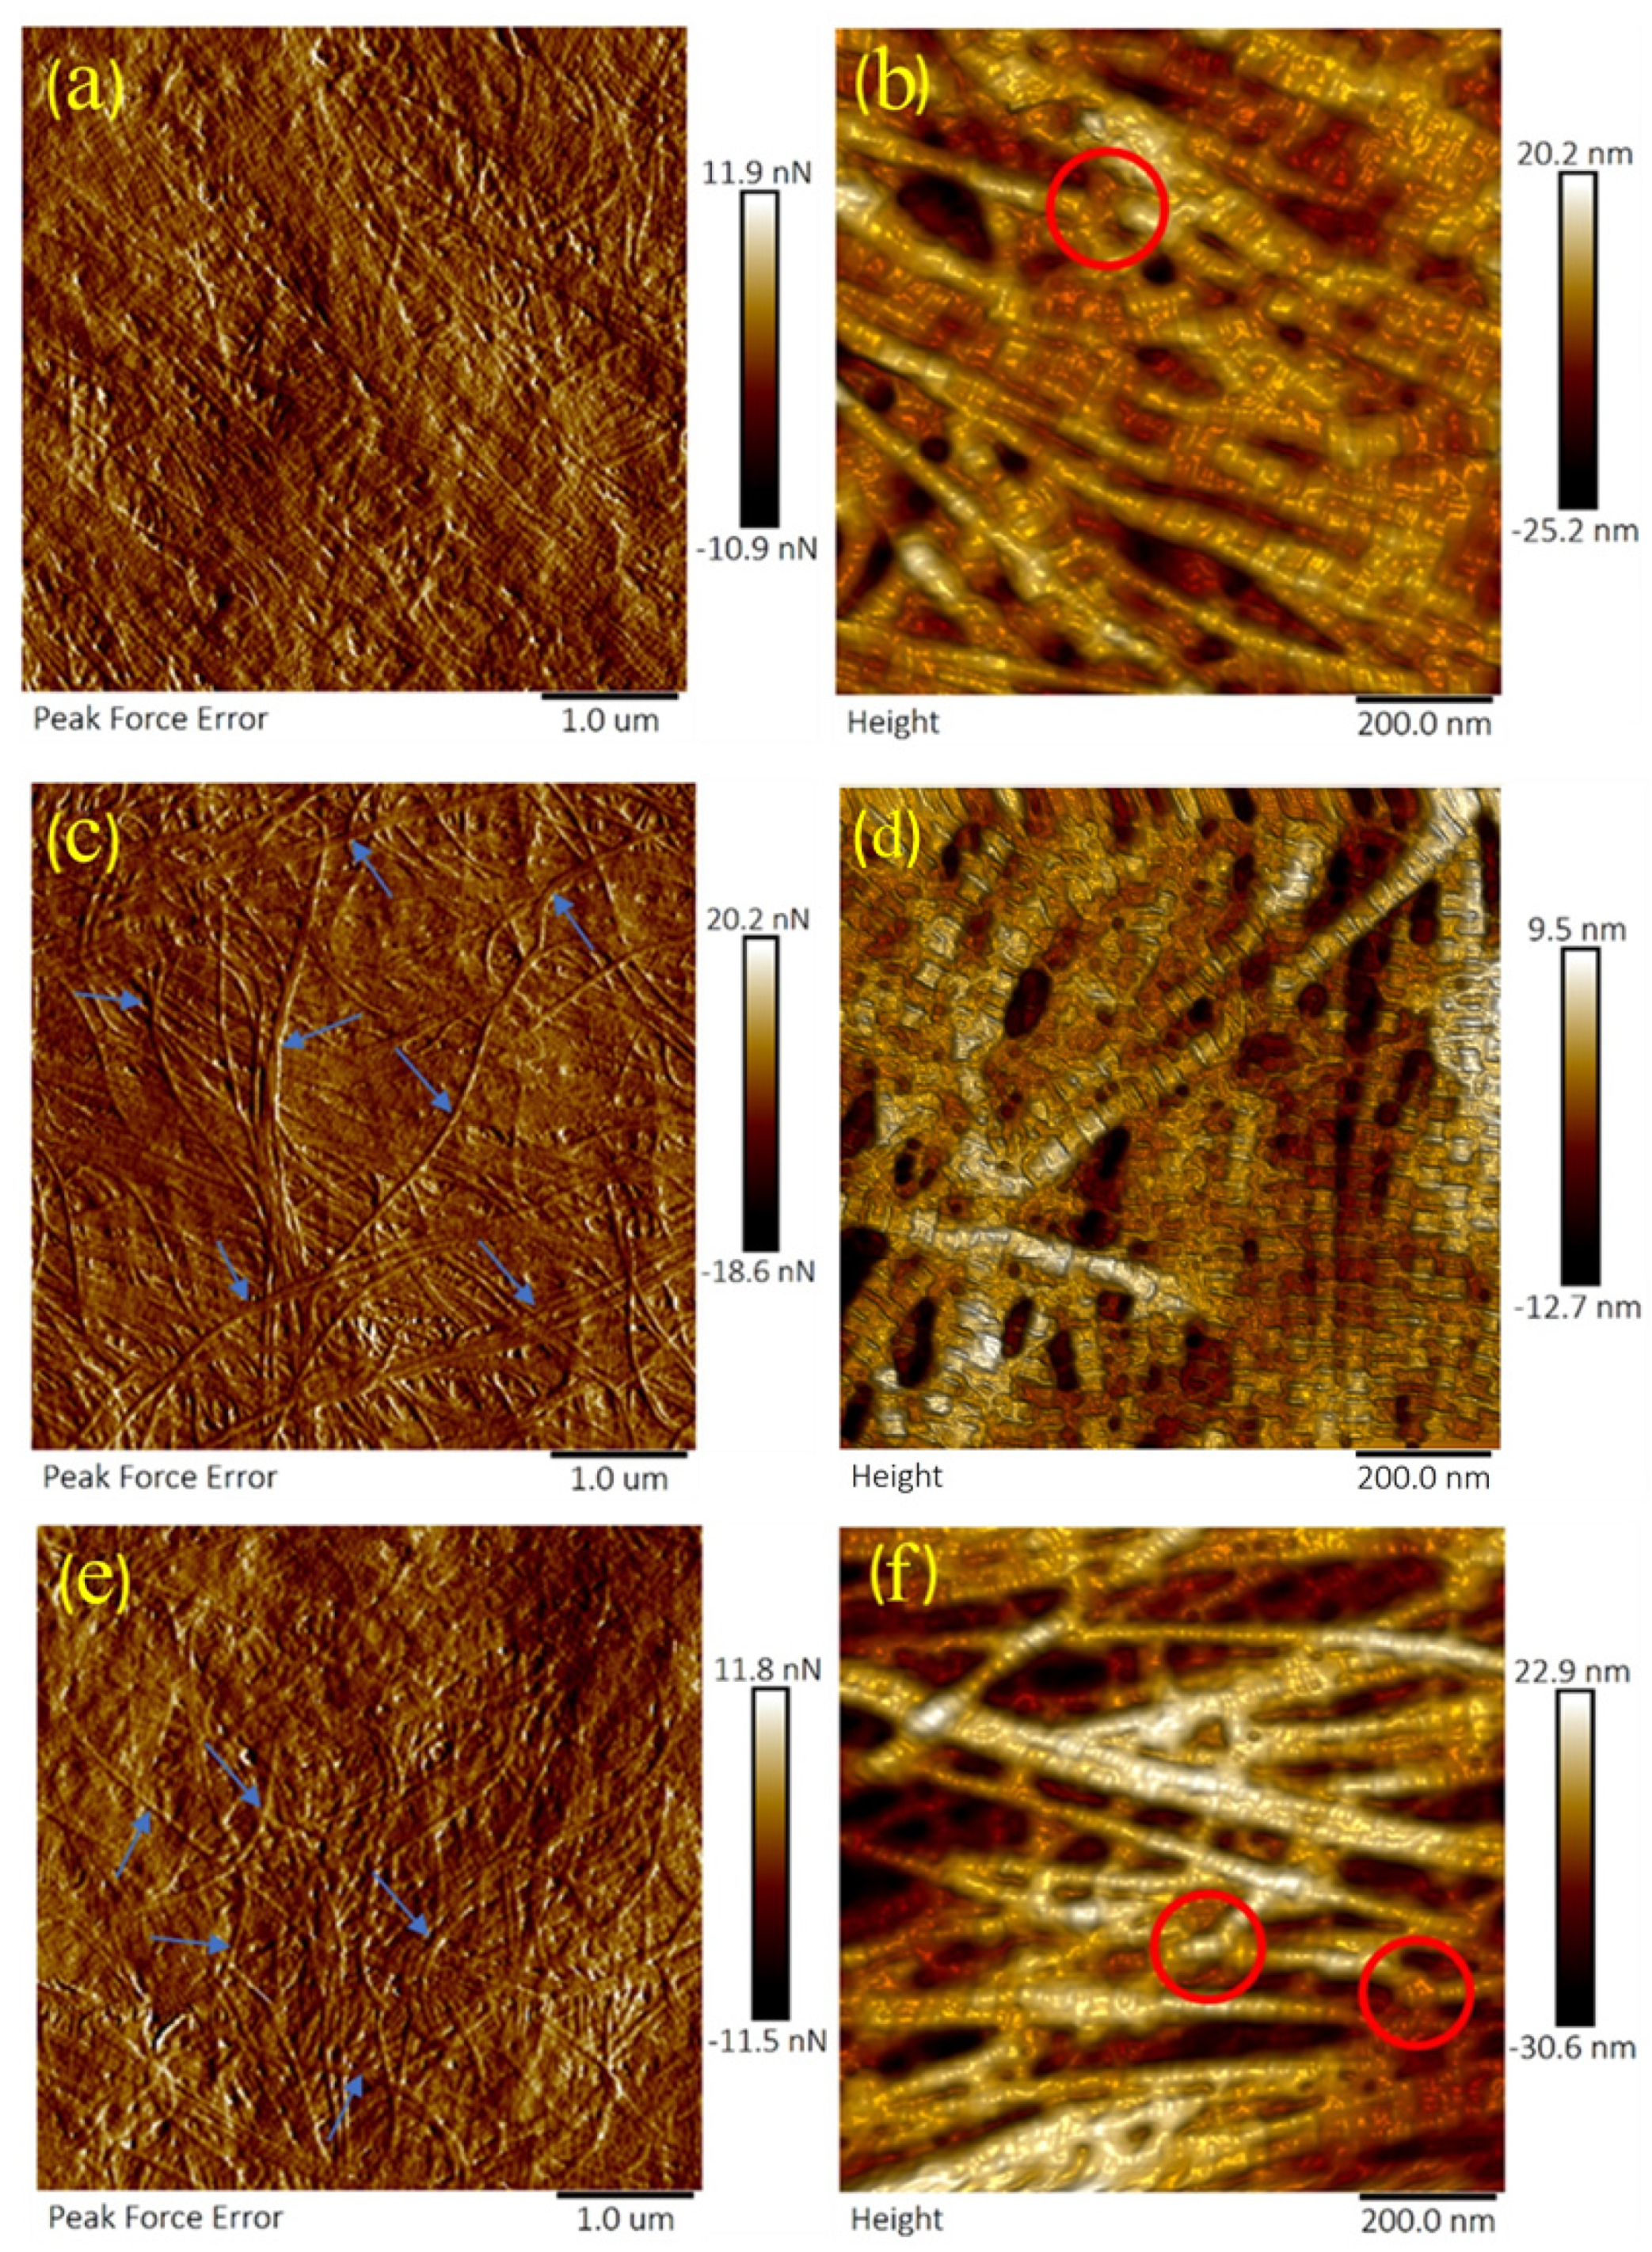
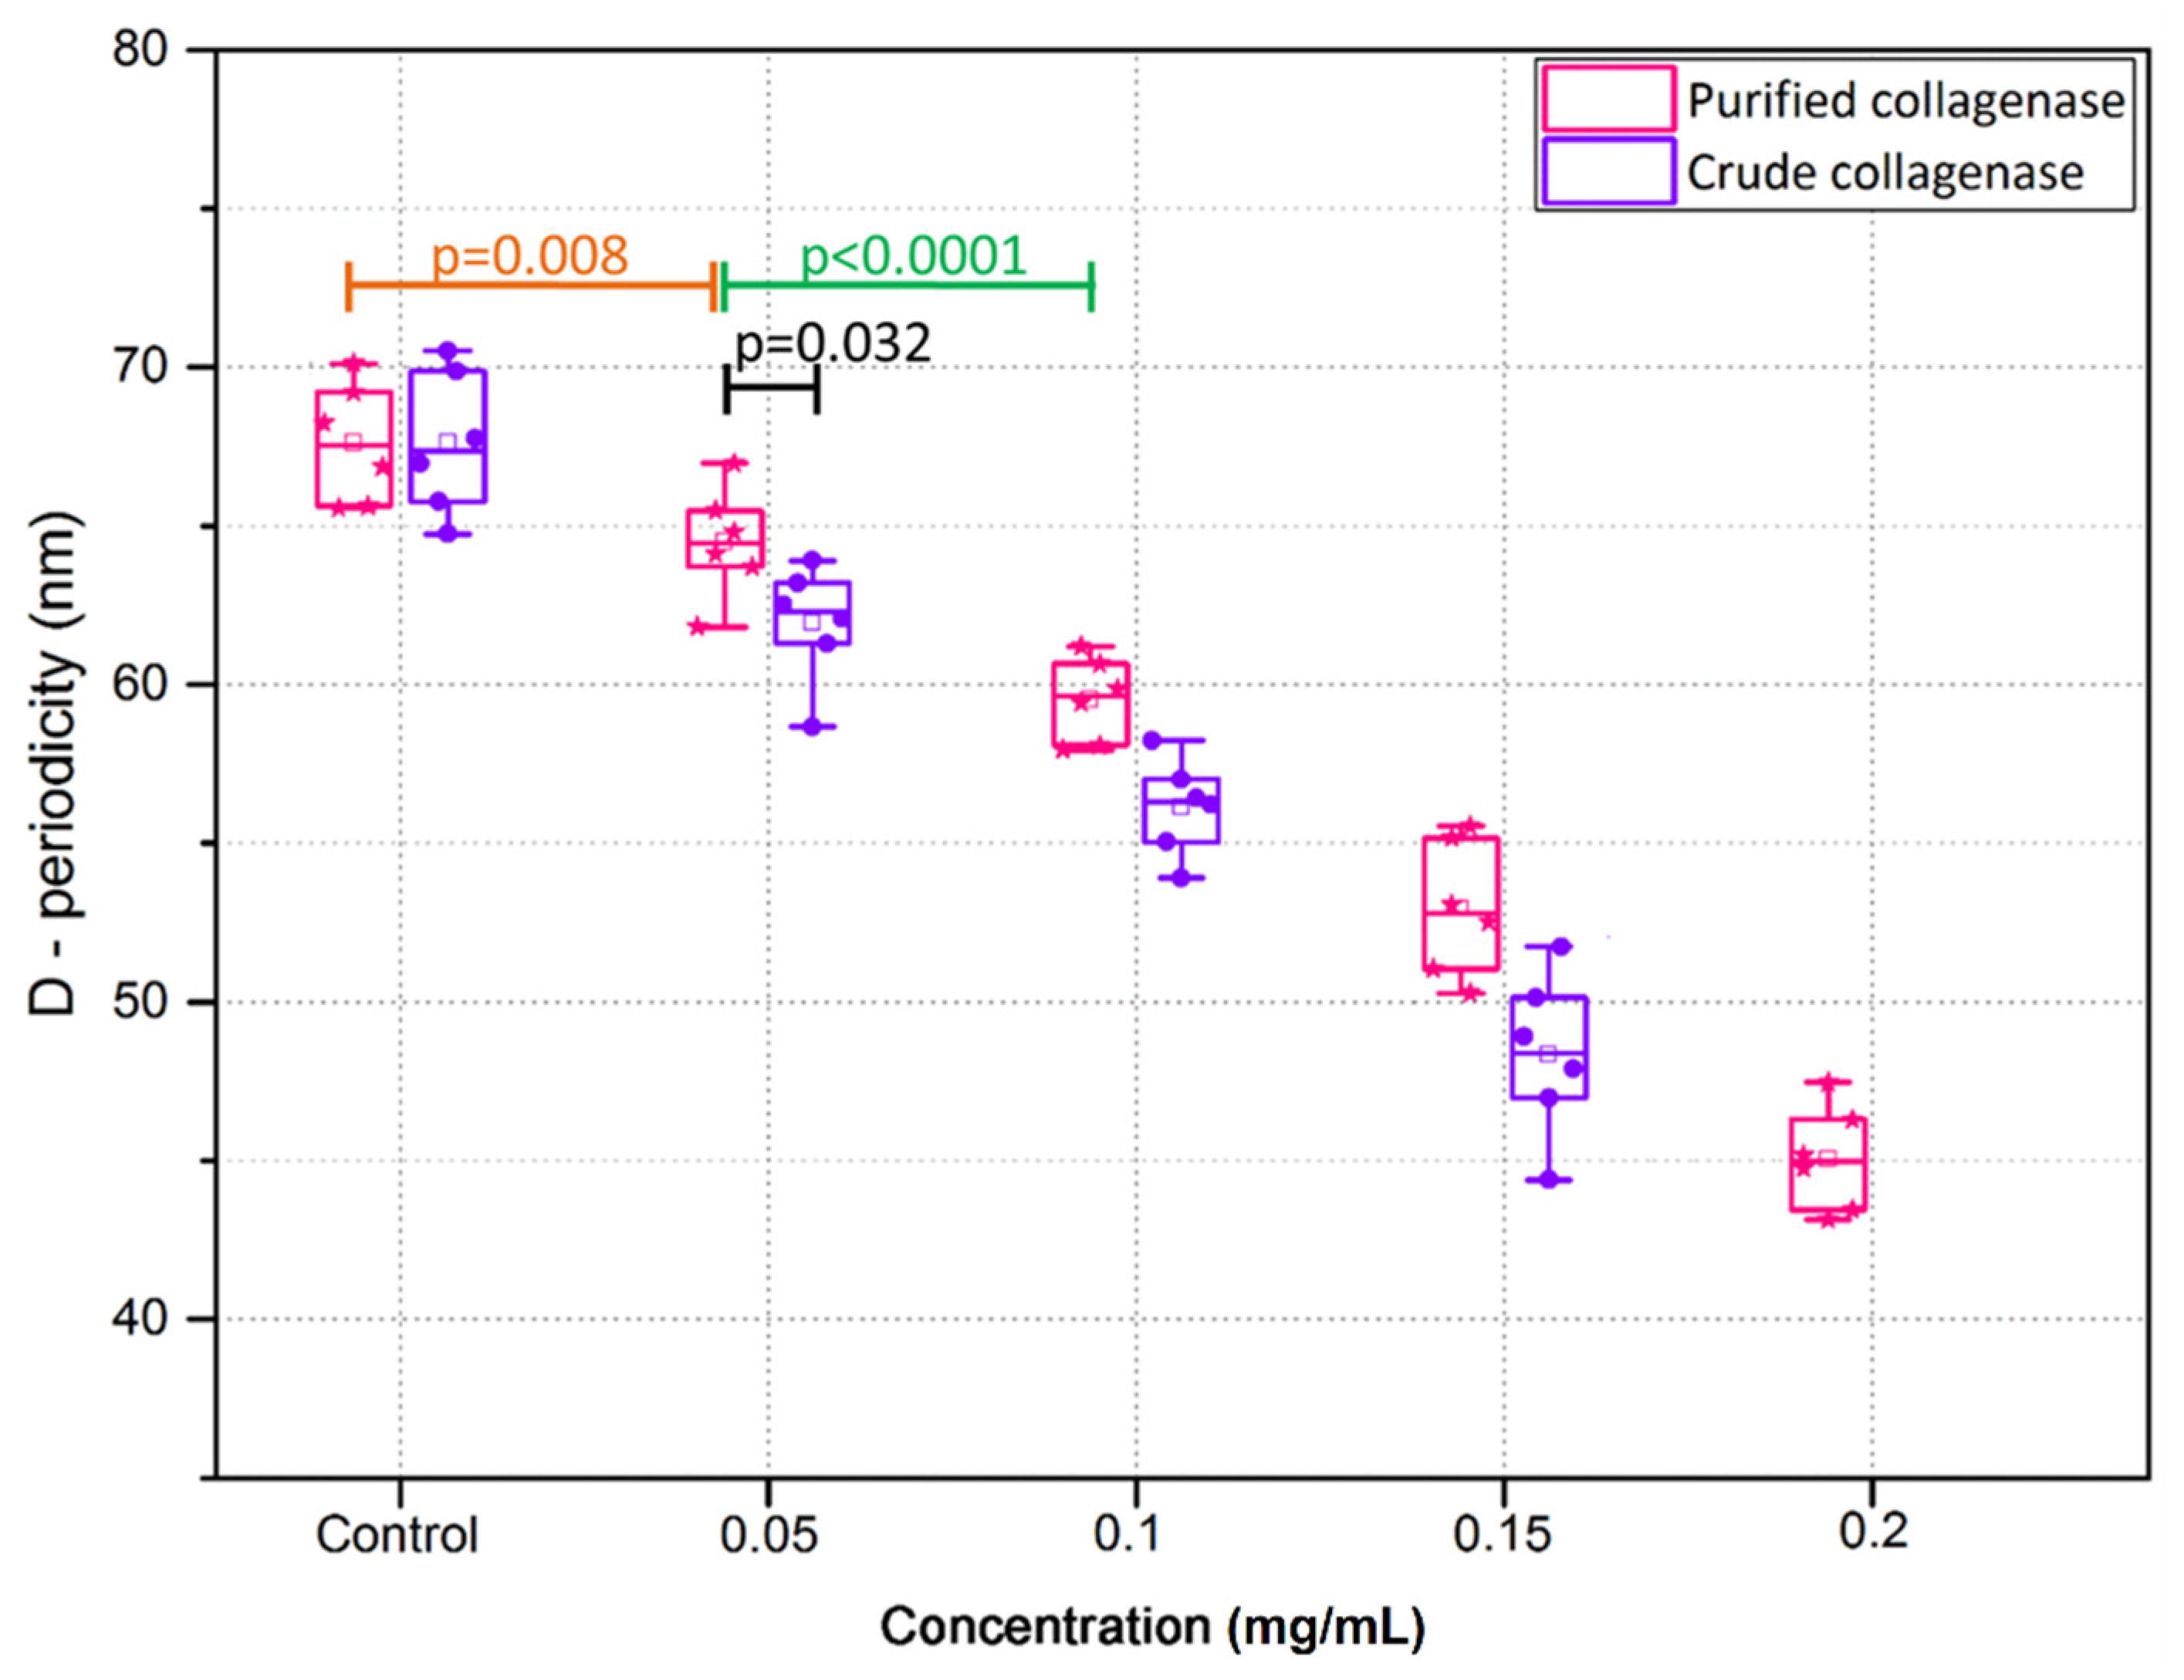
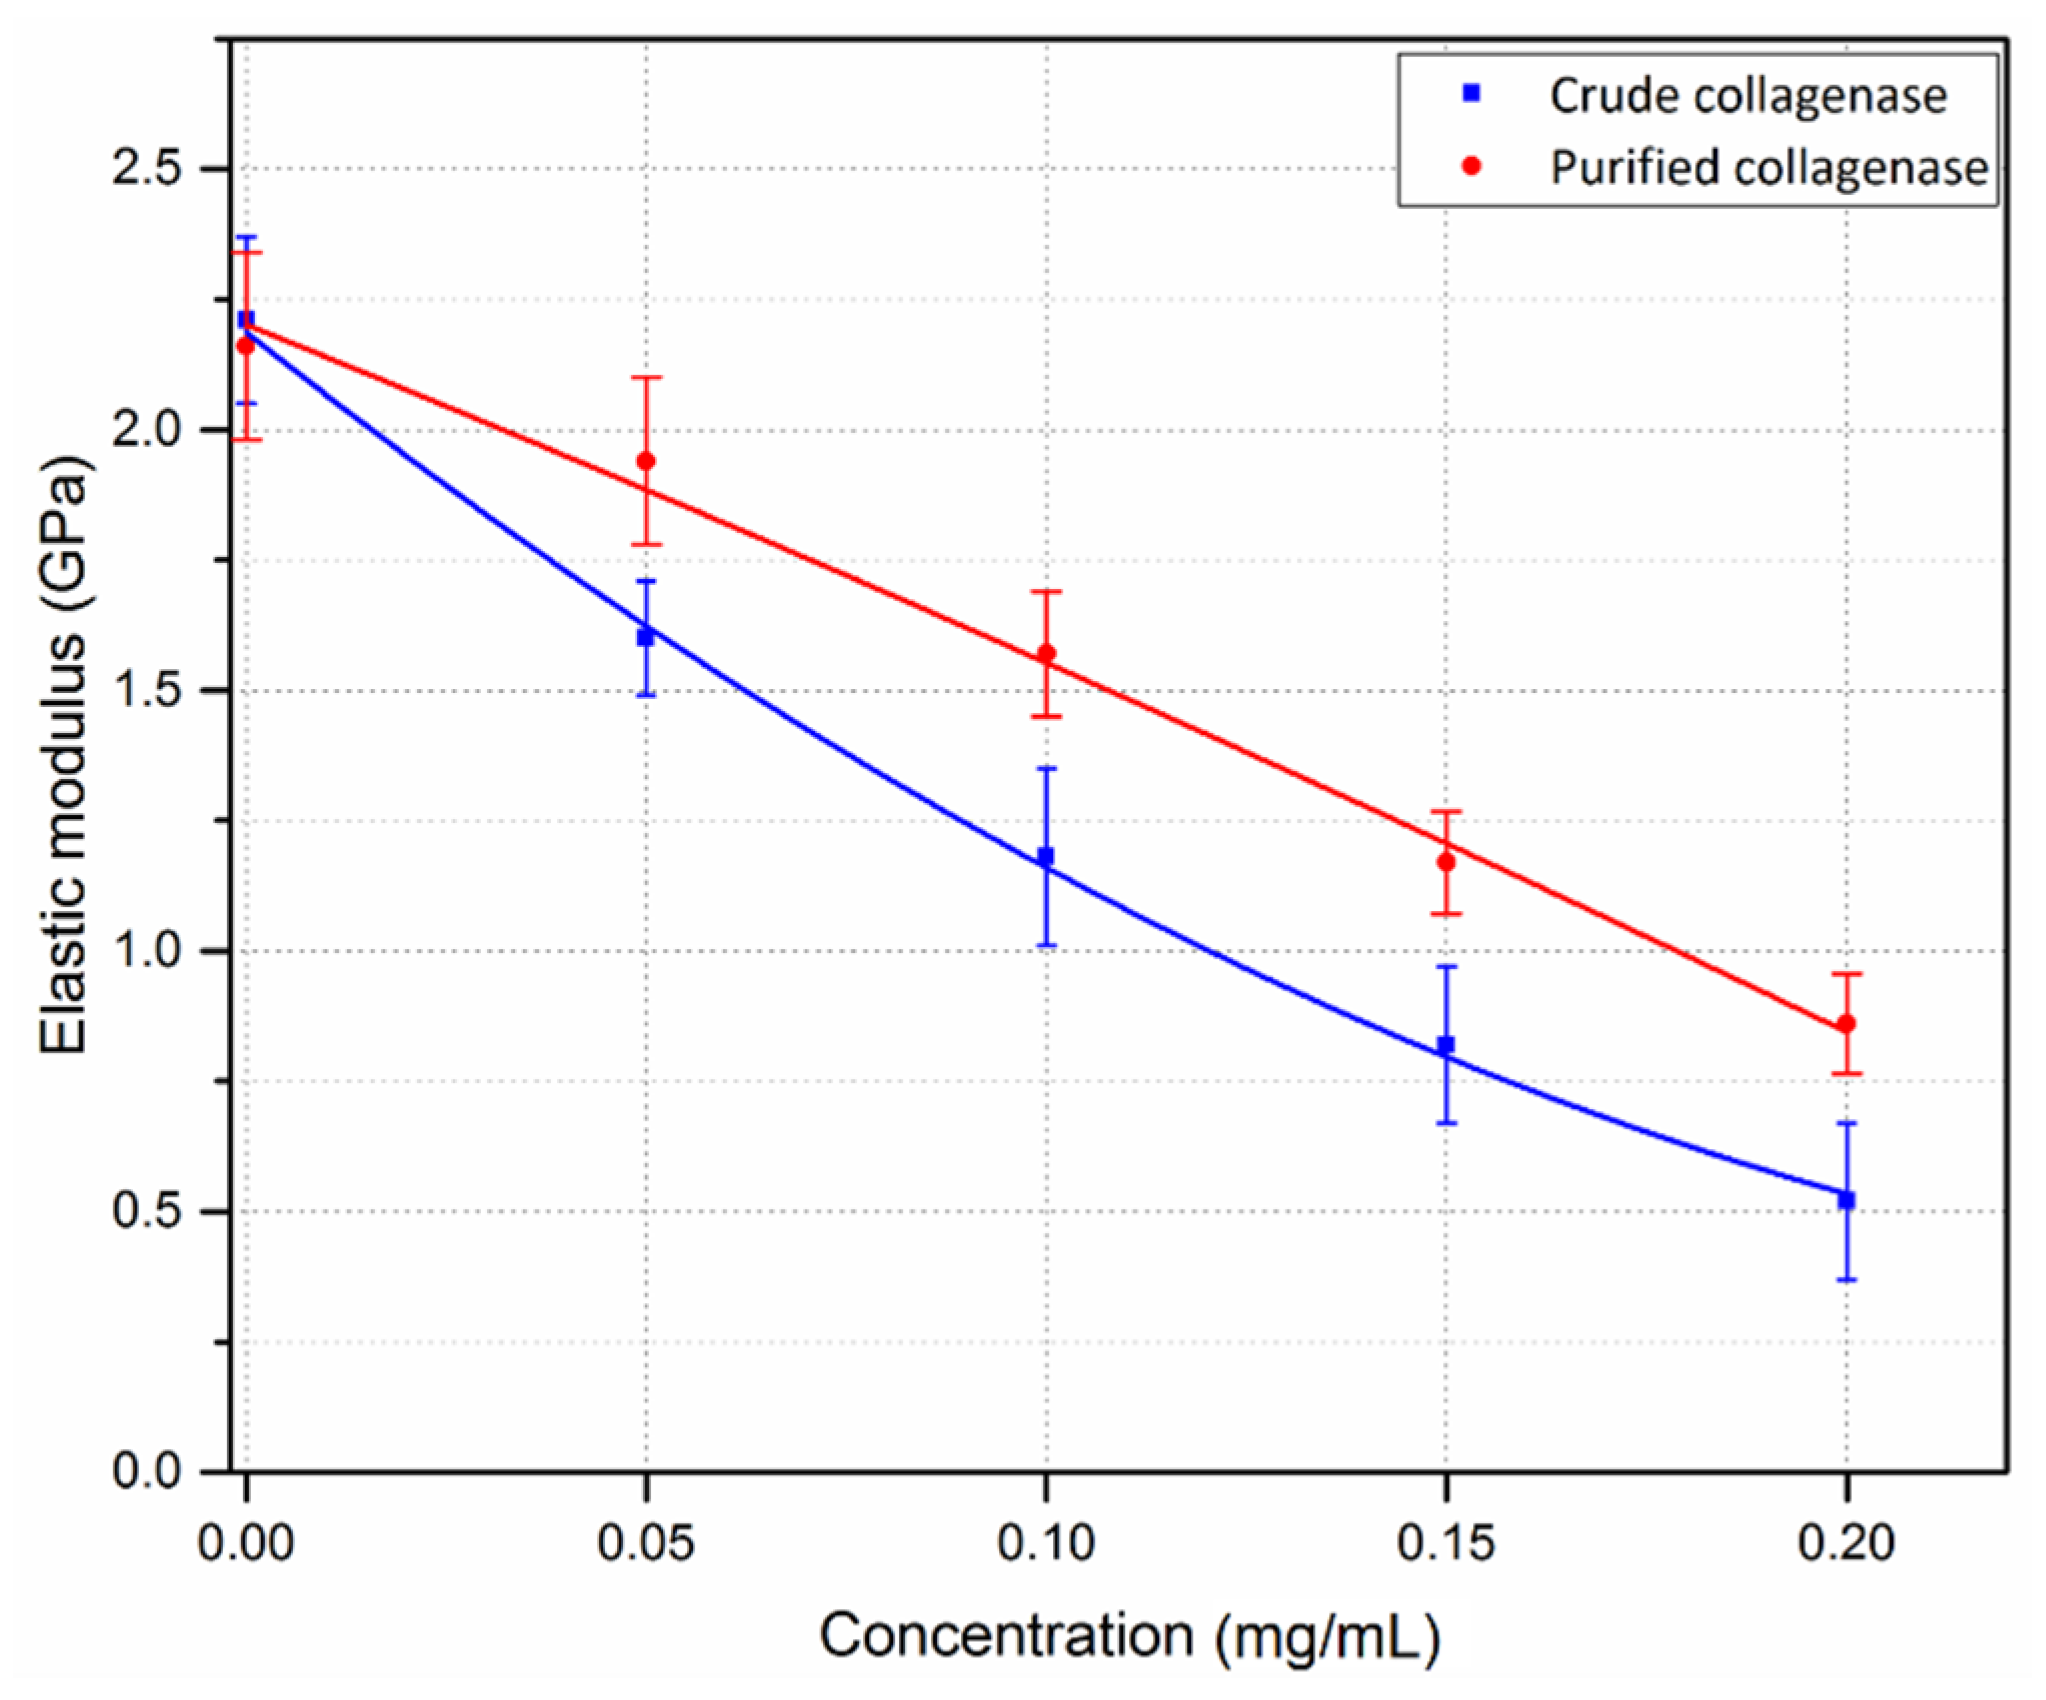
3.2. Crude and Purified Collagenase Groups
3.3. GAG Quantification
4. Discussion
4.1. Corneal Degradation with Amylase
4.2. Corneal Degradation with Collagenase
5. Limitations
6. Conclusions
Author Contributions
Funding
Institutional Review Board Statement
Informed Consent Statement
Data Availability Statement
Acknowledgments
Conflicts of Interest
References
- Meek, K. Corneal collagen—its role in maintaining corneal shape and transparency. Biophys. Rev. 2009, 1, 83–93. [Google Scholar] [CrossRef]
- Meek, K.M.; Knupp, C. Corneal structure and transparency. Prog. Retin. Eye Res. 2015, 49, 1–16. [Google Scholar] [CrossRef] [PubMed]
- Xia, D.; Zhang, S.; Hjortdal, J.; Li, Q.; Thomsen, K.; Chevallier, J.; Besenbacher, F.; Dong, M. Hydrated Human Corneal Stroma Revealed by Quantitative Dynamic Atomic Force Microscopy at Nanoscale. ACS Nano 2014, 8, 6873–6882. [Google Scholar] [CrossRef] [PubMed]
- Zhang, F.; Zhang, Z.; Linhsrdt, R.J. Glycosaminoglycans. In Handbook of Glycomics, 1st ed.; Cummings Elsevier, R.D., Pierce, M.J., Eds.; Academic Press: Cambridge, MA, USA, 2010; Volume 3, pp. 59–80. [Google Scholar]
- Van Haeringen, N.J.; Ensink, F.; Glasius, E. Amylase in human tear fluid: Origin and characteristics, compared with salivary and urinary amylases. Exp. Eye Res. 1975, 21, 395–403. [Google Scholar] [CrossRef]
- Kaiserman, I.; Sella, S. Chronic ocular inflammation and keratoconus. In Controversies in the Management of Keratoconus, 1st ed.; Barbara, A., Ed.; Springer: Cham, Germany, 2019; Volume 2, pp. 17–27. [Google Scholar]
- Galvis, V.; Sherwin, T.; Tello, A.; Merayo, J. Keratoconus: An inflammatory disorder? Eye 2015, 29, 843–852. [Google Scholar] [CrossRef]
- Legkikh, L.; Koledintsev, M.; Semenova, A.; Okuyama, K. Biochemical Investigations of Lacrima in Early Diagnosis of Keratoconus. (Abstract) Sangubashi Eye Clinic, Japan. 2017. Available online: www.sangubashi.com/English/report/syanhai.htm (accessed on 12 January 2020).
- Spoerl, E.; Teral, N.; Raiskup, F.; Pillunat, L. Amylase reduces the biomechanical stiffness of the cornea. Investig. Ophthalmol. Vis. Sci. 2012, 53, 1531. [Google Scholar]
- Wollensak, G.; Spörl, E.; Mazzotta, C.; Kalinski, T.; Sel, S. Interlamellar cohesion after corneal crosslinking using riboflavin and ultraviolet A light. Br. J. Ophthalmol. 2011, 95, 876–880. [Google Scholar] [CrossRef]
- Balasubramanian, S.; Pye, D.; Willcox, M. Are proteinases the reason for keratoconus? Curr. Eye Res. 2010, 35, 185–191. [Google Scholar] [CrossRef]
- Collier, S.; Madigan, M.; Penfold, P. Expression of membrane-type 1 matrix metalloproteinase (MT1-MMP) and MMP-2 in normal and keratoconus corneas. Curr. Eye Res. 2000, 21, 662–668. [Google Scholar] [CrossRef]
- Collier, S.A. Is the corneal degradation in keratoconus caused by matrix-metalloproteinases? Clin. Exp. Ophthalmol. 2001, 29, 340–344. [Google Scholar] [CrossRef] [PubMed]
- Hurst, L.C.; Badalamente, M.A.; Hentz, V.R.; Hotchkiss, R.N.; Kaplan, F.T.; Meals, R.A.; Smith, T.M.; Rodzvilla, J. Injectable collagenase clostridium histolyticum for Dupuytren’s contracture. N. Engl. J. Med. 2012, 361, 968–979. [Google Scholar] [CrossRef]
- Mackiewicz, Z.; Määttä, M.; Stenman, M.; Konttinen, L.; Tervo, T.; Konttinen, Y. Collagenolytic proteinases in keratoconus. Cornea 2006, 25, 603–610. [Google Scholar] [CrossRef]
- Seppälä, H.; Määttä, M.; Rautia, M.; Mackiewicz, Z.; Tuisku, I.; Tervo, T.; Konttinen, Y. EMMPRIN and MMP-1 in keratoconus. Cornea 2006, 25, 325–330. [Google Scholar] [CrossRef]
- Romero-Jiménez, M.; Santodomingo-Rubido, J.; Wolffsohn, J. Keratoconus: A review. Contact Lens Anterior Eye 2010, 33, 157–166. [Google Scholar] [CrossRef] [PubMed]
- Volatier, T.L.; Figueiredo, F.C.; Connon, C.J. Keratoconus at a molecular level: A review. Anat. Record 2019, 1, 1–5. [Google Scholar] [CrossRef] [PubMed]
- Last, J.; Russell, P.; Nealey, P.; Murphy, C. The applications of atomic force microscopy to vision science. Investig. Ophthalmol. Vis. Sci. 2010, 51, 6083–6094. [Google Scholar] [CrossRef]
- Jastrzebska, M.; Tarnawska, D.; Wrzalik, R.; Chrobak, A.; Grelowski, M.; Wylegala, E.; Zygadlo, D.; Ratuszna, A. New insight into the shortening of the collagen fibril D-period in human cornea. J. Biomol. Struct. Dyn. 2016, 35, 551–563. [Google Scholar] [CrossRef] [PubMed]
- Fullwood, N.J.; Hammiche, A.; Pollock, H.M.; Hourston, D.J.; Song, M. Atomic force microscopy of the cornea and sclera. Curr. Eye Res. 1996, 14, 529–535. [Google Scholar] [CrossRef] [PubMed]
- Last, J.; Thomasy, S.; Croasdale, C.; Russell, P.; Murphy, C. Compliance profile of the human cornea as measured by atomic force microscopy. Micron 2012, 43, 1293–1298. [Google Scholar] [CrossRef]
- Lombardo, M.; Lombardo, G.; Carbone, G.; De Santo, M.P.; Barberi, R.; Serrao, S. Biomechanics of the anterior human corneal tissue investigated with atomic force microscopy. Investig. Ophthalmol. Vis. Sci. 2012, 53, 1050–1057. [Google Scholar] [CrossRef]
- Lombardo, M.; Santo, M.; Lombardo, G.; Barberi, R.; Serrao, S. Atomic force microscopy analysis of normal and photoablated porcine corneas. J. Biomech. 2006, 39, 2719–2724. [Google Scholar] [CrossRef] [PubMed]
- Choi, S.; Lee, S.C.; Lee, H.J.; Cheong, Y.; Jung, G.B.; Jin, K.H.; Park, H.K. Structural response of human corneal and scleral tissues to collagen cross-linking treatment with riboflavin and ultraviolet A light. Lasers Med. Sci. 2013, 28, 1289–1296. [Google Scholar] [CrossRef]
- Hu, J.; Chen, S.; Huang, D.; Zhang, Y.; Lü, S.; Long, M. Global mapping of live cell mechanical features using PeakForce QNM AFM. Biophys. Rep. 2020, 6, 1–10. [Google Scholar] [CrossRef]
- Papi, M.; Paoletti, P.; Geraghty, B.; Akhtar, R. Nanoscale characterization of the biomechanical properties of collagen fibrils in the sclera. Appl. Phys. Lett. 2014, 104, 103703. [Google Scholar] [CrossRef]
- Chang, Z.; Paoletti, P.; Barrett, S.; Chim, Y.; Caamaño-Gutiérrez, E.; Hansen, M.; Beck, H.; Rasmussen, L.; Akhtar, R. Nanomechanics and ultrastructure of the internal mammary artery adventitia in patients with low and high pulse wave velocity. Acta Biomater. 2018, 73, 437–448. [Google Scholar] [CrossRef]
- Dokukin, M.; Sokolov, I. Quantitative Mapping of the Elastic Modulus of Soft Materials with HarmoniX and PeakForce QNM AFM Modes. Langmuir 2012, 28, 16060–16071. [Google Scholar] [CrossRef] [PubMed]
- Pittenger, B.; Erina, N.; Su, C. Quantitative Mechanical Property Mapping at the Nanoscale with Peak Force QNM; Application Note Veeco Instruments Inc., 2010; pp. 1–12. Available online: https://www.bruker.com/fileadmin/user_upload/8-PDF-Docs/SurfaceAnalysis/AFM/ApplicationNotes/AN128-RevB0Quantitative_Mechanical_Property_Mapping_at_the_Nanoscale_with_PeakForceQNM-AppNote.pdf (accessed on 12 January 2020).
- Young, T.; Monclus, M.; Burnett, T.; Broughton, W.; Ogin, S.; Smith, P. The use of the PeakForceTM quantitative nanomechanical mapping AFM-based method for high-resolution Young’s modulus measurement of polymers. Meas. Sci. Technol. 2011, 22, 125703. [Google Scholar] [CrossRef]
- Heu, C.; Berquand, A.; Elie-Caille, C.; Nicod, L. Glyphosate-induced stiffening of HaCaT keratinocytes, a Peak Force Tapping study on living cells. J. Struct. Biol. 2012, 178, 1–7. [Google Scholar] [CrossRef]
- Farndale, R.W.; Sayers, C.A.; Barrett, A.J. A direct spectrophotometric microassay for sulfated glycosaminoglycans in cartilage cultures. Connect. Tissue Res. 1982, 9, 247–248. [Google Scholar] [CrossRef]
- Jalili, N.; Laxminarayana, K.K. A review of atomic force microscopy imaging systems: Application to molecular metrology and biological sciences. Mechatronics 2004, 14, 907–945. [Google Scholar] [CrossRef]
- Alessandrini, A.; Facci, P. AFM: A versatile tool in biophysics. Meas. Sci. Technol. 1982, 16, R65. [Google Scholar] [CrossRef]
- Harper, A.R.; Summers, J.A. The dynamic sclera: Extracellular matrix remodeling in normal ocular growth and myopia development. Exp. Eye Res. 2015, 133, 100–111. [Google Scholar] [CrossRef] [PubMed]
- Meek, K.; Boote, C. The organization of collagen in the corneal stroma. Exp. Eye Res. 2004, 78, 503–512. [Google Scholar] [CrossRef]
- Akhtar, R. The Role of Proteoglycans in the Ultrastructure and Mechanical Properties of the Sclera. Ph.D. Thesis, University of Liverpool, Liverpool, UK, 2018. [Google Scholar]
- Murienne, B.; Jefferys, J.; Quigley, H.; Nguyen, T. The effects of glycosaminoglycan degradation on the mechanical behavior of the posterior porcine sclera. Acta Biomater. 2015, 12, 195–206. [Google Scholar] [CrossRef]
- Tanaka, E.; Aoyama, J.; Tanaka, M.; Van Eijden, T.; Sugiyama, M.; Hanaoka, K.; Watanabe, M.; Tanne, K. The proteoglycan contents of the temporomandibular joint disc influence its dynamic viscoelastic properties. J. Biomed. Mater. Res. 2003, 65, 386–392. [Google Scholar] [CrossRef] [PubMed]
- Quintarelli, G.; Dellovo, M.C.; Balduini, C.; Castellani, A.A. The effects of alpha amylase on collagen-proteoglycans and collagen-glycoprotein complexes in connective tissue matrices. Histochemie 1969, 18, 373–375. [Google Scholar] [CrossRef]
- Gaul, R.T.; Nolan, D.R.; Ristori, T.; Bouten, C.V.C.; Loerakker, S.; Lally, C. Strain mediated Enzymatic Degradation of arterial tissue: Insights into the role of the non-collagenous tissue matrix and collagen crimp. Acta Biomater. 2018, 77, 301–310. [Google Scholar] [CrossRef]
- Hanoune, J.; Stengel, D.; Lacombe, M.L.; Feldmann, G.; Coudrier, E. Proteolytic activation of rat liver adenylate cyclase by a contaminant of crude collagenase from Clostridium histolyticum. J. Biol. Chem. 1977, 252, 2039–2045. [Google Scholar] [CrossRef]
- Jayes, F.; Liu, B.; Moutos, F.; Kuchibhatla, M.; Guilak, F.; Leppert, P. Loss of stiffness in collagen-rich uterine fibroids after digestion with purified collagenase Clostridium histolyticum. Am. J. Obstet. Gynecol. 2016, 215, 596.e1–596.e8. [Google Scholar] [CrossRef]
- Van der Kraan, P.M.; Vitters, E.L.; van Beuningen, H.M.; van de Putte, L.B.; van den Berg, W.B. Degenerative knee joint lesions in mice after a single intra-articular collagenase injection. A new model of osteoarthritis. J. Exp. Pathol. 1990, 71, 19–31. [Google Scholar]
- Lee, G.J.J.; Choi, S.; Chon, J.; Yoo, S.; Cho, I.; Park, H.K.K. Changes in collagen fibril pattern and adhesion force with collagenase-induced injury in rat Achilles tendon observed via AFM. J. Nanosci. Nanotechnol. 2011, 11, 773–777. [Google Scholar] [CrossRef]
- Långsjö, T.; Rieppo, J.; Pelttari, A.; Oksala, N.; Kovanen, V.; Helminen, H. Collagenase-induced changes in articular cartilage as detected by electron-microscopic stereology, quantitative polarized light microscopy and biochemical assays. Cells Tissues Organs 2002, 172, 265–275. [Google Scholar] [CrossRef] [PubMed]
- Lyyra, T.; Arokoski, J.P.; Oksala, N.; Vihko, A.; Hyttinen, M.; Jurvelin, J.S.; Kiviranta, I. Experimental validation of arthroscopic cartilage stiffness measurement using enzymatically degraded cartilage samples. Phys. Med. Biol. 1999, 44, 525–535. [Google Scholar] [CrossRef] [PubMed]
- Stolz, M.; Raiteri, R.; Daniels, A.U.; VanLandingham, M.; Baschong, W.; Aebi, U. Dynamic elastic modulus of porcine articular cartilage determined at two different levels of tissue organization by indentation-type atomic force microscopy. Biophys. J. 2004, 86, 3269–3283. [Google Scholar] [CrossRef]
- Fratzl, P. Collagen: Structure and mechanics, an introduction. In Collagen, 1st ed.; Fratzl, P., Ed.; Springer: Boston, MA, USA, 2008; Volume 1, pp. 1–13. [Google Scholar]
- Sherman, V.R.; Yang, W.; Meyers, M.A. The materials science of collagen. J. Mech. Behav. Biomed. Mater. 2015, 52, 22–50. [Google Scholar] [CrossRef]
- Kazaili, A.; Geraghty, B.; Akhtar, R. Microscale assessment of corneal viscoelastic properties under physiological pressures. J. Mech. Behav. Biomed. Mater. 2019, 100, 103375. [Google Scholar] [CrossRef]
- Kazaili, A.; Lawman, S.; Geraghty, B.; Eliasy, A.; Zheng, Y.; Shen, Y.; Akhtar, R. Line-Field Optical Coherence Tomography as a tool for In vitro characterization of corneal biomechanics under physiological pressures. Sci. Rep. 2019, 9, 1–13. [Google Scholar] [CrossRef]
- Akhtar, R.; Sherratt, M.J.; Cruickshank, J.K.; Derby, B. Characterizing the elastic properties of tissues. Mater. Today 2011, 14, 96–105. [Google Scholar] [CrossRef]
- Crichton, M.; Chen, X.; Huang, H.; Kendall, M. Elastic modulus and viscoelastic properties of full thickness skin characterised at micro scales. Biomaterials 2013, 34, 2087–2097. [Google Scholar] [CrossRef]
- Picas, L.; Milhiet, P.E.E.; Hernández-Borrell, J. Atomic force microscopy: A versatile tool to probe the physical and chemical properties of supported membranes at the nanoscale. Chem. Phys. Lipids 2012, 165, 845–860. [Google Scholar] [CrossRef] [PubMed]


| Samples | Amylase Group | Crude Collagenase Group | Purified Collagenase Group |
|---|---|---|---|
| No. of Porcine Eyes | 6 | 6 | 6 |
| No. of Sections | 66 | 66 | 66 |
| Incubation time (min) | 40 | 15 | 15 |
| Enzyme concentrations (mg/mL) | 0.2, 0.4, 0.6, 0.8, 1, 1.2, 1.4, 1.6, 1.8, and 2 | 0.05, 0.1, 0.15, and 0.2 | 0.05, 0.1, 0.15, and 0.2 |
| Washing solution | PBS | NaDTA | NaDTA |
Publisher’s Note: MDPI stays neutral with regard to jurisdictional claims in published maps and institutional affiliations. |
© 2021 by the authors. Licensee MDPI, Basel, Switzerland. This article is an open access article distributed under the terms and conditions of the Creative Commons Attribution (CC BY) license (http://creativecommons.org/licenses/by/4.0/).
Share and Cite
Kazaili, A.; Abdul-Amir Al-Hindy, H.; Madine, J.; Akhtar, R. Nano-Scale Stiffness and Collagen Fibril Deterioration: Probing the Cornea Following Enzymatic Degradation Using Peakforce-QNM AFM. Sensors 2021, 21, 1629. https://doi.org/10.3390/s21051629
Kazaili A, Abdul-Amir Al-Hindy H, Madine J, Akhtar R. Nano-Scale Stiffness and Collagen Fibril Deterioration: Probing the Cornea Following Enzymatic Degradation Using Peakforce-QNM AFM. Sensors. 2021; 21(5):1629. https://doi.org/10.3390/s21051629
Chicago/Turabian StyleKazaili, Ahmed, Hayder Abdul-Amir Al-Hindy, Jillian Madine, and Riaz Akhtar. 2021. "Nano-Scale Stiffness and Collagen Fibril Deterioration: Probing the Cornea Following Enzymatic Degradation Using Peakforce-QNM AFM" Sensors 21, no. 5: 1629. https://doi.org/10.3390/s21051629
APA StyleKazaili, A., Abdul-Amir Al-Hindy, H., Madine, J., & Akhtar, R. (2021). Nano-Scale Stiffness and Collagen Fibril Deterioration: Probing the Cornea Following Enzymatic Degradation Using Peakforce-QNM AFM. Sensors, 21(5), 1629. https://doi.org/10.3390/s21051629