
A Data-Driven Approach to Predict Fatigue in Exercise Based on Motion Data from Wearable Sensors or Force Plate


Abstract
1. Introduction
2. Related Work
3. Materials and Methods
3.1. Data Collection
3.2. Feature Extraction
3.3. Data Preprocessing
3.4. Data Analysis
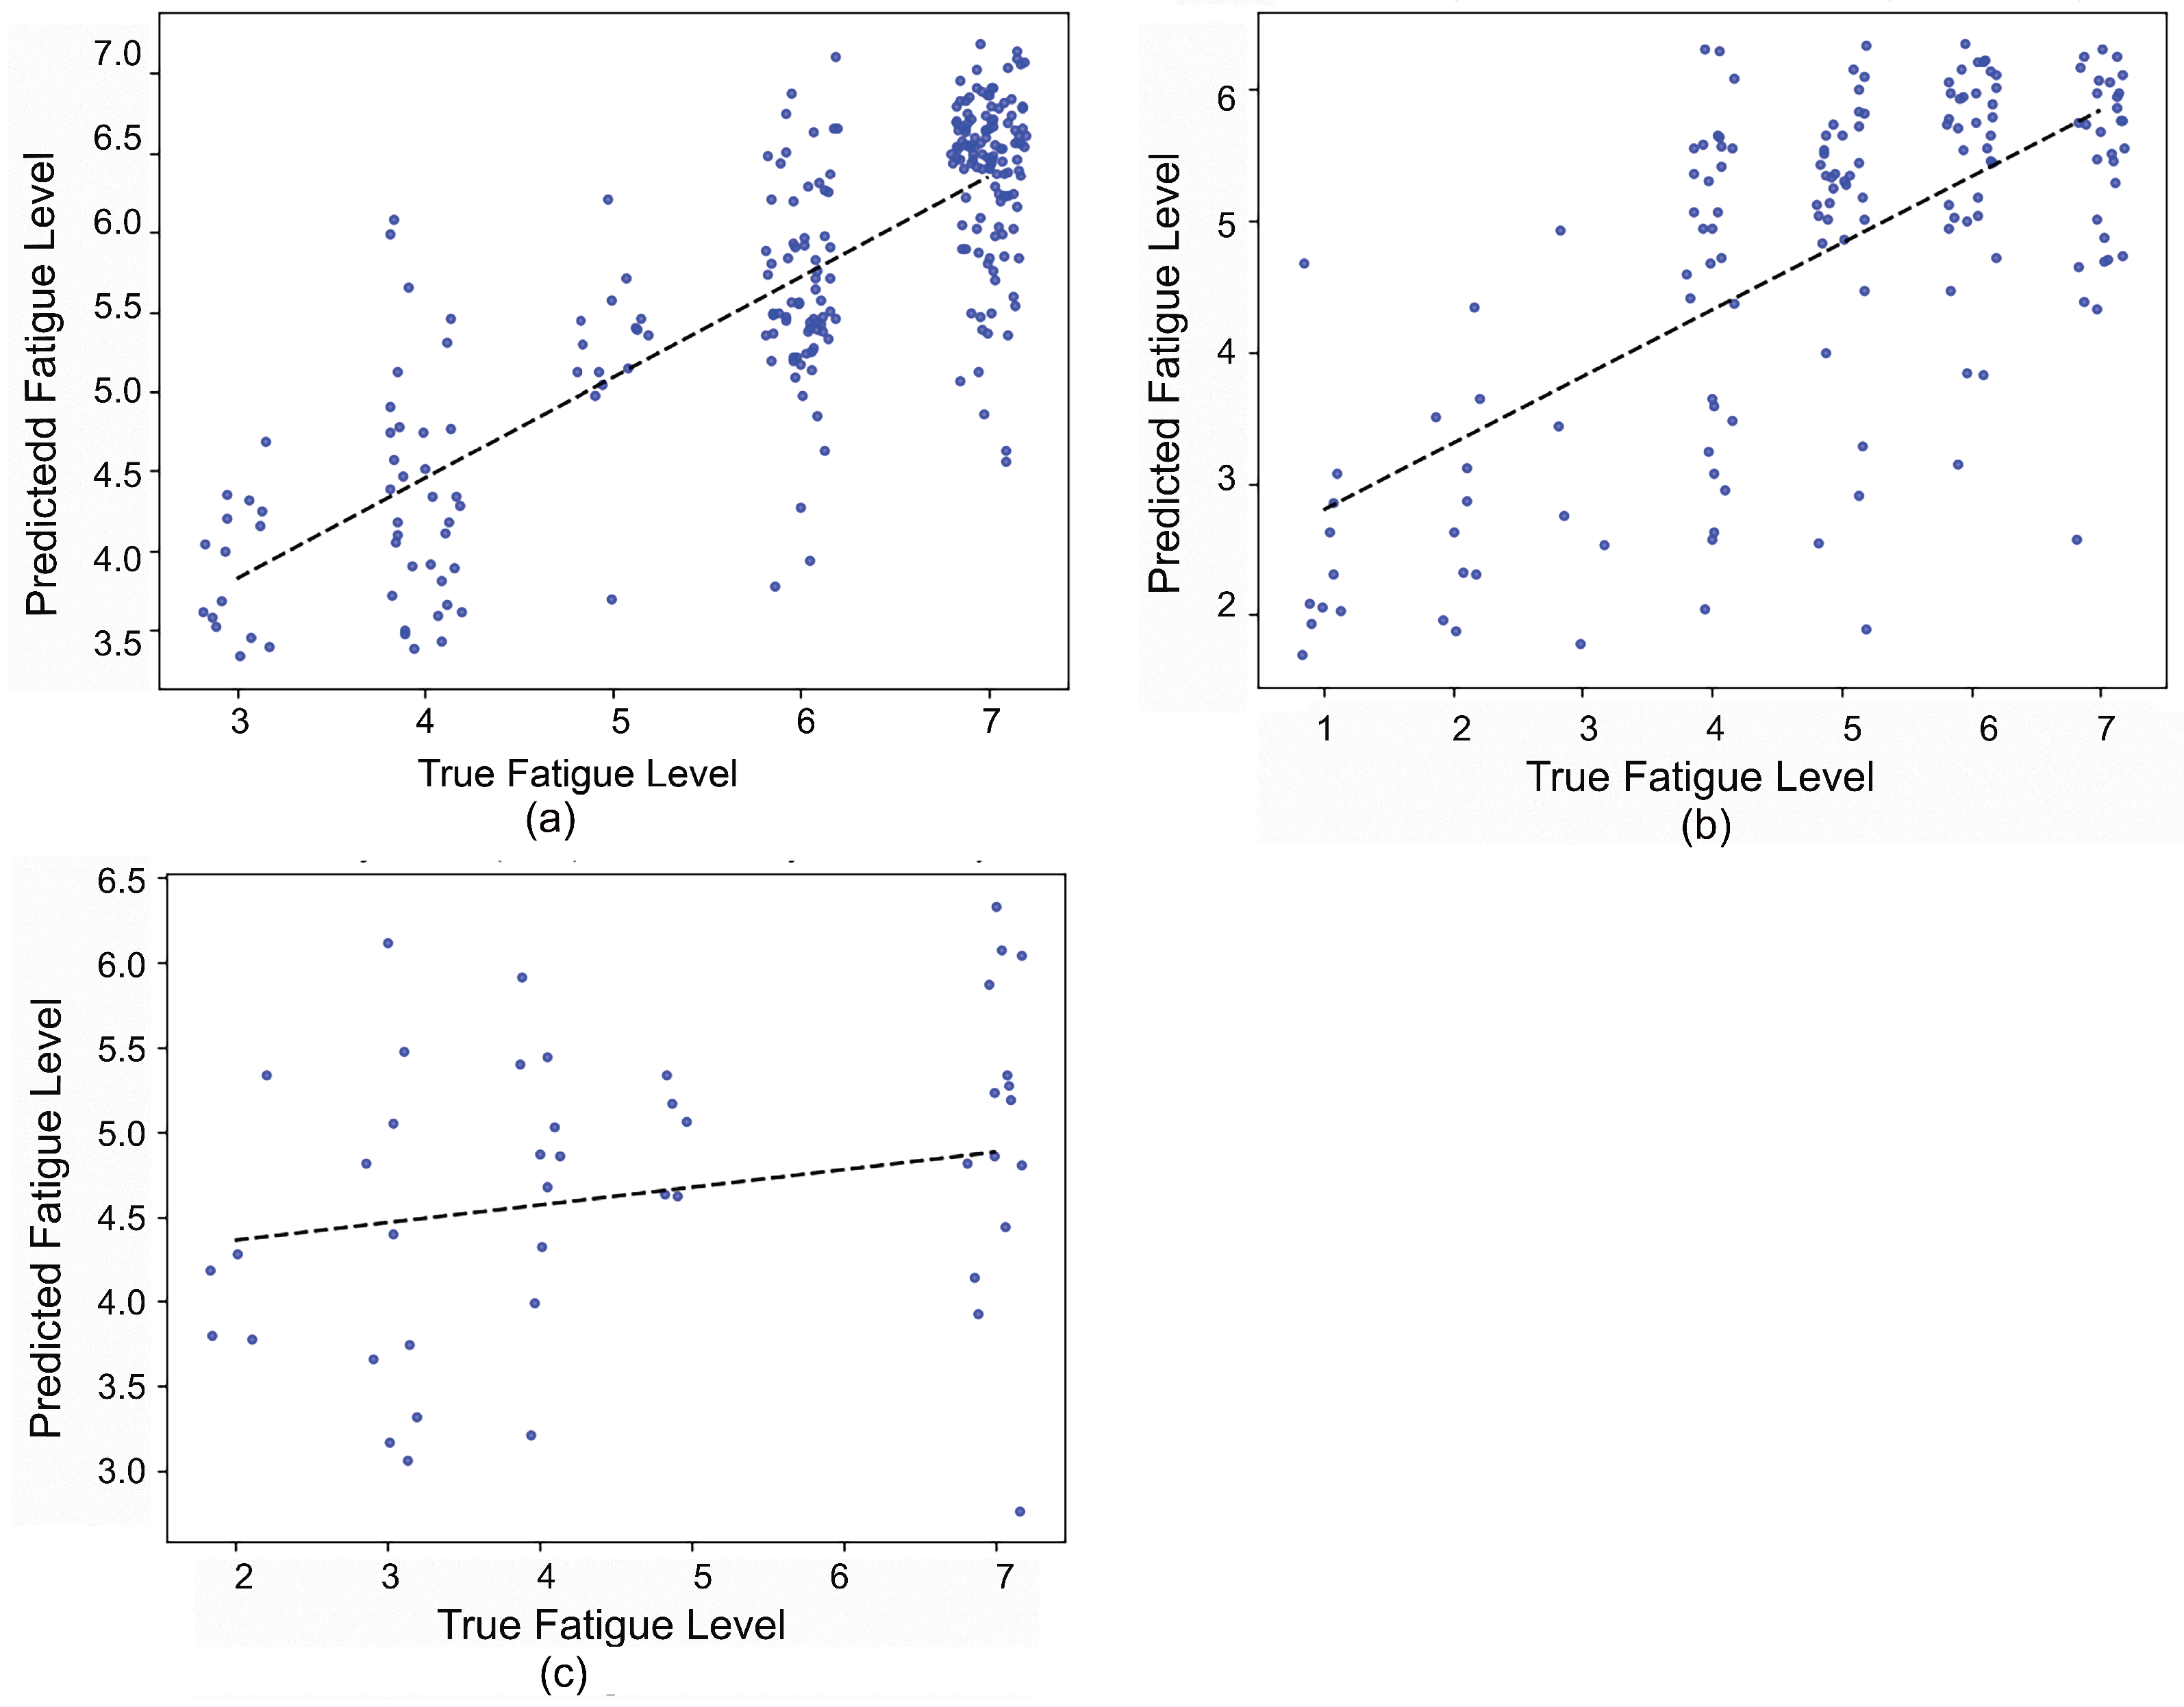
4. Results
4.1. Comparison of Different COP Features
4.2. Performance of Fatigue Estimation with Only IMU Data vs. Only FP Data
5. Discussion
6. Conclusions
- In this paper, a data-driven approach was presented for predicting fatigue based on data from IMUs or a force plate using random forest and the CNN.
- A high correlation (Pearson coefficient of up to 89%, 93%, and 94% for the squat, jack, and corkscrew exercises, respectively) can be achieved for a subject-dependent regression model for continuous fatigue prediction.
- The proposed model can detect fairly small variations of human motion due to fatigue, which also indicates the ability to monitor the gradual decline in the quality of the movement during exercise execution. The results contribute to the area of human motion recognition for more detailed knowledge of human motion.
- Fatigue prediction using force plate motion data had a similar performance as the data from IMU. The displacement of COP was found to be correlated to fatigue compared with other commonly used features of the force plate. Bland–Altman analysis also confirmed that the predicted fatigue levels were close to the true values.
- These results show that it is feasible to predict the onset of fatigue and quantify continuous fatigue levels from IMU data or force plate data through machine learning and deep learning.
- Based on the successful findings with three different exercises, the general nature of the methodology is potentially applicable to a variety of other forms of exercise and developing real-time biofeedback applications based on kinematic or kinetic data, thereby contributing to future adaptation of exercise programs and prevention of over-training and injury as a result of excessive fatigue.
Author Contributions
Funding
Institutional Review Board Statement
Informed Consent Statement
Data Availability Statement
Acknowledgments
Conflicts of Interest
References
- Karg, M.; Venture, G.; Hoey, J.; Kulic, D. Human movement analysis as a measure for fatigue: A hidden Markov-based approach. IEEE Trans. Neural Syst. Rehabil. Eng. 2014, 22, 470–481. [Google Scholar] [CrossRef]
- Wan, J.j.; Qin, Z.; Wang, P.y.; Sun, Y.; Liu, X. Muscle fatigue: General understanding and treatment. Exp. Mol. Med. 2017, 49, e384. [Google Scholar] [CrossRef]
- Bogdanis, G.C. Effects of physical activity and inactivity on muscle fatigue. Front. Physiol. 2012, 3, 142. [Google Scholar] [CrossRef]
- Dong, H.; Ugalde, I.; Figueroa, N.; El Saddik, A. Towards whole body fatigue assessment of human movement: A fatigue-tracking system based on combined semg and accelerometer signals. Sensors 2014, 14, 2052–2070. [Google Scholar] [CrossRef]
- Jobanputra, C.; Bavishi, J.; Doshi, N. Human Activity Recognition: A Survey. Procedia Comput. Sci. 2019, 155, 698–703. [Google Scholar] [CrossRef]
- Bevilacqua, A.; MacDonald, K.; Rangarej, A.; Widjaya, V.; Caulfield, B.; Kechadi, T. Human activity recognition with convolutional neural networks. In Joint European Conference on Machine Learning and Knowledge Discovery in Databases; Springer: Berlin/Heidelberg, Germany, 2018; pp. 541–552. [Google Scholar]
- Wang, J.; Chen, Y.; Hao, S.; Peng, X.; Hu, L. Deep learning for sensor-based activity recognition: A survey. Pattern Recognit. Lett. 2019, 119, 3–11. [Google Scholar] [CrossRef]
- Hassan, M.M.; Huda, S.; Uddin, M.Z.; Almogren, A.; Alrubaian, M. Human activity recognition from body sensor data using deep learning. J. Med. Syst. 2018, 42, 99. [Google Scholar] [CrossRef] [PubMed]
- Sousa Lima, W.; Souto, E.; El-Khatib, K.; Jalali, R.; Gama, J. Human Activity Recognition Using Inertial Sensors in a Smartphone: An Overview. Sensors 2019, 19, 3213. [Google Scholar] [CrossRef]
- Vincent, H.; Dana, K.; Gentiane, V. Adversarial autoencoder for visualization and classification of human activity: Application to a low-cost commercial force plate. J. Biomech. 2020, 103, 109684. [Google Scholar]
- Buldt, A.K.; Forghany, S.L.; Landorf, K.B.; Murley, G.S.; Levinger, P.; Menz, H.B. Centre of pressure characteristics in normal, planus and cavus feet. J. Foot Ankle Res. 2018, 11, 1–9. [Google Scholar] [CrossRef] [PubMed]
- Cifrek, M.; Medved, V.; Tonković, S.; Ostojić, S. Surface EMG based muscle fatigue evaluation in biomechanics. Clin. Biomech. 2009, 24, 327–340. [Google Scholar] [CrossRef] [PubMed]
- Bell, T.; Li, B.; Zhang, S. Structured light techniques and applications. Wiley Encycl. Electr. Electron. Eng. 1999, 1–24. [Google Scholar] [CrossRef]
- Wang, L.; Hu, W.; Tan, T. Recent developments in human motion analysis. Pattern Recognit. 2003, 36, 585–601. [Google Scholar] [CrossRef]
- Fiore, L.; Fehr, D.; Bodor, R.; Drenner, A.; Somasundaram, G.; Papanikolopoulos, N. Multi-camera human activity monitoring. J. Intell. Robot. Syst. 2008, 52, 5–43. [Google Scholar] [CrossRef]
- Whittle, M.W. Chapter 2—Normal gait. In Gait Analysis, 4th ed.; Whittle, M.W., Ed.; Butterworth-Heinemann: Edinburgh, UK, 2007; pp. 47–100. [Google Scholar]
- Karvekar, S.; Abdollahi, M.; Rashedi, E. A Data-Driven Model to Identify Fatigue Level Based on the Motion Data from a Smartphone. In Proceedings of the 2019 IEEE Western New York Image and Signal Processing Workshop (WNYISPW), New York, NY, USA, 4 October 2019; pp. 1–5. [Google Scholar]
- Zhang, J.; Lockhart, T.E.; Soangra, R. Classifying lower extremity muscle fatigue during walking using machine learning and inertial sensors. Ann. Biomed. Eng. 2014, 42, 600–612. [Google Scholar] [CrossRef] [PubMed]
- Buckley, C.; O’Reilly, M.A.; Whelan, D.; Farrell, A.V.; Clark, L.; Longo, V.; Gilchrist, M.; Caulfield, B. Binary classification of running fatigue using a single inertial measurement unit. In Proceedings of the 2017 IEEE 14th International Conference on Wearable and Implantable Body Sensor Networks (BSN), Eindhoven, The Netherlands, 9–12 May 2017; pp. 197–201. [Google Scholar]
- Strohrmann, C.; Harms, H.; Kappeler-Setz, C.; Troster, G. Monitoring kinematic changes with fatigue in running using body-worn sensors. IEEE Trans. Inf. Technol. Biomed. 2012, 16, 983–990. [Google Scholar] [CrossRef]
- Ramos, G.; Vaz, J.; Mendonça, G.; Pezarat-Correia, P.; Rodrigues, J.; Alfaras, M.; Gamboa, H. Fatigue Evaluation through Machine Learning and a Global Fatigue Descriptor. J. Healthc. Eng. 2020, 2020, 6484129. [Google Scholar] [CrossRef]
- Shair, E.; Ahmad, S.; Marhaban, M.; Mohd Tamrin, S.; Abdullah, A. EMG processing based measures of fatigue assessment during manual lifting. BioMed Res. Int. 2017, 2017, 3937254. [Google Scholar] [CrossRef]
- Wang, L.; Wang, Y.; Ma, A.; Ma, G.; Ye, Y.; Li, R.; Lu, T. A comparative study of EMG indices in muscle fatigue evaluation based on grey relational analysis during all-out cycling exercise. BioMed Res. Int. 2018, 2018, 9341215. [Google Scholar] [CrossRef] [PubMed]
- Shaw, D.; Huang, C.R. Assessing muscle fatigue by measuring the EMG of biceps brachii. In Proceedings of the 2010 3rd International Conference on Biomedical Engineering and Informatics, Yantai, China, 16–18 October 2010; pp. 773–777. [Google Scholar]
- Chattopadhyay, R.; Pradhan, G.; Panchanathan, S. Subject independent computational framework for myoelectric signals. In Proceedings of the 2011 IEEE International Instrumentation and Measurement Technology Conference, Hangzhou, China, 10–12 May 2011; pp. 910–913. [Google Scholar]
- Al-Mulla, M.; Sepulveda, F.; Colley, M.; Kattan, A. Classification of localized muscle fatigue with genetic programming on sEMG during isometric contraction. In Proceedings of the 2009 Annual International Conference of the IEEE Engineering in Medicine and Biology Society, Minneapolis, MN, USA, 3–6 September 2009; pp. 2633–2638. [Google Scholar]
- Pilarski, P.M.; Qi, L.; Ferguson-Pell, M.; Grange, S. Determining the time until muscle fatigue using temporally extended prediction learning. In Proceedings of the 18th International Functional Electrical Stimulation Society Conference (IFESS), Donostia-San Sebastian, Spain, 6–8 June 2013; pp. 7–8. [Google Scholar]
- Op De Beéck, T.; Meert, W.; Schütte, K.; Vanwanseele, B.; Davis, J. Fatigue prediction in outdoor runners via machine learning and sensor fusion. In Proceedings of the 24th ACM SIGKDD International Conference on Knowledge Discovery & Data Mining, London, UK, 19–23 August 2018; pp. 606–615. [Google Scholar]
- Schmidt, M.; Rheinländer, C.C.; Wille, S.; Wehn, N.; Jaitner, T. IMU-based determination of fatigue during long sprint. In Proceedings of the 2016 ACM International Joint Conference on Pervasive and Ubiquitous Computing: Adjunct, Heidelberg, Germany, 12–16 September 2016; pp. 899–903. [Google Scholar]
- Liu, T.; Inoue, Y.; Shibata, K. A wearable ground reaction force sensor system and its application to the measurement of extrinsic gait variability. Sensors 2010, 10, 10240–10255. [Google Scholar] [CrossRef]
- Lee, C.H.; Sun, T.L. Evaluation of postural stability based on a force plate and inertial sensor during static balance measurements. J. Physiol. Anthropol. 2018, 37, 27. [Google Scholar] [CrossRef]
- Wu, P.P.Y.; Sterkenburg, N.; Everett, K.; Chapman, D.W.; White, N.; Mengersen, K. Predicting fatigue using countermovement jump force-time signatures: PCA can distinguish neuromuscular versus metabolic fatigue. PLoS ONE 2019, 14, e0219295. [Google Scholar] [CrossRef]
- Raymond, F.; Lussier, B.; Dugas, F.; Charbonneau, M.; Croteau, F.; Kennedy, C.; Berryman, N. Using Portable Force Plates to Assess Vertical Jump Performance: A Metrological Appraisal. Sports 2018, 6, 149. [Google Scholar] [CrossRef] [PubMed]
- Adlerton, A.K.; Moritz, U.; Moe-Nilssen, R. Forceplate and accelerometer measures for evaluating the effect of muscle fatigue on postural control during one-legged stance. Physiother. Res. Int. 2003, 8, 187–199. [Google Scholar] [CrossRef] [PubMed]
- Baghdadi, A.; Megahed, F.M.; Esfahani, E.T.; Cavuoto, L.A. A machine learning approach to detect changes in gait parameters following a fatiguing occupational task. Ergonomics 2018, 61, 1116–1129. [Google Scholar] [CrossRef]
- Dos Santos, D.A.; Fukuchi, C.A.; Fukuchi, R.K.; Duarte, M. A data set with kinematic and ground reaction forces of human balance. PeerJ 2017, 5, e3626. [Google Scholar] [CrossRef]
- Nakazato, K.; Scheiber, P.; Müller, E. A comparison of ground reaction forces determined by portable force-plate and pressure-insole systems in alpine skiing. J. Sport. Sci. Med. 2011, 10, 754. [Google Scholar]
- Kassidas, A.; MacGregor, J.F.; Taylor, P.A. Synchronization of batch trajectories using dynamic time warping. AIChE J. 1998, 44, 864–875. [Google Scholar] [CrossRef]
- He, H.; Garcia, E.A. Learning from Imbalanced Data. IEEE Trans. Knowl. Data Eng. 2009, 21, 1263–1284. [Google Scholar]
- Butt, A.H.; Rovini, E.; Esposito, D.; Rossi, G.; Maremmani, C.; Cavallo, F. Biomechanical parameter assessment for classification of Parkinson’s disease on clinical scale. Int. J. Distrib. Sens. Netw. 2017, 13. [Google Scholar] [CrossRef]
- Hernandez, V.; Rezzoug, N.; Gorce, P.; Venture, G. Force feasible set prediction with artificial neural network and musculoskeletal model. Comput. Methods Biomech. Biomed. Eng. 2018, 21, 740–749. [Google Scholar] [CrossRef]
- Huang, B.F.; Boutros, P.C. The parameter sensitivity of random forests. BMC Bioinform. 2016, 17, 331. [Google Scholar] [CrossRef]
- Sadouk, L. CNN Approaches for Time Series Classification. In Time Series Analysis-Data, Methods, and Applications; IntechOpen: London, UK, 2018. [Google Scholar]
- Kingma, D.P.; Ba, J. Adam: A Method for Stochastic Optimization. arXiv 2015, arXiv:1412.6980. [Google Scholar]
- Fleron, M.K.; Ubbesen, N.C.H.; Battistella, F.; Dejtiar, D.L.; Oliveira, A.S. Accuracy between optical and inertial motion capture systems for assessing trunk speed during preferred gait and transition periods. Sport. Biomech. 2019, 18, 366–377. [Google Scholar] [CrossRef]
- Evans, J.D. Straightforward Statistics for the Behavioral Sciences.; Thomson Brooks/Cole Publishing Co.: Pacific Grove, CA, USA, 1996. [Google Scholar]
- Abadi, M.; Agarwal, A.; Barham, P.; Brevdo, E.; Chen, Z.; Citro, C.; Corrado, G.S.; Davis, A.; Dean, J.; Devin, M.; et al. TensorFlow: Large-Scale Machine Learning on Heterogeneous Systems. 2015. Available online: https://arxiv.org/pdf/1603.04467.pdf (accessed on 19 February 2020).
- Pedregosa, F.; Varoquaux, G.; Gramfort, A.; Michel, V.; Thirion, B.; Grisel, O.; Blondel, M.; Prettenhofer, P.; Weiss, R.; Dubourg, V.; et al. Scikit-learn: Machine Learning in Python. J. Mach. Learn. Res. 2011, 12, 2825–2830. [Google Scholar]
- Bland, J.M.; Altman, D. Statistical methods for assessing agreement between two methods of clinical measurement. Lancet 1986, 327, 307–310. [Google Scholar] [CrossRef]
- O’Reilly-Shah, V.N. Factors influencing healthcare provider respondent fatigue answering a globally administered in-app survey. PeerJ 2017, 5, e3785. [Google Scholar] [CrossRef]
- Lin, J.F.S.; Bonnet, V.; Panchea, A.M.; Ramdani, N.; Venture, G.; Kulić, D. Human motion segmentation using cost weights recovered from inverse optimal control. In Proceedings of the 2016 IEEE-RAS 16th International Conference on Humanoid Robots (Humanoids), Cancun, Mexico, 15–17 November 2016; pp. 1107–1113. [Google Scholar]
- Kim, M.; Park, S. Golf swing segmentation from a single IMU using machine learning. Sensors 2020, 20, 4466. [Google Scholar] [CrossRef]
- Um, T.T.; Babakeshizadeh, V.; Kulić, D. Exercise motion classification from large-scale wearable sensor data using convolutional neural networks. In Proceedings of the 2017 IEEE/RSJ International Conference on Intelligent Robots and Systems (IROS), Vancouver, BC, Canada, 24–28 September 2017; pp. 2385–2390. [Google Scholar]


| Characteristics | Range | ||||
|---|---|---|---|---|---|
| Number | % | Min | Max | Mean (SD) | |
| Total Number | 14 | ||||
| Female | 2 | ||||
| Male | 12 | ||||
| Age (years) | 20 | 35 | 27.4 (4.15) | ||
| Anthropometric | |||||
| Height (m) | 1.62 | 1.87 | 1.76 (0.076) | ||
| Weight (kg) | 57 | 99 | 74.13 (12.13) | ||
| Exercise hours per week (h) | 0 | 12 | 4.53 (3.44) | ||
| 0 | 2 | 13.3 | |||
| [1,5) | 6 | 53.8 | |||
| [5,10) | 3 | 26.7 | |||
| >10 | 2 | 13.3 | |||
| Name | Initial Pose | Description |
|---|---|---|
| Squat | Standing | Bend knees to lower torso vertical position while keeping upper body upright and head forward |
| High knee jack | Standing | Start (arms above head; legs straight), ext1(right knee raise; arm comes down so hand claps under the leg), return to rest, ext2 (left knee raise; arm comes down so hand claps under leg) |
| Corkscrew toe-touch | Standing | Start (arm straight out to the side), ext1 (bend at waist, right hand touching left leg), return to rest, then ext2 (bend at waist, left hand touching right leg) |
| Participant | 1 | 2 | 3 | 4 | 5 | 6 | 7 | 8 | 9 | 10 | 11 | 12 | 13 | 14 |
|---|---|---|---|---|---|---|---|---|---|---|---|---|---|---|
| No. of sets of squat | 9 | 52 | 31 | 30 | 31 | 26 | 37 | 9 | 20 | 17 | 20 | 15 | 37 | 24 |
| No. of sets of high knee jack | 6 | 10 | 15 | 14 | 44 | 13 | 31 | 7 | 7 | 32 | 21 | 11 | 22 | 15 |
| No. of sets of corkscrew toe-touch | 4 | 20 | 10 | 16 | 31 | 12 | 18 | 6 | 4 | 32 | 15 | 9 | 36 | 15 |
| Number | Name | Explanation |
|---|---|---|
| 1 | COP | The displacements of the center of pressure of two feet during each repetition |
| 2 | Variance of COP | Deviation of COP velocities in anteroposterior (AP) and mediolateral (ML) directions during each repetition |
| 3 | STD of COP | Standard deviation of COP velocities in AP and ML directions during each repetition |
| 4 | Mean velocity | Mean velocity, which represents the total distance traveled by COP for each repetition in AP and ML directions |
| 5 | First derivative of COP | The change rates of COP displacements (i.e., velocity) for each repetition in AP and ML directions |
| 6 | Second derivative of COP | The change rates of COP velocities (i.e., acceleration) for each repetition in AP and ML directions |
| 7 | Skew of COP | The value of skewness of COP displacements for each repetition in AP and ML directions |
| 8 | Kurtosis of COP | The value of kurtosis of COP displacements for each repetition in AP and ML directions |
| 9 | Ellipse of COP | The area of the ellipse covered by the trajectory of the COP for each repetition with a 95% confidence interval |
Publisher’s Note: MDPI stays neutral with regard to jurisdictional claims in published maps and institutional affiliations. |
© 2021 by the authors. Licensee MDPI, Basel, Switzerland. This article is an open access article distributed under the terms and conditions of the Creative Commons Attribution (CC BY) license (http://creativecommons.org/licenses/by/4.0/).
Share and Cite
Jiang, Y.; Hernandez, V.; Venture, G.; Kulić, D.; K. Chen, B. A Data-Driven Approach to Predict Fatigue in Exercise Based on Motion Data from Wearable Sensors or Force Plate. Sensors 2021, 21, 1499. https://doi.org/10.3390/s21041499
Jiang Y, Hernandez V, Venture G, Kulić D, K. Chen B. A Data-Driven Approach to Predict Fatigue in Exercise Based on Motion Data from Wearable Sensors or Force Plate. Sensors. 2021; 21(4):1499. https://doi.org/10.3390/s21041499
Chicago/Turabian StyleJiang, Yanran, Vincent Hernandez, Gentiane Venture, Dana Kulić, and Bernard K. Chen. 2021. "A Data-Driven Approach to Predict Fatigue in Exercise Based on Motion Data from Wearable Sensors or Force Plate" Sensors 21, no. 4: 1499. https://doi.org/10.3390/s21041499
APA StyleJiang, Y., Hernandez, V., Venture, G., Kulić, D., & K. Chen, B. (2021). A Data-Driven Approach to Predict Fatigue in Exercise Based on Motion Data from Wearable Sensors or Force Plate. Sensors, 21(4), 1499. https://doi.org/10.3390/s21041499