Growth Mechanisms of ZnO Micro-Nanomorphologies and Their Role in Enhancing Gas Sensing Properties
Abstract
1. Introduction
2. Materials and Methods
2.1. Synthesis of ZnO Morphologies
2.2. Morphological, Textural and Structural Characterizations
2.3. Thick Film Gas Sensors Realization
2.4. Electrical Characterizations
3. Results and Discussion
3.1. Morphological, Textural, and Structural Characterizations
3.2. Morphology Dependence on ZnO-Precursor
3.3. Morphological Analysis of the Sensing Films
3.4. Electrical Characterization
4. Conclusions
Author Contributions
Funding
Informed Consent Statement
Data Availability Statement
Acknowledgments
Conflicts of Interest
References
- Sahota, J.K.; Gupta, N.; Dhawan, D. Fiber Bragg grating sensors for monitoring of physical parameters: A comprehensive review. Opt. Eng. 2020, 59, 060901. [Google Scholar] [CrossRef]
- Yang, Y.; Deng, Z.D. Stretchable sensors for environmental monitoring. Appl. Phys. Rev. 2019, 6, 011309. [Google Scholar] [CrossRef]
- Mehrotra, P. Biosensors and their applications—A review. J. Oral Biol. Craniofacial Res. 2016, 6, 153–159. [Google Scholar] [CrossRef] [PubMed]
- Fioravanti, A.; Carotta, M.C. Year 2020: A snapshot of the last progress in flexible printed gas sensors. Appl. Sci. 2020, 10, 1741. [Google Scholar] [CrossRef]
- Park, S.; Kim, C.H.; Lee, W.J.; Sung, S.; Yoon, M.-H. Sol-gel metal oxide dielectrics for all-solution-processed electronics. Mater. Sci. Eng. R Rep. 2017, 114, 1–22. [Google Scholar] [CrossRef]
- Esposito, S. “Traditional” sol-gel chemistry as a powerful tool for the preparation of supported metal and metal oxide catalysts. Materials 2019, 12, 668. [Google Scholar] [CrossRef] [PubMed]
- Teng, F.; Li, M.; Gao, C.; Zhang, G.; Zhang, P.; Wang, Y.; Chen, L.; Xie, E. Preparation of black TiO2 by hydrogen plasma assisted chemical vapor deposition and its photocatalytic activity. Appl. Catal. B Environ. 2014, 148–149, 339–343. [Google Scholar] [CrossRef]
- Hu, P.; Han, N.; Zhang, D.; Ho, J.C.; Chen, Y. Highly formaldehyde-sensitive, transition-metal doped ZnO nanorods prepared by plasma-enhanced chemical vapor deposition. Sens. Actuators B Chem. 2012, 169, 74–80. [Google Scholar] [CrossRef]
- Hämäläinen, J.; Ritala, M.; Leskelä, M. Atomic layer deposition of noble metals and their oxides. Chem. Mater. 2014, 26, 786–801. [Google Scholar] [CrossRef]
- Coscia, U.; Ambrosone, G.; Lettieri, S.; Maddalena, P.; Rigato, V.; Restello, S.; Bobeico, E.; Tucci, M. Preparation of microcrystalline silicon–carbon films. Sol. Energy Mater. Sol. Cells 2005, 87, 433–444. [Google Scholar] [CrossRef]
- Ambrosone, G.; Coscia, U.; Lettieri, S.; Maddalena, P.; Minarini, C. Optical, structural and electrical properties of μc-Si:H films deposited by SiH4+H2. Mater. Sci. Eng. B 2003, 101, 236–241. [Google Scholar] [CrossRef]
- Diebold, U. The surface science of titanium dioxide. Surf. Sci. Rep. 2003, 48, 53–229. [Google Scholar] [CrossRef]
- Batzill, M.; Diebold, U. The surface and materials science of tin oxide. Prog. Surf. Sci. 2005, 79, 47–154. [Google Scholar] [CrossRef]
- Trani, F.; Causà, M.; Lettieri, S.; Setaro, A.; Ninno, D.; Barone, V.; Maddalena, P. Role of surface oxygen vacancies in photoluminescence of tin dioxide nanobelts. Microelectron. J. 2009, 40, 236–238. [Google Scholar] [CrossRef]
- Pallotti, D.K.; Passoni, L.; Gesuele, F.; Maddalena, P.; Di Fonzo, F.; Lettieri, S. Giant O2-induced photoluminescence modulation in hierarchical titanium dioxide nanostructures. ACS Sensors 2017, 2, 61–68. [Google Scholar] [CrossRef]
- Setaro, A.; Bismuto, A.; Lettieri, S.; Maddalena, P.; Comini, E.; Bianchi, S.; Baratto, C.; Sberveglieri, G. Optical sensing of NO2 in tin oxide nanowires at sub-ppm level. Sens. Actuators B 2008, 130, 391–395. [Google Scholar] [CrossRef]
- Pallotti, D.; Orabona, E.; Amoruso, S.; Maddalena, P.; Lettieri, S. Modulation of mixed-phase titania photoluminescence by oxygen adsorption. Appl. Phys. Lett. 2014, 105, 031903. [Google Scholar] [CrossRef]
- Sanchez, P.; Zamarreño, C.R.; Hernaez, M.; Matías, I.R.; Arregui, F.J. Optical fiber refractometers based on Lossy Mode Resonances by means of SnO2 sputtered coatings. Sens. Actuators B 2014, 202, 154–159. [Google Scholar] [CrossRef]
- Ricciardi, C.; Ballarini, V.; Galli, M.; Liscidini, M.; Andreani, L.; Losurdo, M.; Bruno, G.; Lettieri, S.; Gesuele, F.; Maddalena, P.; et al. Amorphous Silicon Nitride: A suitable alloy for optical multilayered structures. J. Non-Crystalline Solids 2006, 352, 1294–1297. [Google Scholar] [CrossRef]
- Passoni, L.; Criante, L.; Fumagalli, F.; Scotognella, F.; Lanzani, G.; Di Fonzo, F. Self-assembled hierarchical nanostructures for high-efficiency porous photonic crystals. ACS Nano 2014, 8, 12167–12174. [Google Scholar] [CrossRef]
- Perez, A.O.; Bierer, B.; Scholz, L.; Wöllenstein, J.; Palzer, S. A Wireless gas sensor network to monitor indoor environmental quality in schools. Sensors 2018, 18, 4345. [Google Scholar] [CrossRef] [PubMed]
- Fioravanti, A.; Bonanno, A.; Gherardi, S.; Carotta, M.C.; Skouloudis, A.N. A portable air-quality station based on thick film gas sensors for real time detection of traces of atmospheric pollutants. In Proceedings of the IOP Conference Series: Materials Science and Engineering—5th International Conference on Materials and Applications for Sensors and Transducers (IC-MAST2015), Mykonos, Greece, 27–30 September 2015; Volume 108, p. 012005. [Google Scholar]
- Carotta, M.; Cervi, A.; Fioravanti, A.; Gherardi, S.; Giberti, A.; Vendemiati, B.; Vincenzi, D.; Sacerdoti, M. A novel ozone detection at room temperature through UV-LED-assisted ZnO thick film sensors. Thin Solid Film 2011, 520, 939–946. [Google Scholar] [CrossRef]
- Carotta, M.C.; Benetti, M.; Ferrari, E.; Giberti, A.; Malagù, C.; Nagliati, M.; Vendemiati, B.; Martinelli, G. Basic interpretation of thick film gas sensors for atmospheric application. Sens. Actuators B Chem. 2007, 126, 672–677. [Google Scholar] [CrossRef]
- Rickerby, D.G.; Serventi, A.M. Nanostructured metal oxide gas sensors for air-quality monitoring. In Environanotechnology; Elsevier: Amsterdam, The Netherlands, 2010; pp. 99–136. ISBN 9780080548203. [Google Scholar]
- Zheng, X.; Cheng, H. Flexible and stretchable metal oxide gas sensors for healthcare. Sci. China Ser. E 2018, 62, 209–223. [Google Scholar] [CrossRef]
- Galstyan, V.; Ponzoni, A.; Kholmanov, I.; Natile, M.M.; Comini, E.; Sberveglieri, G. Highly sensitive and selective detection of dimethylamine through Nb-doping of TiO2 nanotubes for potential use in seafood quality control. Sens. Actuators B 2020, 303, 127217. [Google Scholar] [CrossRef]
- Fioravanti, A.; Marani, P.; Massarotti, G.; Lettieri, S.; Morandi, S.; Carotta, M. (Ti,Sn) Solid solution-based gas sensors for new monitoring of hydraulic oil degradation. Materials 2021, 14, 605. [Google Scholar] [CrossRef]
- Galstyan, V. Porous TiO2-based gas sensors for cyber chemical systems to provide security and medical diagnosis. Sensors 2017, 17, 2947. [Google Scholar] [CrossRef] [PubMed]
- Korotcenkov, G.; Cho, B.K. Engineering approaches for the improvement of conductometric gas sensor parameters: Part 1. Improvement of sensor sensitivity and selectivity (short survey). Sens Actuators B Chem. 2013, 188, 709–728. [Google Scholar] [CrossRef]
- Smulko, J.M.; Trawka, M.; Granqvist, C.G.; Ionescu, R.; Annanouch, F.; Llobet, E.; Kish, L.B. New approaches for improving selectivity and sensitivity of resistive gas sensors: A review. Sens. Rev. 2015, 35, 340–347. [Google Scholar] [CrossRef]
- Carotta, M.; Fioravanti, A.; Gherardi, S.; Malagù, C.; Sacerdoti, M.; Ghiotti, G.; Morandi, S. (Ti,Sn) solid solutions as functional materials for gas sensing. Sens. Actuators B Chem. 2014, 194, 195–205. [Google Scholar] [CrossRef]
- Galstyan, V. “Quantum dots: Perspectives in next-generation chemical gas sensors”—A review. Anal. Chim. Acta 2021, 238192. [Google Scholar] [CrossRef]
- Carotta, M.; Cervi, A.; Di Natale, V.; Gherardi, S.; Giberti, A.; Guidi, V.; Puzzovio, D.; Vendemiati, B.; Martinelli, G.; Sacerdoti, M.; et al. ZnO gas sensors: A comparison between nanoparticles and nanotetrapods-based thick films. Sens. Actuators B Chem. 2009, 137, 164–169. [Google Scholar] [CrossRef]
- Galstyan, V.; Poli, N.; Comini, E. Highly sensitive and selective H2S chemical sensor based on ZnO nanomaterial. Appl. Sci. 2019, 9, 1167. [Google Scholar] [CrossRef]
- Fioravanti, A.; Bonanno, A.; Mazzocchi, M.; Carotta, M.C.; Sacerdoti, M. Enhanced gas sensing properties of different ZnO 3D hierarchical structures. Adv. Sci. Technol. 2016, 99, 48–53. [Google Scholar] [CrossRef]
- Zhao, G.; Xuan, J.; Liu, X.; Jia, F.; Sun, Y.; Sun, M.; Yin, G.; Liu, B. Low-Cost and High-performance ZnO nanoclusters gas sensor based on new-type FTO electrode for the low-concentration H2S gas detection. Nanomaterials 2019, 9, 435. [Google Scholar] [CrossRef]
- Andre, R.S.; Kwak, D.; Dong, Q.; Zhong, W.; Correa, D.S.; Mattoso, L.H.C.; Lei, Y. Sensitive and selective NH3 monitoring at room temperature using ZnO ceramic nanofibers decorated with poly(styrene sulfonate). Sensors 2018, 18, 1058. [Google Scholar] [CrossRef] [PubMed]
- Kanaparthi, S.; Singh, S.G. Highly sensitive and ultra-fast responsive ammonia gas sensor based on 2D ZnO nanoflakes. Mater. Sci. Energy Technol. 2020, 3, 91–96. [Google Scholar] [CrossRef]
- Mhlongo, G.H.; Motaung, D.E.; Cummings, F.R.; Swart, H.C.; Ray, S.S. A highly responsive NH3 sensor based on Pd-loaded ZnO nanoparticles prepared via a chemical precipitation approach. Sci. Rep. 2019, 9, 9881. [Google Scholar] [CrossRef] [PubMed]
- Bhatia, S.; Verma, N.; Bedi, R. Ethanol gas sensor based upon ZnO nanoparticles prepared by different techniques. Results Phys. 2017, 7, 801–806. [Google Scholar] [CrossRef]
- Xuan, J.; Zhao, G.; Sun, M.; Jia, F.; Wang, X.; Zhou, T.; Yin, G.; Liu, B. Low-temperature operating ZnO-based NO2 sensors: A review. RSC Adv. 2020, 10, 39786–39807. [Google Scholar] [CrossRef]
- Galstyan, V.; Comini, E.; Baratto, C.; Faglia, G.; Sberveglieri, G. Nanostructured ZnO chemical gas sensors. Ceram. Int. 2015, 41, 14239–14244. [Google Scholar] [CrossRef]
- Zhang, S.; Nguyen, S.T.; Nguyen, T.H.; Yang, W.; Noh, J.-S. Effect of the morphology of solution-grown ZnO nanostructures on gas-sensing properties. J. Am. Ceram. Soc. 2017, 100, 5629–5637. [Google Scholar] [CrossRef]
- Alenezi, M.R.; Henley, S.J.; Emerson, N.G.; Silva, S.R.P. From 1D and 2D ZnO nanostructures to 3D hierarchical structures with enhanced gas sensing properties. Nanoscale 2014, 6, 235–247. [Google Scholar] [CrossRef]
- Gupta, S.K.; Joshi, A.; Kaur, M. Development of gas sensors using ZnO nanostructures. J. Chem. Sci. 2010, 122, 57–62. [Google Scholar] [CrossRef]
- Kar, S.; Pal, B.N.; Chaudhuri, S.; Chakravorty, D. One-dimensional ZnO nanostructure arrays: Synthesis and characterization. J. Phys. Chem. B 2006, 110, 4605–4611. [Google Scholar] [CrossRef]
- Krishnakumar, T.; Jayaprakash, R.; Pinna, N.; Donato, N.; Bonavita, A.; Micali, G.; Neri, G. CO gas sensing of ZnO nanostructures synthesized by an assisted microwave wet chemical route. Sens. Actuators B Chem. 2009, 143, 198–204. [Google Scholar] [CrossRef]
- Kumar, R.; Aldossary, O.M.; Kumar, G.; Umar, A. Zinc oxide nanostructures for NO2 gas–sensor applications: A Review. Nano Micro Lett. 2015, 7, 97–120. [Google Scholar] [CrossRef] [PubMed]
- Zhu, L.; Zeng, W. Room-temperature gas sensing of ZnO-based gas sensor: A review. Sens. Actuators A Phys. 2017, 267, 242–261. [Google Scholar] [CrossRef]
- Bhati, V.S.; Hojamberdiev, M.; Kumar, M. Enhanced sensing performance of ZnO nanostructures-based gas sensors: A review. Energy Rep. 2020, 6, 46–62. [Google Scholar] [CrossRef]
- Xu, S.; Wang, Z.L. One-dimensional ZnO nanostructures: Solution growth and functional properties. Nano Res. 2011, 4, 1013–1098. [Google Scholar] [CrossRef]
- Prudenziati, M.; Hormadaly, J. Printed Films: Materials Science and Applications in Sensors, Electronics and Photonics; Elsevier: Amsterdam, The Netherlands, 2012; ISBN 9781845699888. [Google Scholar]
- Morandi, S.; Fioravanti, A.; Cerrato, G.; Lettieri, S.; Sacerdoti, M.; Carotta, M. Facile synthesis of ZnO nano-structures: Morphology influence on electronic properties. Sens. Actuators B Chem. 2017, 249, 581–589. [Google Scholar] [CrossRef]
- Wiles, D.B.; Young, R.A. A new computer program for Rietveld analysis of X-ray powder diffraction patterns. J. Appl. Crystallogr. 1981, 14, 149–151. [Google Scholar] [CrossRef]
- Holzwarth, U.; Gibson, N.W. The Scherrer equation versus the ‘Debye-Scherrer equation’. Nat. Nanotechnol. 2011, 6, 534. [Google Scholar] [CrossRef] [PubMed]
- Meyer, B.; Marx, D. Density-functional study of the structure and stability of ZnO surfaces. Phys. Rev. B 2003, 67. [Google Scholar] [CrossRef]
- Wang, Z.L. Zinc oxide nanostructures: Growth, properties and applications. J. Physics 2004, 16, 829–858. [Google Scholar] [CrossRef]
- Li, W.-J.; Shi, E.-W.; Zhong, W.-Z.; Yin, Z.-W. Growth mechanism and growth habit of oxide crystals. J. Cryst. Growth 1999, 203, 186–196. [Google Scholar] [CrossRef]
- Qu, X.-R.; Jia, D.-C. Synthesis of octahedral ZnO mesoscale superstructures via thermal decomposing octahedral zinc hydroxide precursors. J. Cryst. Growth 2009, 311, 1223–1228. [Google Scholar] [CrossRef]
- Pholnak, C.; Sirisathitkul, C.; Harding, D.J. Characterizations of octahedral zinc oxide synthesized by sonochemical method. J. Phys. Chem. Solids 2011, 72, 817–823. [Google Scholar] [CrossRef]
- Klein, C.; Hurlbut, C.S., Jr.; Dana, J.D. Manual of Mineralogy: (After James D. Dana); Wiley & Sons: Hoboken, NJ, USA, 1999; Volume 36, pp. 36–5706. [Google Scholar]
- Jia, W.; Dang, S.; Liu, H.; Zhang, Z.; Yu, C.; Liu, X.; Xu, B. Evidence of the formation mechanism of ZnO in aqueous solution. Mater. Lett. 2012, 82, 99–101. [Google Scholar] [CrossRef]
- Rothschild, A.; Komem, Y. The effect of grain size on the sensitivity of nanocrystalline metal-oxide gas sensors. J. Appl. Phys. 2004, 95, 6374–6380. [Google Scholar] [CrossRef]
- Yamazoe, N.; Shimanoe, K. Receptor function and response of semiconductor gas sensor. J. Sensors 2009, 2009, 1–21. [Google Scholar] [CrossRef]
- Fioravanti, A.; Morandi, S.; Carotta, M. Chemoresistive gas sensors for sub-ppm acetone detection. Procedia Eng. 2016, 168, 485–488. [Google Scholar] [CrossRef]
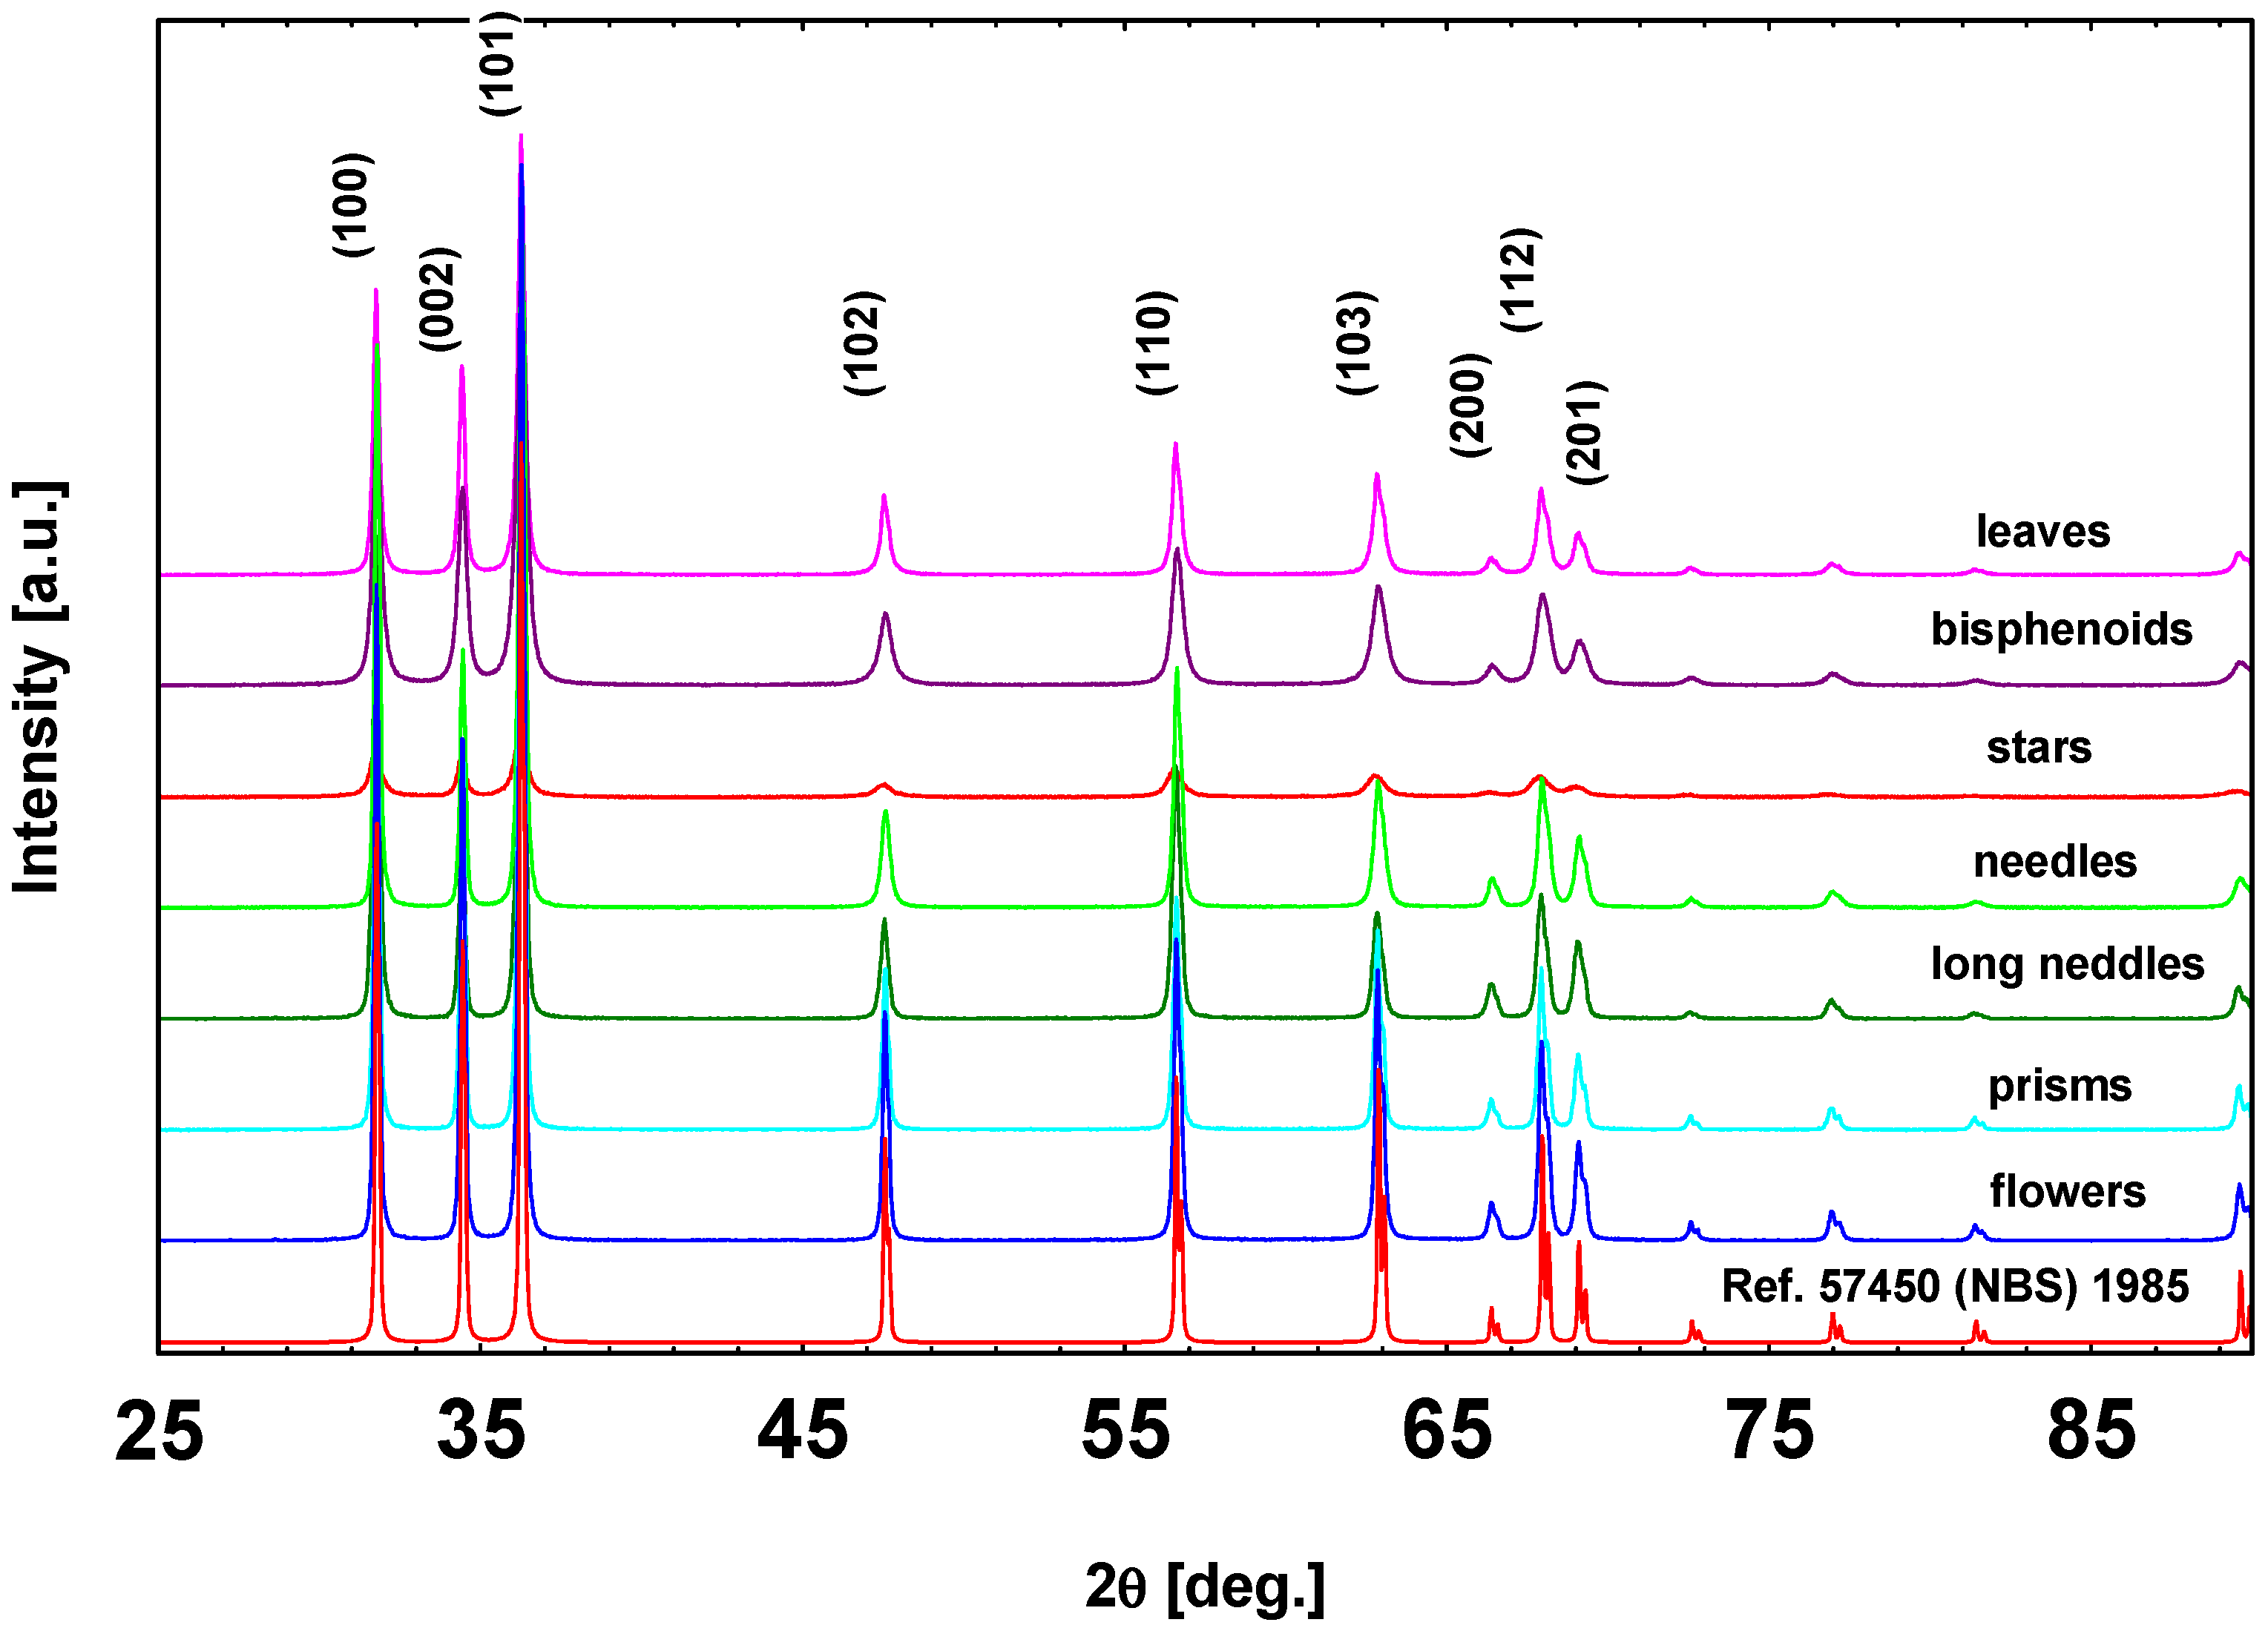

| Sample | Structure | a (Å) | c (Å) | Vol. (Å3) | RB | Crystallite Size |
|---|---|---|---|---|---|---|
Leaves | Wurtzite (P63mc) | 3.24899 (3) | 5.20664 (8) | 47.598 (1) | 2.65 | 26 |
Bisphenoids | Wurtzite (P63mc) | 3.25018 (3) | 5.20819 (8) | 47.647 (1) | 1.76 | 24 |
Stars | Wurtzite (P63mc) | 3.25262 (5) | 5.21199 (13) | 47.753 (1) | 2.41 | 29 |
Needles | Wurtzite (P63mc) | 3.25012 (2) | 5.20789 (7) | 47.642 (1) | 2.18 | 48 |
Long needles | Wurtzite (P63mc) | 3.25081 (2) | 5.20918 (7) | 47.674 (1) | 2.63 | 39 |
Flowers | Wurtzite (P63mc) | 3.24988 (2) | 5.20624 (4) | 47.620 (1) | 2.70 | 49 |
Prisms | Wurtzite (P63mc) | 3.25064 (3) | 5.20776 (7) | 47.656 (1) | 3.39 | 49 |
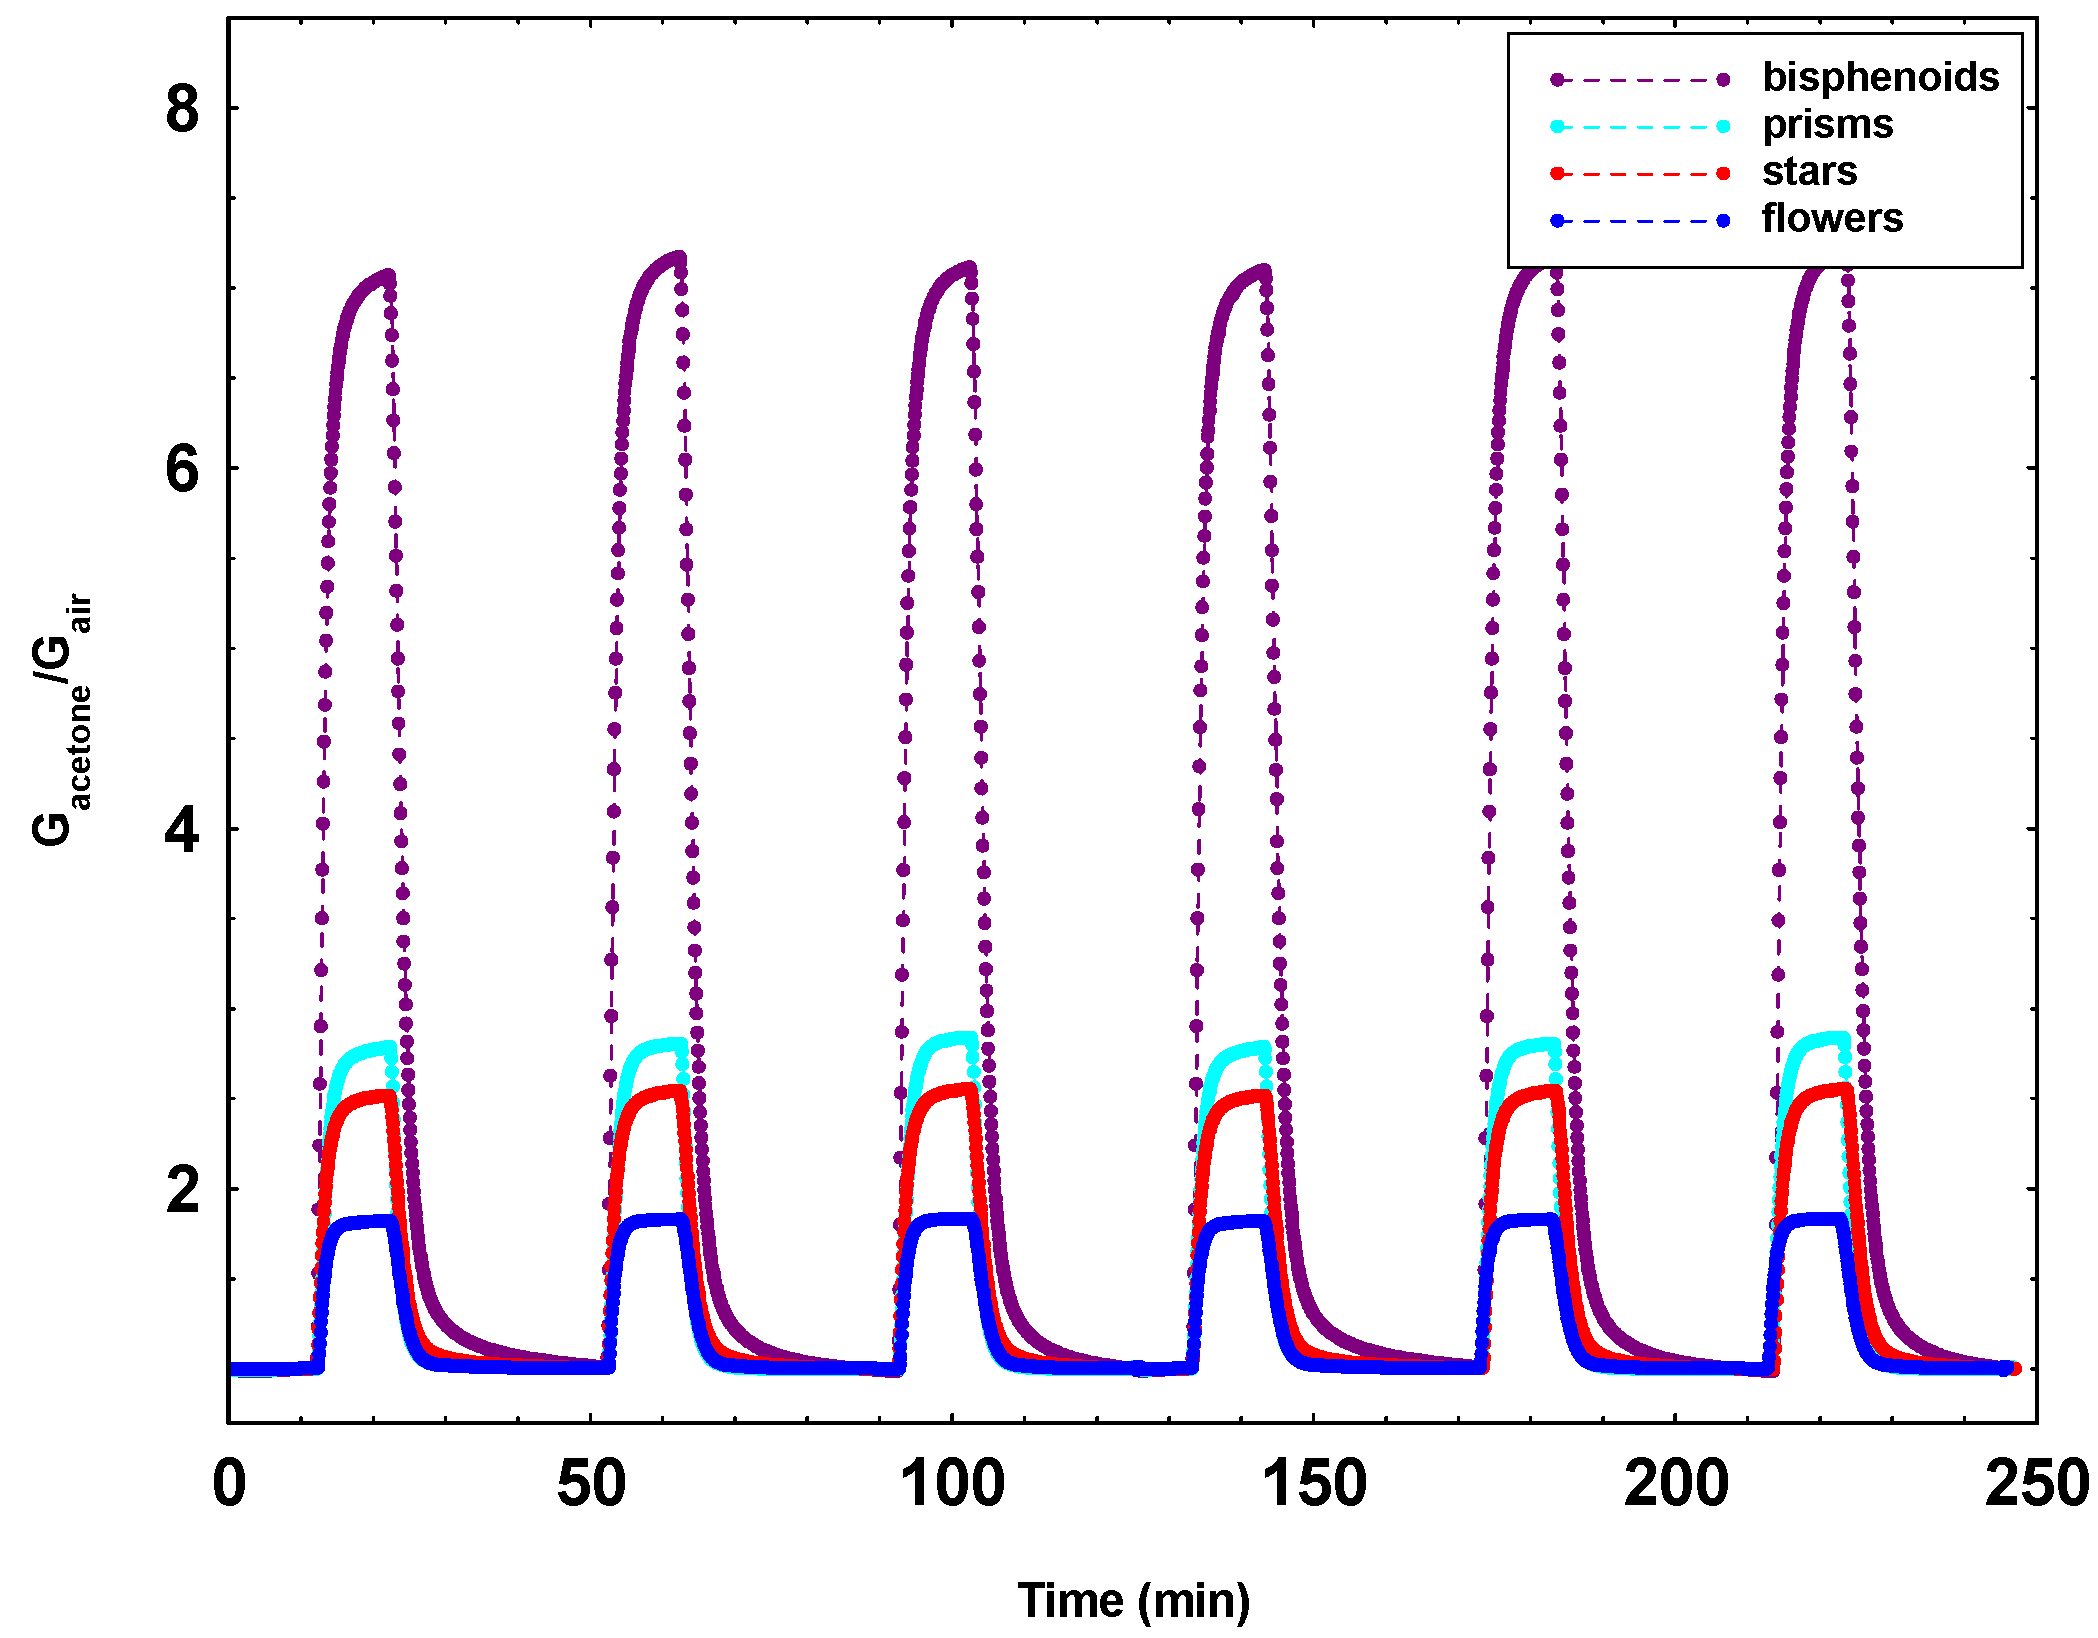
| Sensors Responses Gacetone/Gair | 350 °C | 400 °C | 450 °C | 500 °C | 550 °C | |
|---|---|---|---|---|---|---|
 | Leaves | 8.6 | 13.4 | 21.4 | 19.6 | 7.2 |
 | Bisphenoids | 17.0 | 26.4 | 23.9 | 19.9 | 5.5 |
 | Stars | 3.5 | 4.9 | 6.4 | 7.7 | 10.5 |
 | Needles | 4.8 | 5.3 | 6.4 | 10.6 | 5.1 |
 | Long needles | 5.0 | 5.4 | 6.5 | 11.0 | 5.5 |
 | Flowers | 4.3 | 4.8 | 5.6 | 9.4 | 7.3 |
 | Prisms | 6.3 | 8.5 | 11.9 | 13.0 | 11.5 |
Publisher’s Note: MDPI stays neutral with regard to jurisdictional claims in published maps and institutional affiliations. |
© 2021 by the authors. Licensee MDPI, Basel, Switzerland. This article is an open access article distributed under the terms and conditions of the Creative Commons Attribution (CC BY) license (http://creativecommons.org/licenses/by/4.0/).
Share and Cite
Fioravanti, A.; Marani, P.; Morandi, S.; Lettieri, S.; Mazzocchi, M.; Sacerdoti, M.; Carotta, M.C. Growth Mechanisms of ZnO Micro-Nanomorphologies and Their Role in Enhancing Gas Sensing Properties. Sensors 2021, 21, 1331. https://doi.org/10.3390/s21041331
Fioravanti A, Marani P, Morandi S, Lettieri S, Mazzocchi M, Sacerdoti M, Carotta MC. Growth Mechanisms of ZnO Micro-Nanomorphologies and Their Role in Enhancing Gas Sensing Properties. Sensors. 2021; 21(4):1331. https://doi.org/10.3390/s21041331
Chicago/Turabian StyleFioravanti, Ambra, Pietro Marani, Sara Morandi, Stefano Lettieri, Mauro Mazzocchi, Michele Sacerdoti, and Maria Cristina Carotta. 2021. "Growth Mechanisms of ZnO Micro-Nanomorphologies and Their Role in Enhancing Gas Sensing Properties" Sensors 21, no. 4: 1331. https://doi.org/10.3390/s21041331
APA StyleFioravanti, A., Marani, P., Morandi, S., Lettieri, S., Mazzocchi, M., Sacerdoti, M., & Carotta, M. C. (2021). Growth Mechanisms of ZnO Micro-Nanomorphologies and Their Role in Enhancing Gas Sensing Properties. Sensors, 21(4), 1331. https://doi.org/10.3390/s21041331


