
Real-Time Rainfall Estimation Using Microwave Links: A Case Study in East China during the Plum Rain Season in 2020


Abstract
1. Introduction
2. Method for Estimating the Path-Averaged Rain Rate by CML
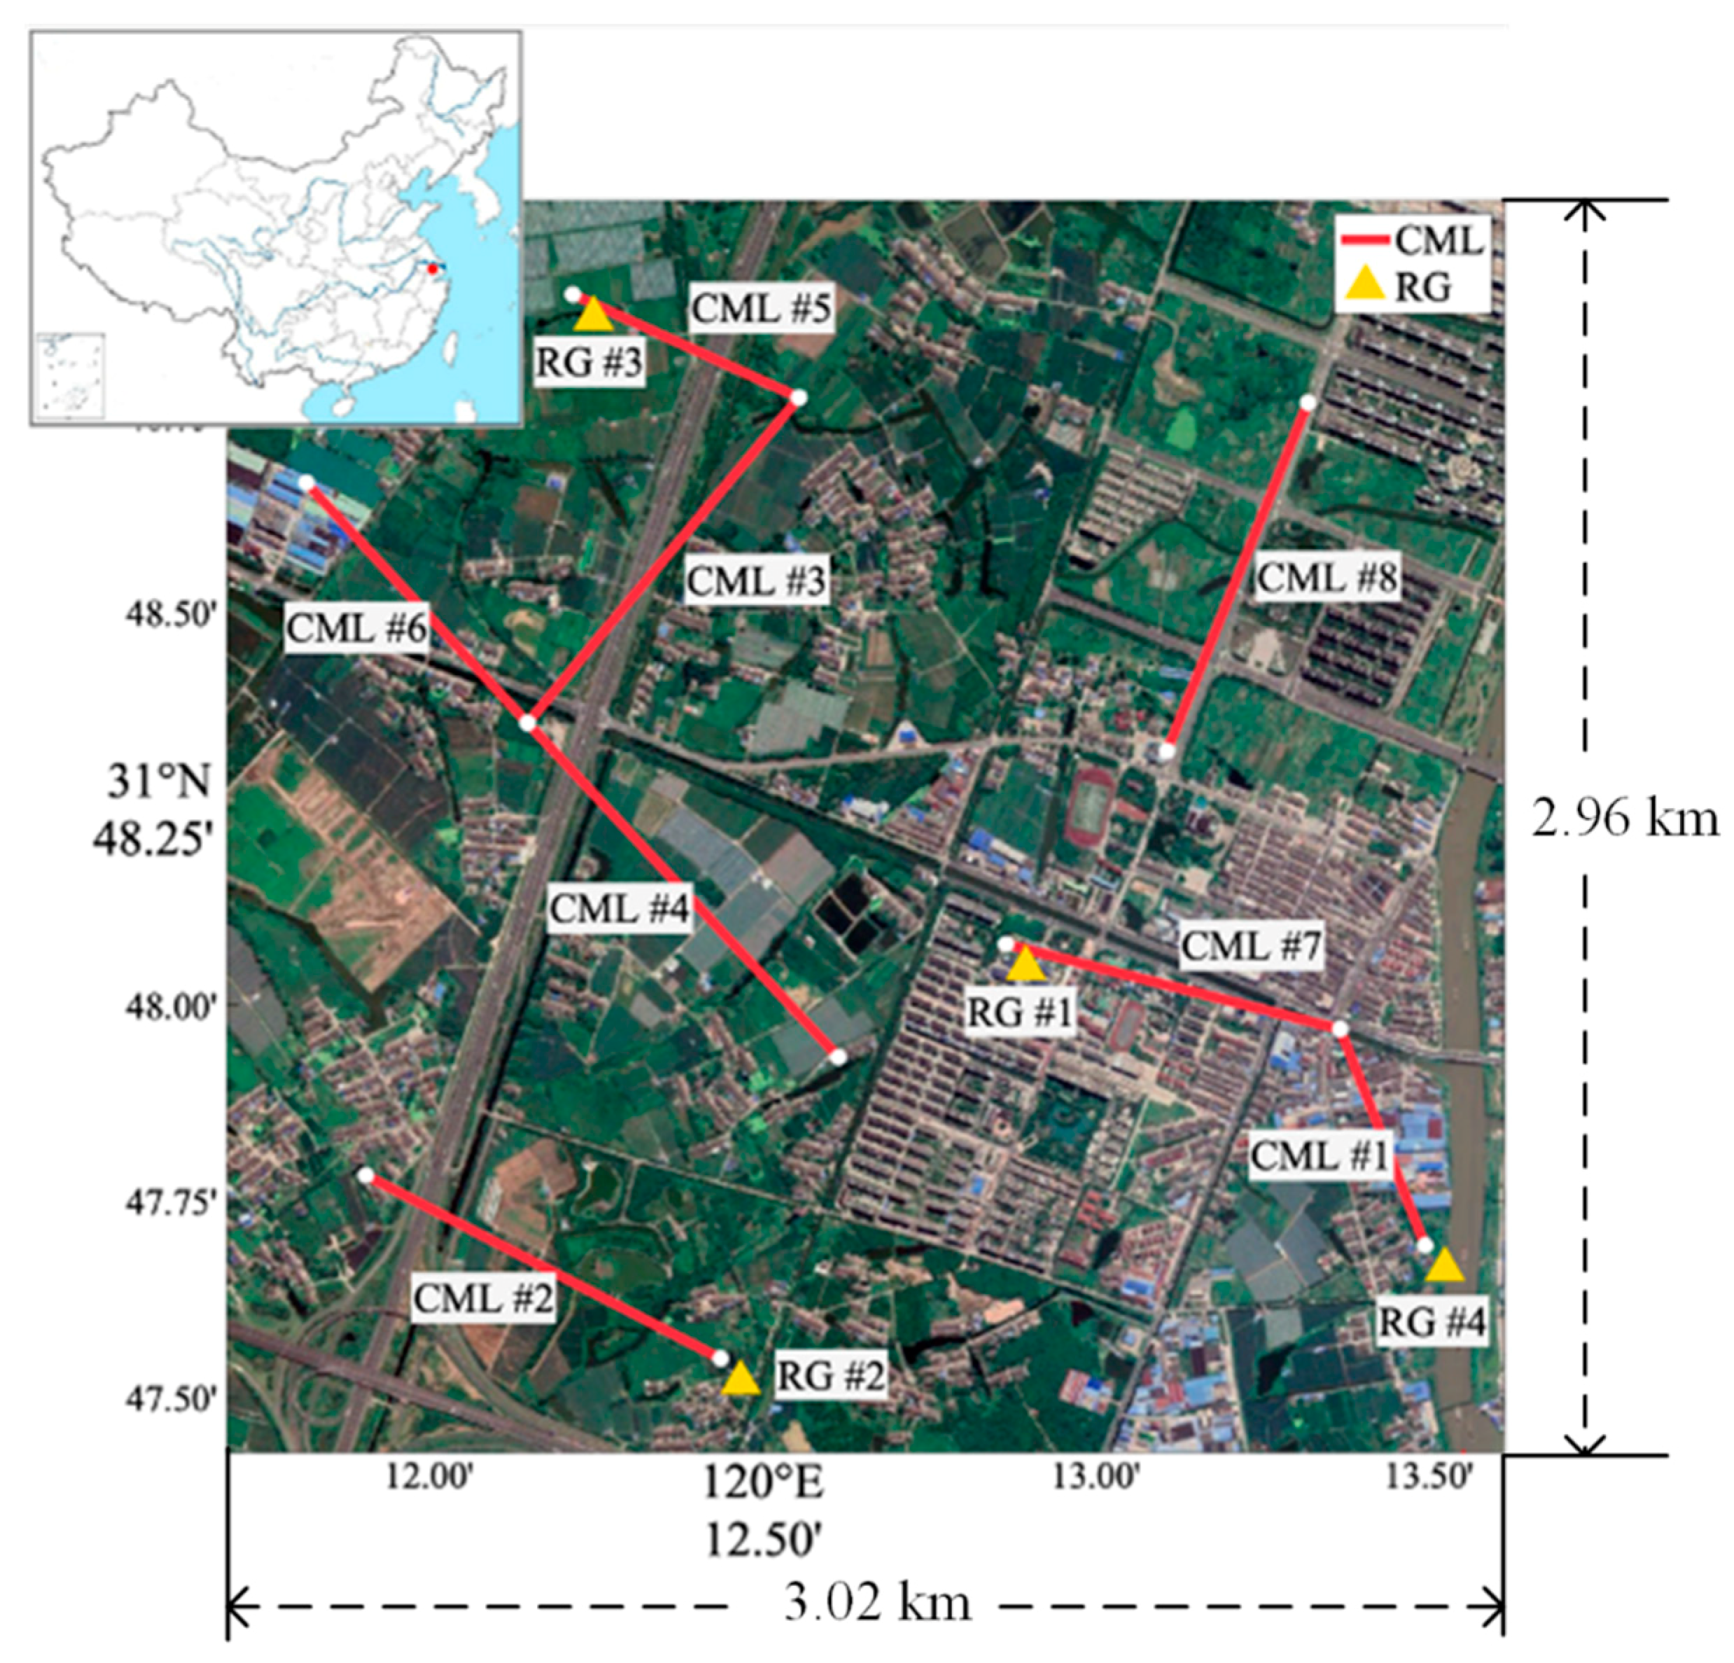
3. Data
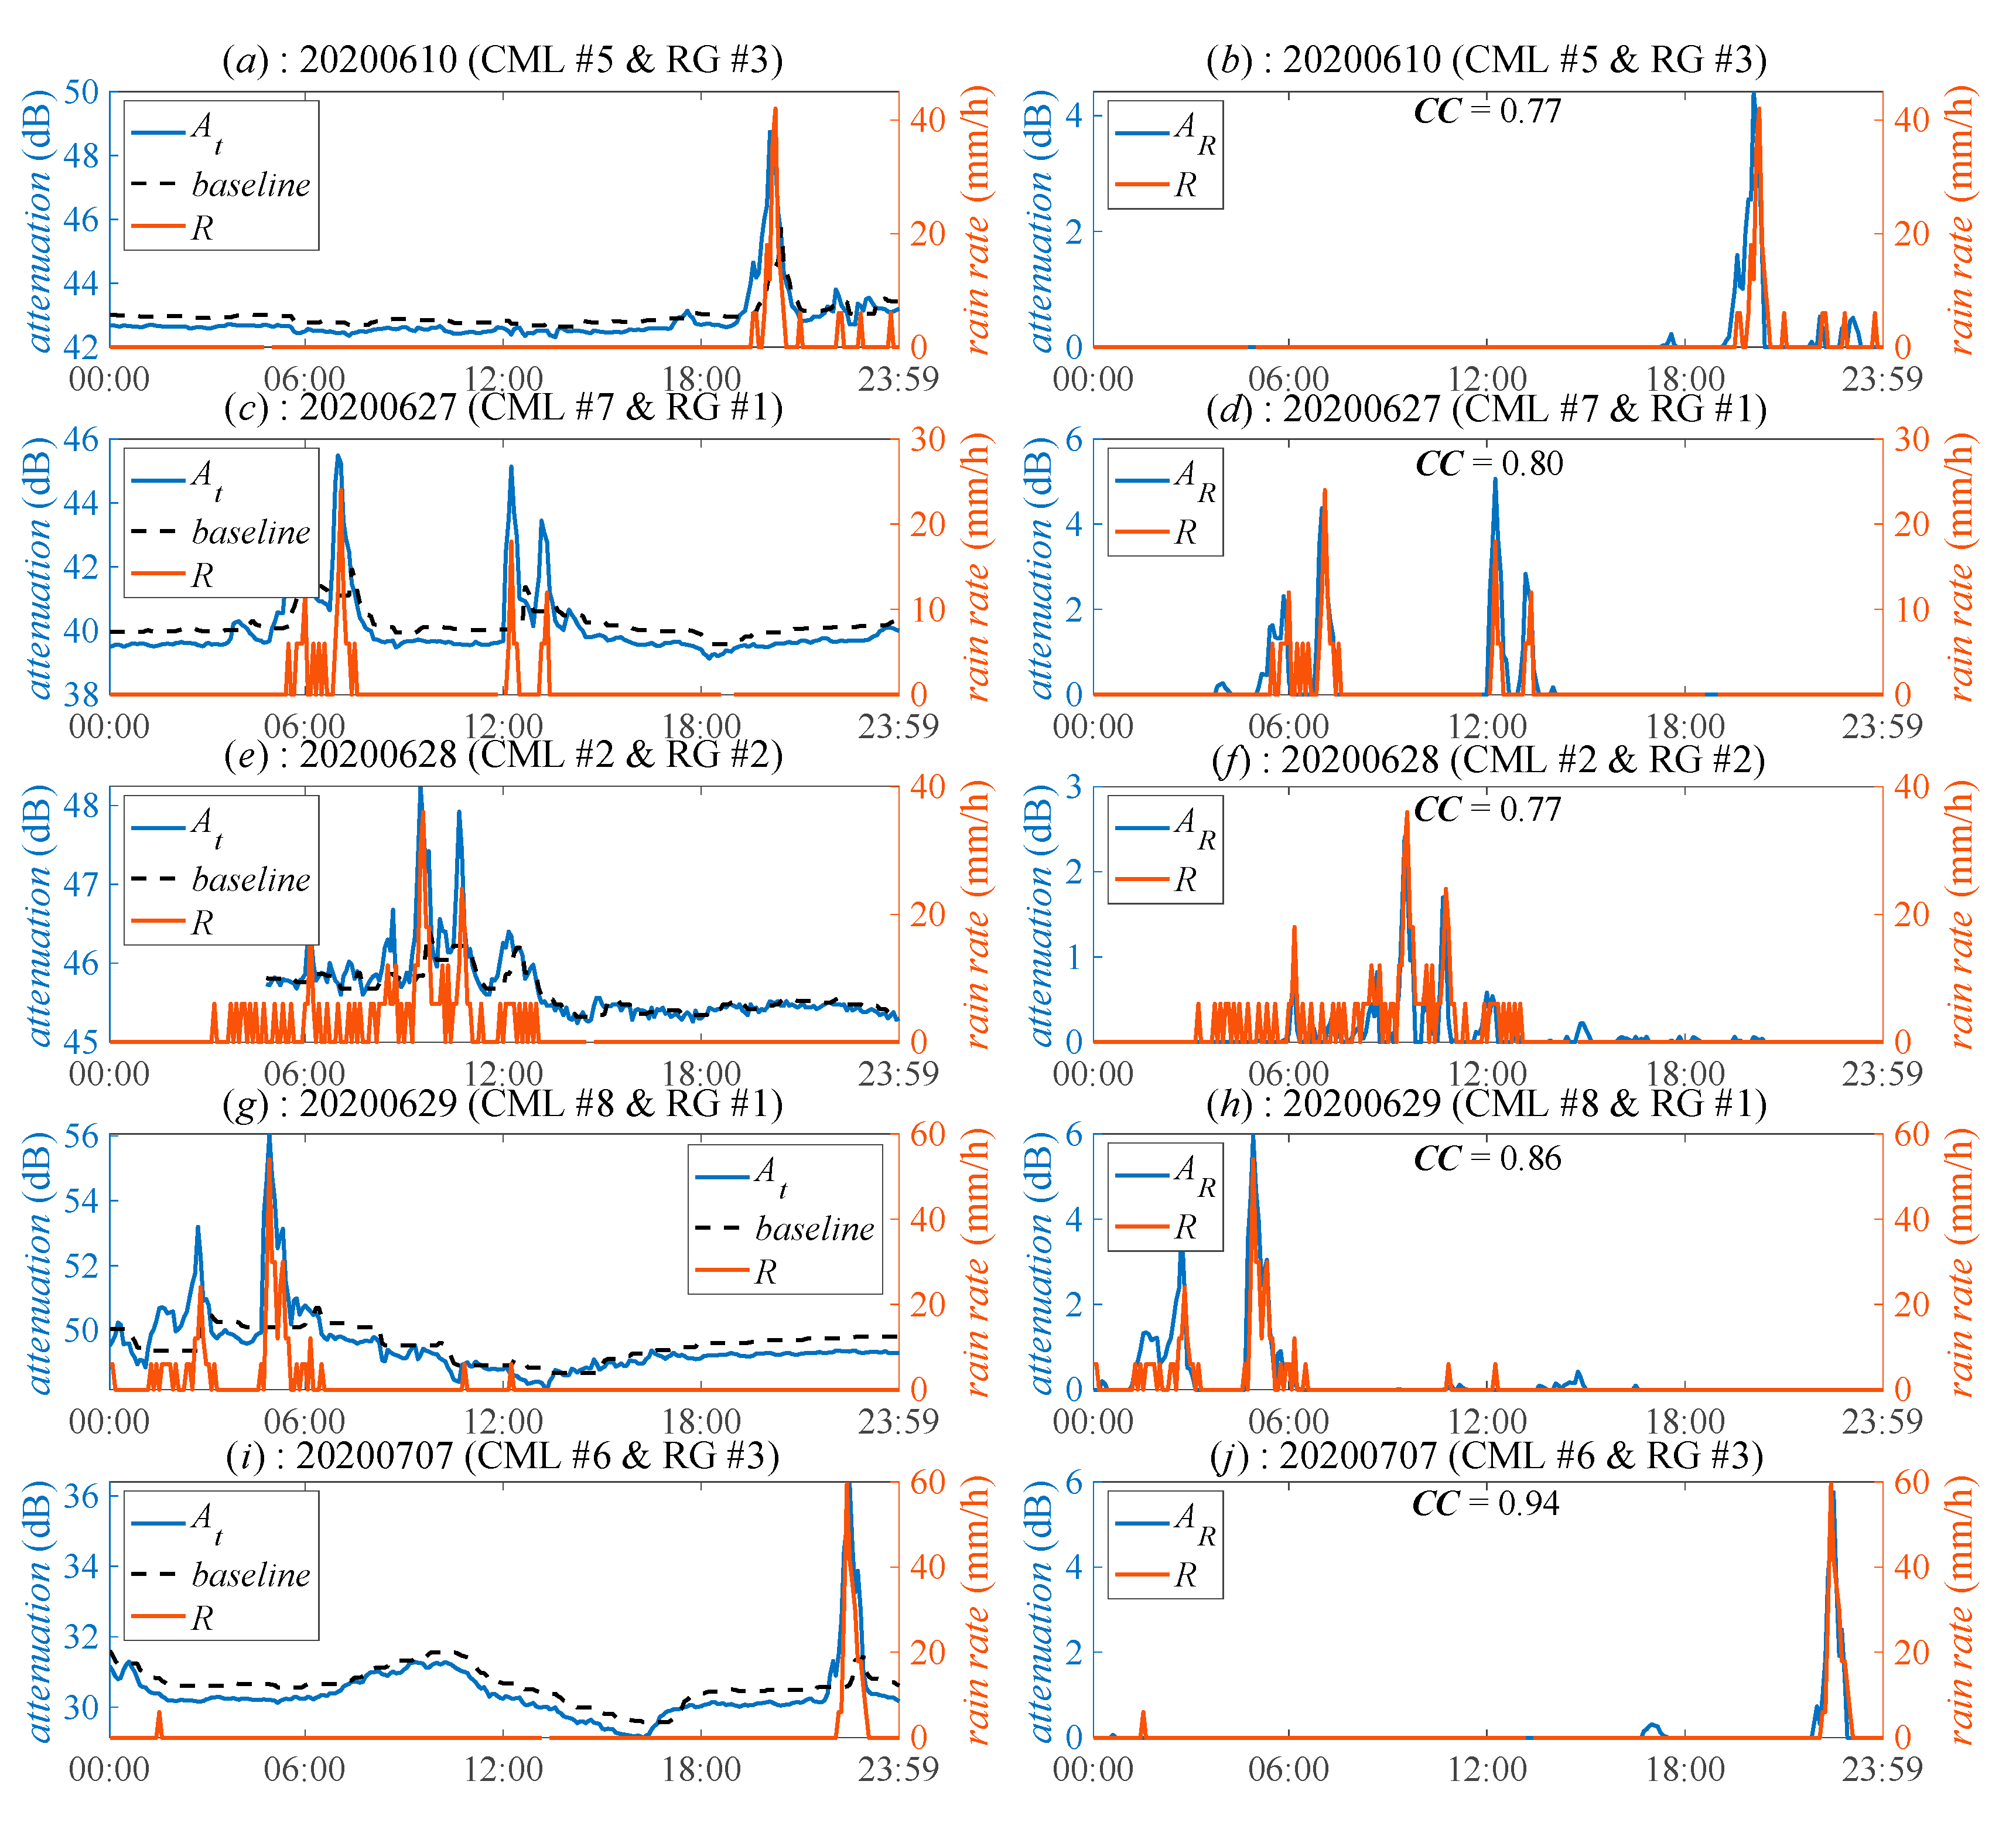
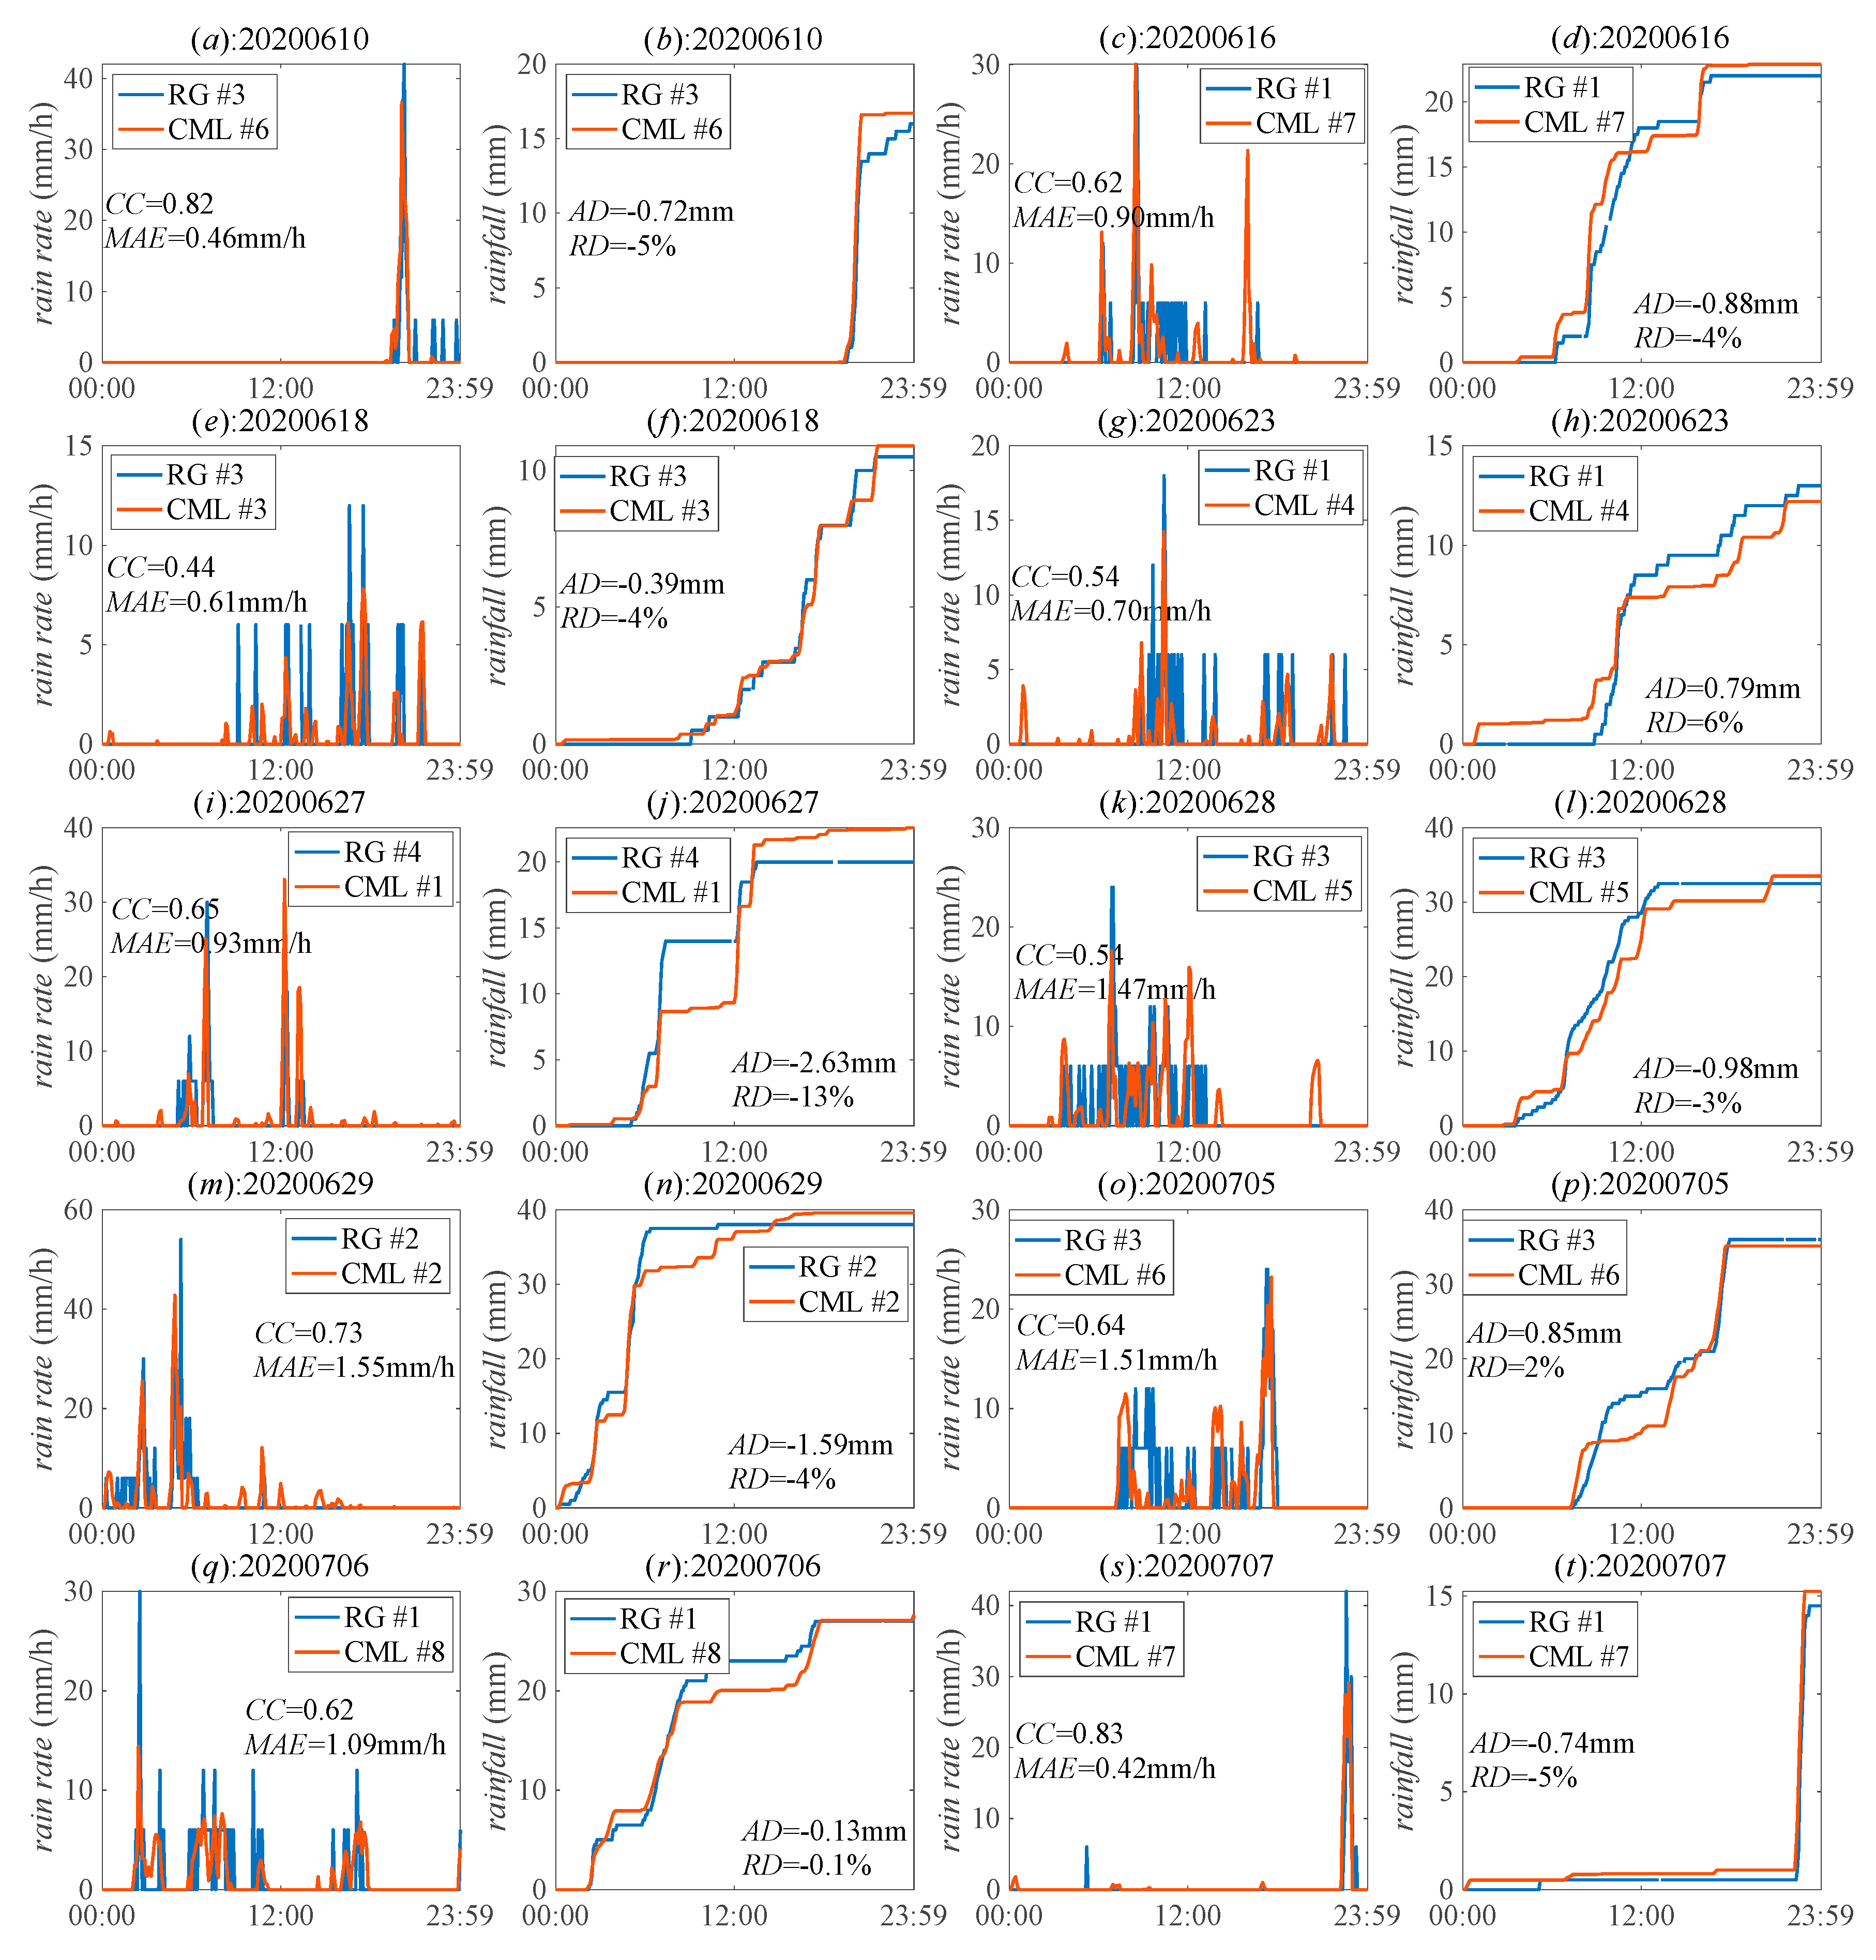
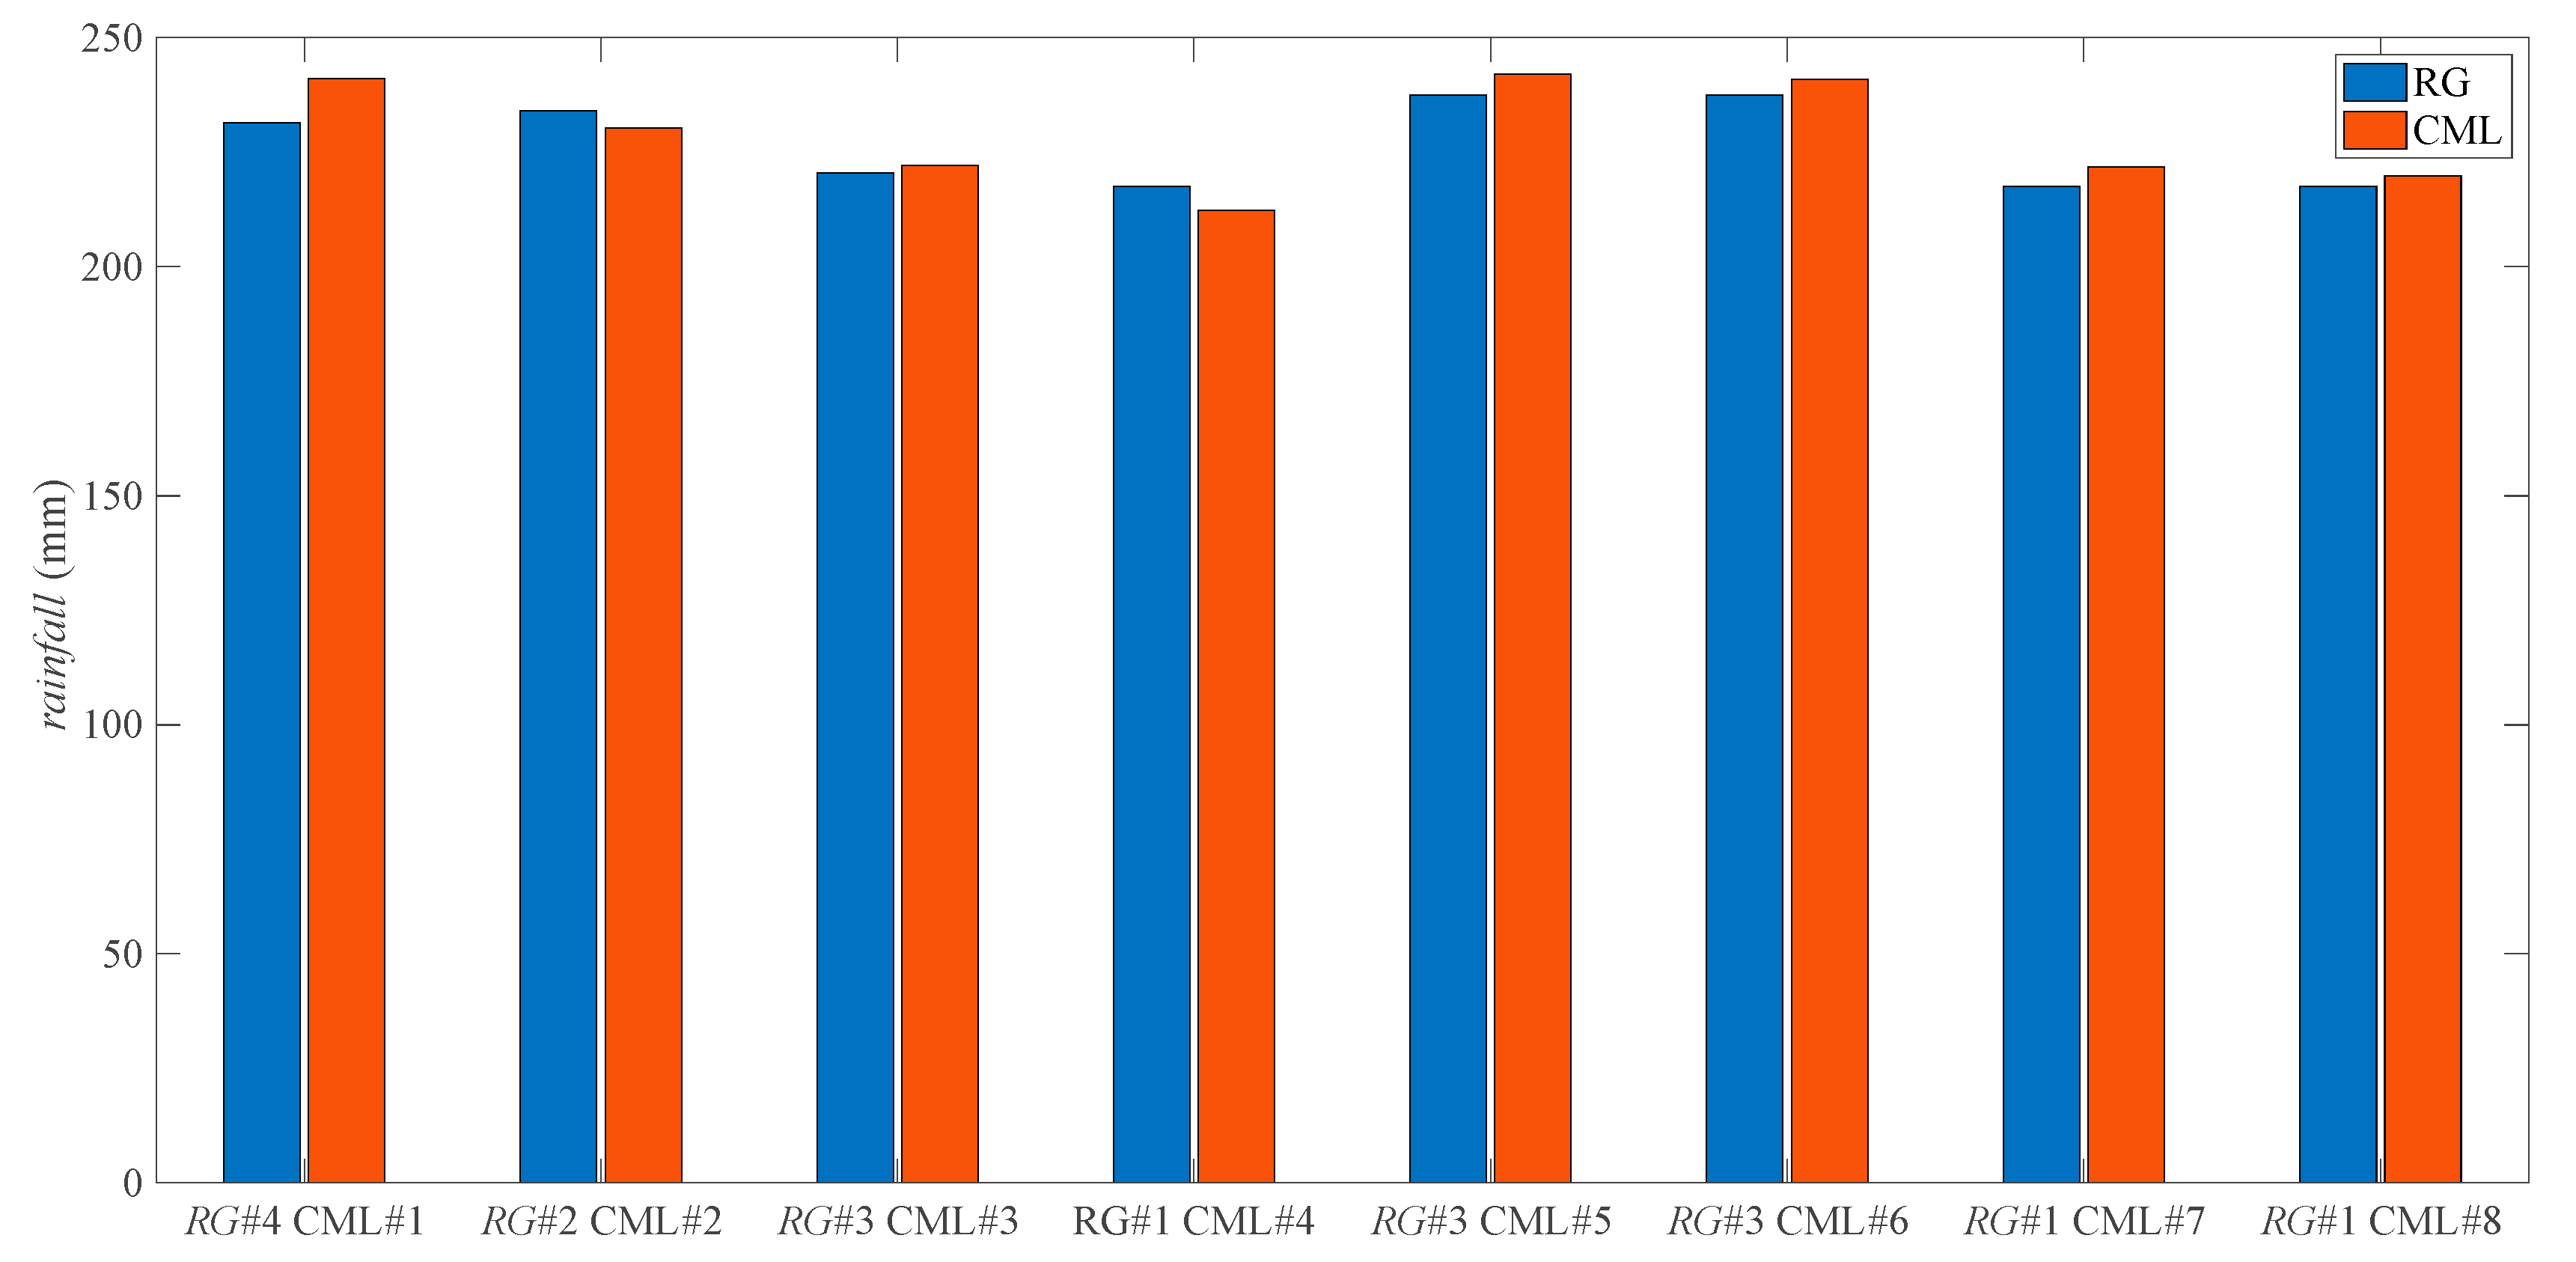
4. Results
5. Discussions
5.1. Influence of the Frequency and the Length of CML
5.2. Advantages and Limitations of the Rainfall Estimation by CMLs
5.3. Related Work
6. Conclusions
Author Contributions
Funding
Institutional Review Board Statement
Informed Consent Statement
Data Availability Statement
Acknowledgments
Conflicts of Interest
References
- Goldshtein, O.; Messer, H.; Zinevich, A. Rain Rate Estimation Using Measurements From Commercial Telecommunications Links. IEEE Trans. Signal Process. 2009, 57, 1616–1625. [Google Scholar] [CrossRef]
- Lorenz, C.; Kunstmann, H. The Hydrological Cycle in Three State-of-the-Art Reanalyses: Intercomparison and Performance Analysis. J. Hydrometeorol. 2012, 13, 1397–1420. [Google Scholar] [CrossRef]
- Anagnostou, E.; Krajewski, W.; Smith, J. Uncertainty quantifica-tion of mean-areal radar-rainfall estimates. J. Atmos. Ocean. Technol. 1999, 16, 206–215. [Google Scholar] [CrossRef]
- Messer, H.; Zinevich, A.; Alpert, P. Environmental Monitoring by Wireless Communication Networks. Science 2006, 312, 713. [Google Scholar] [CrossRef] [PubMed]
- Overeem, A.; Leijnse, H.; Uijlenhoet, R. Measuring urban rainfall using microwave links from commercial cellular communication networks. Water Resour. Res. 2011, 47. [Google Scholar] [CrossRef]
- Schleiss, M.; Berne, A. Identification of Dry and Rainy Periods Using Telecommunication Microwave Links. IEEE Geosci. Remote Sens. Lett. 2010, 7, 611–615. [Google Scholar] [CrossRef]
- Wang, Z.; Schleiss, M.; Jaffrain, J.; Berne, A.; Rieckermann, J. Using Markov switching models to infer dry and rainy periods from telecommunication microwave link signals. Atmos. Meas. Tech. 2012, 5, 1847–1859. [Google Scholar] [CrossRef]
- Harel, O.; Messer, H. Extension of the MFLRT to Detect an Unknown Deterministic Signal Using Multiple Sensors, Applied for Precipitation Detection. IEEE Signal Process. Lett. 2013, 20, 945–948. [Google Scholar] [CrossRef]
- Song, K.; Liu, X.; Gao, T.; Yin, M.; He, B. The Feasibility Analysis of Cellphone Signal to Detect the Rain: Experimental Study. IEEE Geosci. Remote Sens. Lett. 2020, 17, 1158–1162. [Google Scholar] [CrossRef]
- Berne, A.; Uijlenhoet, R. Path-averaged rainfall estimation using microwave links: Uncertainty due to spatial rainfall variability. Geophys. Res. Lett. 2007, 34. [Google Scholar] [CrossRef]
- Chwala, C.; Gmeiner, A.; Qin, W.; Hipp, S.; Nienaber, D.; Siart, U.; Eibert, T.; Pohl, M.; Seltmann, J.; Fritz, J.; et al. Precipitation observation using microwave backhaul links in the alpine and pre-alpine region of Southern Germany. Hydrol. Earth Syst. Sci. 2012, 16, 2647–2661. [Google Scholar] [CrossRef]
- Doumounia, A.; Gosset, M.; Cazenave, F.; Kacou, M.; Zougmore, F. Rainfall Monitoring based on Microwave links from cellular telecommunication Networks: First Results from a West African Test Bed. Geophys. Res. Lett. 2014, 41, 6016–6022. [Google Scholar] [CrossRef]
- Messer, H. Rainfall Monitoring Using Cellular Networks. IEEE Signal Process. Mag. 2007, 24, 142–144. [Google Scholar] [CrossRef]
- Messer, H.; Zinevich, A.; Alpert, P. Environmental Sensor Networks Using Existing Wireless Communication Systems for Rainfall and Wind Velocity Measurements. IEEE Instrum. Meas. Mag. 2012, 15, 32–38. [Google Scholar] [CrossRef]
- Overeem, A.; Leijnse, H.; Uijlenhoet, R. Country-wide rainfall maps from cellular communication networks. Proc. Natl. Acad. Sci. USA 2013, 110, 2741–2745. [Google Scholar] [CrossRef] [PubMed]
- Gazit, L.; Messer, H. Sufficient Conditions for Reconstructing 2-D Rainfall Maps. IEEE Trans. Geosci. Remote Sens. 2018, 56, 6334–6343. [Google Scholar] [CrossRef]
- Cherkassky, D.; Ostrometzky, J.; Messer, H.; Sensing, R. Precipitation Classification Using Measurements From Commercial Microwave Links. IEEE Trans. Geosci. Remote Sens. 2014, 52, 2350–2356. [Google Scholar] [CrossRef]
- Overeem, A.; Leijnse, H.; Uijlenhoet, R. Two and a half years of country-wide rainfall maps using radio links from commercial cellular telecommunication networks. Water Resour. Res. 2016, 52, 8039–8065. [Google Scholar] [CrossRef]
- National Climate Center. Available online: http://www.ncc-cma.net/cn/ (accessed on 1 August 2020).
- Leijnse, H.; Uijlenhoet, R.; Stricker, J.N.M. Rainfall measurement using radio links from cellular communication networks. Water Resour. Res. 2007, 43, 455–456. [Google Scholar] [CrossRef]
- International Telecommunication Union. Specific Attenuation Model for Rain for Use in Prediction Methods. 2005. Available online: https://www.itu.int/rec/R-REC-P.838/en (accessed on 1 August 2020).
- Fenicia, F.; Pfister, L.; Kavetski, D.; Matgen, P.; Iffly, J.-F.; Hoffmann, L.; Uijlenhoet, R. Microwave links for rainfall estimation in an urban environment: Insights from an experimental setup in Luxembourg-City. J. Hydrol. 2012, 69–78. [Google Scholar] [CrossRef]
- Ostrometzky, J.; Messer, H. Dynamic Determination of the Baseline Level in Microwave Links for Rain Monitoring From Minimum Attenuation Values. IEEE J. Sel. Top. Appl. Earth Obs. Remote Sens. 2018, 11, 24–33. [Google Scholar] [CrossRef]
- Leijnse, H.; Uijlenhoet, R.; Berne, A. Errors and Uncertainties in Microwave Link Rainfall Estimation Explored Using Drop Size Measurements and High-Resolution Radar Data. J. Hydrometeorol. 2010, 11, 1330–1344. [Google Scholar] [CrossRef]
- Habi, H.V.; Messer, H. Uncertainties in Short Commercial Microwave Links Fading Due to Rain. In Proceedings of the ICASSP 2020—2020 IEEE International Conference on Acoustics, Speech and Signal Processing, Barcelona, Spain, 4–8 May 2020; pp. 9006–9010. [Google Scholar]
- Zinevich, A.; Messer, H.; Alpert, P. Prediction of rainfall intensity measurement errors using commercial microwave communication links. Atmos. Meas. Tech. 2010, 3, 1385–1402. [Google Scholar] [CrossRef]
- Leijnse, H.; Uijlenhoet, R.; Holleman, I. Sources of error in microwave link rainfall estimation. In Proceedings of the International Symposium on Weather Radar and Hydrology, Grenoble, France, 10–12 March 2008. [Google Scholar]
- Leijnse, H.; Uijlenhoet, R.; Stricker, J.N.M. Microwave link rainfall estimation: Effects of link length and frequency, temporal sampling, power resolution, and wet antenna attenuation. Adv. Water Resour. 2008, 31, 1481–1493. [Google Scholar] [CrossRef]
- Cherkassky, D.; Ostrometzky, J.; Messer, H. The Use of Linear Feature Projection for Precipitation Classification Using Measurements from Commercial Microwave Links. In Proceedings of the Latent Variable Analysis & Signal Separation-international Conference, Tel Aviv, Israel, 12–15 March 2012. [Google Scholar]
- Schleiss, M.; Rieckermann, J.; Berne, A. Quantification and Modeling of Wet-Antenna Attenuation for Commercial Microwave Links. IEEE Geosci. Remote Sens. Lett. 2013, 10, 1195–1199. [Google Scholar] [CrossRef]
- Kharadly, M.M.Z.; Ross, R. Effect of wet antenna attenuation on propagation data statistics. IEEE Trans. Antennas Propag. 2001, 49, 1183–1191. [Google Scholar] [CrossRef]
- Graf, M.; Chwala, C.; Polz, J.; Kunstmann, H. Rainfall estimation from a German-wide commercial microwave link network: Optimized processing and validation for 1 year of data. Hydrol. Earth Syst. Sci. 2020, 24, 2931–2950. [Google Scholar] [CrossRef]
- Han, C.; Bi, Y.; Duan, S.; Lu, G. Rain Rate Retrieval Test From 25-GHz, 28-GHz, and 38-GHz Millimeter-Wave Link Measurement in Beijing. IEEE J. Sel. Top. Appl. Earth Obs. Remote Sens. 2019, 12, 2846–2858. [Google Scholar] [CrossRef]


| CML | #1 | #2 | #3 | #4 | #5 | #6 | #7 | #8 |
|---|---|---|---|---|---|---|---|---|
| f (GHz) | 15 | 15 | 15 | 15 | 23 | 23 | 23 | 23 |
| l (km) | 0.55 | 0.95 | 1.00 | 1.08 | 0.59 | 0.77 | 0.82 | 0.89 |
| a | 0.04 | 0.04 | 0.04 | 0.04 | 0.13 | 0.13 | 0.13 | 0.13 |
| b | 1.12 | 1.12 | 1.12 | 1.12 | 1.02 | 1.02 | 1.02 | 1.02 |
| CML | #1 | #2 | #3 | #4 | #5 | #6 | #7 | #8 |
|---|---|---|---|---|---|---|---|---|
| MAE (mm/h) | 1.12 | 1.14 | 1.12 | 1.15 | 1.01 | 1.00 | 0.91 | 0.92 |
| AD (mm) | 9.5 | −3.7 | 1.7 | −5.2 | 4.6 | 3.4 | 4.3 | 2.4 |
| RD (%) | 4 | −2 | 1 | −2 | 2 | 1 | 2 | 1 |
Publisher’s Note: MDPI stays neutral with regard to jurisdictional claims in published maps and institutional affiliations. |
© 2021 by the authors. Licensee MDPI, Basel, Switzerland. This article is an open access article distributed under the terms and conditions of the Creative Commons Attribution (CC BY) license (http://creativecommons.org/licenses/by/4.0/).
Share and Cite
Song, K.; Liu, X.; Gao, T. Real-Time Rainfall Estimation Using Microwave Links: A Case Study in East China during the Plum Rain Season in 2020. Sensors 2021, 21, 858. https://doi.org/10.3390/s21030858
Song K, Liu X, Gao T. Real-Time Rainfall Estimation Using Microwave Links: A Case Study in East China during the Plum Rain Season in 2020. Sensors. 2021; 21(3):858. https://doi.org/10.3390/s21030858
Chicago/Turabian StyleSong, Kun, Xichuan Liu, and Taichang Gao. 2021. "Real-Time Rainfall Estimation Using Microwave Links: A Case Study in East China during the Plum Rain Season in 2020" Sensors 21, no. 3: 858. https://doi.org/10.3390/s21030858
APA StyleSong, K., Liu, X., & Gao, T. (2021). Real-Time Rainfall Estimation Using Microwave Links: A Case Study in East China during the Plum Rain Season in 2020. Sensors, 21(3), 858. https://doi.org/10.3390/s21030858