Article

Muscle Co-Activation around the Knee during Different Walking Speeds in Healthy Females

1
Faculty of Physical Education-Abo Qir, Alexandria University, Alexandria 21913, Egypt
2
Porto Biomechanics Laboratory (LABIOMEP-UP), Faculty of Sport (CIFI2D), University of Porto, 4099-002 Porto, Portugal
3
Department of Sports Training, Faculty of Sports Education, Mansoura University, Mansoura 35516, Egypt
*
Author to whom correspondence should be addressed.
Sensors 2021, 21(3), 677; https://doi.org/10.3390/s21030677
Submission received: 26 November 2020 / Revised: 11 January 2021 / Accepted: 16 January 2021 / Published: 20 January 2021
(This article belongs to the Special Issue Wearable Sensors for Biomechanics Applications)

Abstract

:
The purpose of this study was to examine the changes in co-activation around the knee joint during different walking speeds in healthy females using the co-activation index. Ten healthy females (age: 21.20 ± 7.21 years, height: 164.00 ± 4.00 cm, mass: 60.60 ± 4.99 kg) participated in this study and performed three walking speeds (slow, normal, and fast). A Qualisys 11-camera motion analysis system sampling at a frequency of 200 Hz was synchronized with a Trigno EMG Wireless system operating at a 2000 Hz sampling frequency. A significant decrease in the co-activation index of thigh muscles was observed between the slow and fast, and between the normal and fast, walking speeds during all walking phases. A non-significant difference was observed between the slow and normal walking speeds during most walking phases, except the second double support phase, during which the difference was significant. A negative relationship was found between walking speed and the co-activation index of thigh muscles in all speeds during walking phases: first double support (r = −0.3386, p < 0.001), single support (r = −0.2144, p < 0.01), second double support (r = −0.4949, p < 0.001), and Swing (r = −0.1639, p < 0.05). In conclusion, the results indicated high variability of thigh muscle co-activation in healthy females during the different walking speeds, and a decrease in the co-activation of the thigh muscles with the increase of speed.

1. Introduction

Walking is a critical movement for human life, since it allows the human to move between places and perform tasks required for their life. The loss or decrease of walking or running ability represents a severe obstruction to a healthy lifestyle. Moreover, walking speed affects elements of walking kinematics, ground reaction forces, and muscle activity. The muscle activity is an important mechanism that is required for walking stability, especially at different walking speeds [1]. Hof et al. (2002) examined electromyographic (EMG) patterns at a variety of speeds and found considerable changes with speed [2]. den Otter et al. (2004) observed systematic changes in EMG activity between different walking speeds (normal to very slow). Tirosh et al. (2013) examined the variability of muscle activation in children between 7 and 16 years at different speeds and found that muscle activation patterns in children under 10 years are more variable than older children only when walking either slower or faster than the preferred speed [3].
The muscle activity amplitude increases with walking speed, but this increase may change between agonist and antagonist muscles [4]. Previous studies investigated how muscles provide support and forward progression of the body during walking [5,6,7]. Neptune et al. (2008) analyzed two-dimensional computer simulations of walking at five speeds, but they investigated only the agonist muscles [8]. Only a few studies used the activity of antagonist muscles when assessing human walking [9,10,11,12]. Lee, Kang, and Shin (2015) suggested that the responses of antagonist muscles, which have not received much attention before, could be more sensitive than agonist muscles in identifying minor changes in stability during walking [13].
Larsen et al. (2008) indicated the importance of the knee and ankle joints for requiring adequate strength and power and reported a decreased amount of antagonist co-activation in young females [14]. Especially during complex tasks such as walking, it is necessary to allow for changes in the agonist and antagonist roles around the knee and ankle during the gait cycle [15]. Kitatani et al. (2016) investigated muscle co-activation around the ankle joint, as did several previous studies [16,17,18,19], but they did not include any EMG information for the knee [20], so our study focused on the knee joint.
In addition, the study of changes of muscle co-activation between agonist and antagonist muscle during walking is very important for the clarification of muscular function of the thigh muscles at different walking speeds. The increasing of coordination during walking may result in muscular changes such as increased muscle co-activation [21]. For example, the rectus femoris (RF), as one of the most important of the quadriceps muscles for the knee extension as an agonist muscle, and the biceps femoris (BF), as one of the hamstring muscles as an antagonist muscle, are working together to provide the stability of the knee joint during walking [22,23,24]. In addition, previous studies in walking at different speeds have used a treadmill [11,25,26] or a metronome to impose the walking speeds or were based on the participants’ self-selected speeds [27,28,29,30]. In this study, we chose the second solution since it is close to the participants’ lifestyles.
Therefore, the purpose of this study was to examine the changes in muscle co-activation around the knee joint during different self-selected walking speeds in healthy females using the co-activation index. We hypothesized that (1) muscle co-activation around the knee would alter during different self-selected walking speeds, and (2) muscle co-activation would decrease when walking speeds increased.

2. Materials and Methods

2.1. Subjects

Ten healthy adult females (age: 21.20 ± 7.21 years, height: 164.00 ± 4.00 cm, mass: 60.60 ± 4.99 kg) volunteered to take part in the study. Subjects had no history of neural or musculoskeletal injuries of the lower limbs and were free of pain and injury. All participants were informed of the experimental procedures and objectives and gave written consent in agreement with the Declaration of Helsinki (2013). The study was approved by the Ethical Committee for Human Research of the hosting institution.

2.2. Experiment Protocol

A Qualisys 11-camera motion analysis system (Qualisys AB, Gothenburg, Sweden) operating at a frequency of 200 Hz was used to capture three-dimensional kinematics data of walking at different speeds (Figure 1) and segmentation of the gait cycle. Participants were required to wear short and tight shorts in order to facilitate the markers’ placement and reduce motion artifacts due to the shorts’ fabric.
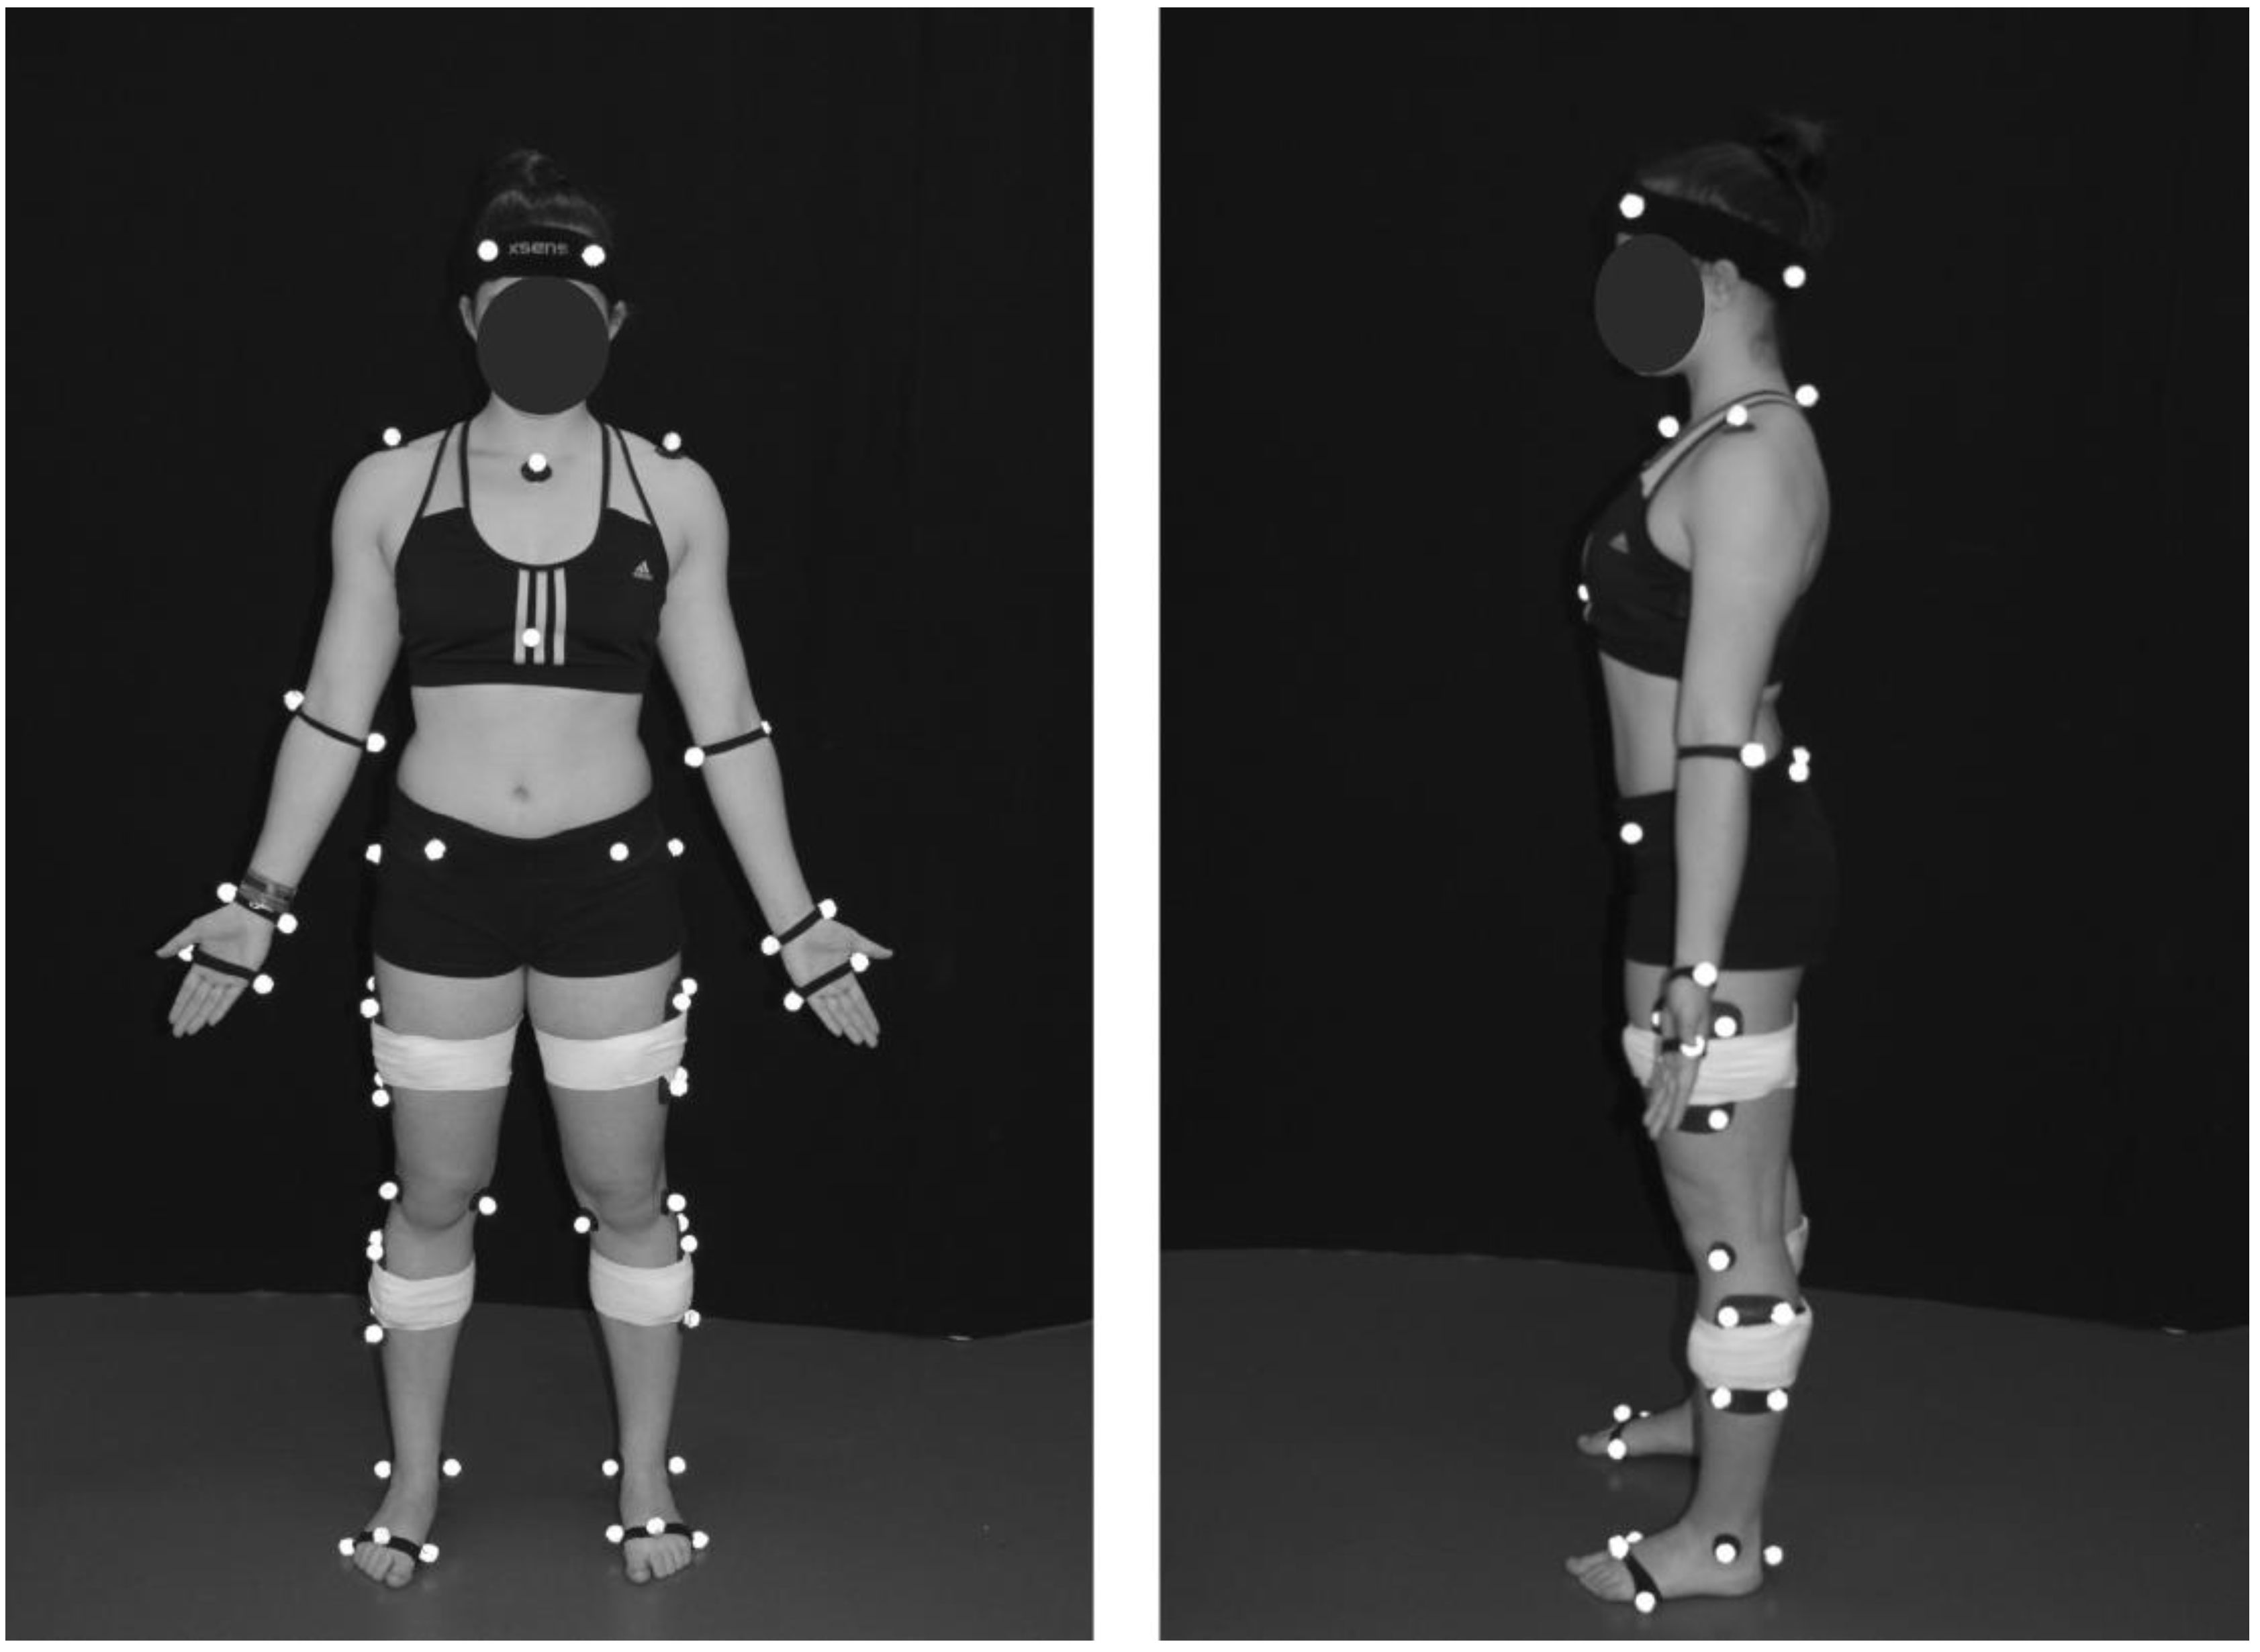
A modified conventional gait model was used to define body segments with 6 degrees of freedom. Forty-three reflective markers were attached to the body with double-sided adhesive over the following anatomical landmarks: left/right anterior lateral head (located approximately over temple), left/right posterior lateral head (located on the back of the head, roughly in a horizontal plane of the front head markers), left/right acromion, deepest point of incisura jugularis, xiphoid process (sternum), spinous process of the seventh cervical vertebrae, left/right lateral and medial epicondyles of the humerus, left/right radius and ulna styloid processes, left/right dorsum of the 2nd and the 5th metacarpal head, left/right anterior and posterior superior iliac spines, left/right most lateral prominence of the greater trochanter, left/right lateral and medial femur epicondyles, left/right lateral and medial prominence of the malleolus, left/right aspect of the Achilles tendon insertion on the calcaneus, and left/right dorsal margin of the 1st, 2nd, and 5th metatarsal heads. In addition, reflective marker clusters comprising four markers on a rigid base were attached over the lateral mid-thigh and lateral mid-calf of each leg with the help of Superwarp (Fabrifoam, Exton, PA, USA) elastic bandages (Figure 2).
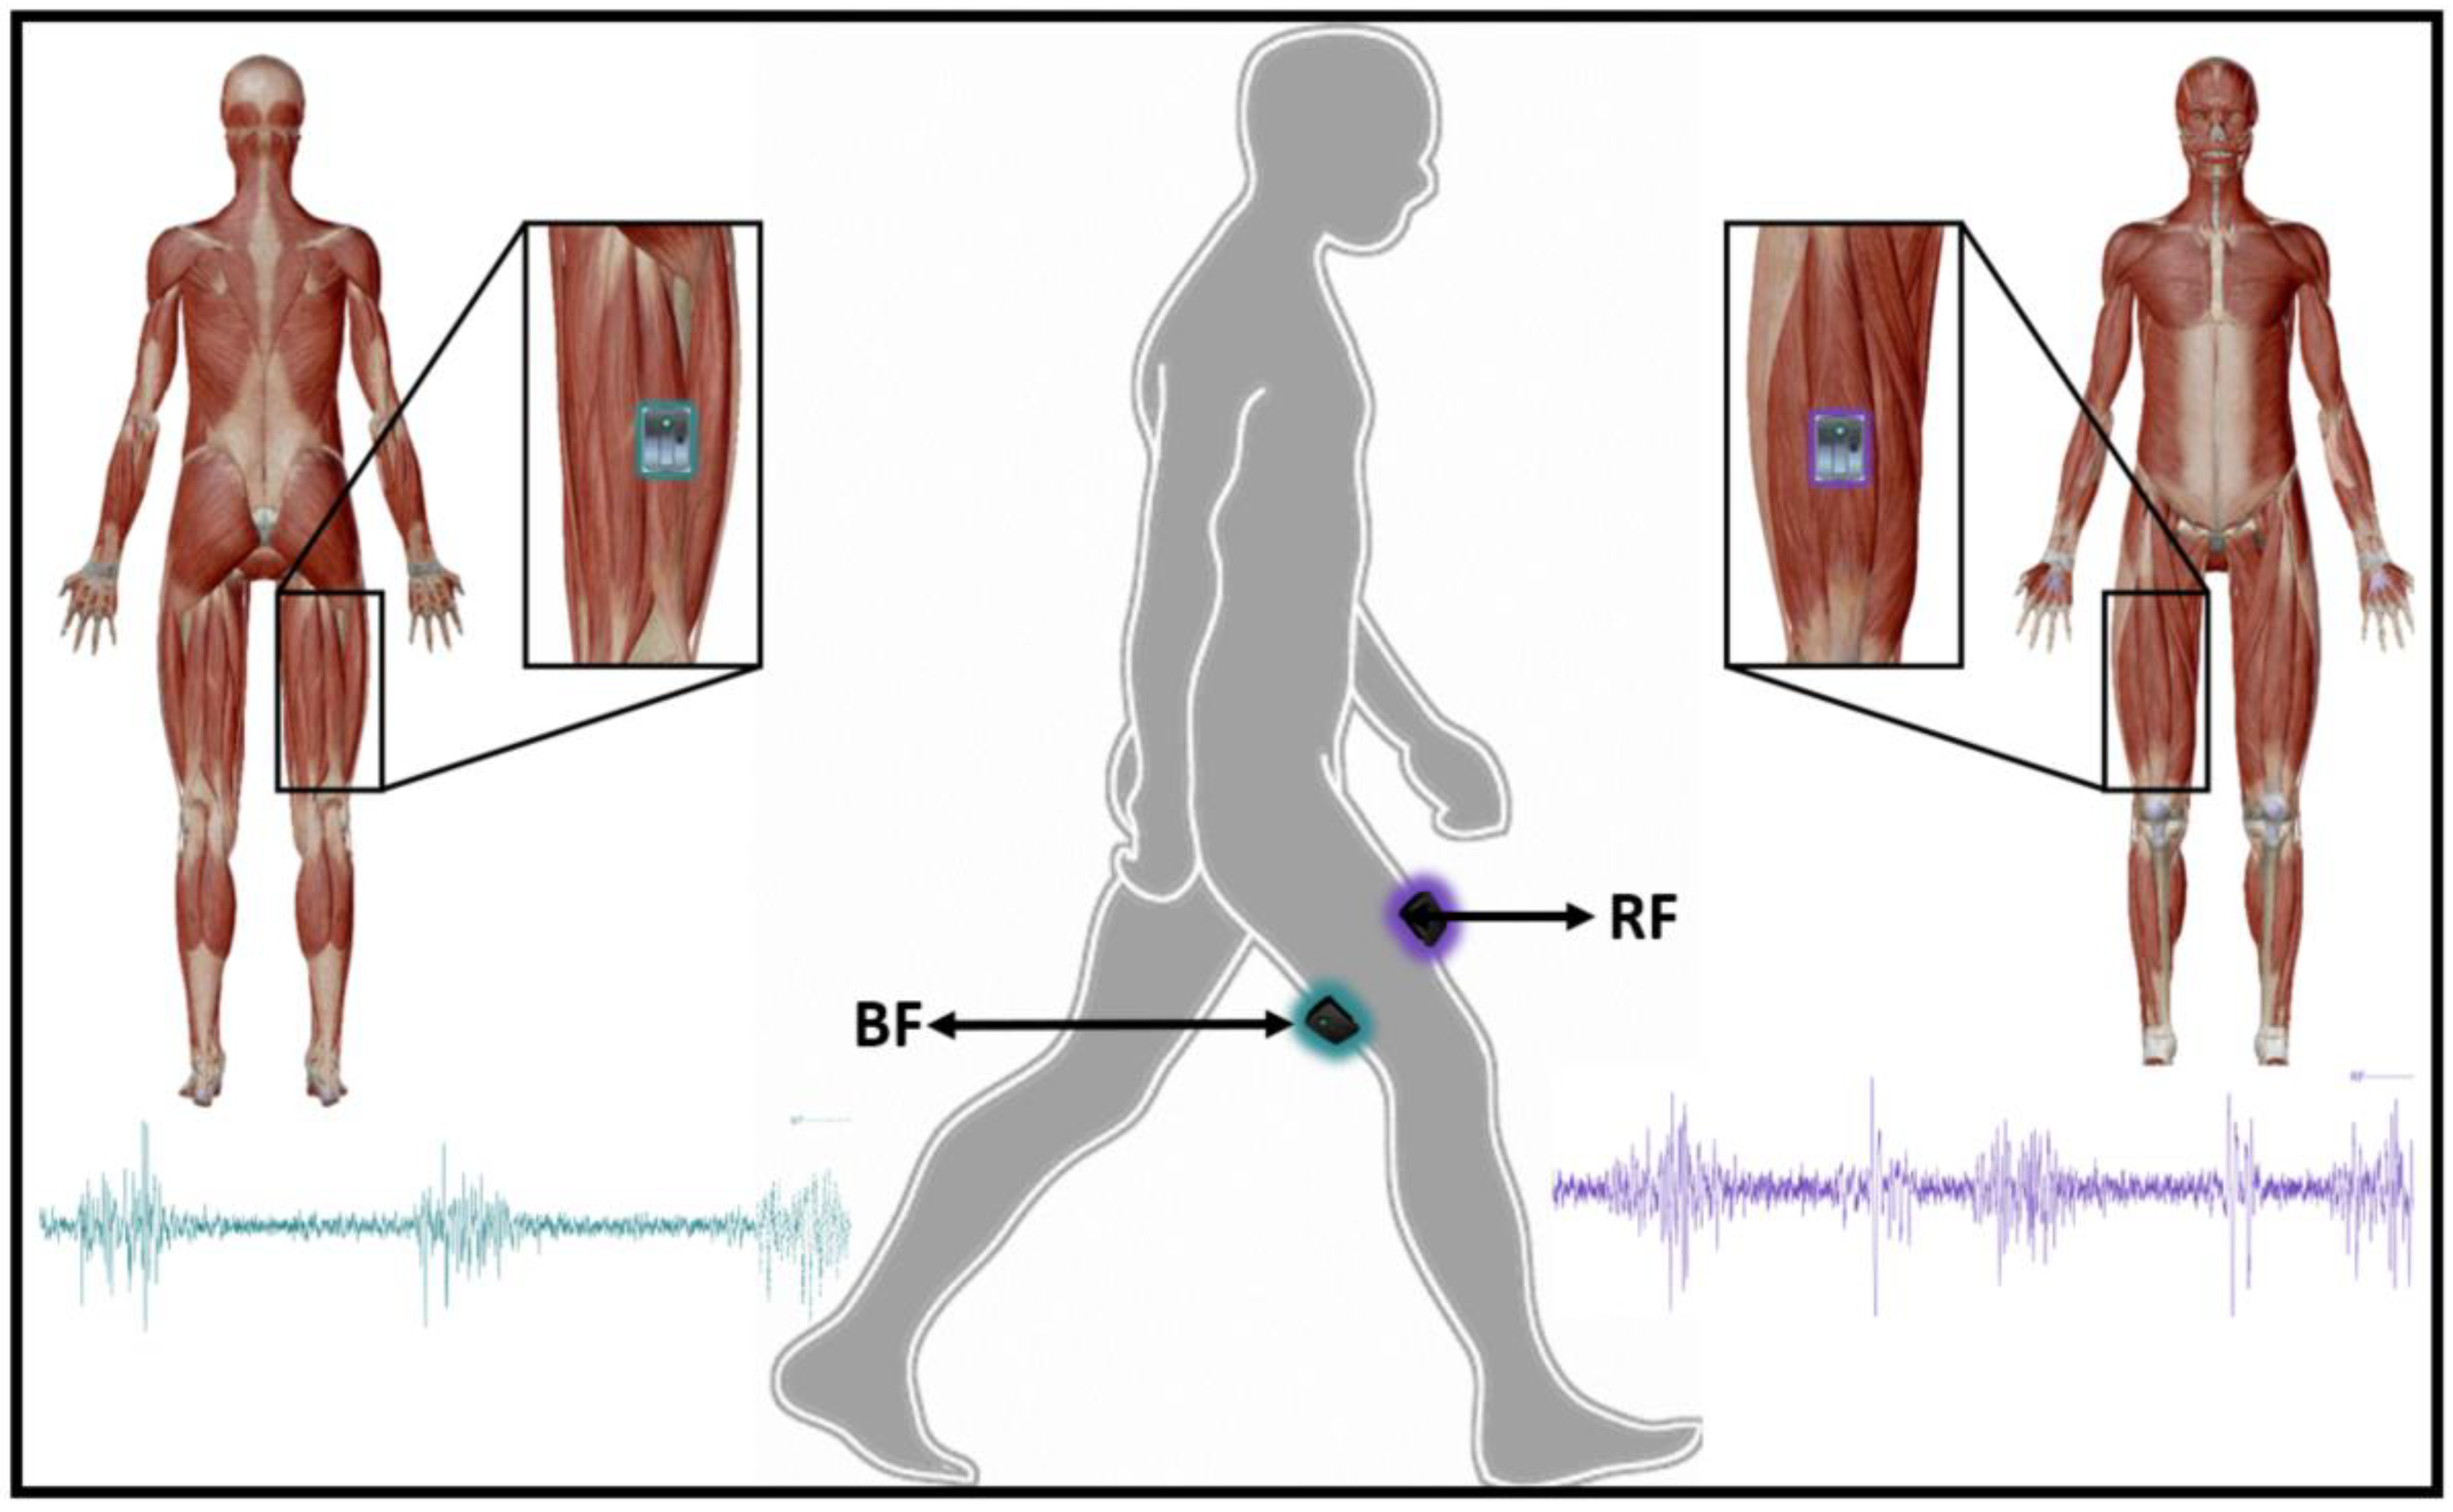
Surface electromyography (EMG) data from the rectus femoris (RF) and biceps femoris (BF) muscles was recorded during gait by using a Trigno Wireless system (Delsys, Boston, MA, USA) sampling at a rate of 2000 Hz. Each muscle activity was recorded by a wireless sensor containing four silver bar electrodes (size: 5 mm × 1 mm), arranged in two pairs with an inter electrode pair distance of 10 mm [23]. Electrode placement was based on the Surface Electromyography for the Non-Invasive Assessment of Muscles (SENIAM) project recommendations [24] (see Figure 3).
Subjects were asked to perform several straight walking trials over a 12-m walkway at three different familiar speeds: slow, normal, and fast, walking characteristics described in results. The normal walking speed was defined by asking the subject to walk normally according to the subject’s self-regulated speed. For the slow walking speed, participants were instructed to decrease the speed of normal walking about 15–20% and keep the slow speed during the entire walkway. For the fast walking speed, participants were instructed to increase their speed about 15–20% from normal and keep the fast speed during the entire walkway. A distance of at least three strides before and after reaching the force plates was assured, and a single selected stride over the force plates was analyzed for each trial. A total of 220 trials were analyzed for all speeds; 73 trials for slow, 73 for normal, and 74 for fast walking were fit for further data processing. Each participant performed five to eight valid walking trials according to the above-mentioned instructions. The slow and faster trials that were out of range (15–20%) of normal walking speed were ignored during data processing.

2.3. Data Processing

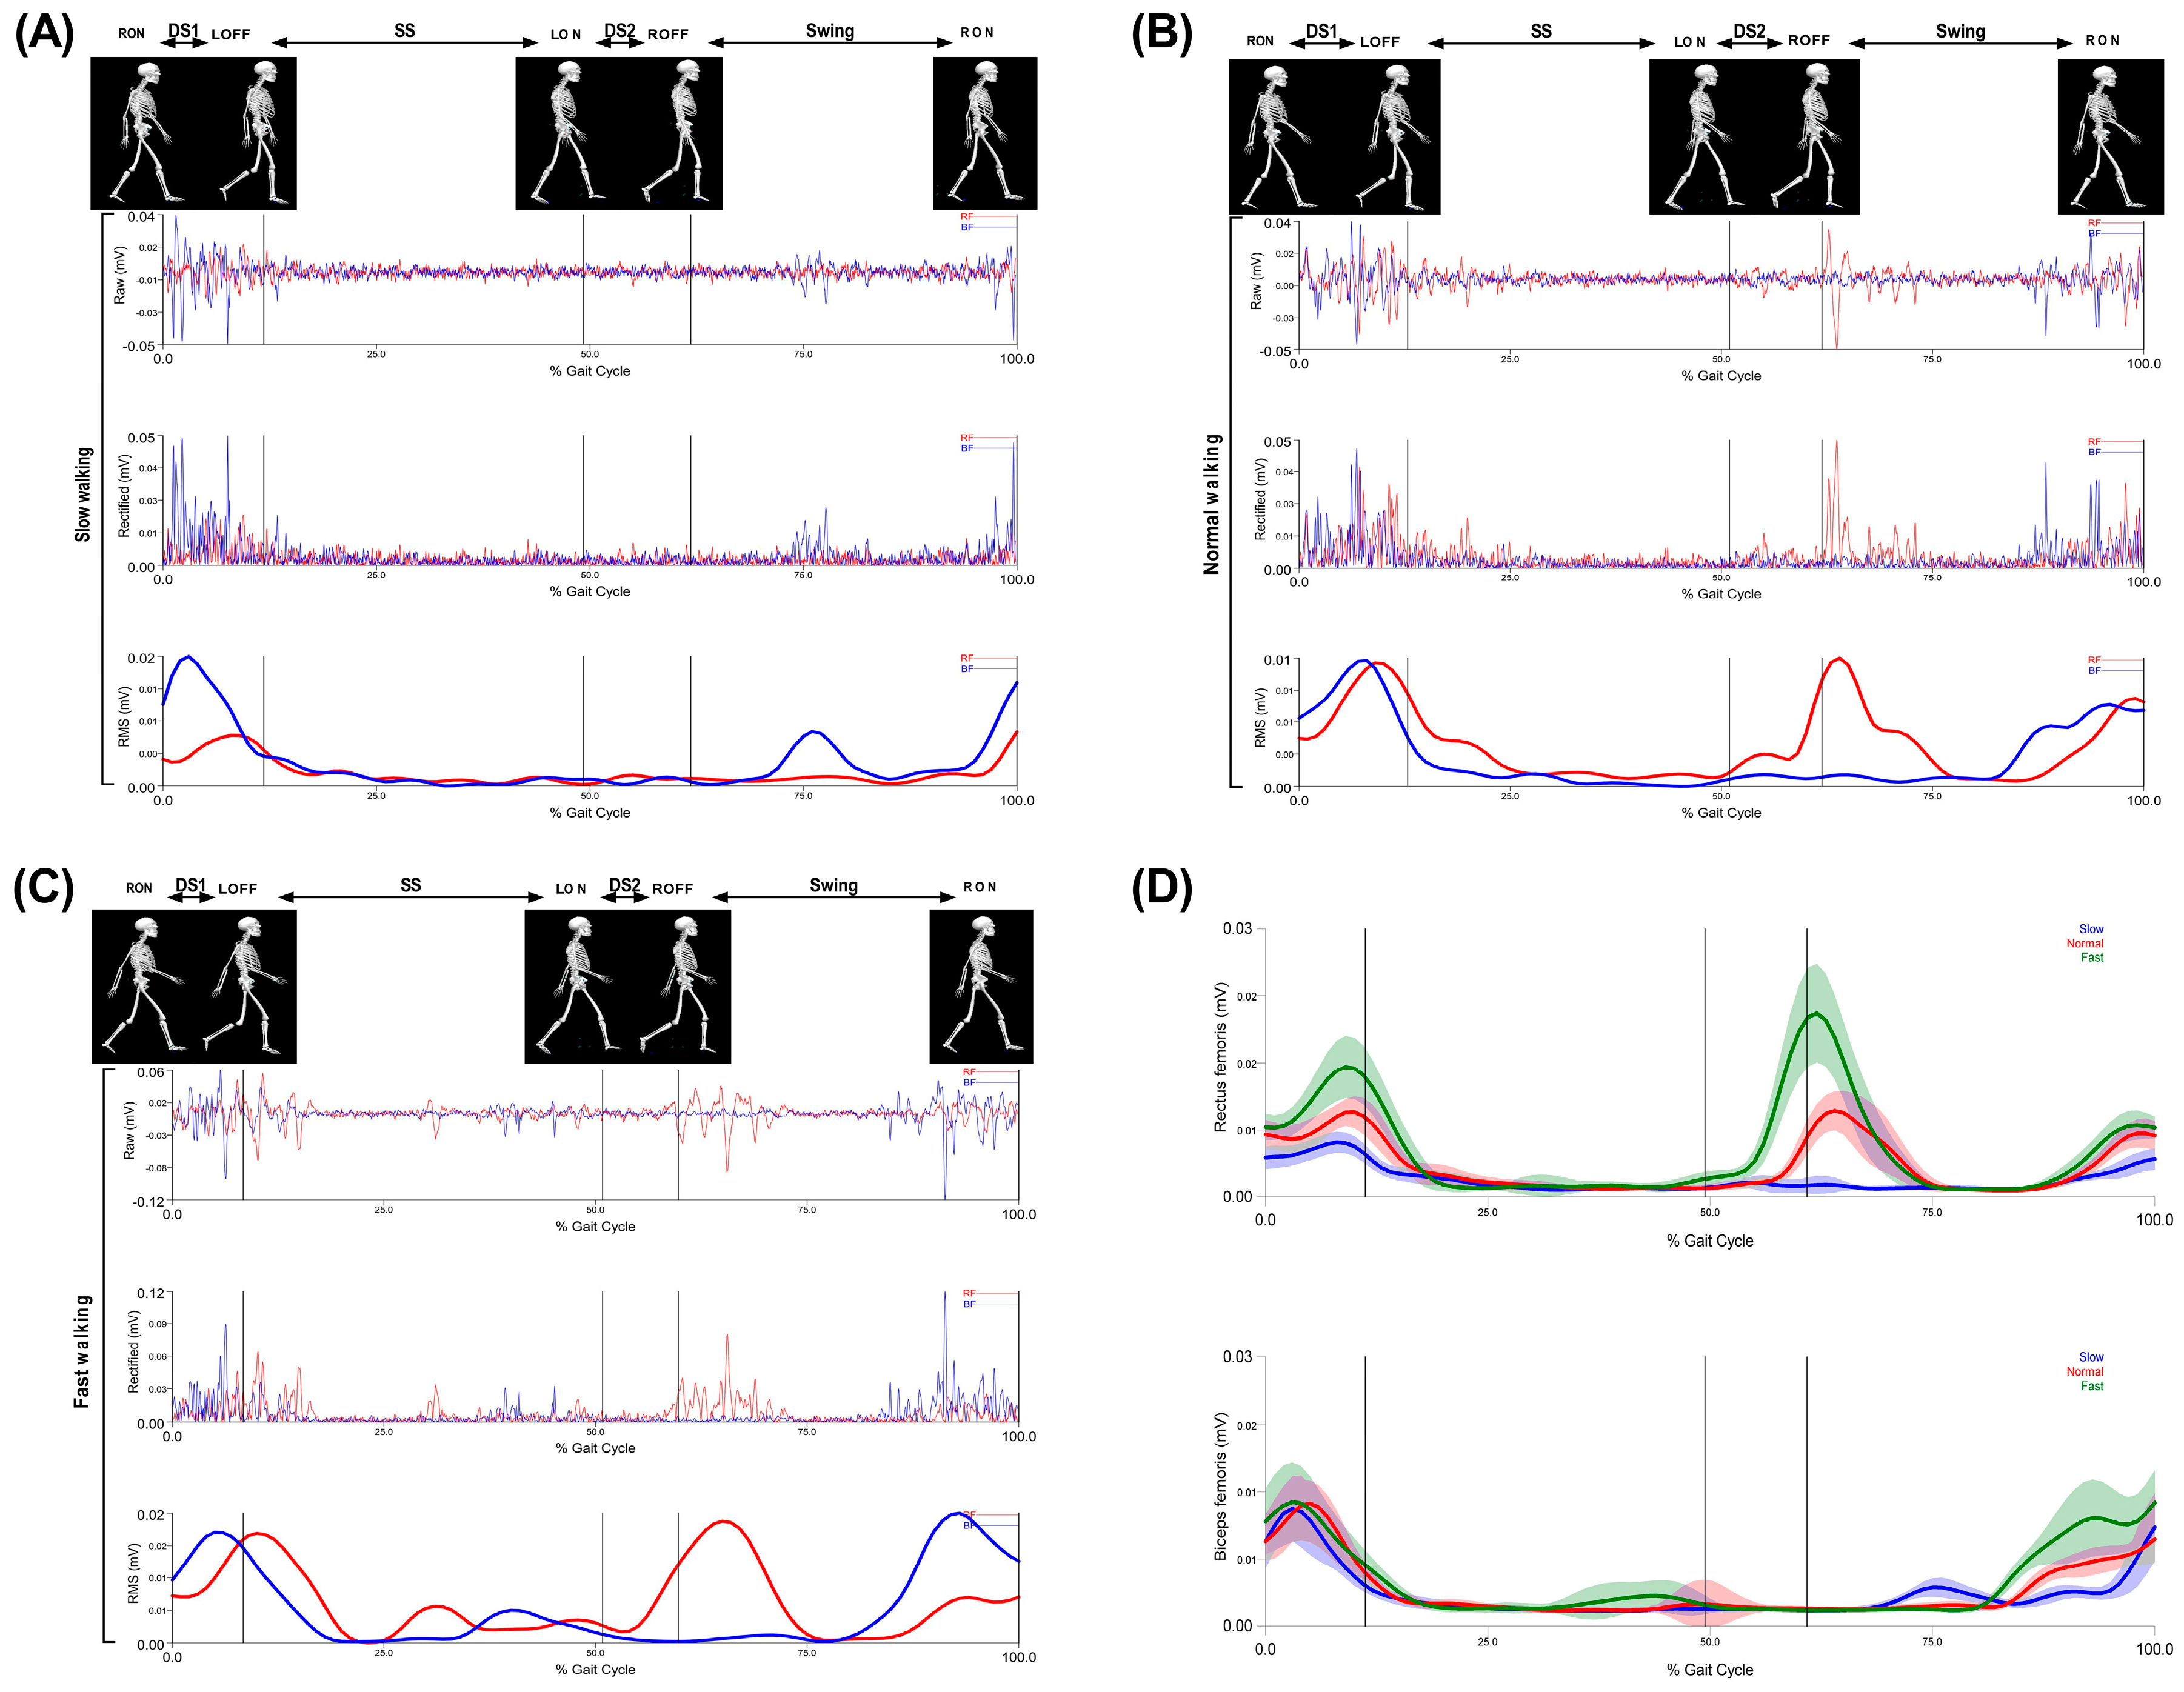
The collected data were digitized using Qualisys Track Manager Software (Qualisys, Inc., Gothenburg, Sweden) and further processed with the EMG data in Visual 3D software (C-Motion, Germantown, MD, USA). Raw EMG data were filtered using a low band-pass Butterworth filter with a cut-off frequency of 500 Hz and a high-pass Butterworth filter with a cut-off at 20 Hz. The signals were preprocessed using full-wave rectification, then lowpass filtered at 10 Hz, and a linear envelope was obtained using the root mean square (RMS) approach with a window size of 100 ms [31,32], which included normalization of the amplitudes of the EMG signals (Figure 4) [33,34,35].

2.4. Muscle Co-Activation

The co-activation index (CoI) was the method used for estimating the muscle co-activation of the thigh muscles (RF/BF) during the different walking speeds in this study. The CoI was calculated separately for the walking phases: the first double support (DS1), the single support (SS), the second double support (DS2), and the swing phase (Swing), respectively [36,37,38].
The CoI was calculated by using the following equation (Equation (1)), which is based on the function of the two muscles during movement, considering that the BF is generally the antagonist muscle and the RF is the agonist muscle for the knee movement [34,39].
C o I = t 1 t 2 E M G B F ( t )   d t t 1 t 2 [ E M G R F + E M G B F ] ( t )   d t   ×   100
where t1 and t2 are the beginning and end of the support phase, EMGBF the activity of the biceps femoris muscle, and EMGRF the activity of the rectus femoris muscle for the DS1, SS, DS2, and Swing phases, separately.
According to this method, the CoI provides a relative measure of BF as a co-activation contribution to the total activation of the RF and BF during the task [34,39].

2.5. Statistical Analysis

The normality of the data was analyzed using Shapiro–Wilk tests and all data were found to be suitable for parametric analysis. Descriptive statistics were reported as means and standard deviations. Analysis of variance (ANOVA) with the Tukey honest significant difference (HSD) post hoc test was used to compare averaged means of muscle co-activation around the knee (CoI RF-BF) between the three walking speeds, during walking sub-phases DS1, SS, DS2, and Swing. In addition, Pearson correlations were used to determine the relationship between walking speeds and CoI RF-BF. All statistical analyses were performed using IBM SPSS software Statistics v21 (IBM® Corporation, Armonk, NY, USA).

3. Results

3.1. Walking Characteristics

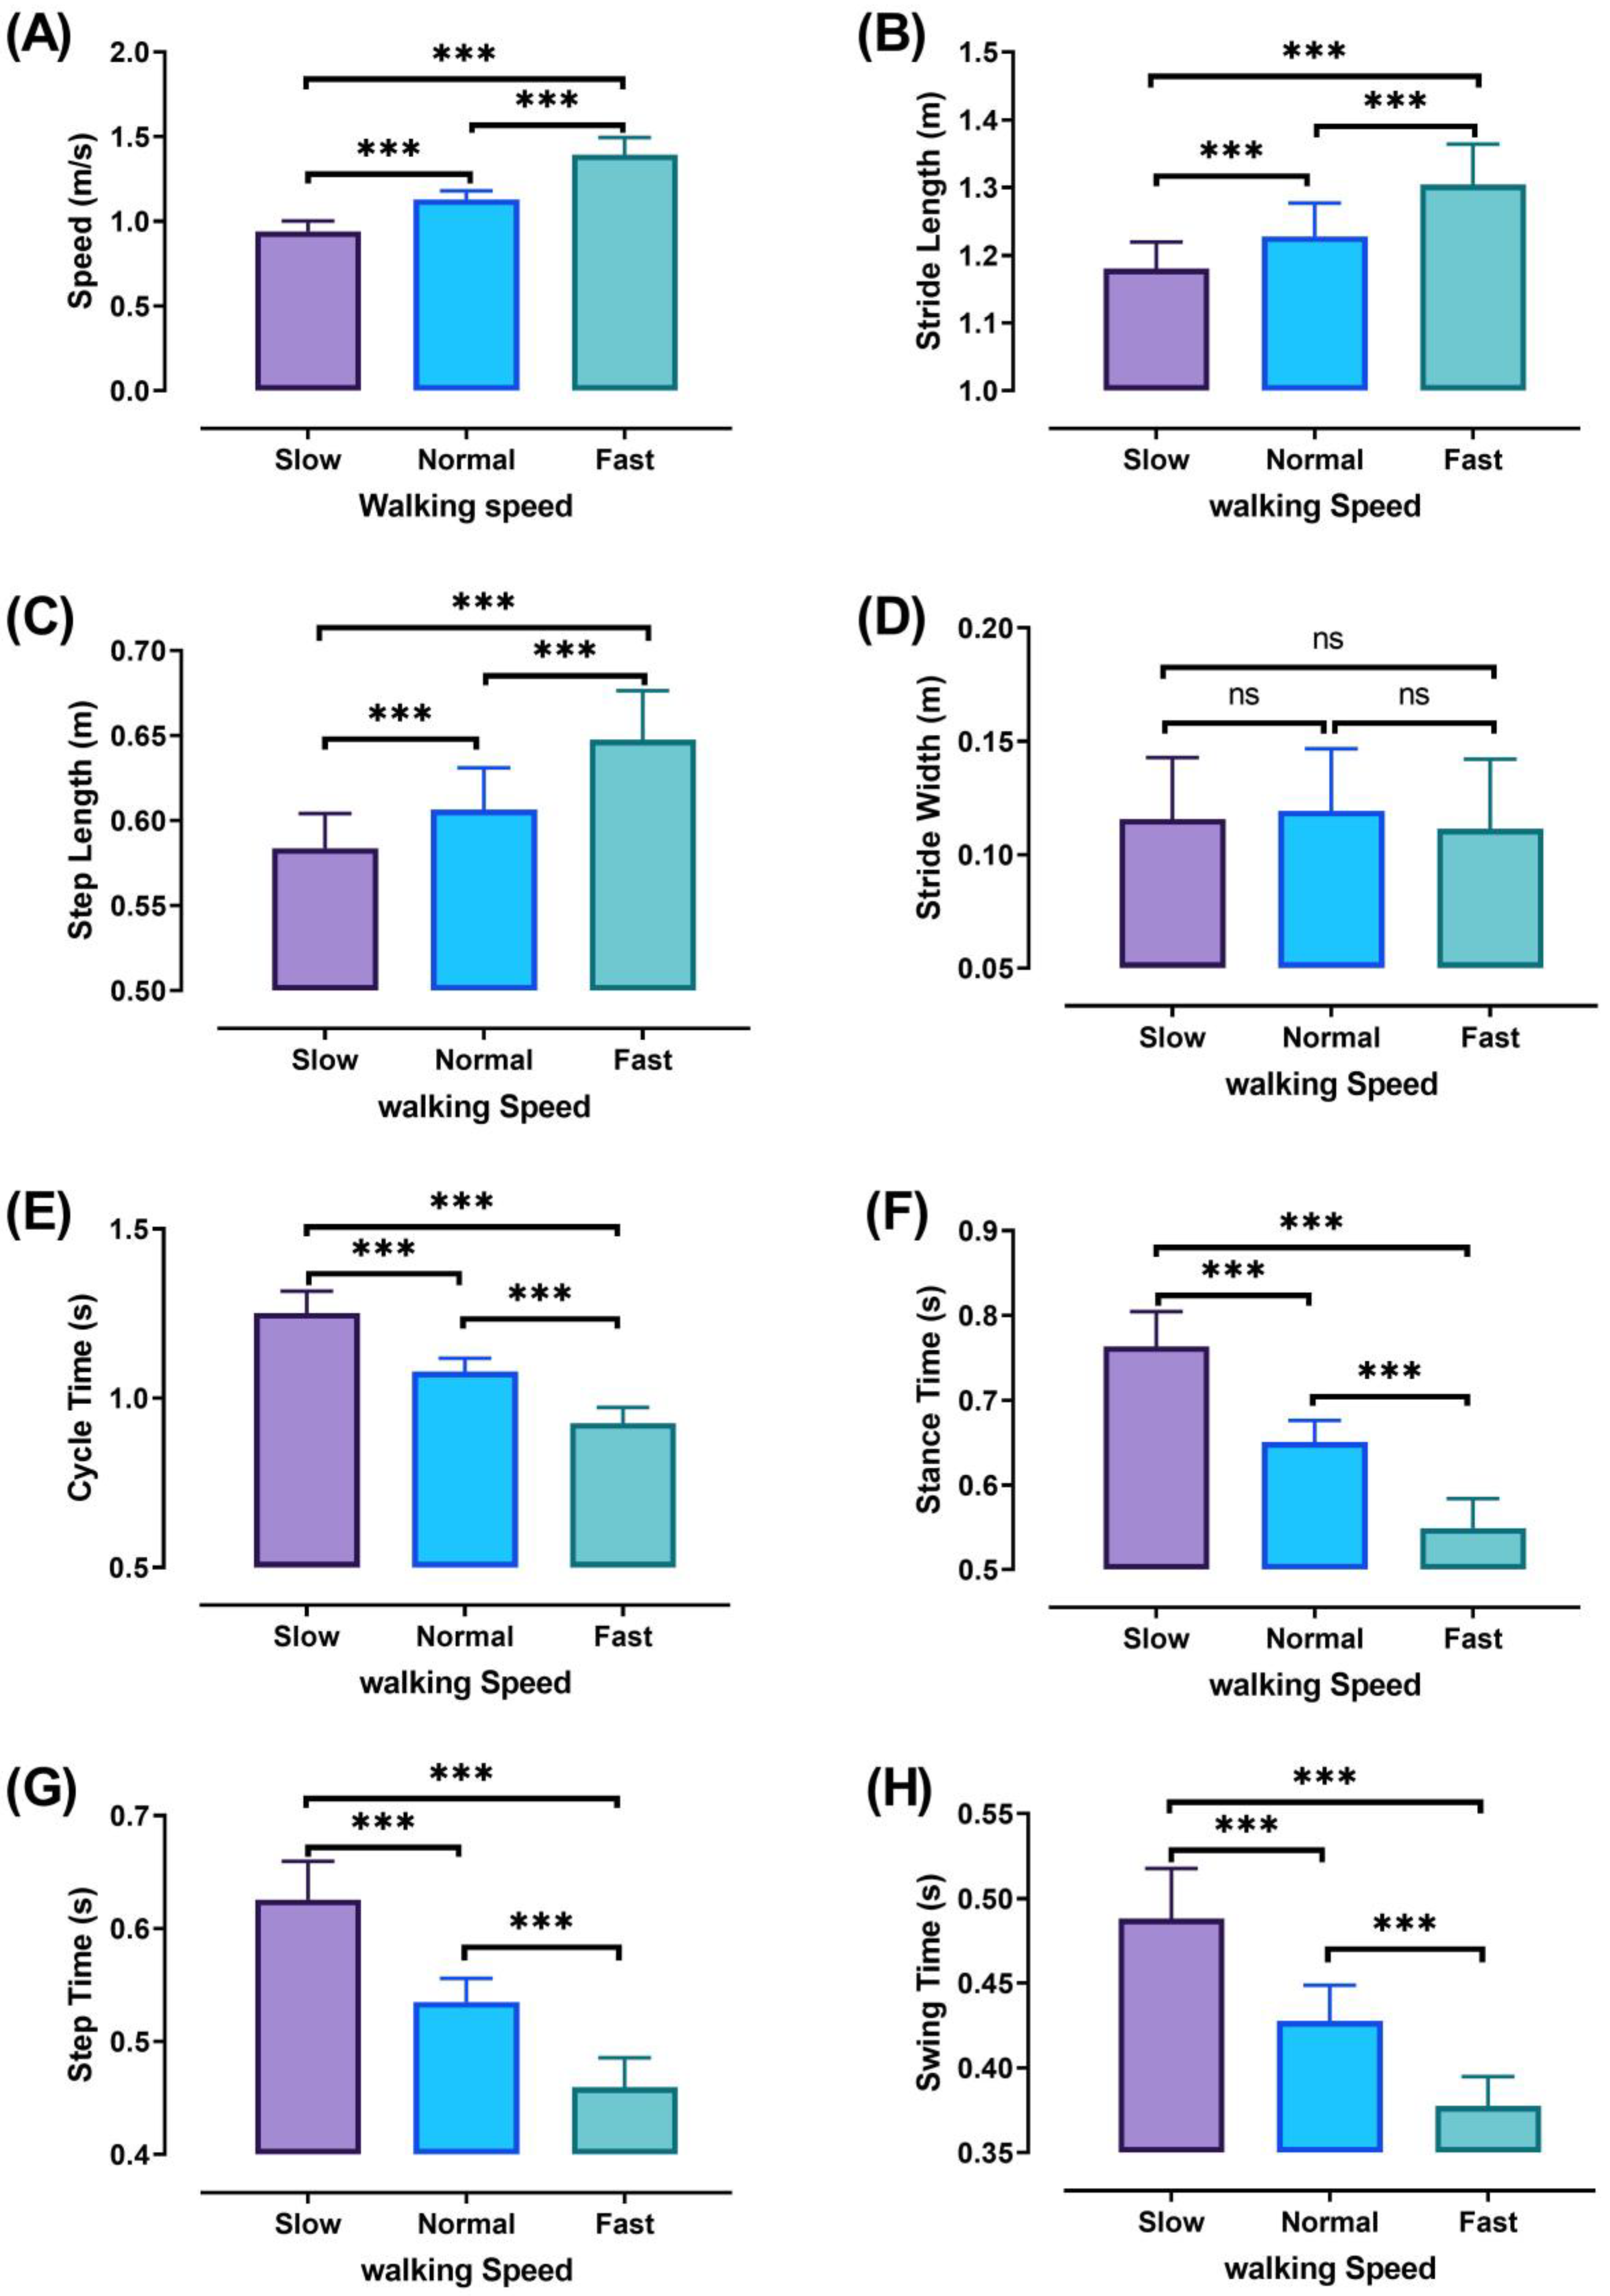
The three walking speeds (slow, normal, and fast) were performed at significantly different percentages (p ˂ 0.001). Walking characteristics are shown in Figure 5 with significant values, except for stride width, which did not show significant differences between the different walking speeds. The different percentages of significant walking characteristics are shown in Table 1.

3.2. Thigh Muscles CoI at Different Walking Speeds

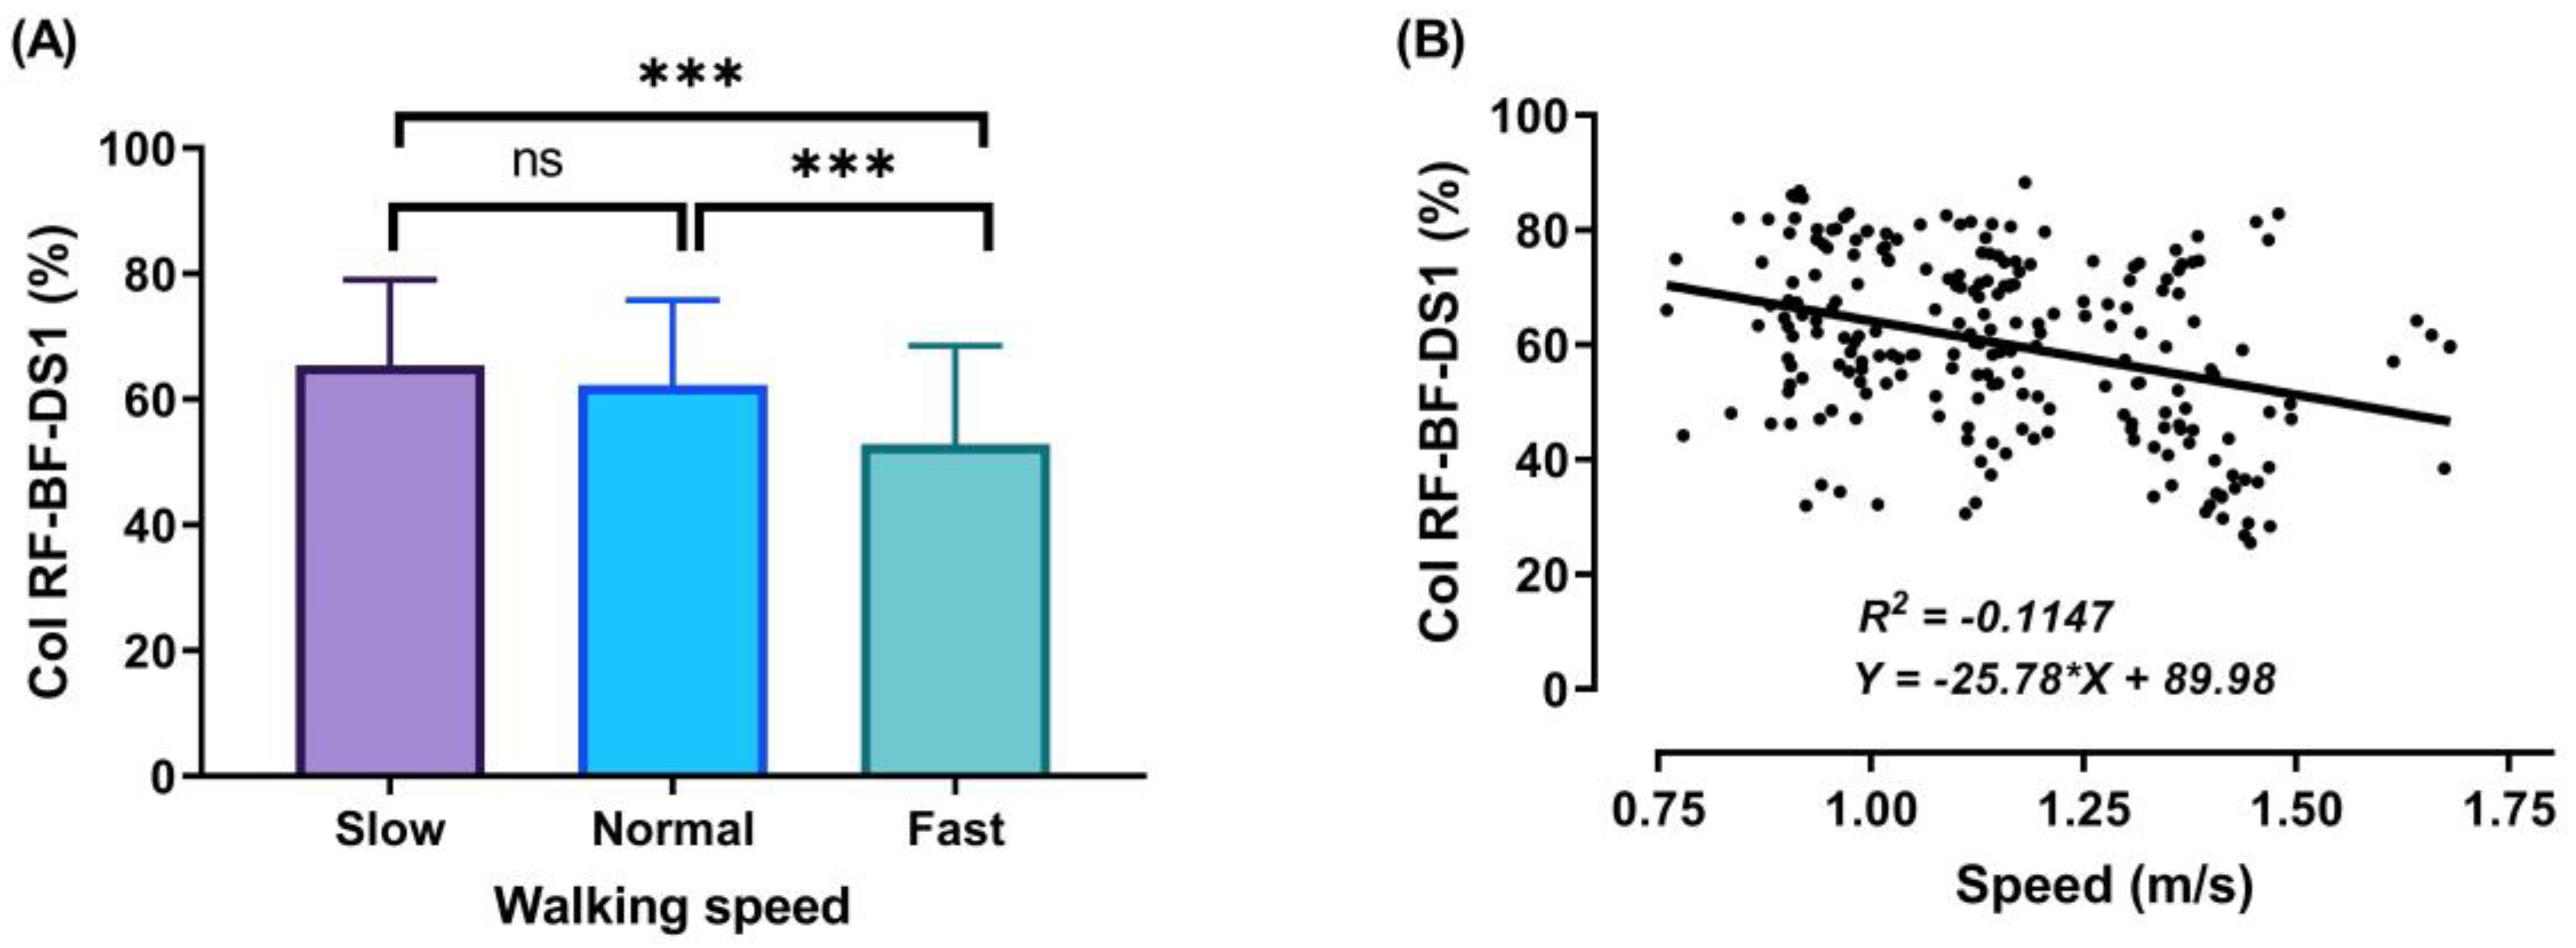
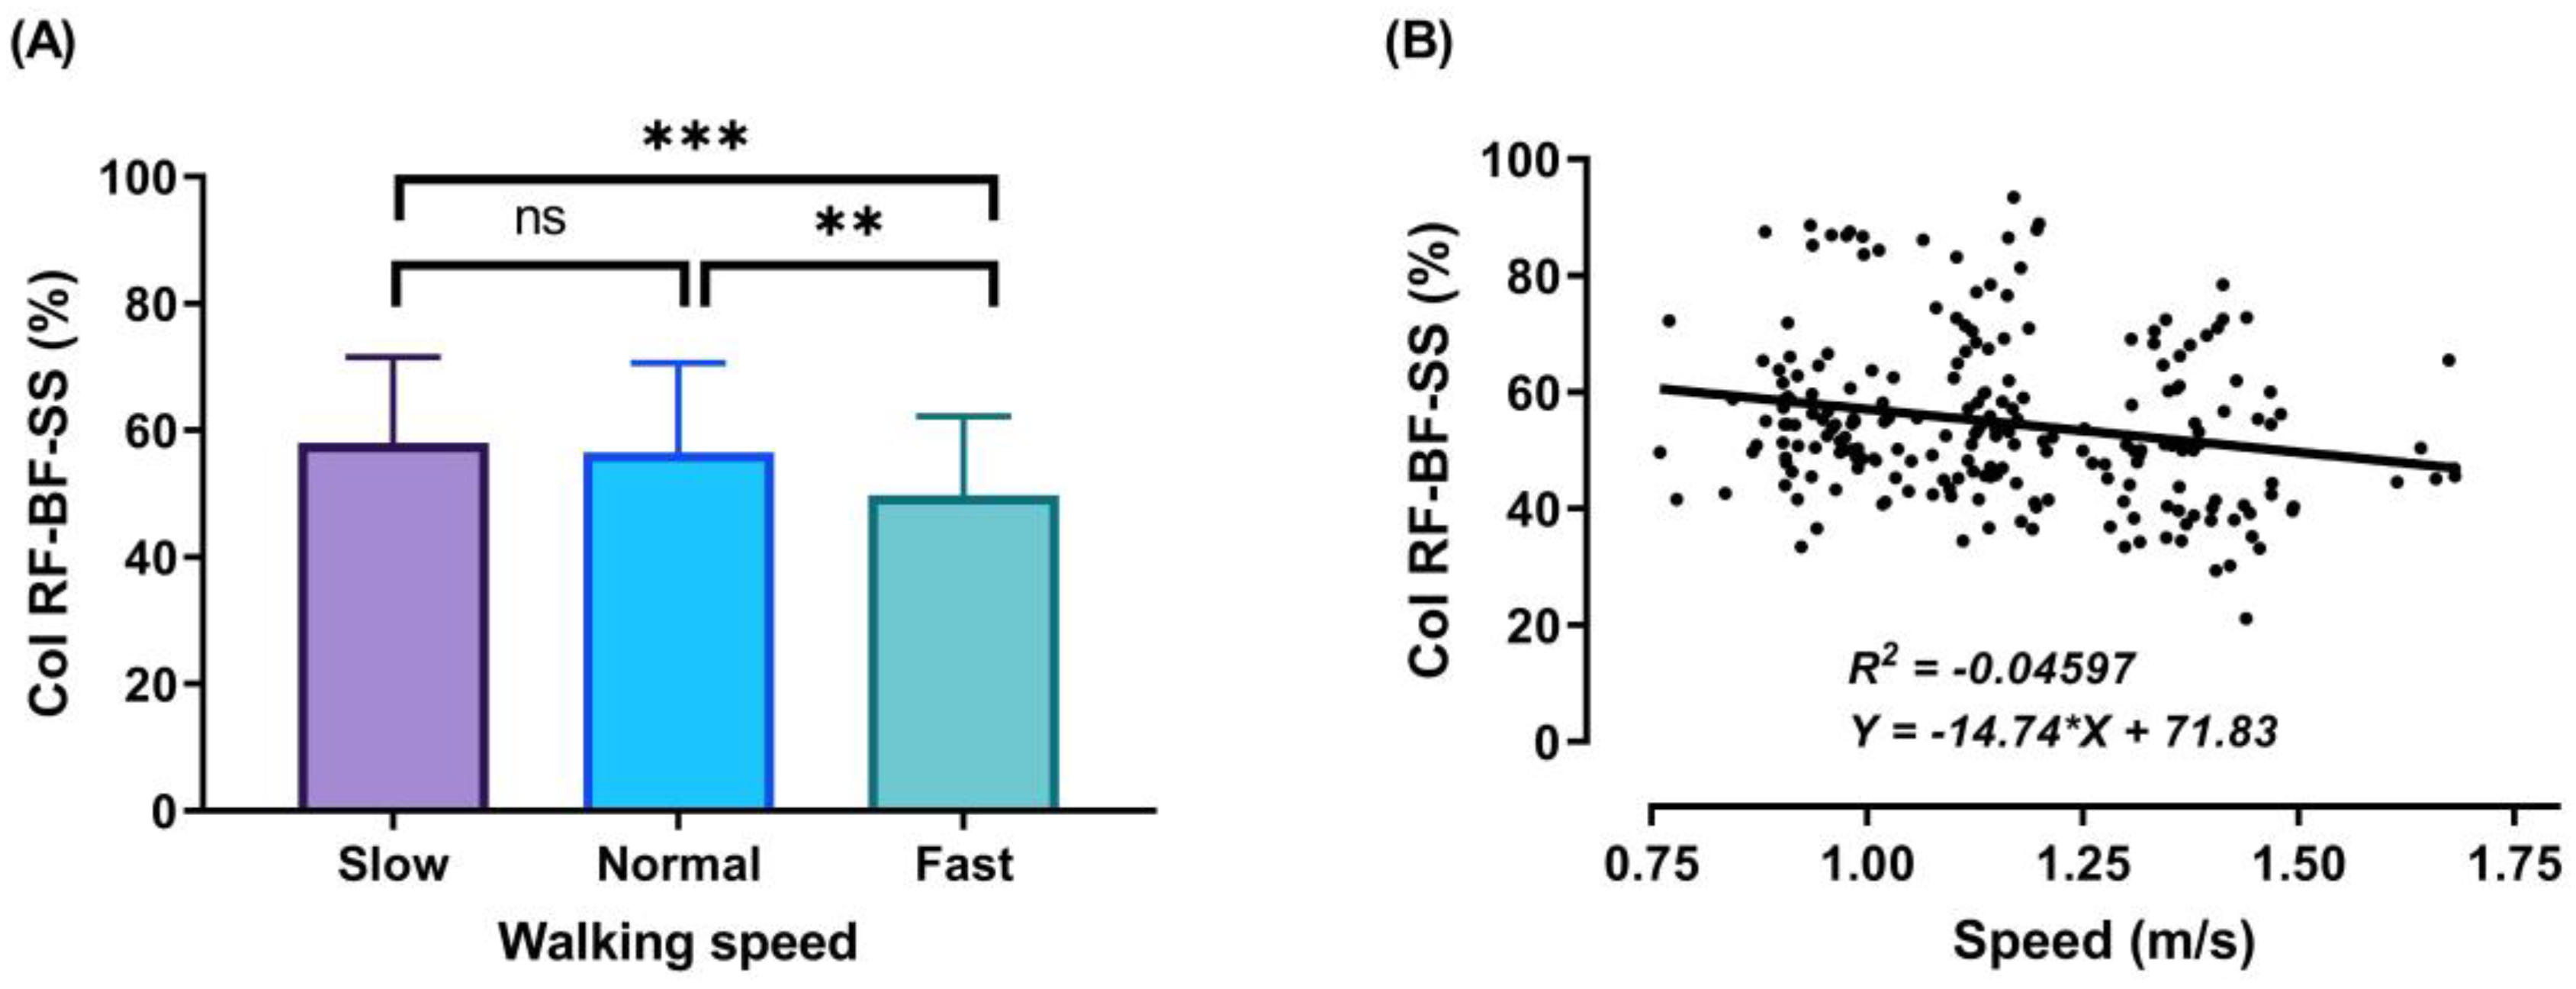
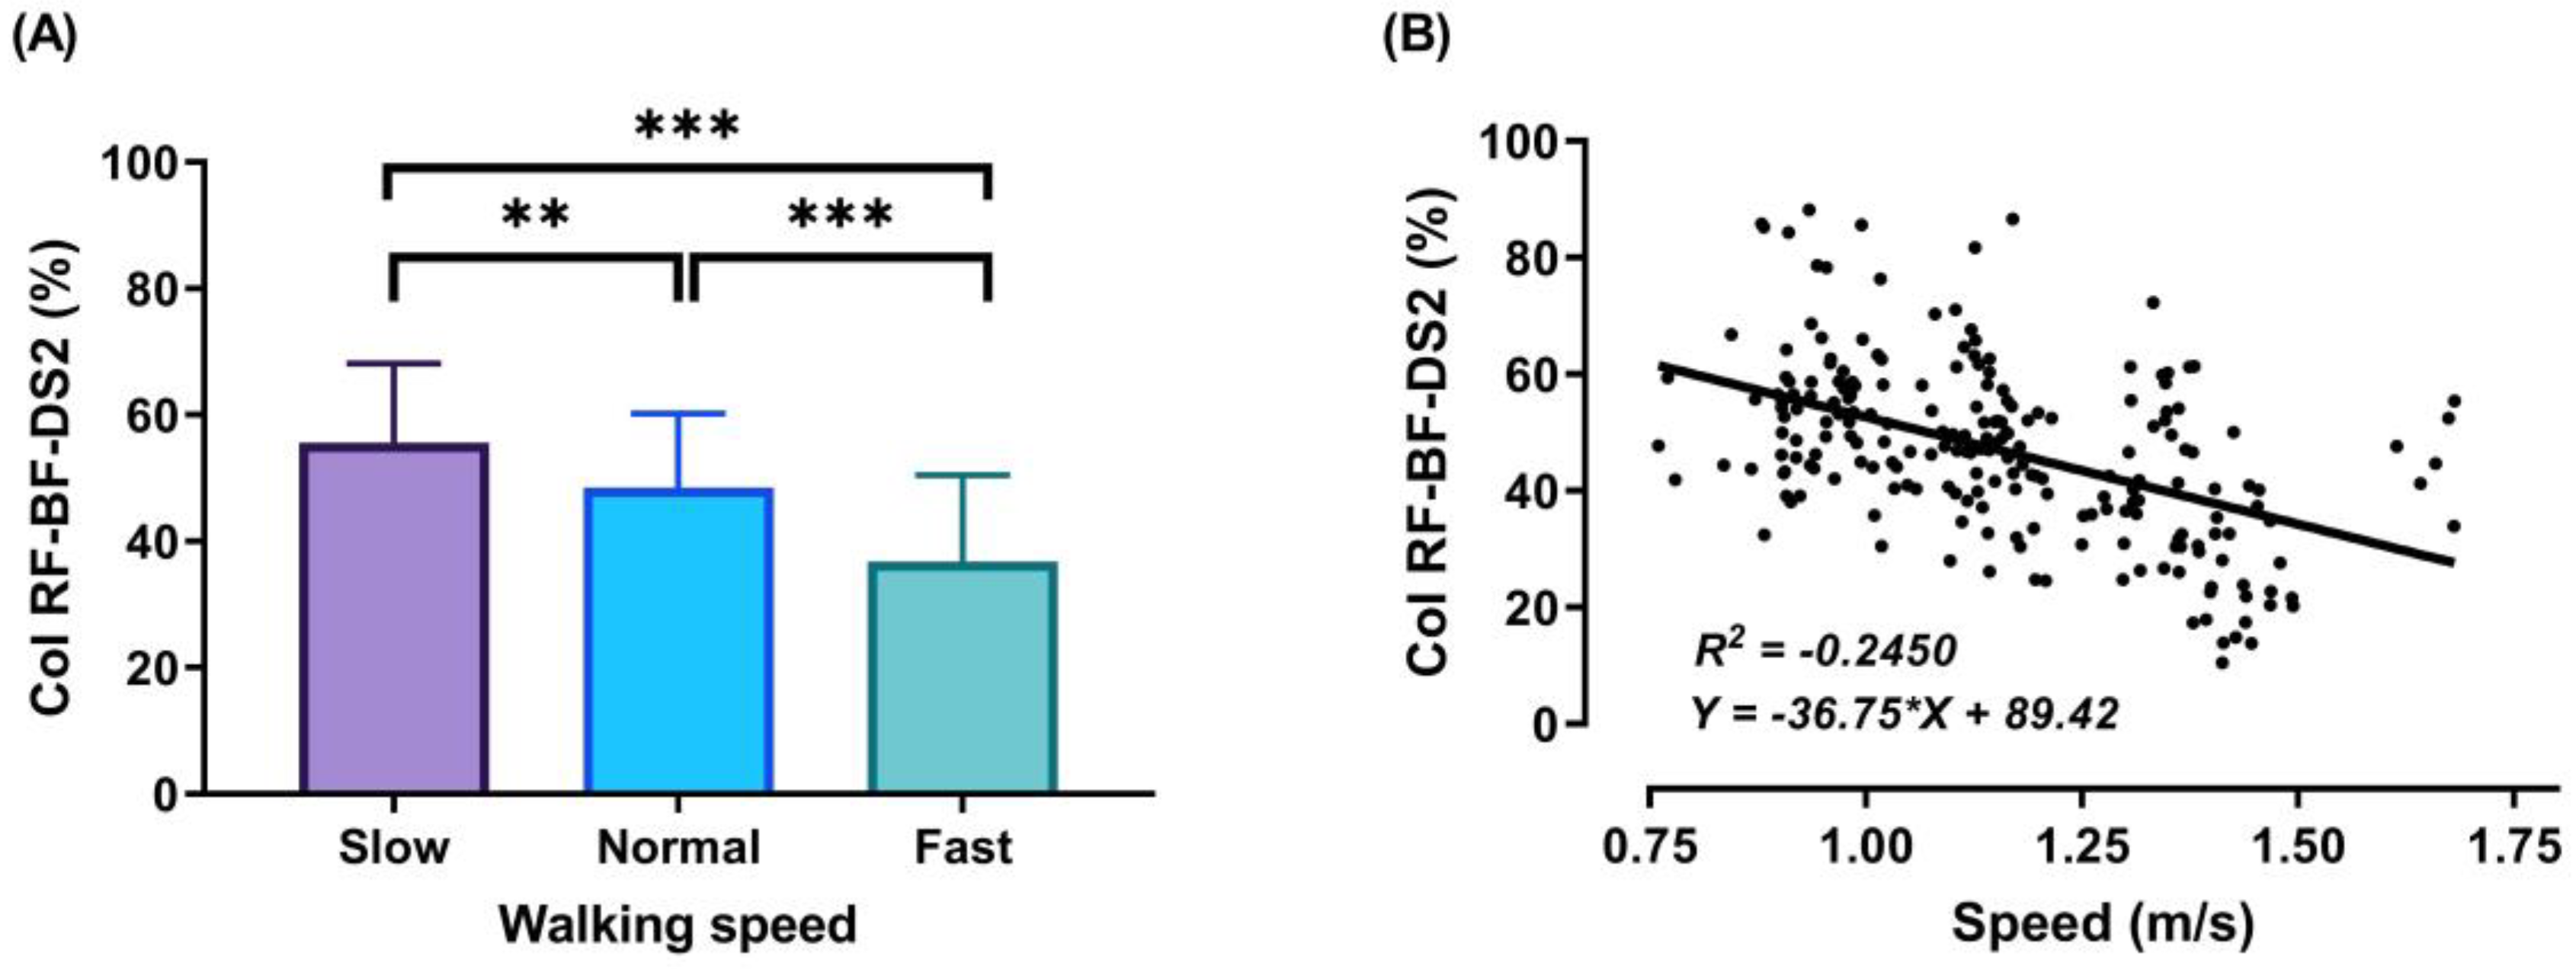
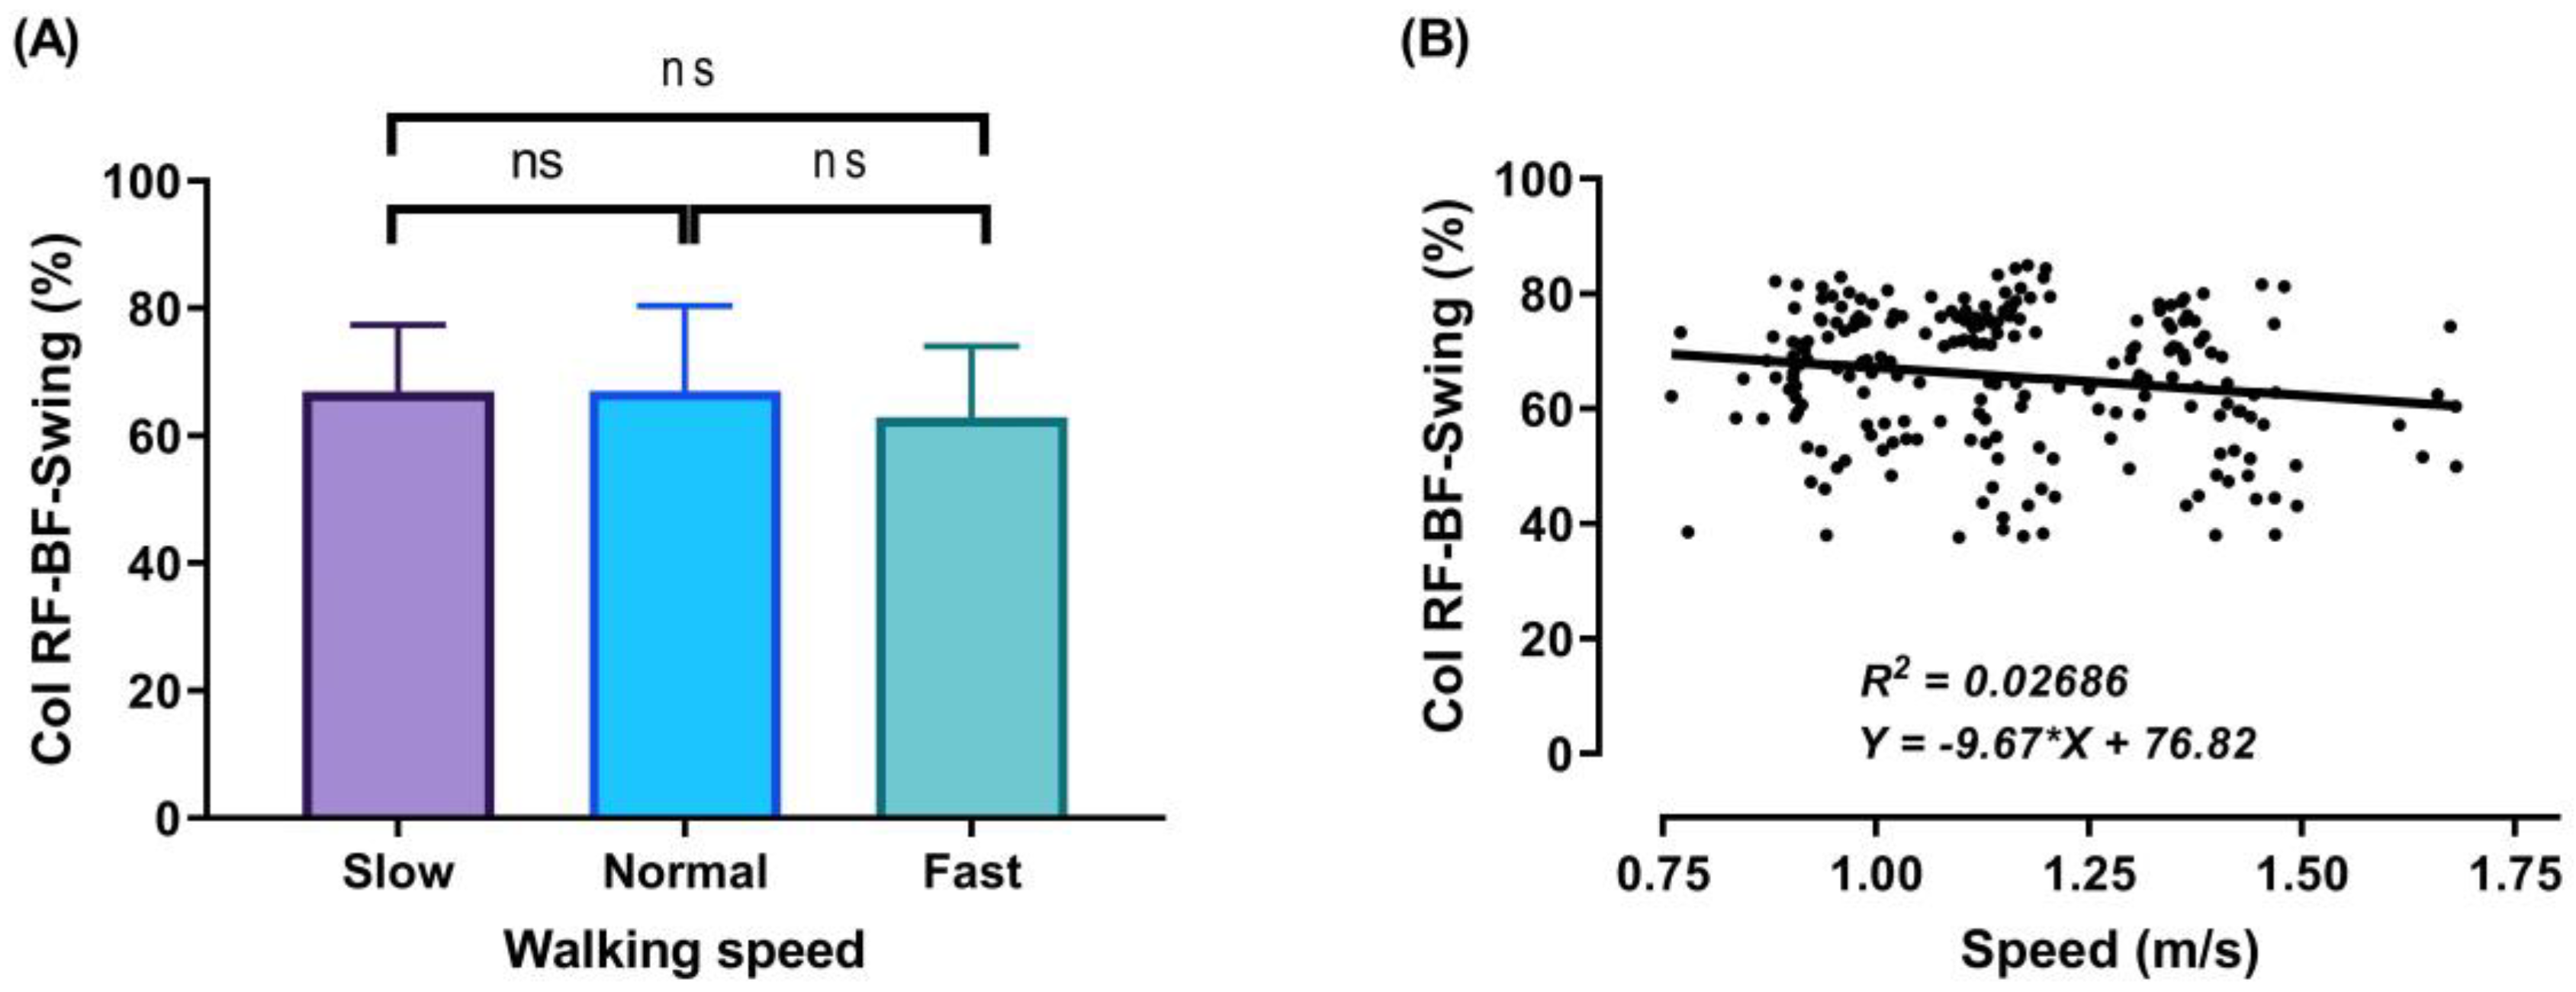
During the DS1, SS, and DS2 phases, significant decreases (p < 0.001) in CoI of thigh muscles were observed between slow to fast walking (23.88%, 16.72%, and 51.33%, respectively). During DS1 and DS2, significant decreases (p < 0.001) in CoI of thigh muscles were observed between normal and fast walking (17.85% and 31.67%, respectively), and during SS, significant decreases (p < 0.01) between normal and fast walking (13.67%), as shown in Figure 6, Figure 7 and Figure 8A. For DS2, with the increase of walking speed, a decrease of CoI of thigh muscles (14.93%) was observed between slow and normal walking (p < 0.01, see Figure 8A). However, no significant CoI of thigh muscles was observed between slow and normal walking during DS1 or SS, or between all speeds during the Swing phase.

3.3. Relationship between Walking Speed and CoI of Thigh Muscles

Pearson correlations analysis showed a negative relationship between walking speed and CoI of thigh muscles in all speeds during walking phases DS1 (r = −0.423, p < 0.01), SS (r = −0.285, p < 0.01), DS2 (r = −0.573, p < 0.01), and Swing (r = −0.214, p < 0.01), as shown in Figure 6, Figure 7, Figure 8 and Figure 9B.

4. Discussion

To our knowledge, this is the first study to investigate the changes in CoI of thigh muscles as a function of walking speed in healthy females using the co-activation index. The purposes of our study were twofold: to examine the changes in CoI of thigh muscles during three walking speeds (slow, normal, and fast), and also to investigate the relationships between CoI of thigh muscles and walking speed.
Significant differences were observed between all speeds in walking parameters, except the stride width (Figure 5), perhaps because the participants of this study were healthy adult females and had the required ability for preserving balance during walking at different speeds [28,40,41,42,43].
In our study, the walking cycle was divided into four phases (DS1, SS, DS2, and Swing phase) in each of the three different speeds (slow, normal, and fast). During the DS1 phase, the highest magnitude of co-activation was detected (Figure 6A) when the subject moved the leg in front of the body by extending the knee and flexing the hip, with the knee partially flexed and hip moving into extension, allowing weight acceptance and absorbing the shock at the end of this phase. Consequently, to save and control stability during walking involves a combination of distal ankle and proximal hip muscle activation, because it is very important to support and correct the upper body posture [3,44]. Therefore, the RF and BF muscles contracted to achieve stability during this phase. In addition, a decrease was observed in the CoI of thigh muscles with gait speed (for slow walking 65.46 ± 13.55%, normal walking 62.27 ± 13.53%, and fast walking 52.84 ± 15.71%). These results were higher than during the SS and DS2 phases and may be due to the observed changes in the time duration of DS1 when the different walking speeds were compared. Note that the lower limb movements in the DS1 phase start with the extension of the knee and flexion of the hip, and end when the knee is partially flex and the hip starts to extend (Figure 5).
During the SS phase, a significant co-activation was detected (Figure 7A) when the contralateral leg starts leaving the ground. In this phase, the knee and hip of the support leg continue extending, the body weight is exerted over the support leg, and RF and BF act synergistically on the knee joint to control the body movement forward. The average CoI of thigh muscles observed during this phase reveals a decrease with the increase of the speed: slow walking = 58.08 ± 13.45%, normal walking = 56.56 ± 14.03%, and fast walking = 49.76 ± 12.45%.
During the DS2 phase, the third co-activation was observed (Figure 8A) when the participant’s body moves forward, and the leg continues extending. Results showed significant differences in CoI between walking speeds in this phase (slow walking = 55.66 ± 12.47%, normal walking = 48.43 ± 11.77%, and fast walking = 36.78 ± 13.72%). This may be due to the small duration of this particular phase, especially in the fast walking condition, resulting in a small percentage of co-activation.
Finally, during the swing phase, a co-activation was observed (Figure 9A), since in this phase the knee and hip continue flexing to reach the maximum flexion at the midswing, after which the leg moves forward in front of the body by knee extension and the leg slowing down to touch the ground for the next stride. During the swing phase, the average CoI of thigh muscles at the three studied walking speeds was 66.97 ± 10.40%, 67.04 ± 13.32%, and 62.91 ± 11.17% for the slow, normal, and fast walking speeds, respectively.
The outcomes of this study show no significant differences found between slow and normal speed in the CoI of thigh muscles during the DS1, SS, or Swing phases (Figure 6A, Figure 7A and Figure 9A). However, they show instead a significant difference during DS2 (Figure 8A). This may be due to the possibility of thigh muscle contraction during DS2 being affected by the long duration of DS2 in slow walking. Moreover, the results showed that changes in the CoI of thigh muscles between slow and fast speed are significantly greater than between normal and fast conditions during the DS1, SS, DS2, and Swing phases. Therefore, our study indicates that the high activation of antagonist muscles is more important to control gait stability during slow and normal walking than during fast walking. This result is reinforced by the negative relationship noticed between walking speed and CoI of thigh muscles during the DS1, SS, DS2, and Swing phases (Figure 6, Figure 7, Figure 8 and Figure 9B) [27].
Furthermore, our study found a significant negative relationship between walking speed and CoI of thigh muscles during all walking phases: DS1, SS, DS2, and Swing (r = −0.3386, p < 0.001; r = −0.2144, p < 0.01; r = −0.4949, p < 0.001; and r = −0.1639, p < 0.05, respectively), as shown in Figure 6, Figure 7, Figure 8 and Figure 9B. This finding suggests that adults probably use a higher activation of antagonist thigh muscles at lower walking speeds to allow enhancing dynamic joint stability. In several previous studies, a high co-activation of antagonist muscles has been observed as a strategy to stiffen the joint and enhance stability [27,45,46]. Thus, increased muscle co-activation may be a necessary change to keep postural control during walking, especially when increasing the duration of the walking cycle by decreasing the walking speed (Figure 5).

5. Conclusions

To conclude, the results represent an attempt at quantification of the thigh muscles’ co-activation (RF/BF) in healthy females during walking at different speeds (slow, normal, and fast). Four different co-activations were identified at all the studied walking speeds (slow, normal, and fast), including DS1 (65.46%; 62.27%; 52.84%), SS (58.08%; 56.56%; 49.76%), DS2 (55.66%; 48.43%; 36.78%), and Swing phase (66.97%; 67.04%; 62.91%). However, these always changed inversely with gait speed. This increased co-activation when walking speed is reduced indicates increased requirements of joint stability.

Author Contributions

Conceptualization, A.-R.A.; methodology, A.-R.A. and P.F.; software, A.-R.A. and P.F.; validation, A.-R.A., P.G. and F.C.; formal analysis, A.-R.A.; investigation, A.-R.A.; resources, A.-R.A.; data curation, A.-R.A. and P.F.; writing—original draft preparation, A.-R.A. and F.C.; writing—review and editing, A.-R.A., P.G., A.H., J.P.V.-B. and F.C.; visualization, A.-R.A.; supervision, F.C.; project administration, A.-R.A.; funding acquisition, A.-R.A. All authors have read and agreed to the published version of the manuscript.

Funding

This research was funded by the Erasmus Mundus program of the European Union, and a grant funded by the University Network for Business and Administration (UNetBA) project, grant number UN15PD0005.

Institutional Review Board Statement

The study was conducted according to the guidelines of the Declaration of Helsinki, and approved by the Ethics Committee of the Faculty of Sports, University of Porto.

Informed Consent Statement

Informed consent was obtained from all subjects involved in the study.

Data Availability Statement

The data presented in this study are available on request from the corresponding author.

Acknowledgments

The authors would like to thank the subjects for participating in this study.

Conflicts of Interest

The authors declare no conflict of interest.

References

  1. Akl, A.R.; Baca, A.; Richards, J.; Conceicao, F. Leg and lower limb dynamic joint stiffness during different walking speeds in healthy adults. Gait Posture 2020, 82, 294–300. [Google Scholar] [CrossRef] [PubMed]
  2. Hof, A.L.; Elzinga, H.; Grimmius, W.; Halbertsma, J.P.K. Speed dependence of averaged EMG profiles in walking. Gait Posture 2002, 16, 78–86. [Google Scholar] [CrossRef] [Green Version]
  3. Tirosh, O.; Sangeux, M.; Wong, M.; Thomason, P.; Graham, H.K. Walking speed effects on the lower limb electromyographic variability of healthy children aged 7–16 years. J. Electromyogr. Kinesiol. 2013, 23, 1451–1459. [Google Scholar] [CrossRef] [PubMed]
  4. den Otter, A.R.; Geurts, A.C.H.; Mulder, T.; Duysens, J. Speed related changes in muscle activity from normal to very slow walking speeds. Gait Posture 2004, 19, 270–278. [Google Scholar] [CrossRef] [Green Version]
  5. Liu, M.Q.; Anderson, F.C.; Pandy, M.G.; Delp, S.L. Muscles that support the body also modulate forward progression during walking. J. Biomech. 2006, 39, 2623–2630. [Google Scholar] [CrossRef] [PubMed]
  6. Neptune, R.R.; Zajac, F.E.; Kautz, S.A. Muscle force redistributes segmental power for body progression during walking. Gait Posture 2004, 19, 194–205. [Google Scholar] [CrossRef] [Green Version]
  7. Pandy, M.G. Computer modeling and simulation of human movement. Annu. Rev. Biomed. Eng. 2001, 3, 245–273. [Google Scholar] [CrossRef]
  8. Neptune, R.R.; Sasaki, K.; Kautz, S.A. The effect of walking speed on muscle function and mechanical energetics. Gait Posture 2008, 28, 135–143. [Google Scholar] [CrossRef] [PubMed] [Green Version]
  9. Katsavelis, D.; Threlkeld, A.J. Quantifying thigh muscle co-activation during isometric knee extension contractions: Within- and between-session reliability. J. Electromyogr. Kinesiol. 2014, 24, 502–507. [Google Scholar] [CrossRef] [Green Version]
  10. Arias, P.; Espinosa, N.; Robles-Garcia, V.; Cao, R.; Cudeiro, J. Antagonist muscle co-activation during straight walking and its relation to kinematics: Insight from young, elderly and Parkinson’s disease. Brain Res. 2012, 1455, 124–131. [Google Scholar] [CrossRef] [Green Version]
  11. Peterson, D.S.; Martin, P.E. Effects of age and walking speed on coactivation and cost of walking in healthy adults. Gait Posture 2010, 31, 355–359. [Google Scholar] [CrossRef] [PubMed]
  12. Hubley-Kozey, C.; Deluzio, K.; Dunbar, M. Muscle co-activation patterns during walking in those with severe knee osteoarthritis. Clin. Biomech. 2008, 23, 71–80. [Google Scholar] [CrossRef] [PubMed]
  13. Lee, N.; Kang, H.; Shin, G. Use of antagonist muscle EMG in the assessment of neuromuscular health of the low back. J. Physiol. Anthropol. 2015, 34, 18. [Google Scholar] [CrossRef] [PubMed] [Green Version]
  14. Larsen, A.H.; Puggaard, L.; Hämäläinen, U.; Aagaard, P. Comparison of ground reaction forces and antagonist muscle coactivation during stair walking with ageing. J. Electromyogr. Kinesiol. 2008, 18, 568–580. [Google Scholar] [CrossRef] [PubMed]
  15. Gagnat, Y.; Braendvik, S.M.; Roeleveld, K. Surface Electromyography Normalization Affects the Interpretation of Muscle Activity and Coactivation in Children With Cerebral Palsy During Walking. Front. Neurol. 2020, 11, 202. [Google Scholar] [CrossRef]
  16. Silva, A.; Sousa, A.S.; Silva, C.; Tavares, J.M.; Santos, R.; Sousa, F. Ankle antagonist coactivation in the double-support phase of walking: Stroke vs. healthy subjects. Somatosens. Mot. Res. 2015, 32, 153–157. [Google Scholar] [CrossRef] [Green Version]
  17. Silva, A.; Sousa, A.S.; Tavares, J.M.; Tinoco, A.; Santos, R.; Sousa, F. Ankle dynamic in stroke patients: Agonist vs. antagonist muscle relations. Somatosens. Mot. Res. 2012, 29, 111–116. [Google Scholar] [CrossRef] [Green Version]
  18. Chow, J.W.; Yablon, S.A.; Stokic, D.S. Coactivation of ankle muscles during stance phase of gait in patients with lower limb hypertonia after acquired brain injury. Clin. Neurophysiol. Off. J. Int. Fed. Clin. Neurophysiol. 2012, 123, 1599–1605. [Google Scholar] [CrossRef]
  19. Lamontagne, A.; Richards, C.L.; Malouin, F. Coactivation during gait as an adaptive behavior after stroke. J. Electromyogr. Kinesiol. 2000, 10, 407–415. [Google Scholar] [CrossRef]
  20. Kitatani, R.; Ohata, K.; Sakuma, K.; Aga, Y.; Yamakami, N.; Hashiguchi, Y.; Yamada, S. Ankle muscle coactivation during gait is decreased immediately after anterior weight shift practice in adults after stroke. Gait Posture 2016, 45, 35–40. [Google Scholar] [CrossRef]
  21. Seidler, R.D.; He, J.; Stemach, G.E. Coactivation to reduce variability in the elderly. Mot. Control 1998, 2, 314–315. [Google Scholar] [CrossRef] [PubMed]
  22. Ridge, S.T.; Henley, J.; Manal, K.; Miller, F.; Richards, J.G. Biomechanical analysis of gait termination in 11–17 year old youth at preferred and fast walking speeds. Hum. Mov. Sci. 2016, 49, 178–185. [Google Scholar] [CrossRef] [PubMed]
  23. Di Nardo, F.; Maranesi, E.; Mengarelli, A.; Ghetti, G.; Burattini, L.; Fioretti, S. Assessment of the variability of vastii myoelectric activity in young healthy females during walking: A statistical gait analysis. J. Electromyogr. Kinesiol. 2015, 25, 800–807. [Google Scholar] [CrossRef] [PubMed]
  24. Ait-Haddou, R.; Binding, P.; Herzog, W. Theoretical considerations on cocontraction of sets of agonistic and antagonistic muscles. J. Biomech. 2000, 33, 1105–1111. [Google Scholar] [CrossRef]
  25. Zoffoli, L.; Lucertini, F.; Federici, A.; Ditroilo, M. Trunk muscles activation during pole walking vs. walking performed at different speeds and grades. Gait Posture 2016, 46, 57–62. [Google Scholar] [CrossRef]
  26. Holt, K.G.; Wagenaar, R.C.; LaFiandra, M.E.; Kubo, M.; Obusek, J.P. Increased musculoskeletal stiffness during load carriage at increasing walking speeds maintains constant vertical excursion of the body center of mass. J Biomech. 2003, 36, 465–471. [Google Scholar] [CrossRef]
  27. Lee, H.-J.; Chang, W.H.; Choi, B.-O.; Ryu, G.-H.; Kim, Y.-H. Age-related differences in muscle co-activation during locomotion and their relationship with gait speed: A pilot study. BMC Geriatr. 2017, 17, 44. [Google Scholar] [CrossRef] [Green Version]
  28. Khan, S.S.; Khan, S.J.; Usman, J. Effects of toe-out and toe-in gait with varying walking speeds on knee joint mechanics and lower limb energetics. Gait Posture 2017, 53, 185–192. [Google Scholar] [CrossRef]
  29. Murley, G.S.; Menz, H.B.; Landorf, K.B. Electromyographic patterns of tibialis posterior and related muscles when walking at different speeds. Gait Posture 2014, 39, 1080–1085. [Google Scholar] [CrossRef]
  30. Kodesh, E.; Kafri, M.; Dar, G.; Dickstein, R. Walking speed, unilateral leg loading, and step symmetry in young adults. Gait Posture 2012, 35, 66–69. [Google Scholar] [CrossRef]
  31. Quittmann, O.J.; Meskemper, J.; Albracht, K.; Abel, T.; Foitschik, T.; Struder, H.K. Normalising surface EMG of ten upper-extremity muscles in handcycling: Manual resistance vs. sport-specific MVICs. J. Electromyogr. Kinesiol. Off. J. Int. Soc. Electrophysiol. Kinesiol. 2020, 51, 102402. [Google Scholar] [CrossRef] [PubMed]
  32. Andrade, R.J.; Nordez, A.; Hug, F.; Ates, F.; Coppieters, M.W.; Pezarat-Correia, P.; Freitas, S.R. Non-invasive assessment of sciatic nerve stiffness during human ankle motion using ultrasound shear wave elastography. J. Biomech. 2015, 49, 326–331. [Google Scholar] [CrossRef] [PubMed] [Green Version]
  33. Tapia, C.; Daud, O.; Ruiz-del-Solar, J. EMG Signal Filtering Based on Independent Component Analysis and Empirical Mode Decomposition for Estimation of Motor Activation Patterns. J. Med. Biol. Eng. 2017, 37, 140–155. [Google Scholar] [CrossRef]
  34. Oliveira, C.F.d.; Soares, D.P.; Bertani, M.C.; Machado, L.J.R.; Vila-Boas, J.P. Effects of Fast-Walking on Muscle Activation in Young Adults and Elderly Persons. J. Nov. Physiother. Rehabil. 2017, 1, 12–19. [Google Scholar]
  35. Hermens, H.J.; Freriks, B.; Disselhorst-Klug, C.; Rau, G. Development of recommendations for SEMG sensors and sensor placement procedures. J. Electromyogr. Kinesiol. 2000, 10, 361–374. [Google Scholar] [CrossRef]
  36. Di Nardo, F.; Strazza, A.; Mengarelli, A.; Ercolani, S.; Morgoni, N.; Burattini, L.; Agostini, V.; Knaflitz, M.; Fioretti, S. Surface EMG patterns for quantification of thigh muscle co-contraction in school-age children: Normative data during walking. Gait Posture 2018, 61, 25–33. [Google Scholar] [CrossRef]
  37. Markowitz, J.; Herr, H. Human Leg Model Predicts Muscle Forces, States, and Energetics during Walking. PLoS Comput. Biol. 2016, 12, e1004912. [Google Scholar] [CrossRef]
  38. Mari, S.; Serrao, M.; Casali, C.; Conte, C.; Martino, G.; Ranavolo, A.; Coppola, G.; Draicchio, F.; Padua, L.; Sandrini, G.; et al. Lower Limb Antagonist Muscle Co-Activation and its Relationship with Gait Parameters in Cerebellar Ataxia. Cerebellum 2014, 13, 226–236. [Google Scholar] [CrossRef]
  39. Kellis, E.; Arabatzi, F.; Papadopoulos, C. Muscle co-activation around the knee in drop jumping using the co-contraction index. J. Electromyogr. Kinesiol. 2003, 13, 229–238. [Google Scholar] [CrossRef]
  40. Martino, G.; Ivanenko, Y.P.; Serrao, M.; Ranavolo, A.; d’Avella, A.; Draicchio, F.; Conte, C.; Casali, C.; Lacquaniti, F. Locomotor patterns in cerebellar ataxia. J. Neurophysiol. 2014, 112, 2810–2821. [Google Scholar] [CrossRef]
  41. Ko, S.U.; Hausdorff, J.M.; Ferrucci, L. Age-associated differences in the gait pattern changes of older adults during fast-speed and fatigue conditions: Results from the Baltimore longitudinal study of ageing. Age Ageing 2010, 39, 688–694. [Google Scholar] [CrossRef] [Green Version]
  42. Fox, M.D.; Delp, S.L. Contributions of muscles and passive dynamics to swing initiation over a range of walking speeds. J. Biomech. 2010, 43, 1450–1455. [Google Scholar] [CrossRef] [PubMed] [Green Version]
  43. Kubo, M.; Holt, K.G.; Saltzman, E.; Wagenaar, R.C. Changes in axial stiffness of the trunk as a function of walking speed. J. Biomech. 2006, 39, 750–757. [Google Scholar] [CrossRef] [PubMed]
  44. Winter, D.A.; Yack, H.J. EMG profiles during normal human walking: Stride-to-stride and inter-subject variability. Electroencephalogr. Clin. Neurophysiol. 1987, 67, 402–411. [Google Scholar] [CrossRef]
  45. Nagai, K.; Yamada, M.; Uemura, K.; Yamada, Y.; Ichihashi, N.; Tsuboyama, T. Differences in muscle coactivation during postural control between healthy older and young adults. Arch. Gerontol. Geriatr. 2011, 53, 338–343. [Google Scholar] [CrossRef] [Green Version]
  46. Hortoba’gyi, T.; DeVita, P. Muscle pre- and coactivity during downward stepping are associated with leg stiffness in aging. J. Electromyogr. Kinesiol. 2000, 10, 117–126. [Google Scholar] [CrossRef]
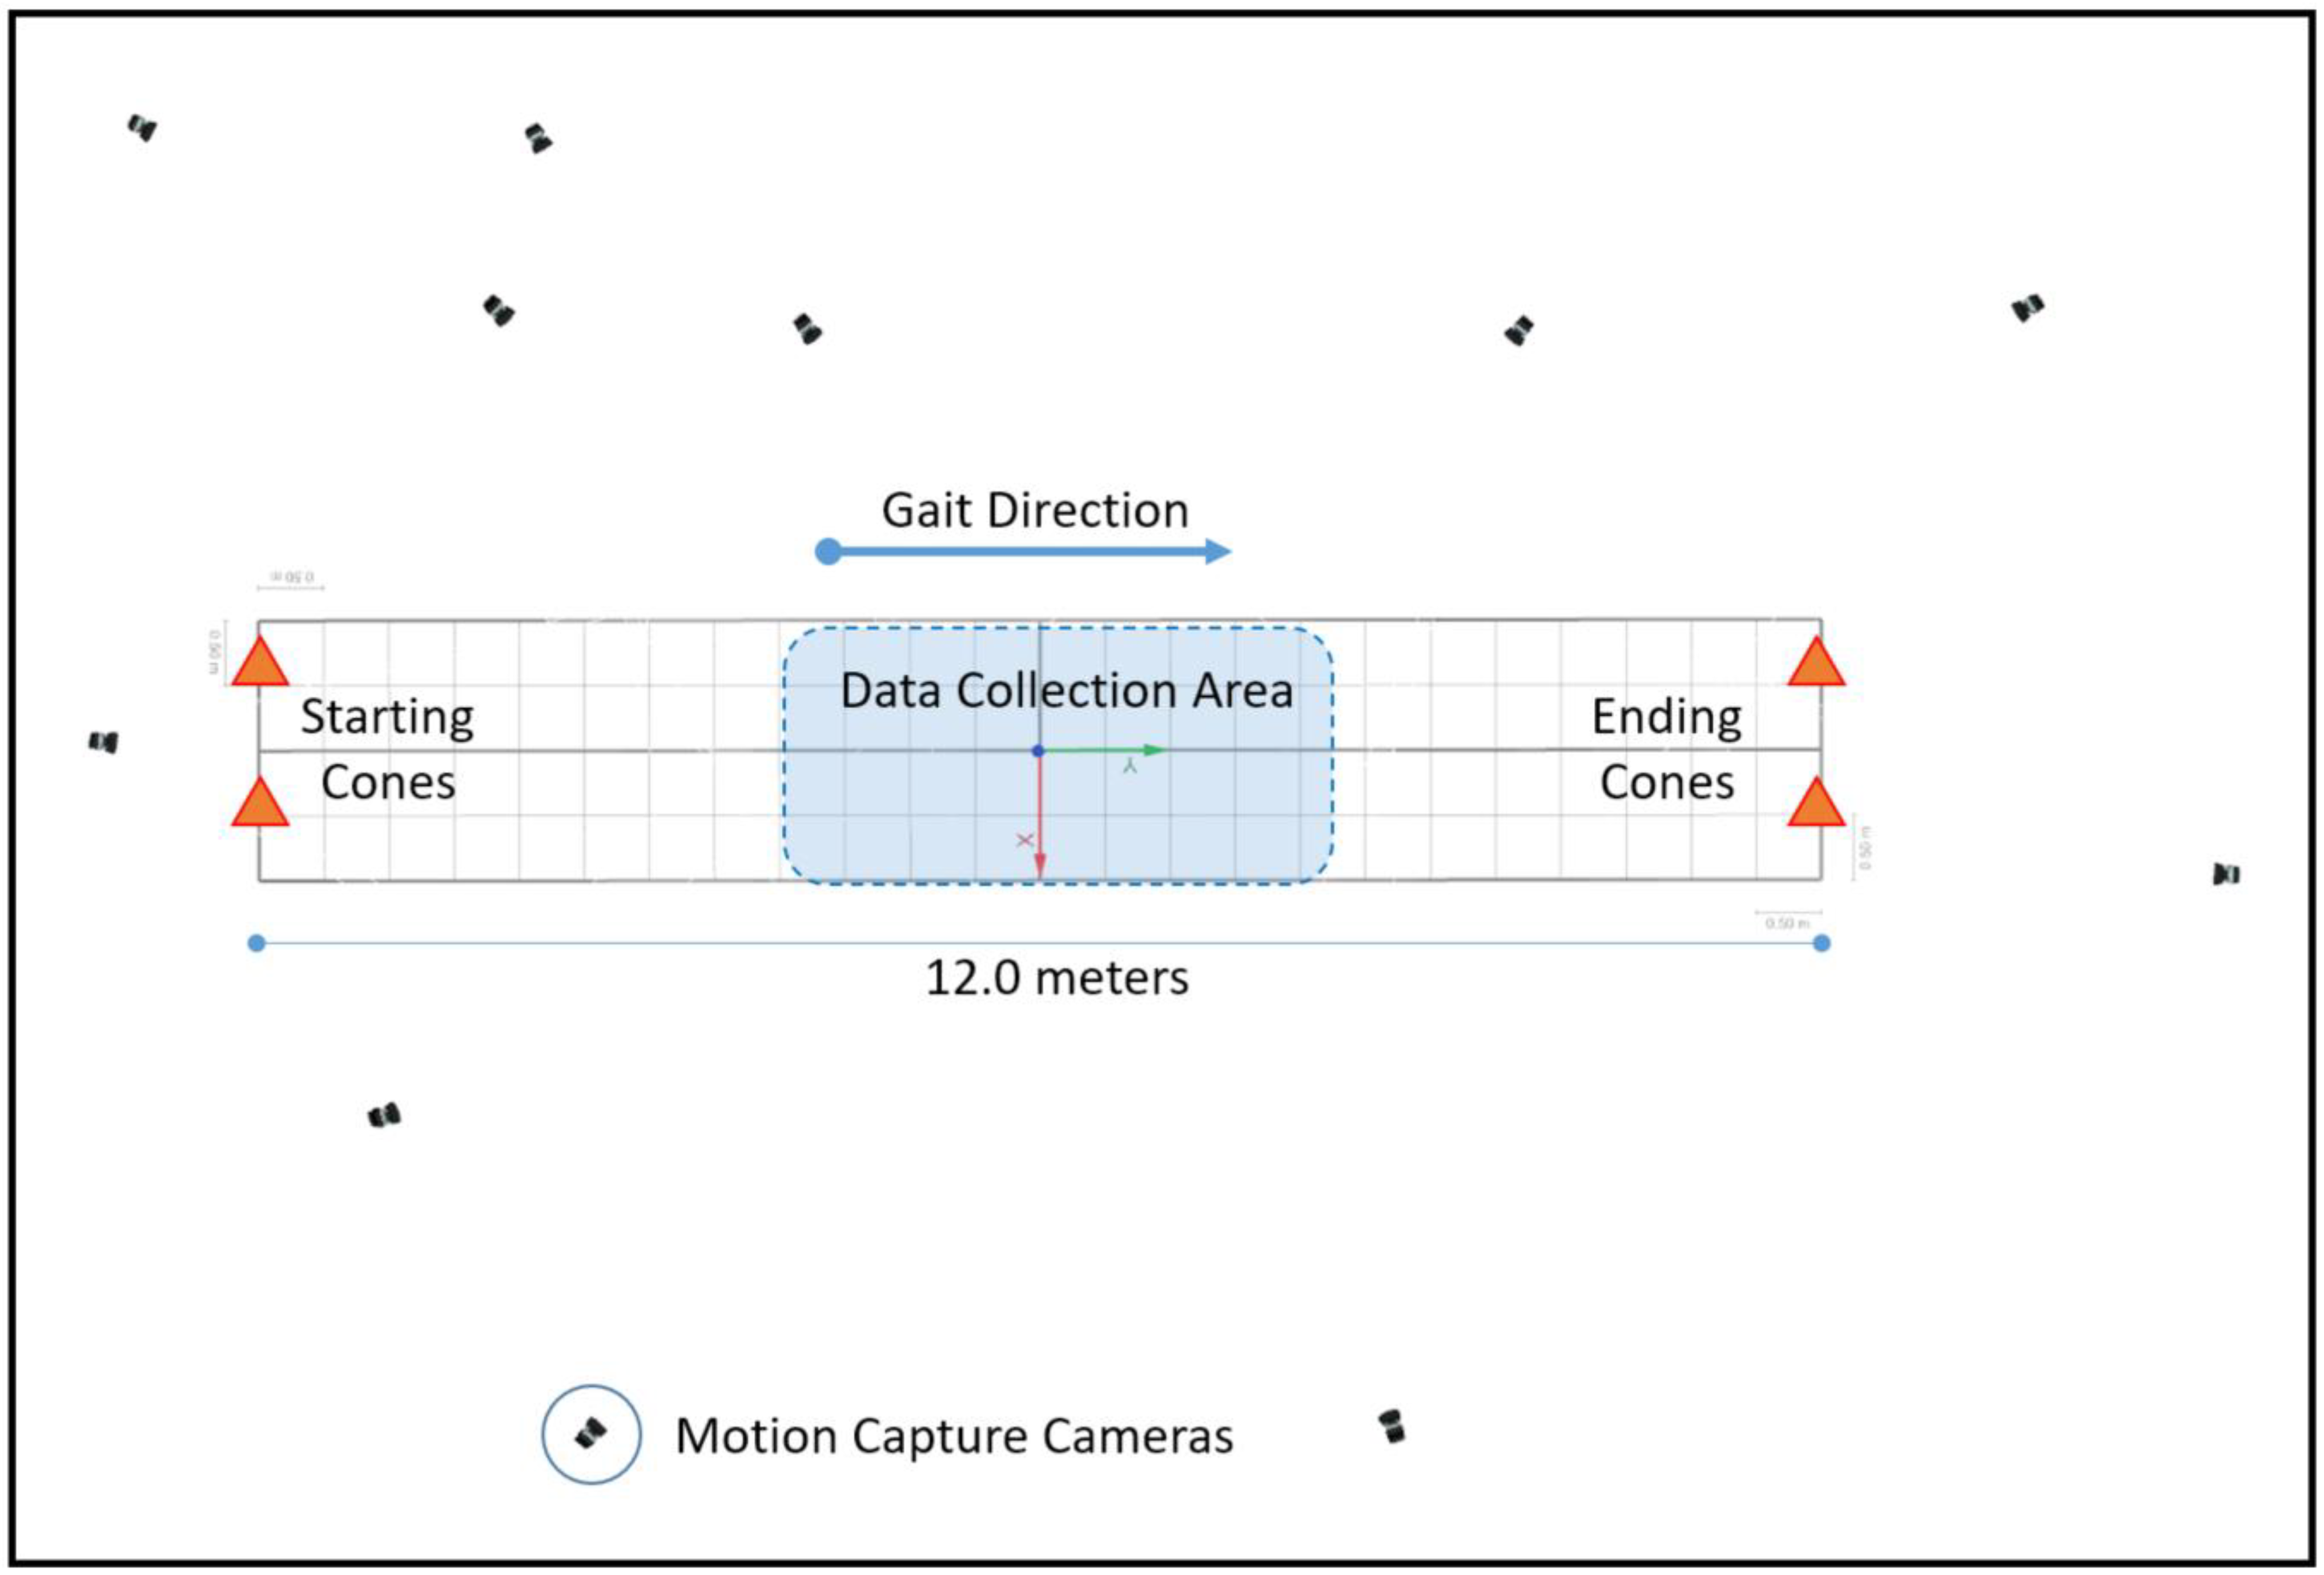
Figure 1. Data collection area for the different walking speeds, camera set-up around the court, and movement direction.
Sensors 21 00677 g001
Figure 2. Reflective markers set-up for kinematical modelling.
Sensors 21 00677 g002
Figure 3. EMG sensors placement on selected muscles.
Sensors 21 00677 g003
Figure 4. Walking phases: first double support (DS1), single support (SS), second double support (DS2), and swing of the rectus femoris (RF) and biceps femoris (BF). First raw signal; EMG raw data, second raw signal; EMG rectified data and third raw signal; and EMG RMS during (A) slow walking, (B) normal walking, and (C) fast walking. (D) Muscle activity amplitude of the three speeds of rectus femoris and biceps femoris.
Sensors 21 00677 g004
Figure 5. Walking characteristics at different speeds (Slow, Normal, and Fast). walking speed (A), stride length (B), step length (C), stride width (D), cycle time (E), stance time (F), step time (G), and swing time (H). ANOVA results showing the differences of walking characteristics during walking speed (Slow, Normal, and Fast). Asterisk signs above the line represent significant differences between walking speeds: (***) indicates p ˂ 0.001, and (ns) indicates non-significant.
Sensors 21 00677 g005
Figure 6. Mean of thigh muscles (RF-BF) co-activation at different walking speeds (slow, normal, and fast) during walking phases: DS1 (A). ANOVA results showing the effects of changing in CoI of thigh muscles during walking speed (slow, normal, and fast). Correlation between walking speed and thigh muscles (RF-BF) co-activation during DS1 walking phase (B). Asterisk signs above the line represent significant differences between walking speed: (***) indicates p ˂ 0.001, and (ns) indicates non-significant.
Sensors 21 00677 g006
Figure 7. Mean of thigh muscles (RF-BF) co-activation at different walking speeds (slow, normal, and fast) during walking phases: SS (A). ANOVA results showing the effects of changing in CoI of thigh muscles during walking speed (slow, normal, and fast). Correlation between walking speed and thigh muscles (RF-BF) co-activation during SS walking phase (B). Asterisk signs above the line represent significant differences between walking speed: (***) indicates p ˂ 0.001, (**) indicates p ˂ 0.01, and (ns) indicates non-significant.
Sensors 21 00677 g007
Figure 8. Mean of thigh muscles (RF-BF) co-activation at different walking speeds (slow, normal, and fast) during walking phases: DS2 (A). ANOVA results showing the effects of changing in CoI of thigh muscles during walking speed (slow, normal, and fast). Correlation between walking speed and thigh muscles (RF-BF) co-activation during DS2 walking phase (B). Asterisk signs above the line represent significant differences between walking speed: (***) indicates p ˂ 0.001, and (**) indicates p ˂ 0.01.
Sensors 21 00677 g008
Figure 9. Mean of thigh muscles (RF-BF) co-activation at different walking speeds (slow, normal, and fast) during walking phases: Swing (A). ANOVA results showing the effects of changing in CoI of thigh muscles during walking speed (slow, normal, and fast). Correlation between walking speed and thigh muscles (RF-BF) co-activation during Swing walking phase (B). Asterisk signs above the line represent significant differences between walking speed: (ns) indicates non-significant.
Sensors 21 00677 g009
Table 1. The different percentages of significant walking characteristics.
Walking Characteristics/SpeedSlow/Normal (%)Slow/Fast (%)Normal/Fast (%)
SpeedS < N (16.67)S < F (32.38)N < F (18.85)
Cycle timeS > N (16.09)S > F (35.04)N > F (16.33)
Stance timeS > N (17.37)S > F (39.00)N > F (18.43)
Step timeS > N (16.89)S > F (36.12)N > F (16.45)
Swing timeS > N (14.14)S > F (29.29)N > F (13.27)
Stride LengthS < N (3.87)S < F (9.50)N < F (5.86)
Step LengthS < N (3.72)S < F (9.82)N < F (6.34)
S: slow walking; N: normal walking; F: fast walking.
Publisher’s Note: MDPI stays neutral with regard to jurisdictional claims in published maps and institutional affiliations.