Article

Temperature Sensor Based on Periodically Tapered Optical Fibers

by
Bartlomiej Guzowski
* and
Mateusz Łakomski
Department of Semiconductor and Optoelectronic Devices, Lodz University of Technology, 93-590 Lodz, Poland
*
Author to whom correspondence should be addressed.
Sensors 2021, 21(24), 8358; https://doi.org/10.3390/s21248358
Submission received: 9 November 2021 / Revised: 10 December 2021 / Accepted: 13 December 2021 / Published: 14 December 2021
(This article belongs to the Section Optical Sensors)

Abstract

:
In this paper, the fabrication and characterization of a temperature sensor based on periodically tapered optical fibers (PTOF) are presented. The relation between the geometry of the sensors and sensing ability was investigated in order to find the relatively simple structure of a sensor. Four types of PTOF structures with two, four, six and eight waists were manufactured with the fusion splicer. For each PTOF type, the theoretical free spectral range (FSR) was calculated and compared with measurements. The experiments were conducted for a temperature range of 20–70 °C. The results proved that the number of the tapered regions in PTOF is crucial, because some of the investigated structures did not exhibit the temperature response. The interference occurring inside the structures with two and four waists was found be too weak and, therefore, the transmission dip was hardly visible. We proved that sensors with a low number of tapered regions cannot be considered as a temperature sensor. Sufficiently more valuable results were obtained for the last two types of PTOF, where the sensor’s sensitivity was equal to 0.07 dB/°C with an excellent linear fitting (R2 > 0.99). The transmission dip shift can be described by a linear function (R2 > 0.97) with a slope α > 0.39 nm/°C.

1. Introduction

Temperature measurement can be performed using one of three methods: the non-electric method, the pyrometric method and the electric method. The non-electrical method uses a change in the physical state or physical or chemical parameters of the object. In the pyrometric method, the thermal radiation of the object is investigated. The third method is based on the relationship between the change in object temperature and resistance (resistance sensors) or the relationship between the thermoelectric strength of a thermocouple and temperature (generation sensors). There are a large number of different electric temperature sensors, e.g., negative temperature coefficient (NTC) thermistors [1], resistance temperature detectors, thermocouples [2] or semiconductor temperature sensors [3,4]. Recently, optical fiber sensors have been intensively developed for a large number of applications, such as: temperature measurement [5,6,7,8], displacement sensing [9,10,11,12], strain/pressure detection [13,14,15,16,17], and bio-photonic and medical tests [18,19,20]. Due to their dielectric nature, numerous advantages can be distinguished: contactless operation, small dimension and weight, high efficiency and low cost. Different types of fiber optic temperature sensors have been proposed, e.g., fiber Bragg gratings (FBG) [5,21,22], tapered optical fibers [6,23,24], long-period gratings (LPG) [7,25,26], and Fabry–Perot (F-P) [27,28,29] or modal interferometers [8,11]. The sensitivity of temperature sensors based on FBG is limited due to small thermo-optic coefficient and glass thermal expansion [20,30]. The sensitivity of sensors based on F-P interferometers can be very high; for example, in [29] it was >2.70 nm/°C, but only in the specific range of 51.2–70.5 °C. For high-temperature applications, multicore fibers have been proposed [31]. These structures enable measurement of temperature up to 1000 °C with sensitivity of ~36.8 pm/°C. For higher temperature ranges, sensors based on sapphire fiber have been developed [32,33,34,35,36] and their sensitivity did not exceed 35.7 nm/°C. The combination of sapphire fiber and FBG allows even 1900 °C to be investigated [35]. PMMA optical fibers were used to fabricate sensors for lower temperature applications (<110 °C) [37]. A very complex structure of a few tapered mode fibers with LPG was also investigated as a temperature sensor [38]. The structure reached the sensitivity of 39.3 pm/°C in the range of 30–90 °C. Among these sensor types, fiber optic Mach–Zehnder interferometers (MZI) are attractive for researchers because they are compact and relatively low cost [24,39,40,41,42,43]. In [44], using a cascaded sensor, where a capillary hollow-core fiber was placed between two sections of multimode fibers, temperature sensitivity reached 1.964 nm/°C in a range from 10 to 70 °C. In [45], a sensor with the cascaded configuration of MZI and F-B was presented. The impressive temperature sensitivity was equal to 6.82 nm/°C in a range from 10 to 60 °C. Another cascade of single-mode fiber, multimode fiber (MMF) and dual core fiber placed between MMFs was investigated by Zhao et al. [46]. In this case, the sensor achieved sensitivity of 2.18 nm/°C, although in a narrow range of temperature of 26–44 °C. The MZI can be utilized in many other applications, e.g., as a refractive index sensor [47,48,49] or a strain sensor [50,51].
Our goal was to develop a fiber optic temperature sensor based on periodically tapered optical fibers (PTOF) with a simple construction, low-cost production and, simultaneously, good sensing abilities. Therefore, in this study, we investigated the relation between the number of tapered regions in the developed PTOF and their sensing performance, in order to find the simplest sensor construction with good sensitivity. Four models of PTOF sensors, having 2, 4, 6 and 8 waists, were manufactured, and detailed information related to the principle of operation, and fabrication and characterization processes, is given. The expected free spectral ranges (FSR) between the interferometric fringes were calculated and confirmed by experimental results. The obtained results show that only two types of fabricated structures can be used as temperature sensors. The sensitivity of the developed sensors was compared with similar existing sensors and possible applications are given.

2. Principle of Operation

In a PTOF with a period of tapering Lp, four regions can be distinguished, as shown in Figure 1. The tapered-down and tapered-up regions are labeled in Figure 1 as region ld and lu, respectively. The waist region called l is placed between the ld and lu regions. The fourth element of the PTOF is a section of non-tapered fiber ls. The geometry of the sensor, particularly the symmetry and uniform waist region diameter d, are the key parameters of the PTOF. In our previous work [52], we showed that we were able to fabricate tapered fibers with the desired geometry in a repeatable manner. Based on this experience, we developed the fabrication process of PTOF structures.
The sensor principle of operation is based on MZI. Some of the light injected into the PTOF leaks from the core into a cladding in the taper-down region. Therefore, higher order modes are excited in the cladding area. By comparison, the cladding modes in the taper-up region are coupled back to the core region. Due to the phase difference ∆ϕ between the cladding and the core modes, the Mach–Zehnder interferometer is created in the sensor [50,53]. Equation (1) describes the relative phase difference between these interfering modes:
Δ ϕ = 2 π λ Δ n e f f L
where ∆neff is the difference between core and cladding effective refractive indices, L is the interferometric length, and λ is the central wavelength of light. Transmission dip appears for the phase difference equal to ∆ϕ = (2k + 1)π, where k is an integer. The transmission light intensity I is described with Equation (2) [53,54,55], and it will change with the change in temperature, causing variation in output power:
I = I c o + I c l + 2 I c o + I c l c o s ϕ
where Ico and Icl are intensities of the core and cladding modes, respectively.
The distance between the transmission dips is given by Equation (3) [56,57]:
Δ λ m λ 2 Δ n e f f L
The temperature variation causes the modification of the refractive index of the core and cladding [58,59,60] due to thermo-optic effects, in addition to the variation of L due to glass thermal expansion. Therefore, the temperature sensitivity of the sensor can be described by Equation (4) [61]:
d λ d T 2 L 2 k + 1 ( Δ n e f f   d n c o d T   n c o + Δ n e f f   d n c l d T   n c l ) + λ L   d L d T 1 2 L 2 k + 1   n e f f   λ

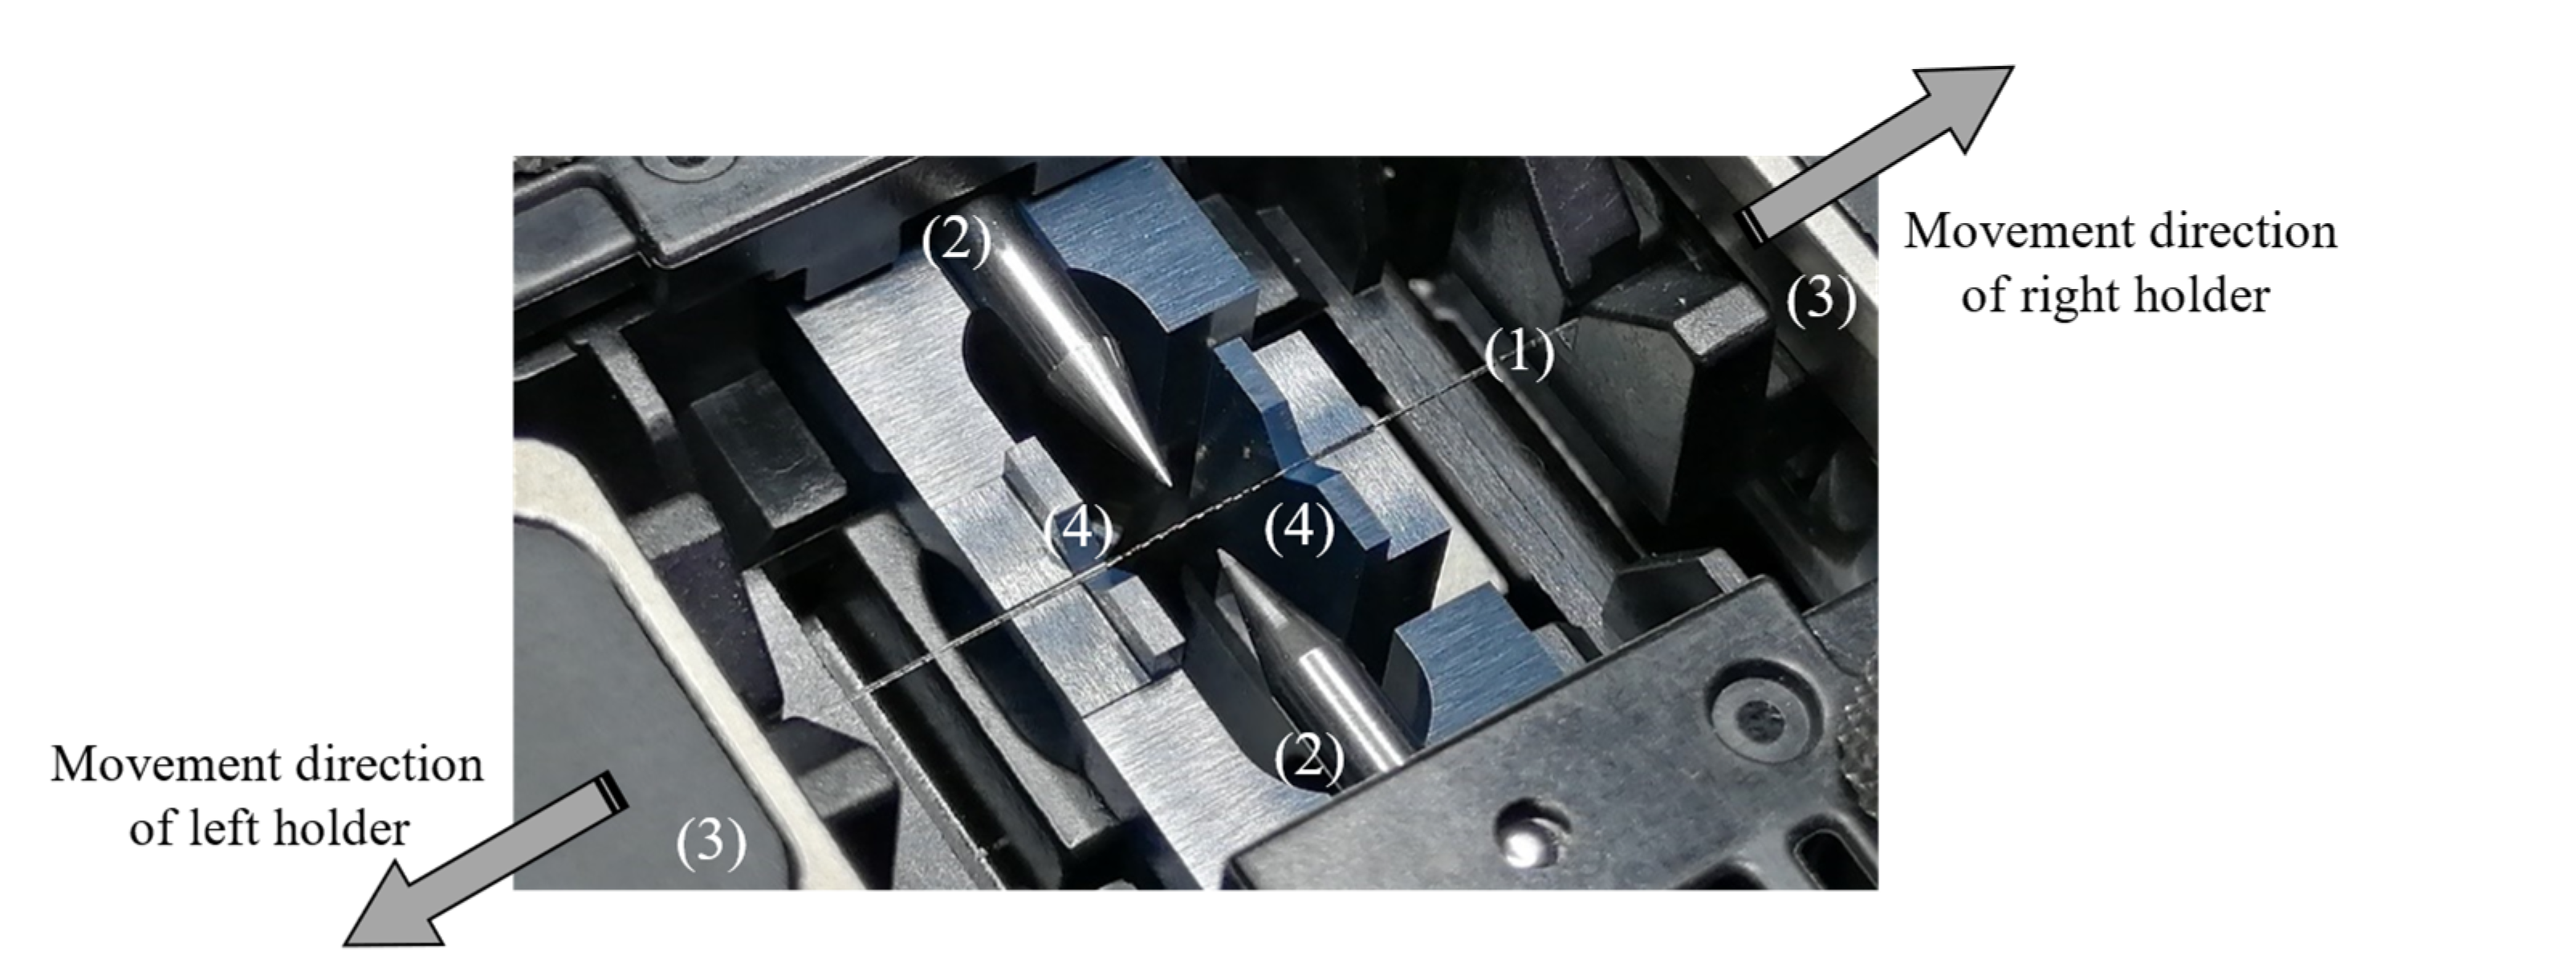
3. Fabrication Process

The Furukawa Fitel S153A optical fusion splicer and single mode G.652.B optical fiber (SMF) were used to fabricate the PTOF sensors. The SMF (1) was placed in V-grooves (4) and it was held by the fusion splicer holders (3), as presented in Figure 2. An example of the PTOF sensor with eight tapered regions is shown in Figure 3.
In the next step, the electric arc was excited by electrodes (2) in order to heat up the SMF (1). Then, the holders were moved with defined speed in order to elongate the SMF. After that, the left clamp of the holder was released and the right holder with the SMF was moved left by a distance of 500 µm. The SMF was then fastened back by the left clamp and the electric arc was excited once again. The whole procedure was repeated several times in order to obtain the desired number of waists. To control the geometry of the fabricated PTOF, the electric arc power P, travel of the splicer holders s, speed of holders v and arc duration t were precisely defined. The parameters that were set in the fusion splicer during the PTOF fabrication are collected in Table 1. Four different PTOFs were fabricated with two, four, six and eight tapered regions, respectively, as shown in Figure 4. For each type of the sensor, three samples were fabricated. The geometry parameters of the PTOF sensors are collected in Table 2.

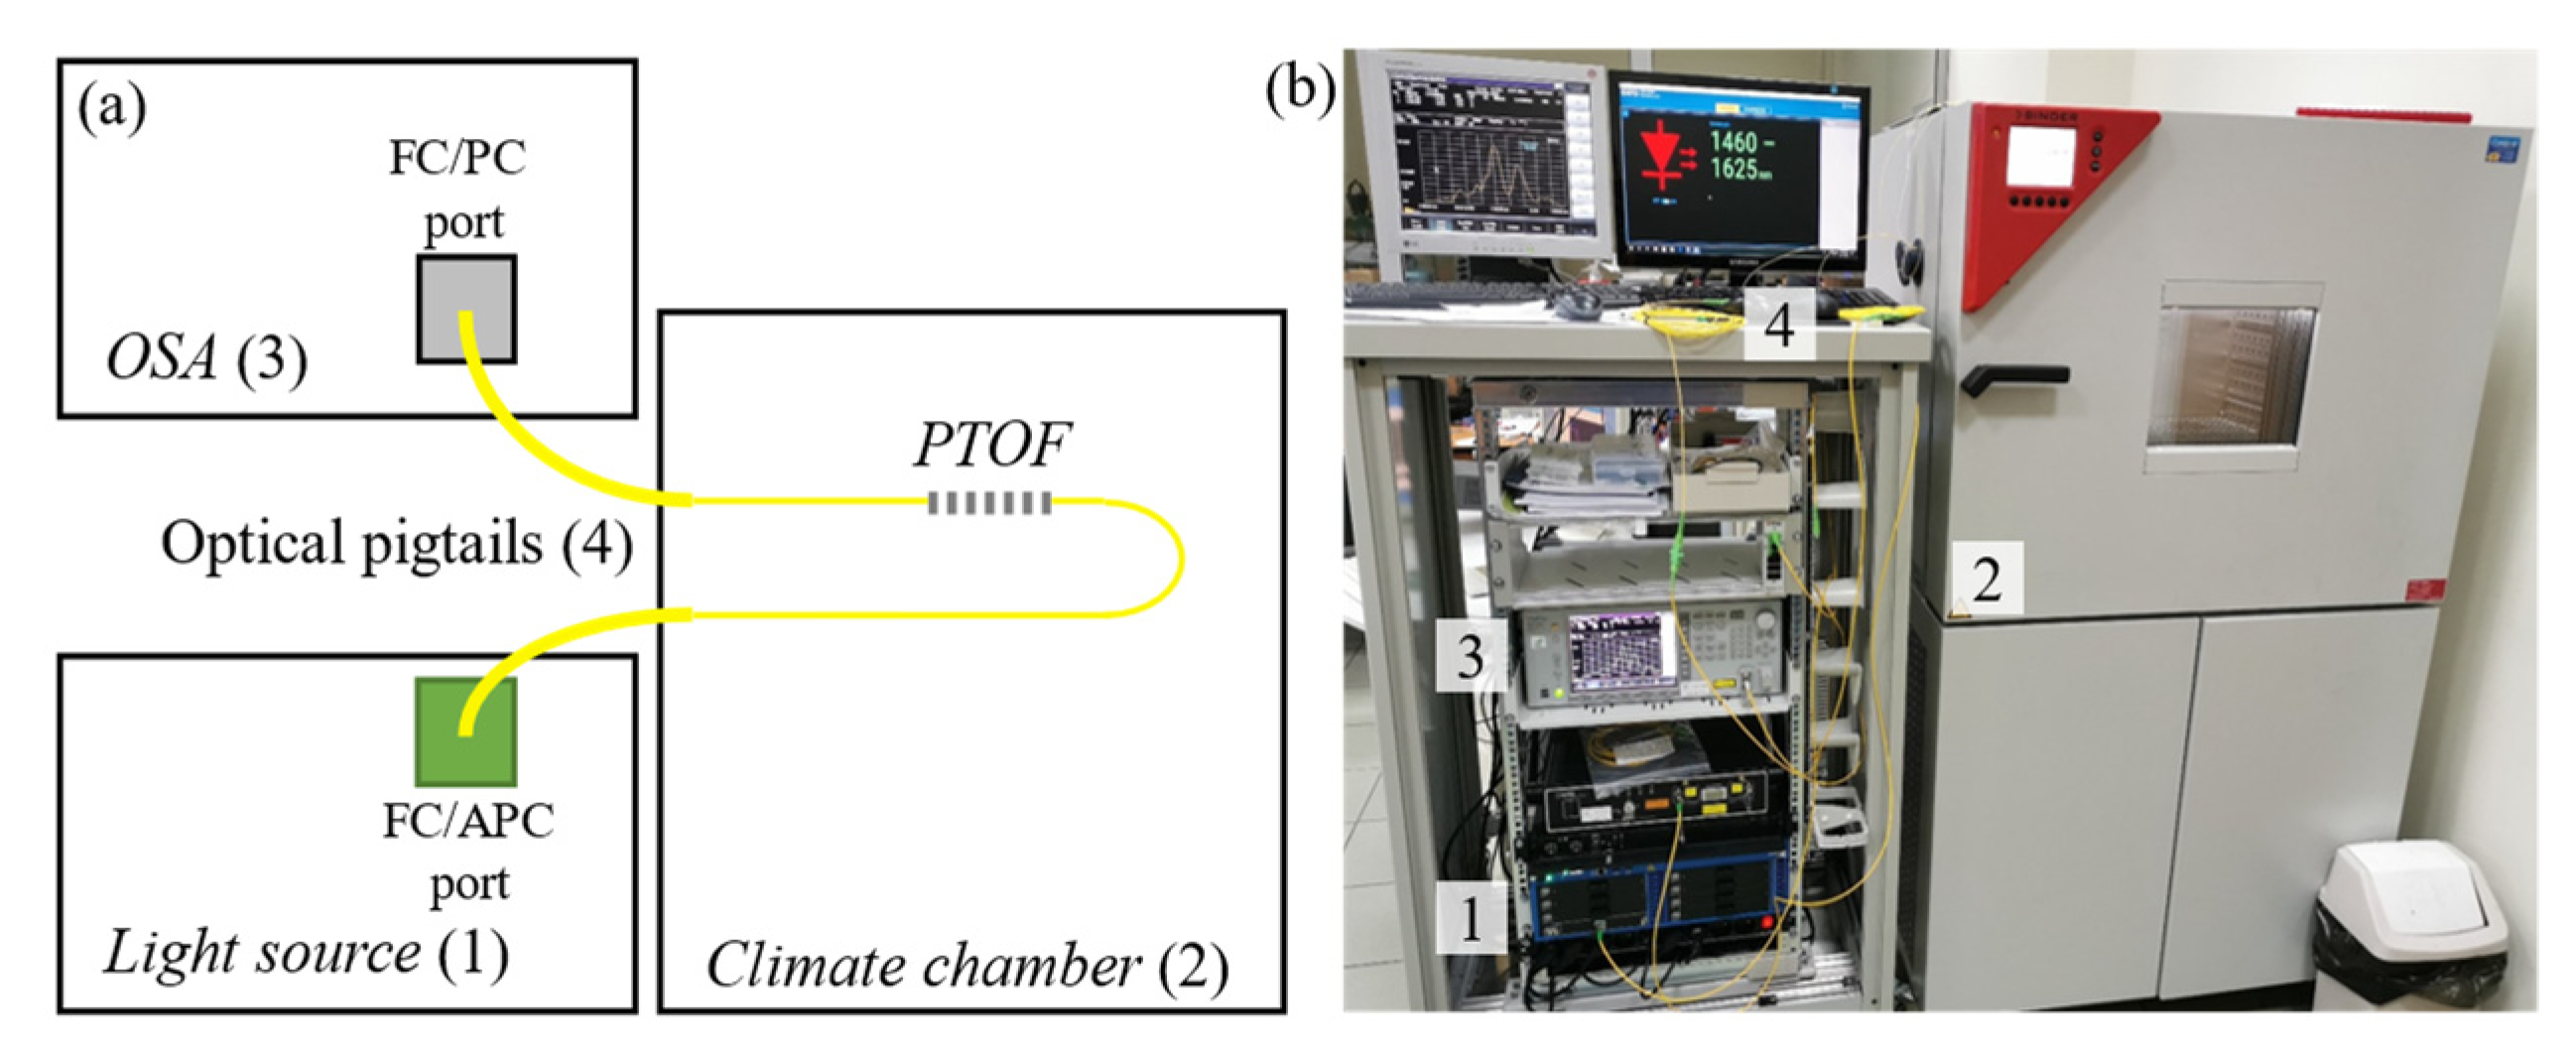
4. Measurement Setup and Procedure

The measurement setup block diagram is presented in Figure 5a. The fabricated PTOF structures were placed inside a Binder MKT-115 dynamic climate chamber (2), where the temperature Tchamber was changed from 20 to 70 °C. The temperature increase process was repeated three times for each sample, and during each change the transmission spectrum was analyzed with steps of 1 °C. However, to make the results easier to evaluate, the data are shown with a 5 °C step. The PTOF were connected to the EXFO FTBx-2250 broadband light source (1) and Anritsu MS9740A optical spectrum analyzer (OSA) (3) through the SC/APC pigtails (4), as presented in Figure 5b. The spectrum was investigated in the range from 1460 to 1620 nm in the 501 sampling points. The total power stability of the light source was equal to 0.02 dB.

5. Results and Discussion

The presented data are the averages for each type of sensor. The spectral measurement was undertaken via OSA with bandwidth resolution set at 0.44 nm. Spectral characteristics before and after the tapering processes for all PTOF structures are shown in Figure 6. To obtain the transmission spectrum, the difference in optical power between these spectra was calculated. The maximal values of a standard deviation were 0.24, 0.28, 0.59 and 0.45, respectively for PTOF-2, PTOF-4, PTOF-6 and PTOF-8 sensors. Theoretically determined (Equation (3)) transmission dip points are marked on Figure 6 with blue circles. Small discrepancies may have occurred due to imprecise determination of L. For PTOF-8 PTOF-6, the calculated and measured FSR (Table 3) are convergent. However, for PTOF-6, a theoretical transmission dip around 1507 nm was not observed. For PTOF-2 and PTOF-4, the measured transmission dips are very shallow and hardly perceptible. A similar observation was made by Yoon et al. [62]. The researchers investigated the temperature and strain sensors based on a micro-tapered fiber grating. They also observed the proportional relation between the number of tapered regions and depth of transmission dip. The explanation of these results is provided in Section 5.1.
The influence of temperature on sensor transmission characteristics for the whole spectrum is presented in Figure 7. The biggest transmission variations caused by temperature change are observed for PTOF-6 and PTOF-8 sensors. Detailed characterization of sensors is given in a later section of this article.

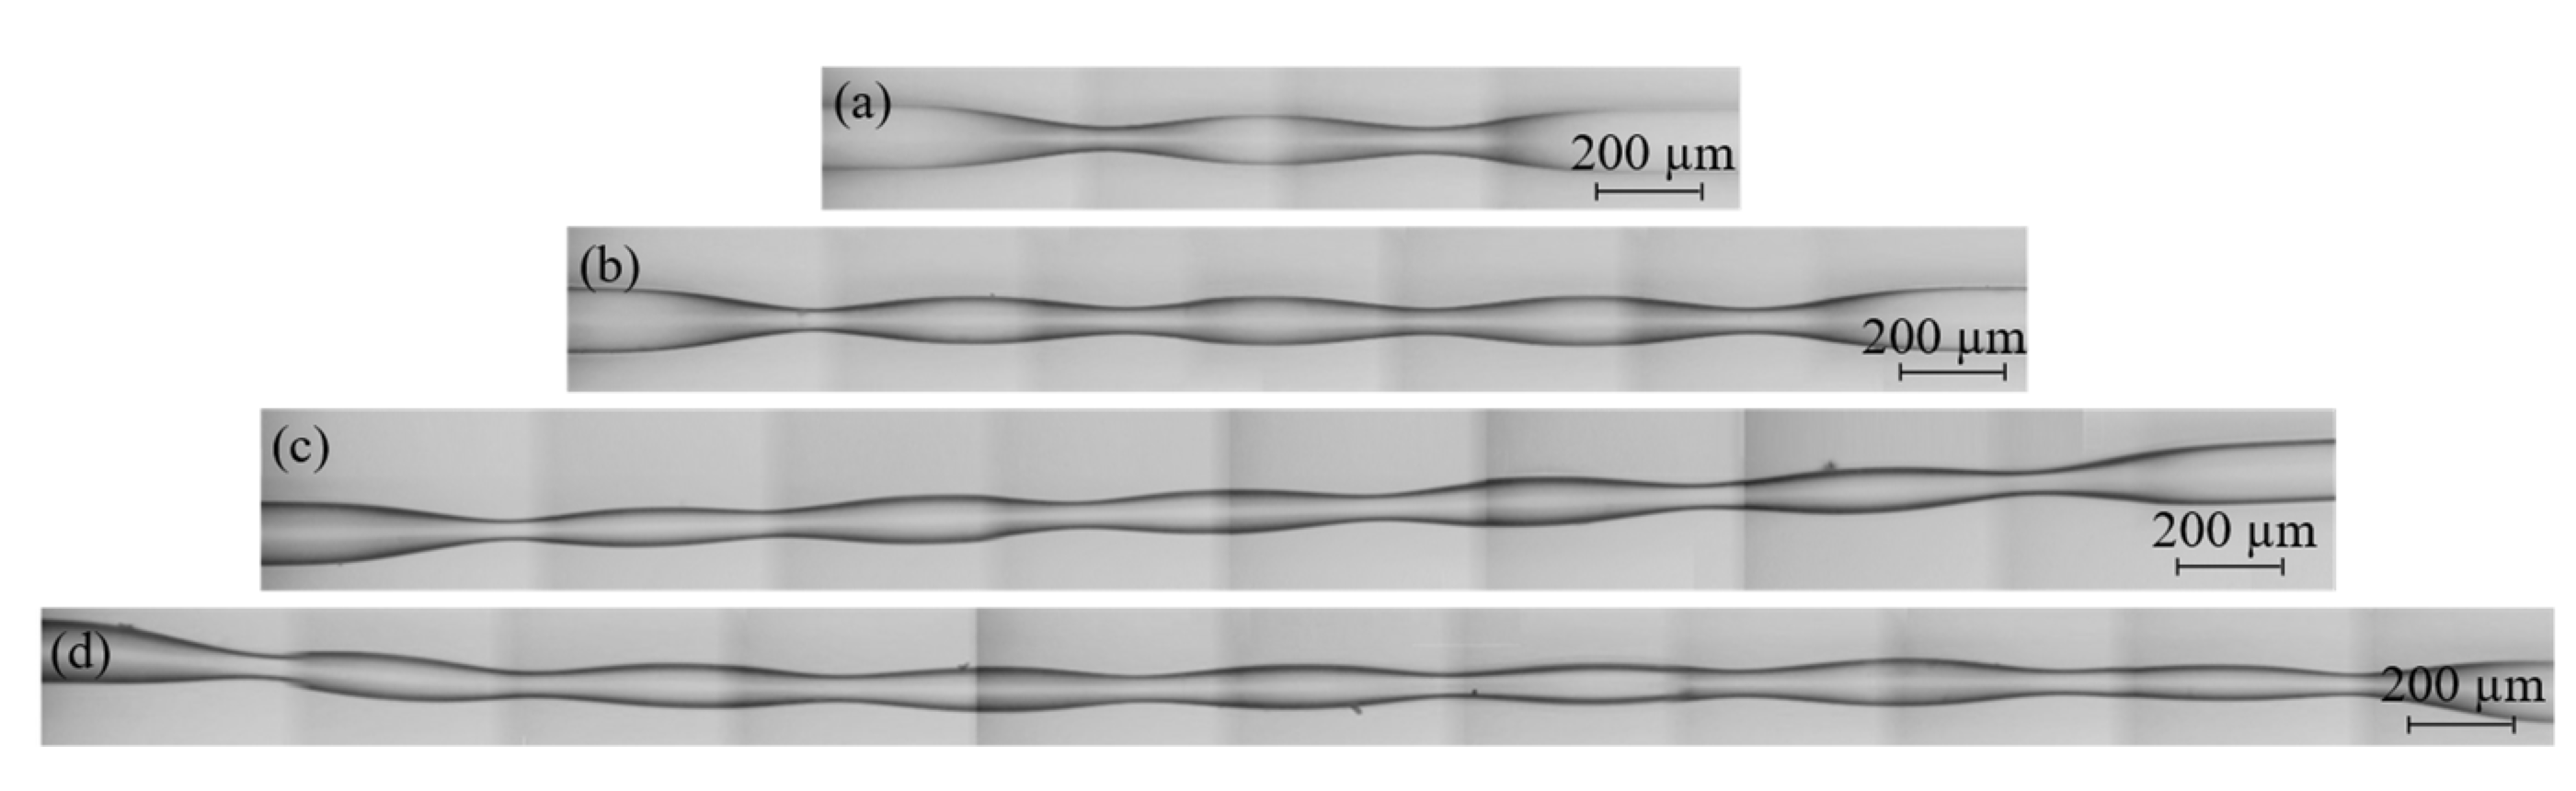
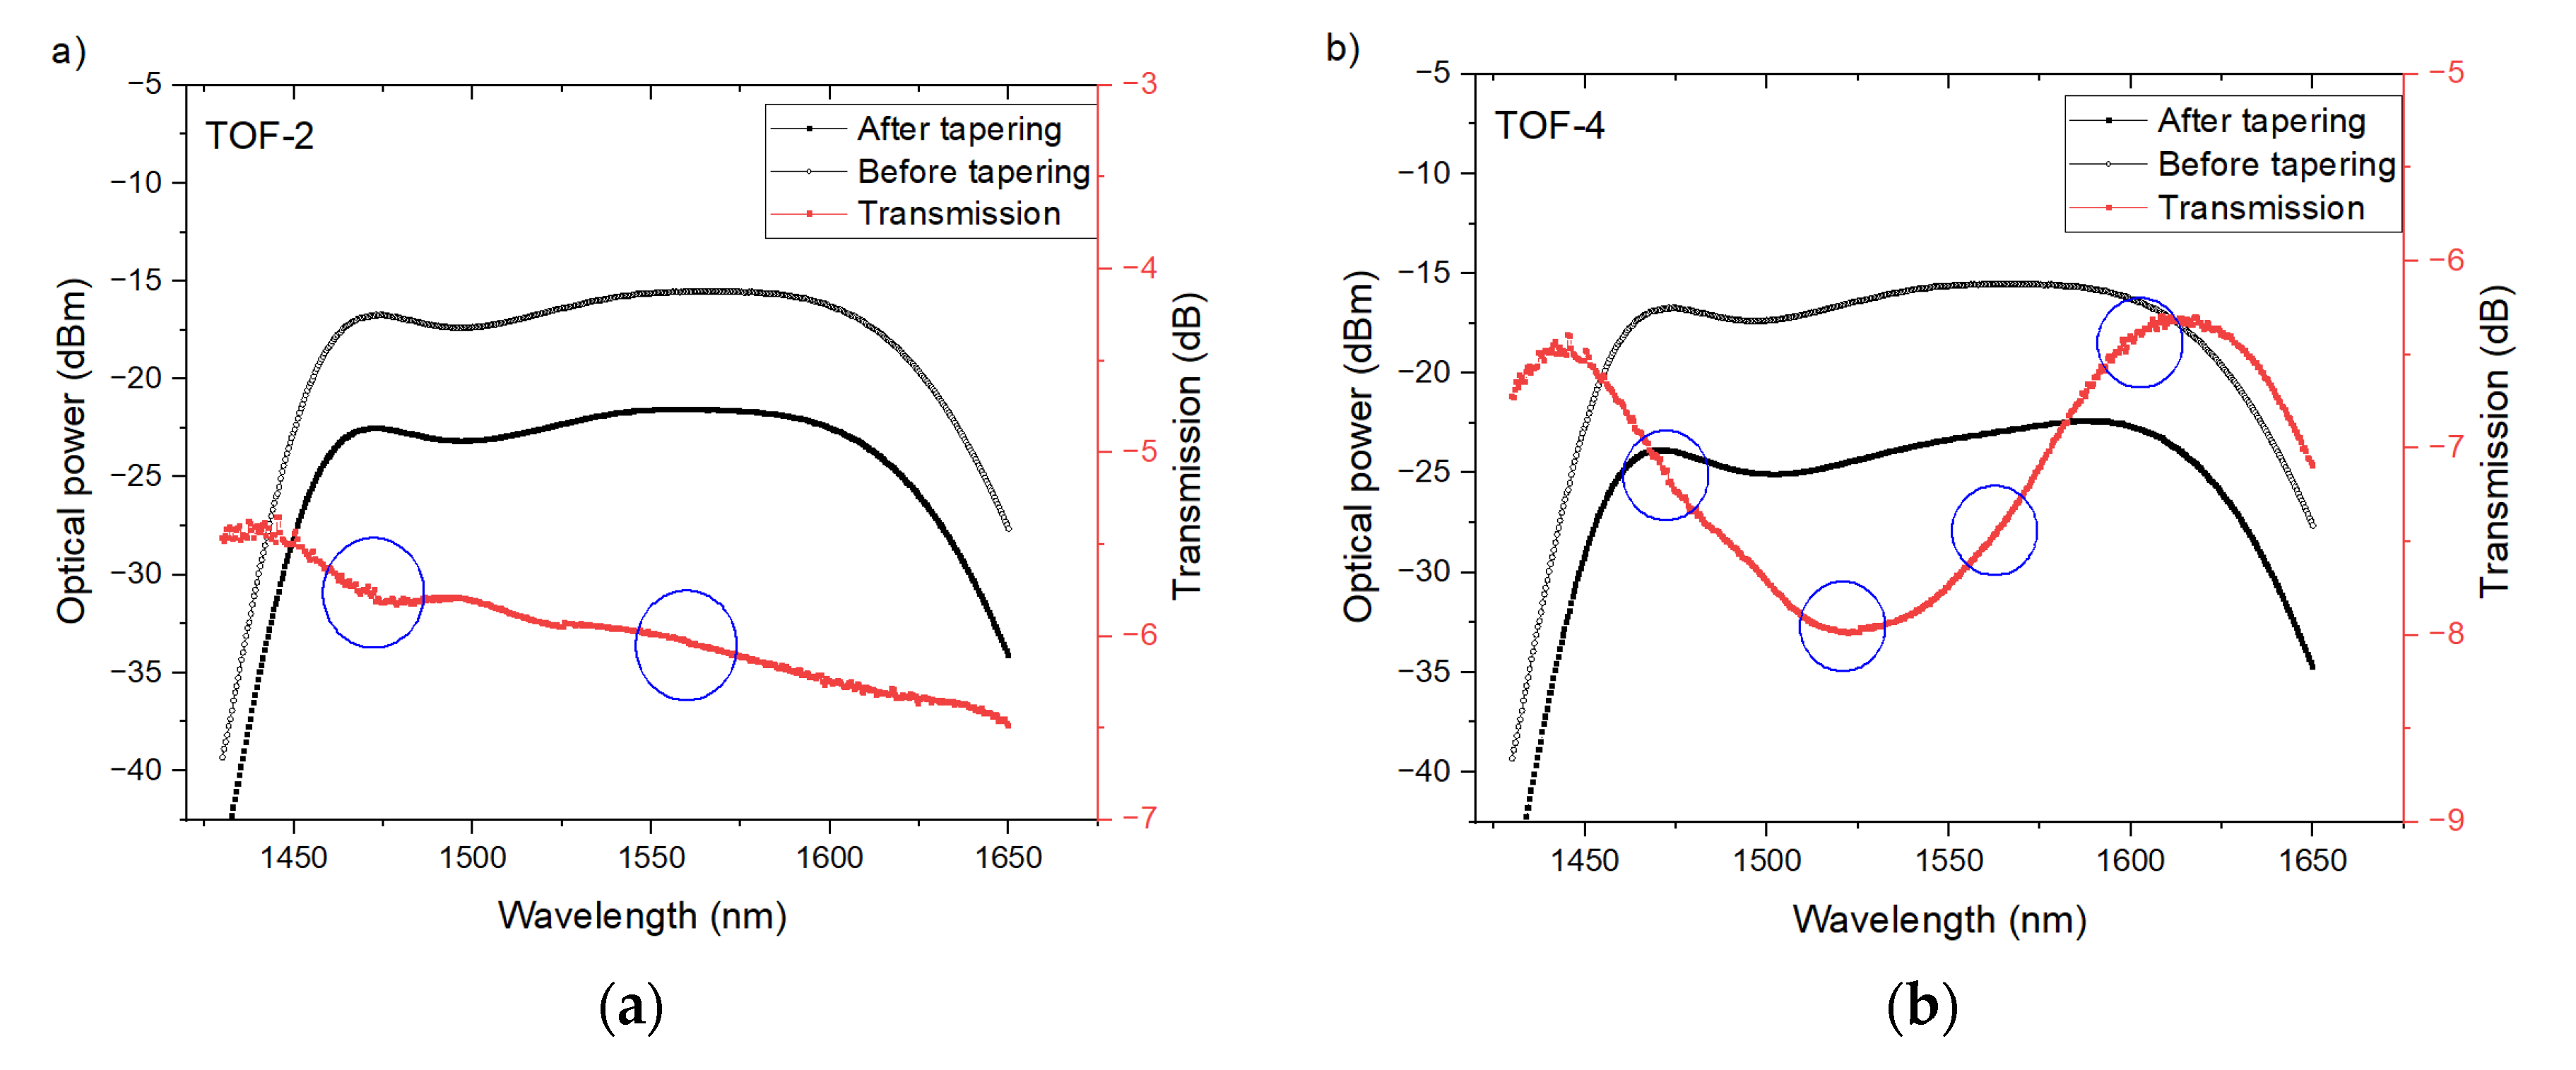
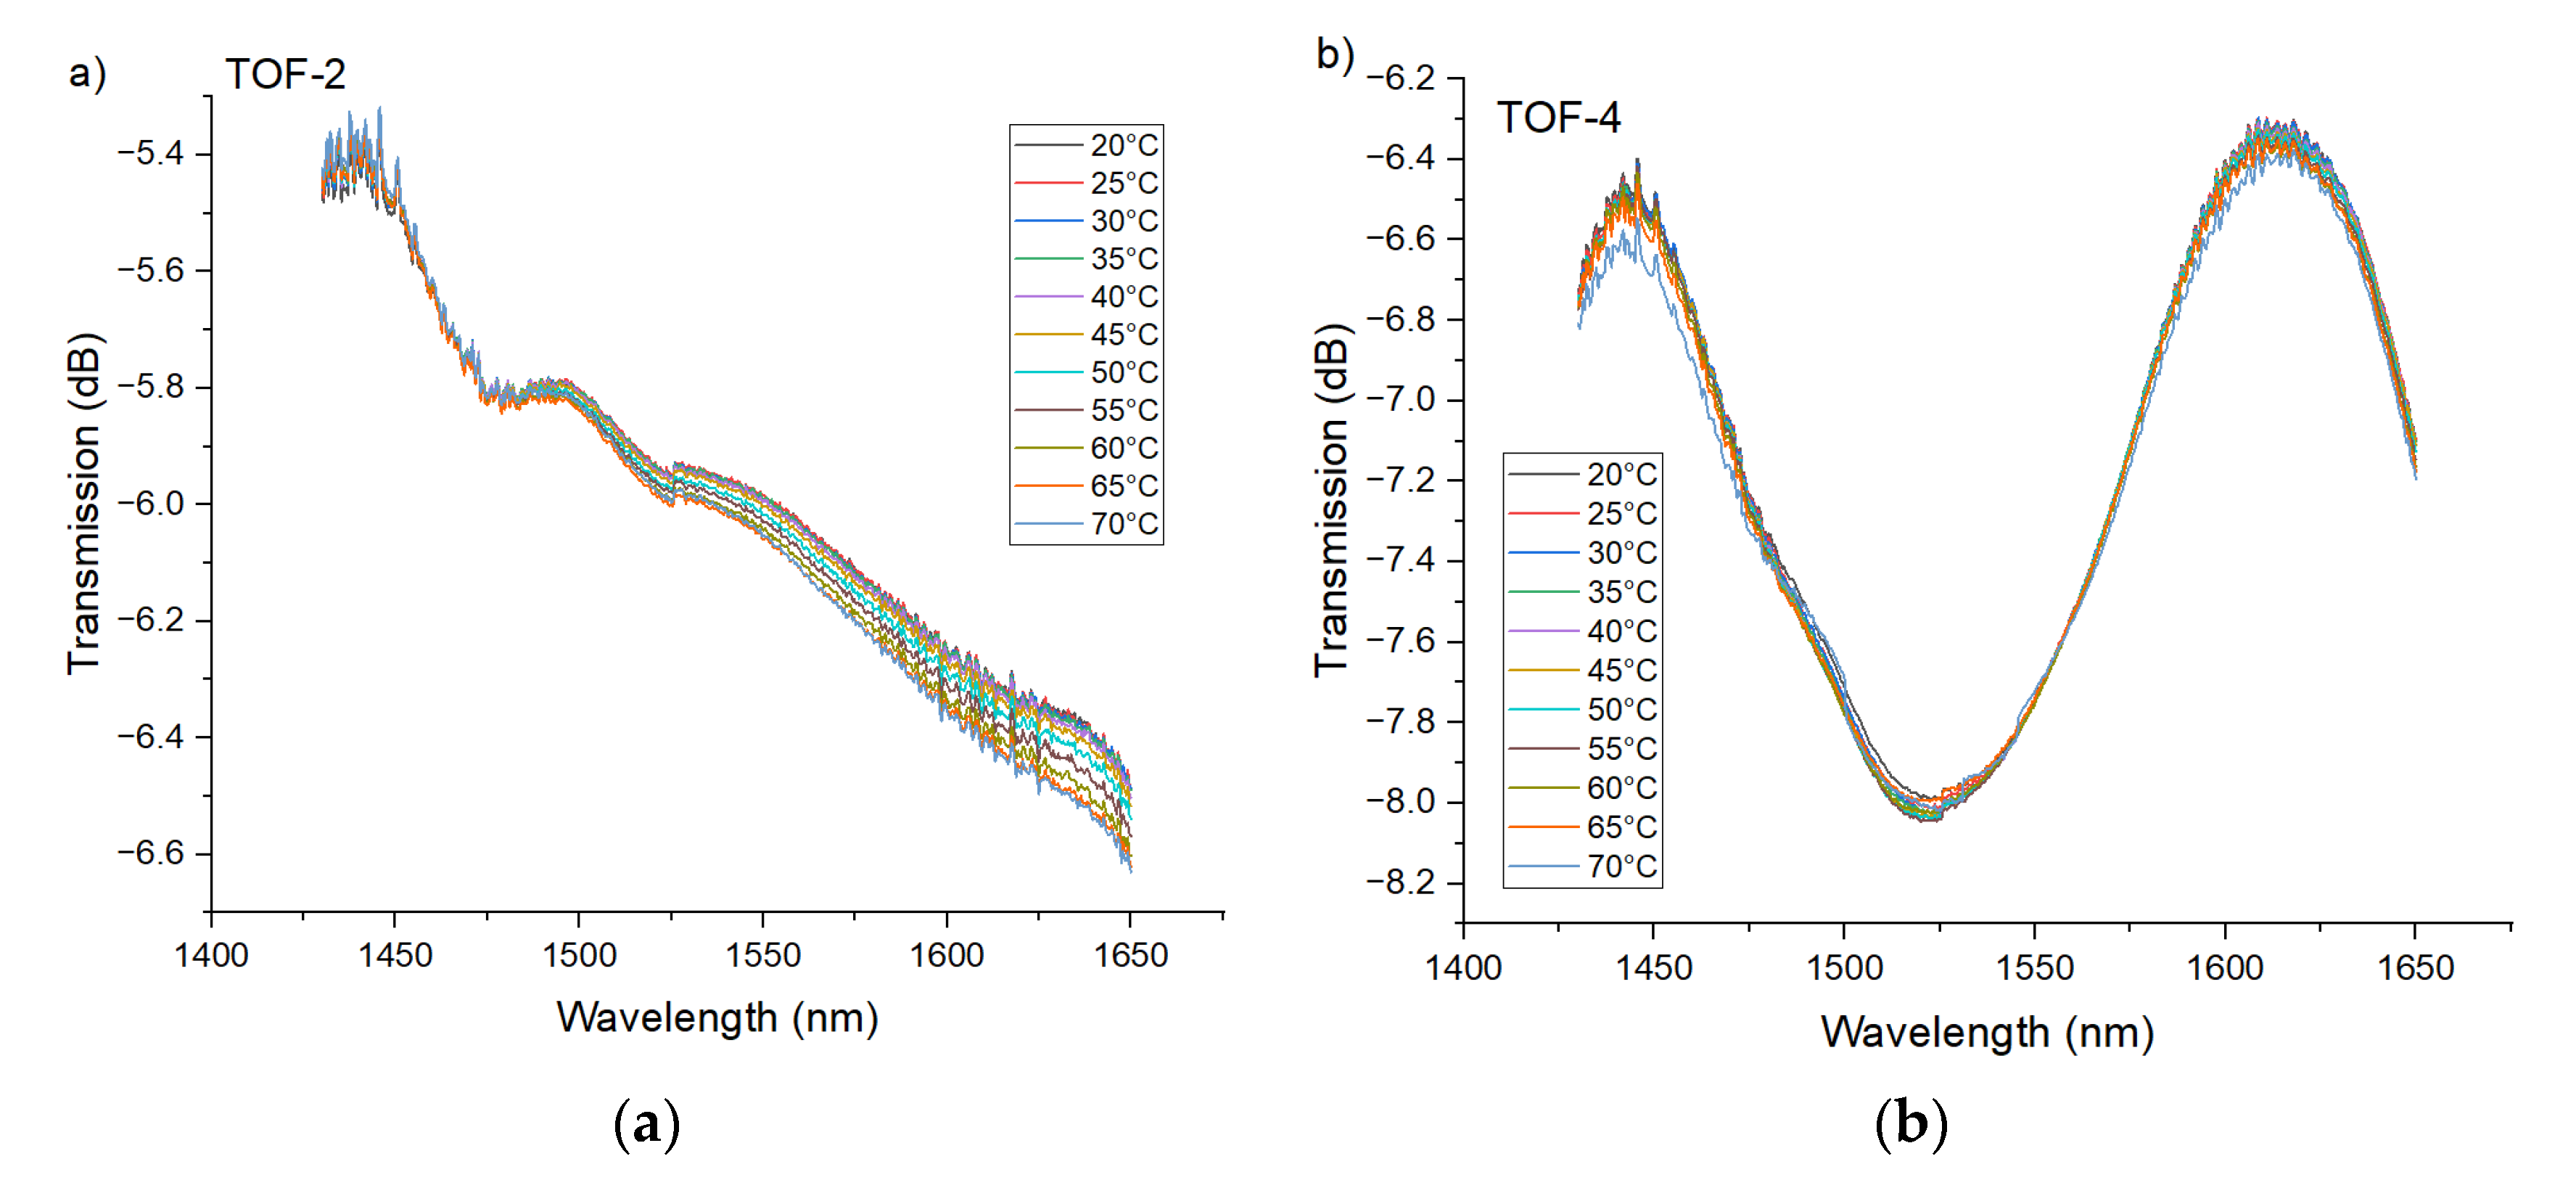
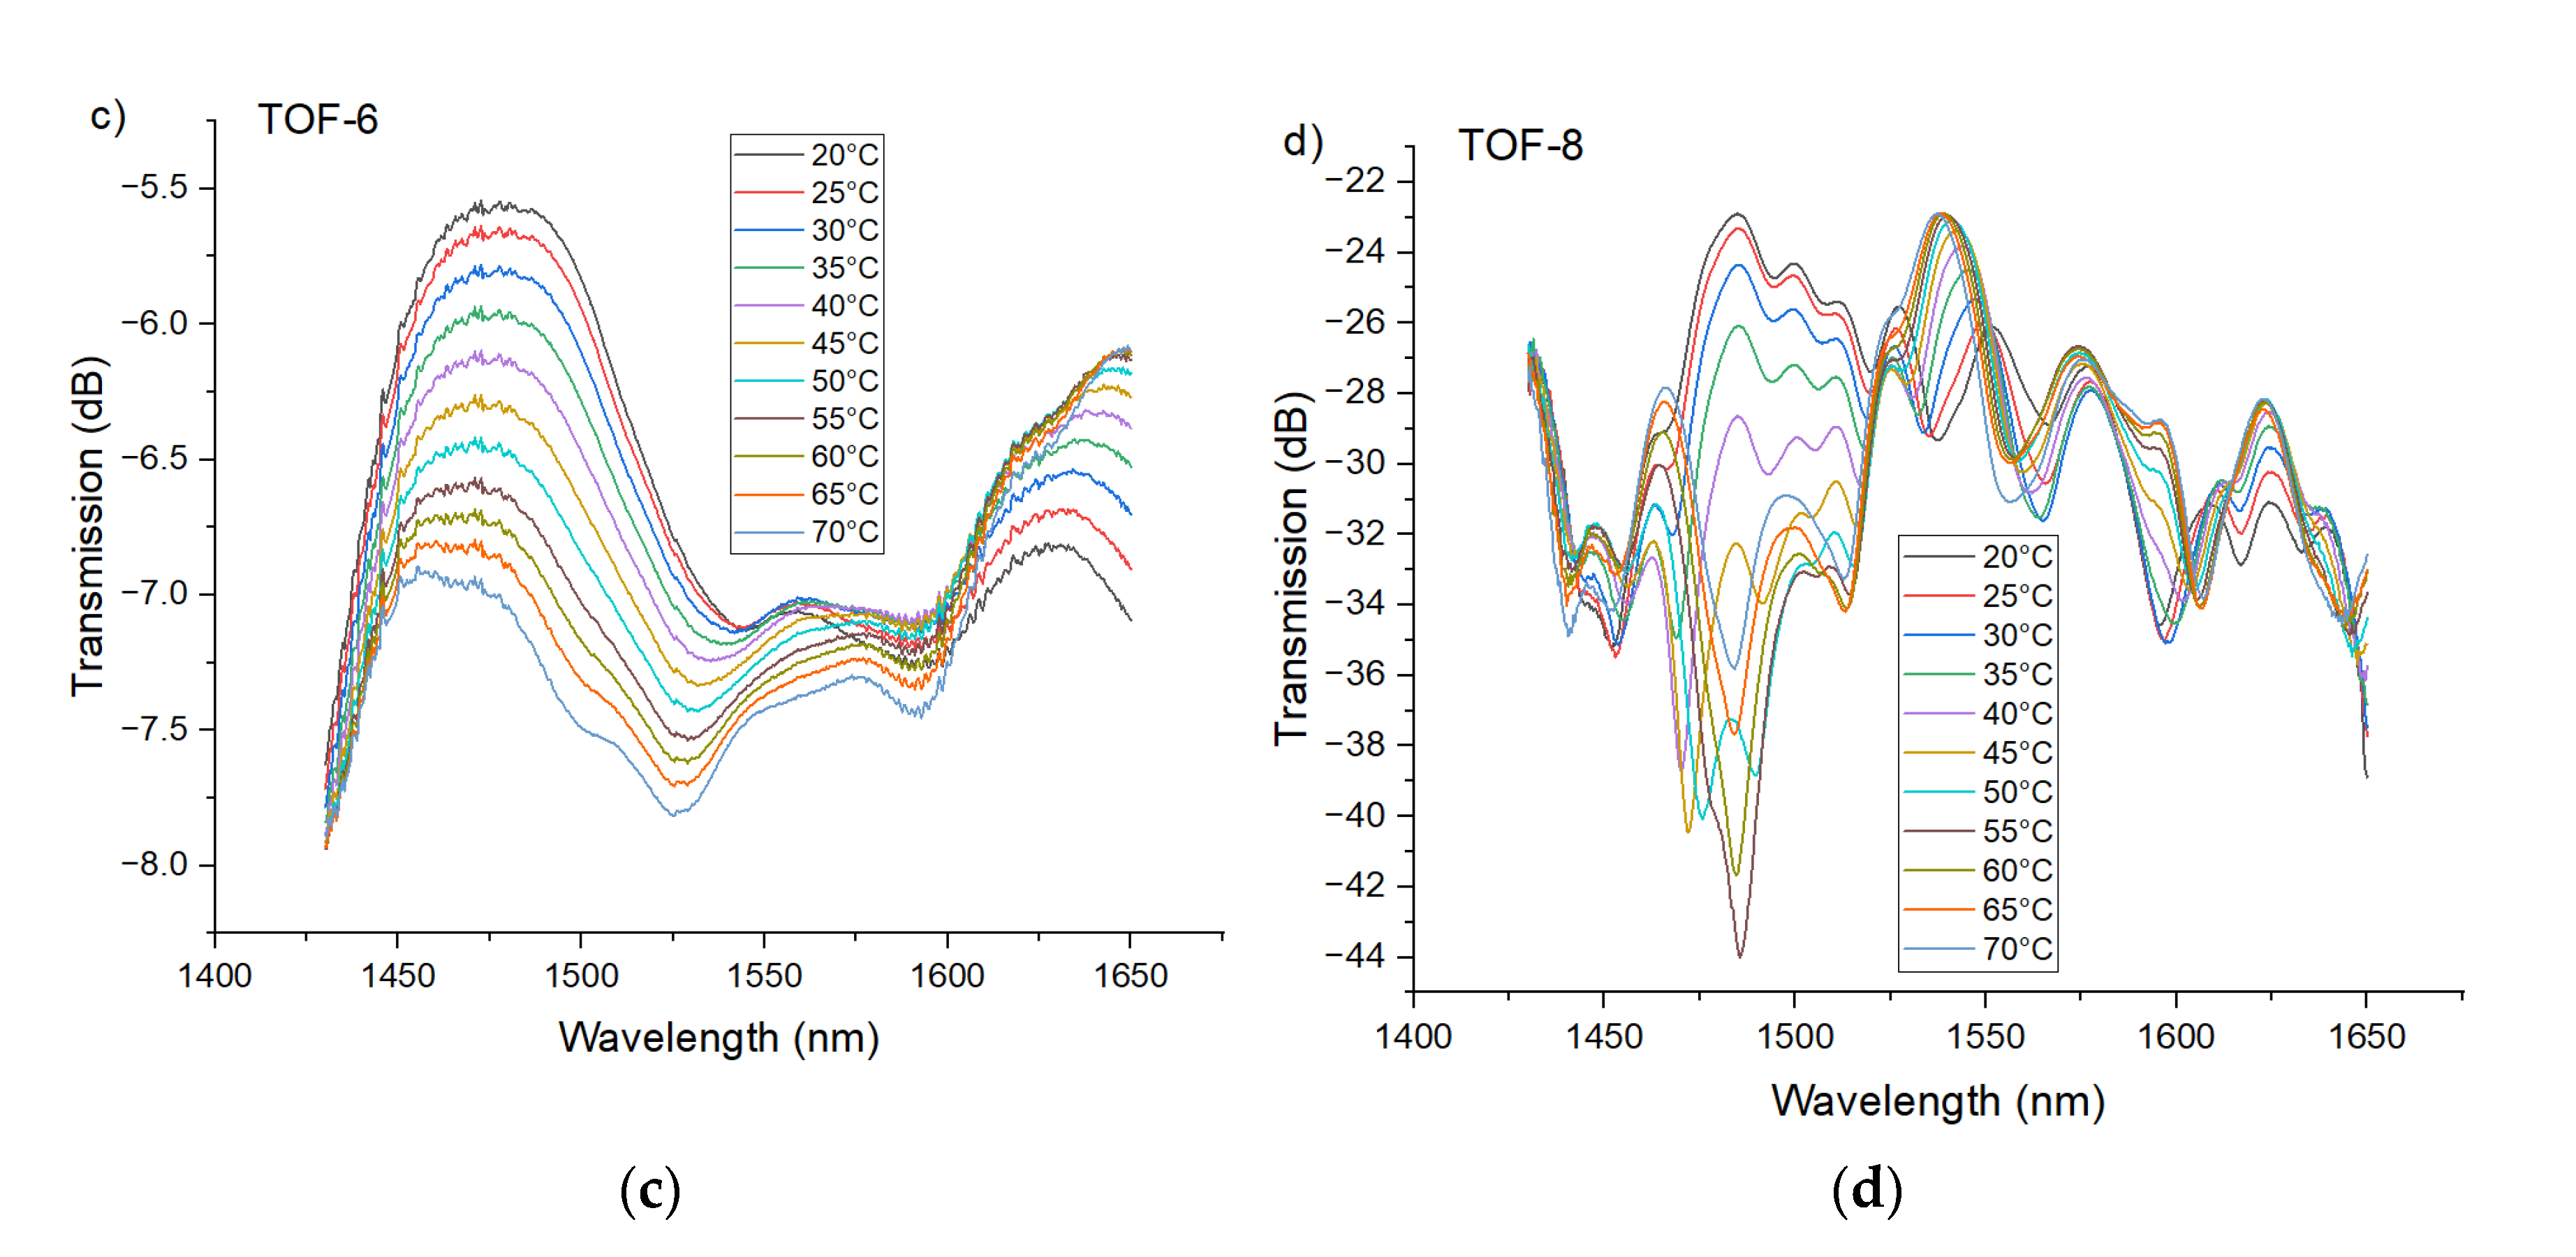
5.1. PTOF with Two and Four Waists

The PTOF structures with two waists were investigated as in the case of the first structure. The transmission dip evolution forced by temperature change is given in Figure 8a. Based on the obtained results shown in Figure 8b, it can be stated that, for PTOF-2 sensors, temperature does not affect the transmission spectra in a clear way. The same situation was recorded for PTOF-4 sensors (Figure 9). This can be explained by the fact that the coupling strength between core and cladding modes depends on the number of tapered regions, because they can be considered as grating patterns. A higher number will enhance the coupling [62]; however, for a low number of tapered regions, the coupling strength will be low. In consequence, the depth of transmission dips in PTOF-2 and PTOF-4 is very shallow and it is extremely hard to measure any transmission dip shift. Moreover, the geometry of the tapered regions, e.g., taper-down and taper-up regions that are too smooth, or sensor lengths that are too short, can explain the weak mode coupling. We plan to investigate the sensor geometry in our further research.

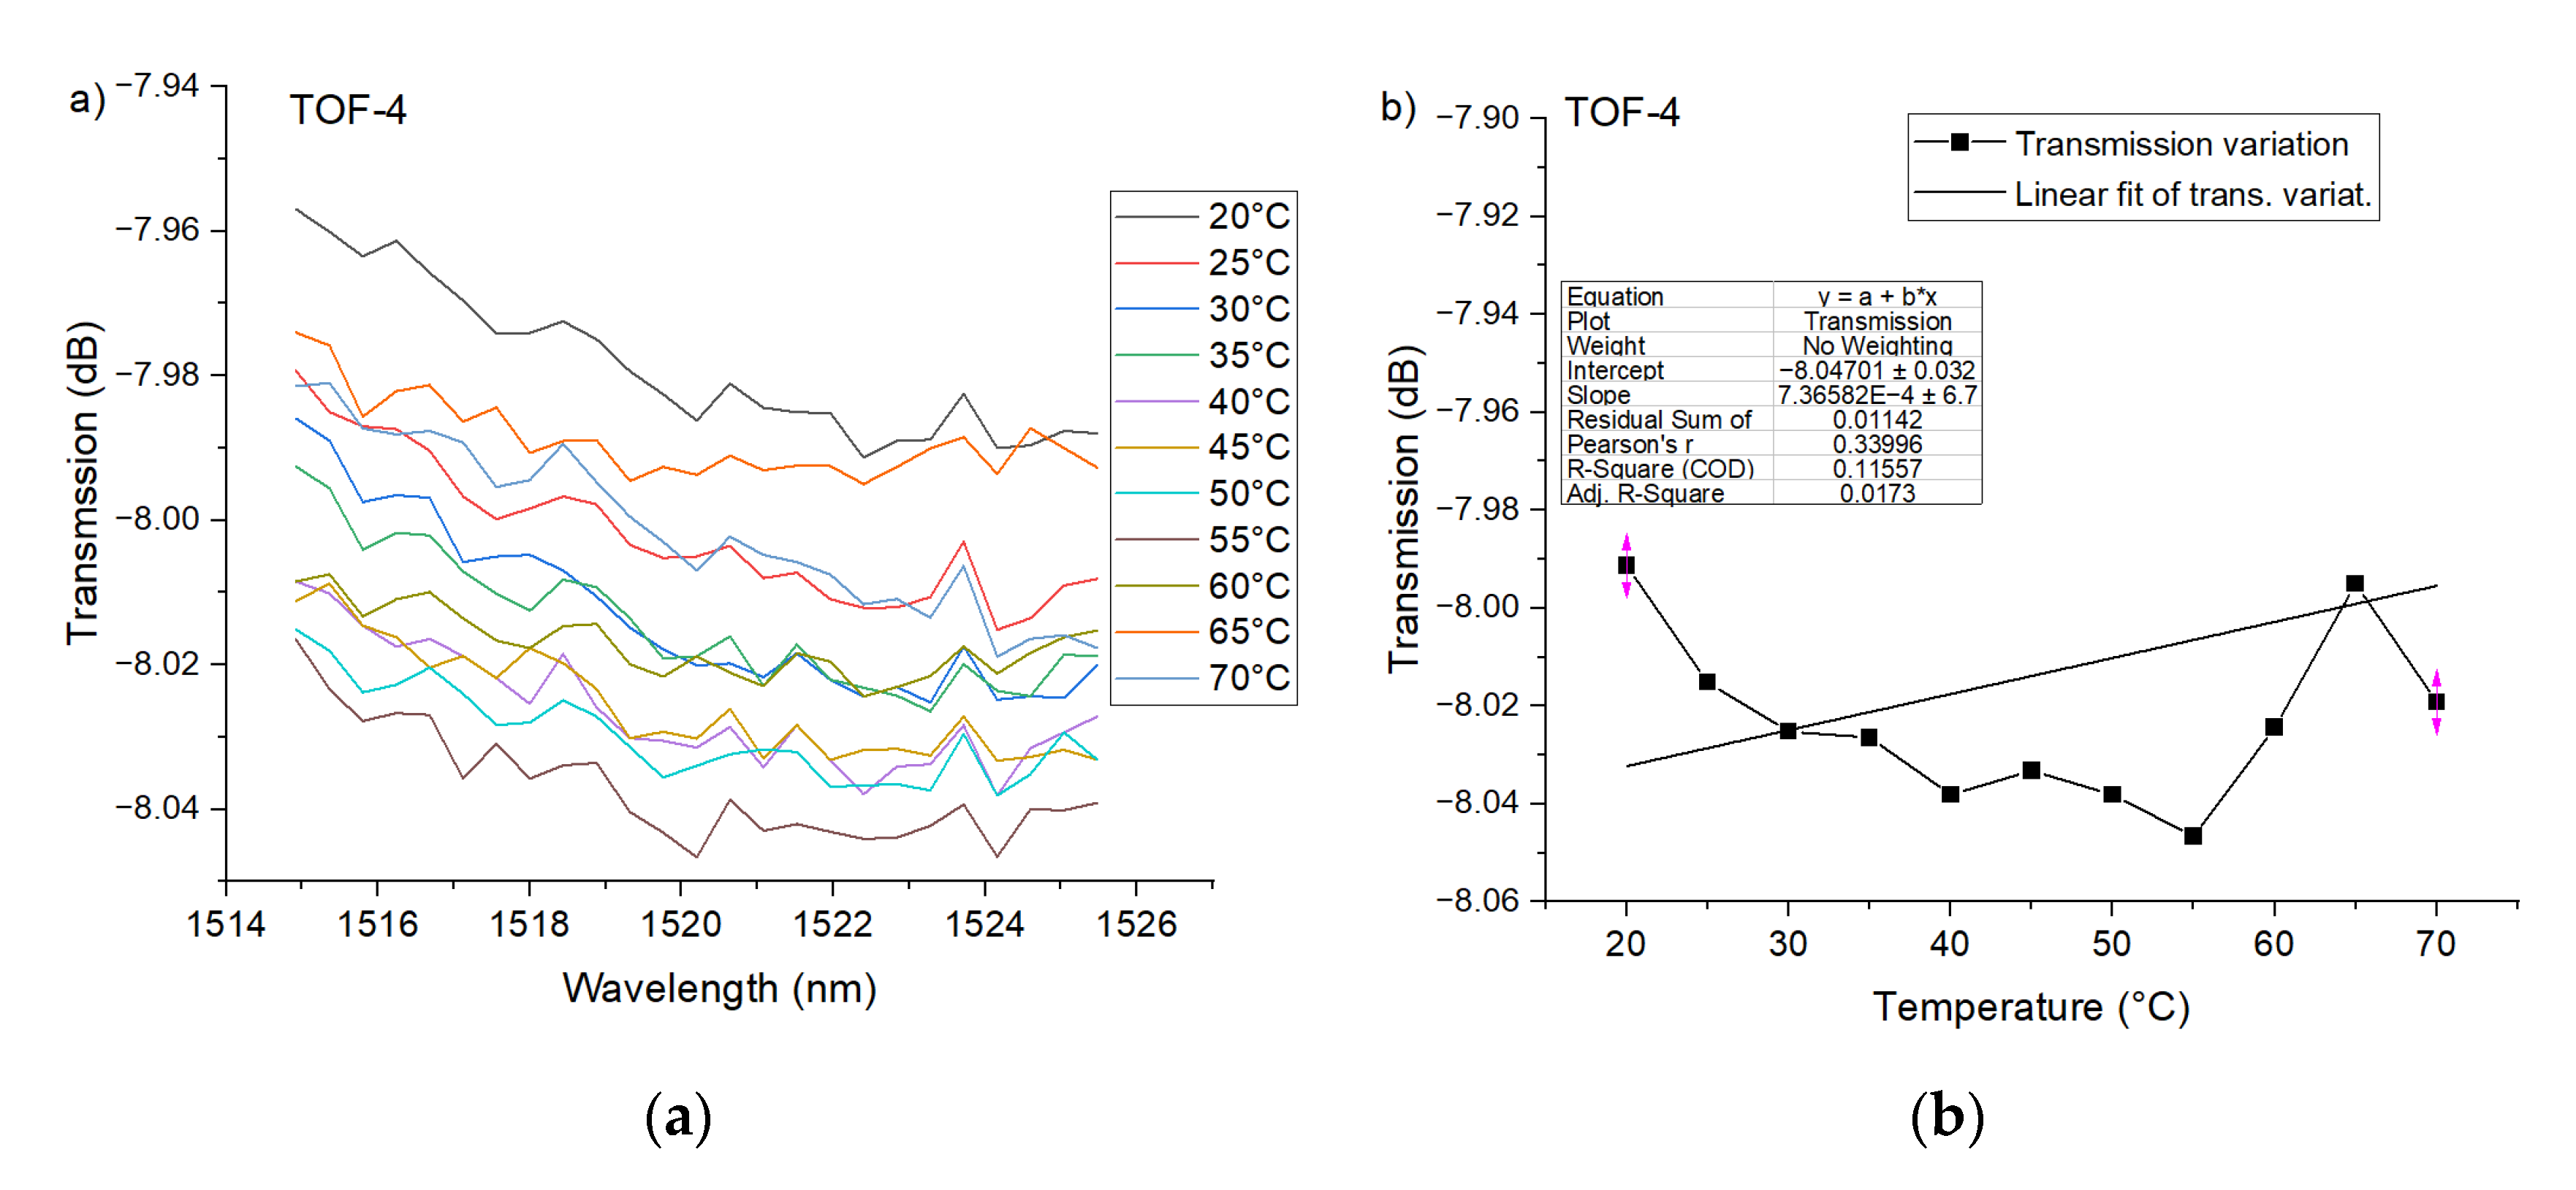
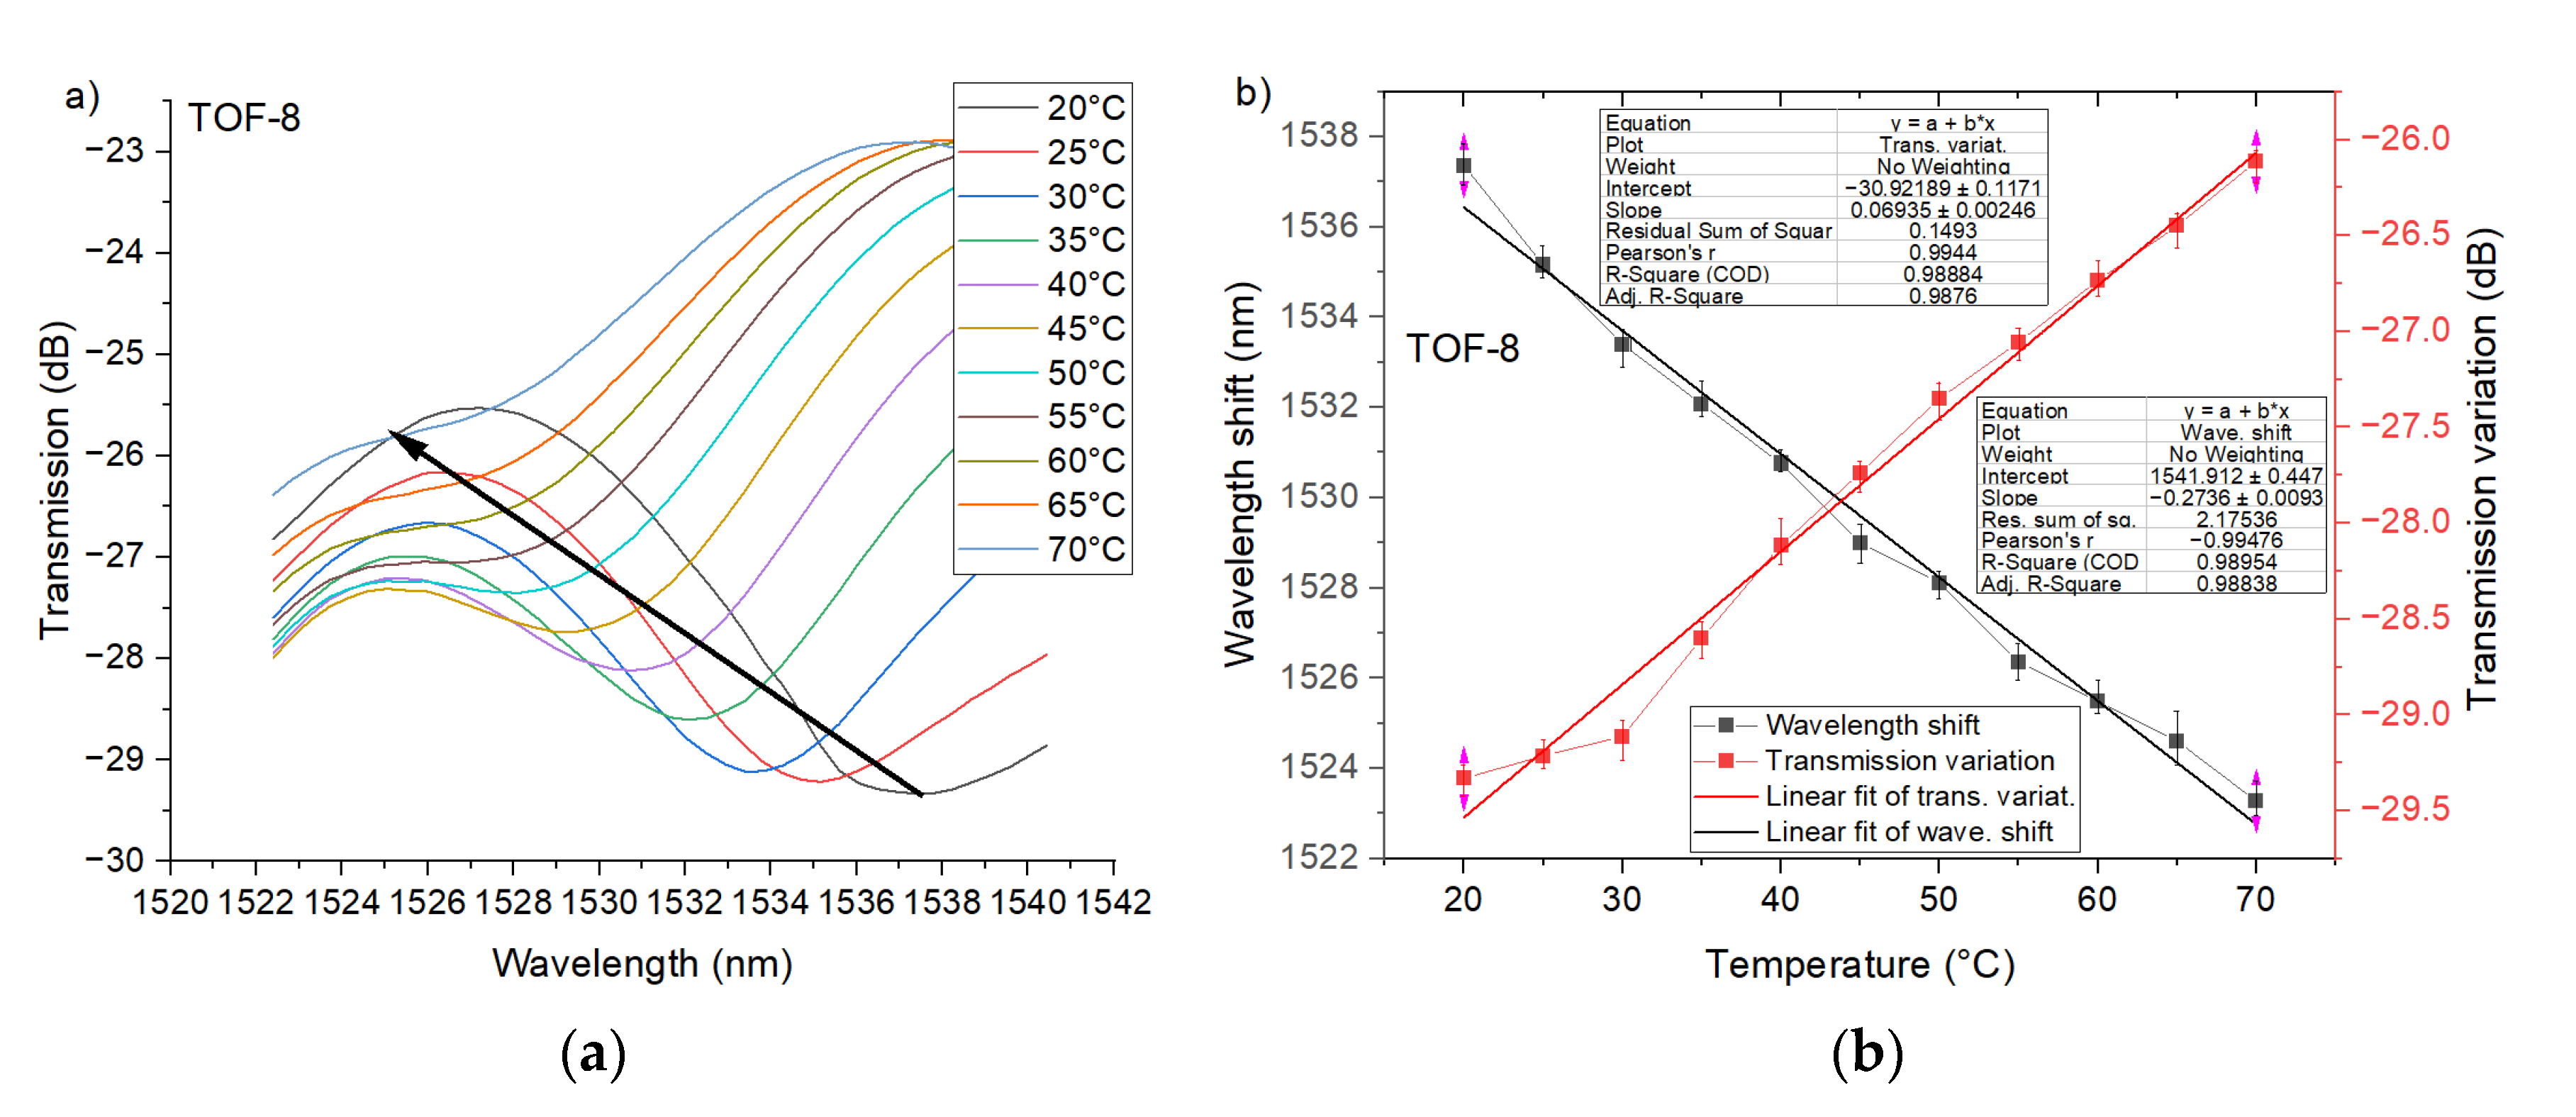
5.2. PTOF with Six and Eight Waists

More valuable results were observed for PTOF-6 sensors (Figure 10). For the first transmission dip there is a good linear relationship (R2 > 0.96) between the transmission variation and temperature, and the sensor resolution reached 0.015 dB/°C. Moreover, the shift of transmission dip was observed and the slope of its linear approximation (R2 > 0.97) was equal to 0.39 nm/°C (Figure 10b). Importantly, PTOF-6 provides high temperature sensitivity for the whole temperature range. Excellent temperature sensitivity was recorded for PTOF-8 sensors. The transmission variation can be defined by a linear function (R2 ≈ 0.99) with a high (about 4.5 times higher than for PTOF-6) resolution of 0.07 dB/°C (Figure 11). With this sensor, the temperature change can be also determined by an investigation of the transmission dip shift. PTOF-8 obtained a resolution of 0.27 nm/°C, which is about 30% lower than that of the PTOF-6 sensor.

5.3. Discussion

The PTOF structures with two and four waists were not recognized as temperature sensors. The number of tapered regions was too few to provide sufficient mode coupling. Therefore, the transmission dips were hardly visible, and their potential change due to temperature variation was not observed. A higher number of tapering regions supported strong mode coupling [62], which resulted in a rise in the depth of transmission dips. Therefore, for PTOF-6 and PTOF-8, the transmission dips were clearly visible. In addition, the larger number of tapered regions, the higher attenuation of the optical signal. In consequence, the number of created waists is limited by the sensitivity of the OSA. For PTOF-6 and PTOF-8, the temperature change affects the transmission shift, in addition to the transmission dip shift. These changes are almost linear in the whole investigated temperature range, which is an excellent feature of the developed sensors.
As previously mentioned, the fiber optic temperature sensors based on MZI can achieve very high sensitivity of ~2–6.8 nm/°C [44,45,46]. However, these sensors have a very complex construction. In Table 4, we compare our sensors to similar constructions. Our PTOF-6 has at least 4.4 times higher sensitivity in comparison to others, and the operating temperature range is similar to the results found in [7,21,38,59]. Because the temperature range is 20–70 °C, the sensors can be utilized to monitor the temperature of telecommunication infrastructure, e.g., in data centers as a support for existing control systems [63,64]. They can be also employed in numerous indoor applications affected by high electromagnetic interference, temperature monitoring of battery packages during fast charging and discharging [65,66], and hazardous locations.

6. Conclusions

In conclusion, we showed the relationship between the geometry of PTOF structures and temperature sensing ability. The geometry of the simplest PTOF-2 and PTOF-4 sensors did not allow any temperature measurements to be made. Only PTOF-6 and PTOF-8, due to their long interferometric distance and sufficient number of tapered regions, enabled temperature sensing.
The experimentally determined transmission dips are consistent with the theoretical calculations for PTOF-6 and PTOF-8 sensors. The maximum transmission resolution was equal to 0.07 dB/°C for the PTOF-8 sensor, and the transmission dip shift was equal to 0.39 nm/°C (PTOF-6) and 0.27 nm/°C (PTOF-8). In our future work we plan to develop PTOFs with one or two tapered regions. Then, we will investigate the influence of the geometry of the tapered region (the slope of the tapered-up and tapered-down regions, in addition to the length and diameter of the waists) on the sensing ability in such structures.

Author Contributions

Conceptualization, B.G.; methodology, B.G. and M.Ł.; validation, B.G. and M.Ł.; formal analysis, B.G.; investigation, M.Ł.; data curation, M.Ł. and B.G.; writing—original draft preparation, B.G.; writing—review and editing, B.G. and M.Ł.; visualization, B.G. and M.Ł. All authors have read and agreed to the published version of the manuscript.

Funding

This research received no external funding.

Conflicts of Interest

The authors declare no conflict of interest. The funders had no role in the design of the study; in the collection, analyses, or interpretation of data; in the writing of the manuscript, or in the decision to publish the results.

References

  1. Mrooz, O.; Kovalski, A.; Pogorzelska, J.; Shpotyuk, O.; Vakiv, M.; Butkiewicz, B.; Maciak, J. Thermoelectrical degradation processes in NTC thermistors for in-rush current protection of electronic circuits. Microelectron. Reliab. 2001, 41, 773–777. [Google Scholar] [CrossRef]
  2. Mulla, R.; Dunnill, C.W. Single material thermocouples from graphite traces: Fabricating extremely simple and low cost thermal sensors. Carbon Trends 2021, 4, 100077. [Google Scholar] [CrossRef]
  3. Kumar, V.; Verma, J.; Maan, A.S.; Akhtar, J. Epitaxial 4H–SiC based Schottky diode temperature sensors in ultra-low current range. Vacuum 2020, 182, 109590. [Google Scholar] [CrossRef]
  4. Kumar, V.; Maan, A.S.; Akhtar, J. Barrier height inhomogeneities induced anomaly in thermal sensitivity of Ni/4H-SiC Schottky diode temperature sensor. J. Vac. Sci. Technol. 2014, 32, 041203. [Google Scholar] [CrossRef]
  5. Aime, L.F.J.; Kissinger, T.; James, S.W.; Chehura, E.; Verzeletti, A.; Tatam, R.P. High sensitivity pressure measurement using optical fibre sensors mounted on a composite diaphragm. Opt. Express 2021, 29, 4105–4123. [Google Scholar] [CrossRef]
  6. Datta, P.; Matias, I.; Aramburu, C.; Bakas, A.; López-Amo, M.; Otón, J.M. Tapered optical-fiber temperature sensor. Microw. Opt. Technol. Lett. 1996, 11, 93–95. [Google Scholar] [CrossRef]
  7. Allsop, T.; Floreani, F.; Jedrzejewski, K.P.; Marques, P.V.S.; Romero, R.; Webb, D.J.; Bennion, I. Spectral Characteristics of Tapered LPG Device as a Sensing Element for Refractive Index and Temperature. J. Lightwave Technol. 2006, 24, 870–878. [Google Scholar] [CrossRef] [Green Version]
  8. Hu, D.J.J.; Lim, J.L.; Jiang, M.; Wang, Y.X.; Luan, F.; Shum, P.P.; Wei, H.F.; Tong, W.J. Long period grating cascaded to photonic crystal fiber modal interferometer for simultaneous measurement of temperature and refractive index. Opt. Lett. 2012, 37, 2283–2285. [Google Scholar]
  9. Guzowski, B.; Lakomski, M.; Cywinski, M. Proximity sensors based on ball-lensed optical fibers. IOP Conf. Ser. Mater. Sci. Eng. 2016, 104, 0120311. [Google Scholar] [CrossRef] [Green Version]
  10. Yang, Y.; Tian, D.; Chen, K.; Zhou, X.; Gong, Z.; Yu, Q. A Fiber-Optic Displacement Sensor Using the Spectral Demodulation Method. J. Lightwave Technol. 2018, 36, 3666–3671. [Google Scholar] [CrossRef]
  11. Wu, J.; Miao, Y.; Song, B.; Lin, W.; Zhang, K.; Zhang, H.; Liu, B.; Yao, J. Simultaneous measurement of displacement and temperature based on thin-core fiber modal interferometer. Opt. Commun. 2015, 340, 136–140. [Google Scholar] [CrossRef]
  12. Guzowski, B.; Lakomski, M. Realization of fiber optic displacement sensors. Opt. Fiber Technol. 2018, 41, 34–39. [Google Scholar] [CrossRef]
  13. Hou, M.; Wang, Y.; Liu, S.; Guo, J.; Li, Z.; Lu, P. Sensitivity-Enhanced Pressure Sensor with Hollow-Core Photonic Crystal Fiber. J. Lightwave Technol. 2014, 32, 4035–4039. [Google Scholar]
  14. Kissinger, T.; Correia, R.; Charrett, T.O.H.; James, S.W.; Tatam, R.P. Fiber Segment Interferometry for Dynamic Strain Measurements. J. Light. Technol. 2016, 34, 4620–4626. [Google Scholar] [CrossRef] [Green Version]
  15. Kolli, V.R.; Basavaprasad; Bahaddur, I.; Talabattula, S. A high sensitive photonic crystal Mach-Zehnder-Interferometer based pressure-sensor. Res. Opt. 2021, 5, 100118. [Google Scholar] [CrossRef]
  16. Bock, W.J.; Chen, J.; Mikulic, P.; Eftimov, T. A Novel Fiber-Optic Tapered Long-Period Grating Sensor for Pressure Monitoring. IEEE Trans. Instrum. Meas. 2007, 56, 1176–1180. [Google Scholar] [CrossRef]
  17. Zawisza, R.; Jaroszewicz, L.R.; Mikulic, P.; Bock, W.J. An interferometric structure with a dual-resonance long period grating for strain sensing. Opto-Electron. Rev. 2018, 26, 325–328. [Google Scholar] [CrossRef]
  18. Eftimov, T.; Janik, M.; Koba, M.; Śmietana, M.; Mikulic, P.; Bock, W.J. Long-period gratings and microcavity in-line Mach Zehnder interferometers as highly sensitive optical fiber platforms for bacteria sensing. Sensors 2020, 20, 3772. [Google Scholar] [CrossRef] [PubMed]
  19. Latifi, H.; Zibaii, M.I.; Hosseini, S.M.; Jorge, P. Nonadiabatic tapered optical fiber for biosensor applications. Photonic Sens. 2012, 2, 340–356. [Google Scholar] [CrossRef]
  20. Zhang, W.; Ni, X.; Wang, J.; Ai, F.; Luo, Y.; Yan, Z.; Liu, D.; Su, Q. Microstructured Optical Fiber Based Distributed Sensor for In Vivo Pressure Detection. J. Lightwave Technol. 2019, 37, 1865–1872. [Google Scholar] [CrossRef]
  21. Ahmed, F.; Jun, M.B.G. Filament-based fabrication and performance analysis of fiber Bragg grating sensors using ultrashort pulse laser. J. Micro. Nano-Manuf. 2014, 2, 021007-1–021007-6. [Google Scholar] [CrossRef]
  22. Ju, S.; Watekar, P.R.; Han, W.-T. Enhanced Sensitivity of the FBG Temperature Sensor Based on the PbO-GeO2-SiO2 Glass Optical Fiber. J. Lightwave Technol. 2010, 28, 2697–2700. [Google Scholar] [CrossRef]
  23. Zhu, S.; Pang, F.; Wang, T. Single-mode tapered optical fiber for temperature sensor based on multimode interference. Opt. Sens. Biophotonics 2011, 8311, 83112B. [Google Scholar]
  24. Bilsel, M.; Navruz, I. Tapered Optical Fiber Sensor for Discrimination of Strain and Temperature. Adv. Electr. Electron. Eng. 2020, 18, 50–56. [Google Scholar] [CrossRef]
  25. Zhou, G.; Zhang, C.; Xie, X.; Wan, Y.; Yao, C.; Liu, J.; Niu, L.; Miao, X.; Zhou, H.; Jiang, X.; et al. A Low-Cost High-Temperature Sensor Based on Long-Period Fiber/Microfiber Gratings by Local Fictive Temperature Modification. J. Chem. 2020, 2020, 1–6. [Google Scholar] [CrossRef]
  26. Chen, L.; Chan, C.C.; Sun, J. High resolution long-period grating temperature sensor. J. Optoelectron. Adv. M 2008, 10, 190–193. [Google Scholar]
  27. Lee, C.E.; Taylor, H.F. Fiber-optic Fabry-Perot Temperature Sensor Using a Low-Coherence Light Source. J. Light. Technol. 1991, 9, 129–134. [Google Scholar] [CrossRef]
  28. Chen, Z.; Xiong, S.; Gao, S.; Zhang, H.; Wan, L.; Huang, X.; Huang, B.; Feng, Y.; Liu, W.; Li, Z. High-Temperature Sensor Based on Fabry-Perot Interferometer in Microfiber Tip. Sensors 2018, 18, 202. [Google Scholar] [CrossRef] [PubMed] [Green Version]
  29. Chen, M.-q.; Zhao, Y.; Xia, F.; Peng, Y.; Tong, R.-j. High sensitivity temperature sensor based on fiber Air-Microbubble Fabry-Perot interferometer with PDMS-filled hollow-core fiber. Sens. Actuators A 2018, 275, 60–66. [Google Scholar] [CrossRef]
  30. Cárdenas-Sevilla, G.A.; Monzón-Hernández, D.; Torres-Gómez, I.; Martínez-Ríos, A. Mechanically induced long-period fiber gratings on tapered fibers. Opt. Commun. 2009, 282, 2823–2826. [Google Scholar] [CrossRef]
  31. Chunxia, Y.; Hui, D.; Wei, D.; Chaowei, X. Weakly-coupled multicore optical fiber taper-based high-temperature sensor. Sens. Actuators A 2018, 280, 139–144. [Google Scholar] [CrossRef]
  32. Yang, S.; Feng, Z.; Jia, X.; Pickrell, G.; Ng, W.; Wang, A.; Zhu, Y. All-Sapphire Miniature Optical Fiber Tip Sensor for High Temperature Measurement. J. Light. Technol. 2019, 38, 1988–1997. [Google Scholar] [CrossRef]
  33. Grobnic, D.; Mihailov, S.J.; Smelser, C.W.; Ding, H. Sapphire Fiber Bragg Grating Sensor Made Using Femtosecond Laser Radiation for Ultrahigh Temperature Applications. IEEE Photon. Technol. Lett. 2018, 16, 2505–2507. [Google Scholar] [CrossRef]
  34. Yang, S.; Hu, D.; Wang, A. Point-by-point fabrication and characterization of sapphire fiber Bragg gratings. Opt. Lett. 2017, 42, 4219–4222. [Google Scholar] [CrossRef]
  35. Habisreuther, T.; Elsmann, T.; Pan, Z.; Graf, A.; Willsch, R.; Schmidt, M.A. Sapphire fiber Bragg gratings for high temperature and dynamic temperature diagnostics. Appl. Therm. Eng. 2015, 91, 860–865. [Google Scholar] [CrossRef]
  36. Mihalov, S.J.; Grobnic, D.; Smelser, C.W. High-temperature multiparameter sensor based on sapphire fiber Bragg gratings. Opt. Lett. 2010, 35, 2810–2812. [Google Scholar] [CrossRef]
  37. Leal-Junior, A.; Frizera-Neto, A.; Marques, C.; Pontes, M.J. A polymer optical fiber temperature sensor based on material features. Sensors 2018, 18, 301. [Google Scholar] [CrossRef] [PubMed] [Green Version]
  38. Fu, X.; Zhang, Y.; Wang, Y.; Fu, G.; Jin, W.; Bi, W. A temperature sensor based on tapered few mode fiber long-period grating induced by CO2 laser and fusion tapering. Opt. Laser Technol. 2020, 121, 105825. [Google Scholar] [CrossRef]
  39. Wei, T.; Lan, X.; Xiao, H. Fiber Inline Core–Cladding-Mode Mach–Zehnder Interferometer Fabricated by Two-Point CO2 Laser Irradiations. IEEE Photon. Technol. Lett. 2009, 21, 669–671. [Google Scholar]
  40. Liu, W.; Wu, X.; Zhang, G.; Li, S.; Zuo, C.; Fang, S.; Yu, B. Refractive index and temperature sensor based on Mach-Zehnder interferometer with thin fibers. Opt. Fiber Technol. 2020, 54, 102101. [Google Scholar] [CrossRef]
  41. Kowal, D.; Urbanczyk, W.; Mergo, P. Twin-Core Fiber-Based Mach Zehnder Interferometer for Simultaneous Measurement of Strain and Temperature. Sensors 2018, 18, 95. [Google Scholar] [CrossRef] [Green Version]
  42. Zhang, H.; Gao, S.; Luo, Y.; Chen, Z.; Xiong, S.; Wan, L.; Huang, X.; Huang, B.; Feng, Y.; He, M.; et al. Ultrasensitive Mach-Zehnder Interferometric Temperature Sensor Based on Liquid-Filled D-Shaped Fiber Cavity. Sensors 2018, 18, 1239. [Google Scholar] [CrossRef] [PubMed] [Green Version]
  43. Zhao, N.; Lin, Q.; Jiang, Z.; Yao, K.; Tian, B.; Fang, X.; Shi, P.; Zhang, Z. High Temperature High Sensitivity Multipoint Sensing System Based on Three Cascade Mach–Zehnder Interferometers. Sensors 2018, 18, 2688. [Google Scholar] [CrossRef] [Green Version]
  44. Marrujo-García, S.; Hernández-Romano, I.; May-Arrioja, D.A.; Minkovich, V.P.; Torres-Cisneros, M. In-Line Mach–Zehnder Interferometers Based on a Capillary Hollow-Core Fiber Using Vernier Effect for a Highly Sensitive Temperature Sensor. Sensors 2021, 21, 5471. [Google Scholar] [CrossRef] [PubMed]
  45. Su, H.; Zhao, C.; Song, X.; Kong, F.; Zhang, Z.; Liu, C. High-sensitivity optical fiber temperature sensor with cascaded configuration of MZI and FPI based on Vernier effect. Opt. Fiber Technol. 2021, 67, 102751. [Google Scholar] [CrossRef]
  46. Zhao, C.; Qiu, H.; Chen, H.; Hu, X.; Yu, A.; Lian, Z.; Li, J.; Qu, H. In-fiber Mach-Zehnder temperature sensor using silicone-oil-filled dual core fiber. Sens. Actuators A 2021, 323, 112644. [Google Scholar] [CrossRef]
  47. Ahsani, V.; Ahmed, F.; Jun, M.B.G.; Bradley, C. Tapered Fiber-Optic Mach-Zehnder Interferometer for Ultra-High Sensitivity Measurement of Refractive Index. Sensors 2019, 19, 1652. [Google Scholar] [CrossRef] [Green Version]
  48. Wang, Q.; Wang, B.-T.; Kong, L.-X.; Zhao, T. Comparative Analyses of Bi-Tapered Fiber Mach–Zehnder Interferometer for Refractive Index Sensing. IEEE Trans. Instrum. Meas. 2017, 66, 2483–2489. [Google Scholar] [CrossRef]
  49. Lu, P.; Men, L.; Sooley, K.; Chen, Q. Tapered fiber Mach–Zehnder interferometer for simultaneous measurement of refractive index and temperature. Appl. Phys. Lett. 2009, 94, 131110. [Google Scholar] [CrossRef] [Green Version]
  50. Tian, Z.; Yam, S.S.-H. In-Line Abrupt Taper Optical Fiber Mach–Zehnder Interferometric Strain Sensor. IEEE Photon. Technol. Lett. 2009, 21, 161–163. [Google Scholar] [CrossRef]
  51. Yue, X.; Chen, H.; Qu, H.; Min, R.; Woyessa, G.; Bang, O.; Hu, X. Polycarbonate mPOF-Based Mach–Zehnder Interferometer for Temperature and Strain Measurement. Sensors 2020, 20, 6643. [Google Scholar] [CrossRef] [PubMed]
  52. Lakomski, M.; Guzowski, B.; Wozniak, A. Fabrication of ultra-long tapered optical fibers. Microelectron. Eng. 2020, 221, 111193. [Google Scholar] [CrossRef]
  53. Yadav, T.K.; Narayanaswamy, R.; Bakar, M.H.A.; Kamil, Y.M.; Mahdi, M.A. Single mode tapered fiber-optic interferometer based refractive index sensor and its application to protein sensing. Opt. Express 2014, 22, 22802–22807. [Google Scholar] [CrossRef] [PubMed]
  54. Xiong, M.; Gong, H.; Wang, Z.; Zhao, C.; Dong, X. Simultaneous Refractive index and Temperature Measurement based on Mach-Zehnder Interferometer Concatenating Two Bi-tapers and A Long-Period Grating. IEEE Sens. J. 2016, 16, 4295–4299. [Google Scholar] [CrossRef]
  55. Miao, Y.; He, Y.; Ma, X.; Zhang, H.; Song, B.; Yang, X.; Xue, L.; Liu, B.; Yao, J. Low-Temperature Cross-Sensitivity Refractive Index Sensor Based on Single-Mode Fiber with Periodically Modulated Taper. IEEE Sens. J. 2016, 16, 2442–2446. [Google Scholar] [CrossRef]
  56. Tian, Z.; Yam, S.S.-H.; Barnes, J.; Bock, W.J.; Greig, P.; Fraser, J.M.; Loock, H.P.; Oleschuk, R.D. Refractive Index Sensing with Mach–Zehnder Interferometer Based on Concatenating Two Single-Mode Fiber Tapers. IEEE Photon. Technol. Lett. 2008, 20, 626–628. [Google Scholar] [CrossRef]
  57. Nguyen, L.V.; Hwang, D.; Moon, S.; Moon, D.S.; Chung, Y. High temperature fiber sensor with high sensitivity based on core diameter mismatch. Opt. Express 2008, 16, 11369–11375. [Google Scholar] [CrossRef]
  58. Kim, Y.-J.; Paek, U.-C.; Lee, B.H. Measurement of refractive-index variation with temperature by use of long-period fiber gratings. Opt. Lett. 2002, 27, 1297–1299. [Google Scholar] [CrossRef] [PubMed]
  59. Raji, Y.M.; Lin, H.S.; Ibrahim, S.A.; Mokhtar, M.R.; Yusoff, Z. Intensity-modulated abrupt tapered Fiber Mach-Zehnder Interferometer for the simultaneous sensing of temperature and curvature. Opt. Laser Technol. 2016, 86, 8–13. [Google Scholar] [CrossRef] [Green Version]
  60. Yang, N.; Qiu, Q.; Su, J.; Shi, S.-j. Research on the temperature characteristics of optical fiber refractive index. Optik 2014, 125, 5813–5815. [Google Scholar] [CrossRef]
  61. Gu, B.; Yin, M.; Zhang, A.P.; Qian, J.; He, S. Low-cost high-performance fiber-optic pH sensor based on thin-core fiber modal interferometer. Opt. Exp. 2009, 17, 22296–22302. [Google Scholar] [CrossRef] [PubMed]
  62. Yoon, M.; Park, S.; Han, Y. Simultaneous Measurement of Strain and Temperature by Using a Micro-Tapered Fiber Grating. J. Lightwave Technol. 2012, 30, 1156–1160. [Google Scholar] [CrossRef]
  63. Guzowski, B.; Gozdur, R.; Lakomski, M. WDM power supply for identification system of fibre optic connectors. Metrol. Meas. Syst. 2018, 25, 235–244. [Google Scholar]
  64. Guzowski, B.; Gozdur, R.; Lakomski, M.; Bernacki, L. RFID monitoring system of fiber optic connectors. Circuit World 2017, 43, 32–37. [Google Scholar] [CrossRef]
  65. Pigłowska, M.; Kurc, B.; Galiński, M.; Fuć, P.; Kamińska, M.; Szymlet, N.; Daszkiewicz, P. Challenges for Safe Electrolytes Applied in Lithium-Ion Cells—A Review. Materials 2021, 14, 6783. [Google Scholar] [CrossRef] [PubMed]
  66. Gozdur, R.; Guzowski, B.; Dimitrova, Z.; Noury, A.; Mitukiewicz, G.; Batory, D. An energy balance evaluation in lithium-ion battery module under high temperature operation. Energy Convers. Manag. 2021, 227, 113565. [Google Scholar] [CrossRef]
  67. Jasim, A.A.; Harun, S.W.; Arof, H.; Ahmad, H. Inline Microfiber Mach–Zehnder Interferometer for High Temperature Sensing. IEEE Sens. J. 2013, 13, 626–628. [Google Scholar] [CrossRef]
Figure 1. Construction of the PTOF.
Sensors 21 08358 g001
Figure 2. The PTOF structure placed between two electrodes in the fusion splicer.
Sensors 21 08358 g002
Figure 3. The PTOF with eight waists.
Sensors 21 08358 g003
Figure 4. The PTOF with two (a), four (b), six (c), and eight (d) tapered regions.
Sensors 21 08358 g004
Figure 5. Block diagram of the test bench (a) and measurement setup (b).
Sensors 21 08358 g005
Figure 6. Spectral and transmission characteristics of investigated PTOFs with two (a), four (b), six (c), and eight (d) waists.
Sensors 21 08358 g006aSensors 21 08358 g006b
Figure 7. Influence of temperature on transmission characteristics of the PTOF structures with two (a), four (b), six (c), and eight (d) waists.
Sensors 21 08358 g007aSensors 21 08358 g007b
Figure 8. Experimental transmission spectra of the PTOF structure with two waists for the heating process (a), and transmission variation as a function of Tchamber for λ = 1475 nm (b).
Sensors 21 08358 g008
Figure 9. Experimental transmission spectra of the PTOF structure with four waists for the heating process (a), and transmission variation as a function of Tchamber for λ = 1520 nm (b).
Sensors 21 08358 g009
Figure 10. Experimental transmission spectra of PTOF structure with six waists for the heating process (a), and transmission variation and wavelength shift as a function of Tchamber for λ = 1545 nm (b).
Sensors 21 08358 g010
Figure 11. Experimental transmission spectra of the PTOF structure with eight waists for the heating process (a), and transmission variation and wavelength shift as a function of Tchamber for λ = 1538 nm (b).
Sensors 21 08358 g011
Table 1. Parameters of the fusion splicer.
Electric Arc Power P (mW)Arc Duration t (s)Holder Travel s (µm)Speed of Holders v (µm/s)
201.5500122
Table 2. Parameters of the PTOF structures.
NameWaist No.Avg. Waist Diameter d (µm)Min/Max Waist Diameter d (µm)Avg. Waist Period (µm)
PTOF-22 44.341.4/47.3620
PTOF-44 48.946.4/51.6605
PTOF-66 49.745.3/53.0533
PTOF-88 51.149.0/53.0581
Table 3. FSR parameters’ calculation.
Nameneff L (mm)λdip (nm)Theoretical FSR (nm)Experimental FSR (nm)
PTOF-20.021.214758785
PTOF-42.414754549
PTOF-63.215453844
PTOF-84.615242422
Table 4. Comparison of sensing performance of existing sensors.
TypeTemperature RangeSensitivityRef.
FBG on microfiber22.5–95 °C31.32 pm/°C[21]
Tapered LPG0–60 °C87 pm/°C[7]
Weakly coupled multicore fiber taper0–1000 °C36.8 pm/°C[31]
Tapered few modes fiber with LPG30–90 °C39.3 pm/°C[38]
Tapered microfiber50–800 °C13.4 pm/°C[67]
Abrupt tapered single-mode fiber15–50 °C0.0829 dBm/°C[59]
PTOF SMF 20–70 °C390 pm/°C and
270 pm/°C
This study
Publisher’s Note: MDPI stays neutral with regard to jurisdictional claims in published maps and institutional affiliations.

