Article

Application of Excimer Lamp in Quantitative Detection of SF6 Decomposition Component SO2

1
Institute of Electrical Engineering, Chinese Academy of Sciences, Beijing 100190, China
2
University of Chinese Academy of Sciences, Beijing 100049, China
3
Electrical Power Research Institute, Anhui Electrical Power Co., Ltd., State Grid, Hefei 230601, China
*
Author to whom correspondence should be addressed.
Sensors 2021, 21(24), 8165; https://doi.org/10.3390/s21248165
Submission received: 14 October 2021 / Revised: 29 November 2021 / Accepted: 2 December 2021 / Published: 7 December 2021
(This article belongs to the Special Issue State-of-the-Art Optical Sensors Technology in China)

Abstract

:
Accurate quantitative detection for trace gas has long been the center of failure diagnosis for gas-insulated equipment. An absorption spectroscopy-based detection system was developed for trace SF6 decomposition SO2 detection in this paper. In order to reduce interference from other decomposition, ultraviolet spectrum of SO2 was selected for detection. Firstly, an excimer lamp was developed in this paper as the excitation of the absorption spectroscopy compared with regular light sources with electrodes, such as electrodeless lamps that are more suitable for long-term monitoring. Then, based on the developed excimer lamp, a detection system for trace SO2 was established. Next, a proper absorption peak was selected by calculating spectral derivative for further analysis. Experimental results indicated that good linearity existed between the absorbance and concentration of SO2 at the chosen absorption peak. Moreover, the detection limit of the proposed detection system could reach the level of 10−7. The results of this paper could serve as a guide for the application of excimer lamp in online monitoring for SF6-insulated equipment.

1. Introduction

Sulfur hexafluoride (SF6) possesses great insulation capabilities and arc extinction ability. Since 1960s, SF6 has been applied in many gas-insulated equipment such as transformer, inductor, GIS (gas-insulated switchgear), GIL (gas-insulated transmission line) and so on [1]. With the development and popularization of SF6-insulated equipment, the insulation state detection for it has long been the center of research field. Based on current studies, various detection techniques have been presented. For instance, ultra-high frequency (UHF) [2], frequency-domain dielectric spectroscopy (FDS) [3], ultrasonic method [4] and so on were proposed to detect relevant electrical parameters. However, such detection techniques were vulnerable to electromagnetic interference or vibration noise. Moreover, such invasive detections could impair the intact structure of SF6-insulated equipment and result in leakage. Therefore, it is necessary to find a non-electrical method to properly evaluate the insulation state of SF6-insulated equipment.
Decomposition gas analysis is one of the prevailing non-electrical methods for estimating the insulation state of electrical equipment. Even though SF6 itself is a colorless, odorless and innocuous inert gas, its decompositions under discharge are poisonous and corrosive. Specifically speaking, under the condition of discharge, SF6 will decompose and generate a series of sulfide. Furthermore, some of the sulfide will react with micro water and oxygen in the equipment to generate H2S, SO2, SOF2, SO2F2 and so on [5]. To this day, plenty of techniques have been developed to detect trace SF6 and its decompositions [6,7]. Moreover, some forms of commercial products are also available [8,9].
Meanwhile, plenty of research studies have verified that among all the decomposition of SF6, the concentration of SO2 strongly correlates with the discharge level inside the equipment [10]. The larger the concentration, the higher the discharge level. In that case, detecting the concentration of the decomposition of SF6, especially SO2, has become a widely acceptable method for monitoring the insulation state of SF6-insulted equipment. Among all the detection method for SO2, optical techniques have become more and more prevalent due to its short response time and high accuracy.
Nowadays, common optical techniques for trace SO2 detection include differential optical absorption spectroscopy (DOAS) [11], photoacoustic spectroscopy (PAS) [12], fluorescence spectroscopy [13], Fourier transform infrared spectroscopy (FTIR) [14], et cetera. Among those methods, absorption spectroscopy possesses several merits such as short response time, simple structure and high accuracy. In addition, compared with other optical detection techniques, the detection system based on absorption spectroscopy is more suitable for modularized and portable design. Therefore, absorption spectroscopy is extensively applied in the electrical industry for insulation state detection.
Usually, the detection system for SO2 based on absorption spectroscopy employs infrared excitations. However, SO2 possesses two strong absorption bands in ultraviolet (UV) range. According to Beer–Lamber’s law, the larger absorption cross-section band of SO2 contributes to better detection performance. Moreover, the majority decomposition of SF6 except for SO2 has no evident absorption band in the UV range. Hence, the employment of UV excitation is able to avert crossover interference to a great extent, which results in more accurate spectral information.
Usual UV excitation includes deuterium lamp [15], xenon lamp [16] and neon lamp [17]. However, such excitation depends on an electrode to launch electron and excite gas discharge. Exposed to long-term UV illumination, the ageing process of an electrode is accelerated. On the other hand, the excimer lamp, which does not have an electrode, excites gas to discharge using microwave. Due to this characteristic, the lifetime of the excitation drastically improved. Accordingly, the frequency of systematic maintenance is reduced. As a consequence, the detection system based on excimer lamp is feasible for long-term monitoring scenarios.
Aiming at the discussion above, a trace SO2 quantitative detection system based on excimer lamp is presented in this paper. The major contributions of this paper are as follows:
(1)
Study of the characteristic of UV excimer lamp and the feasibility of its application in UV absorption spectroscopy;
(2)
Establishment of trace SO2 quantitative detection system based on excimer lamp and evaluation of the performance of the presented detection system;
(3)
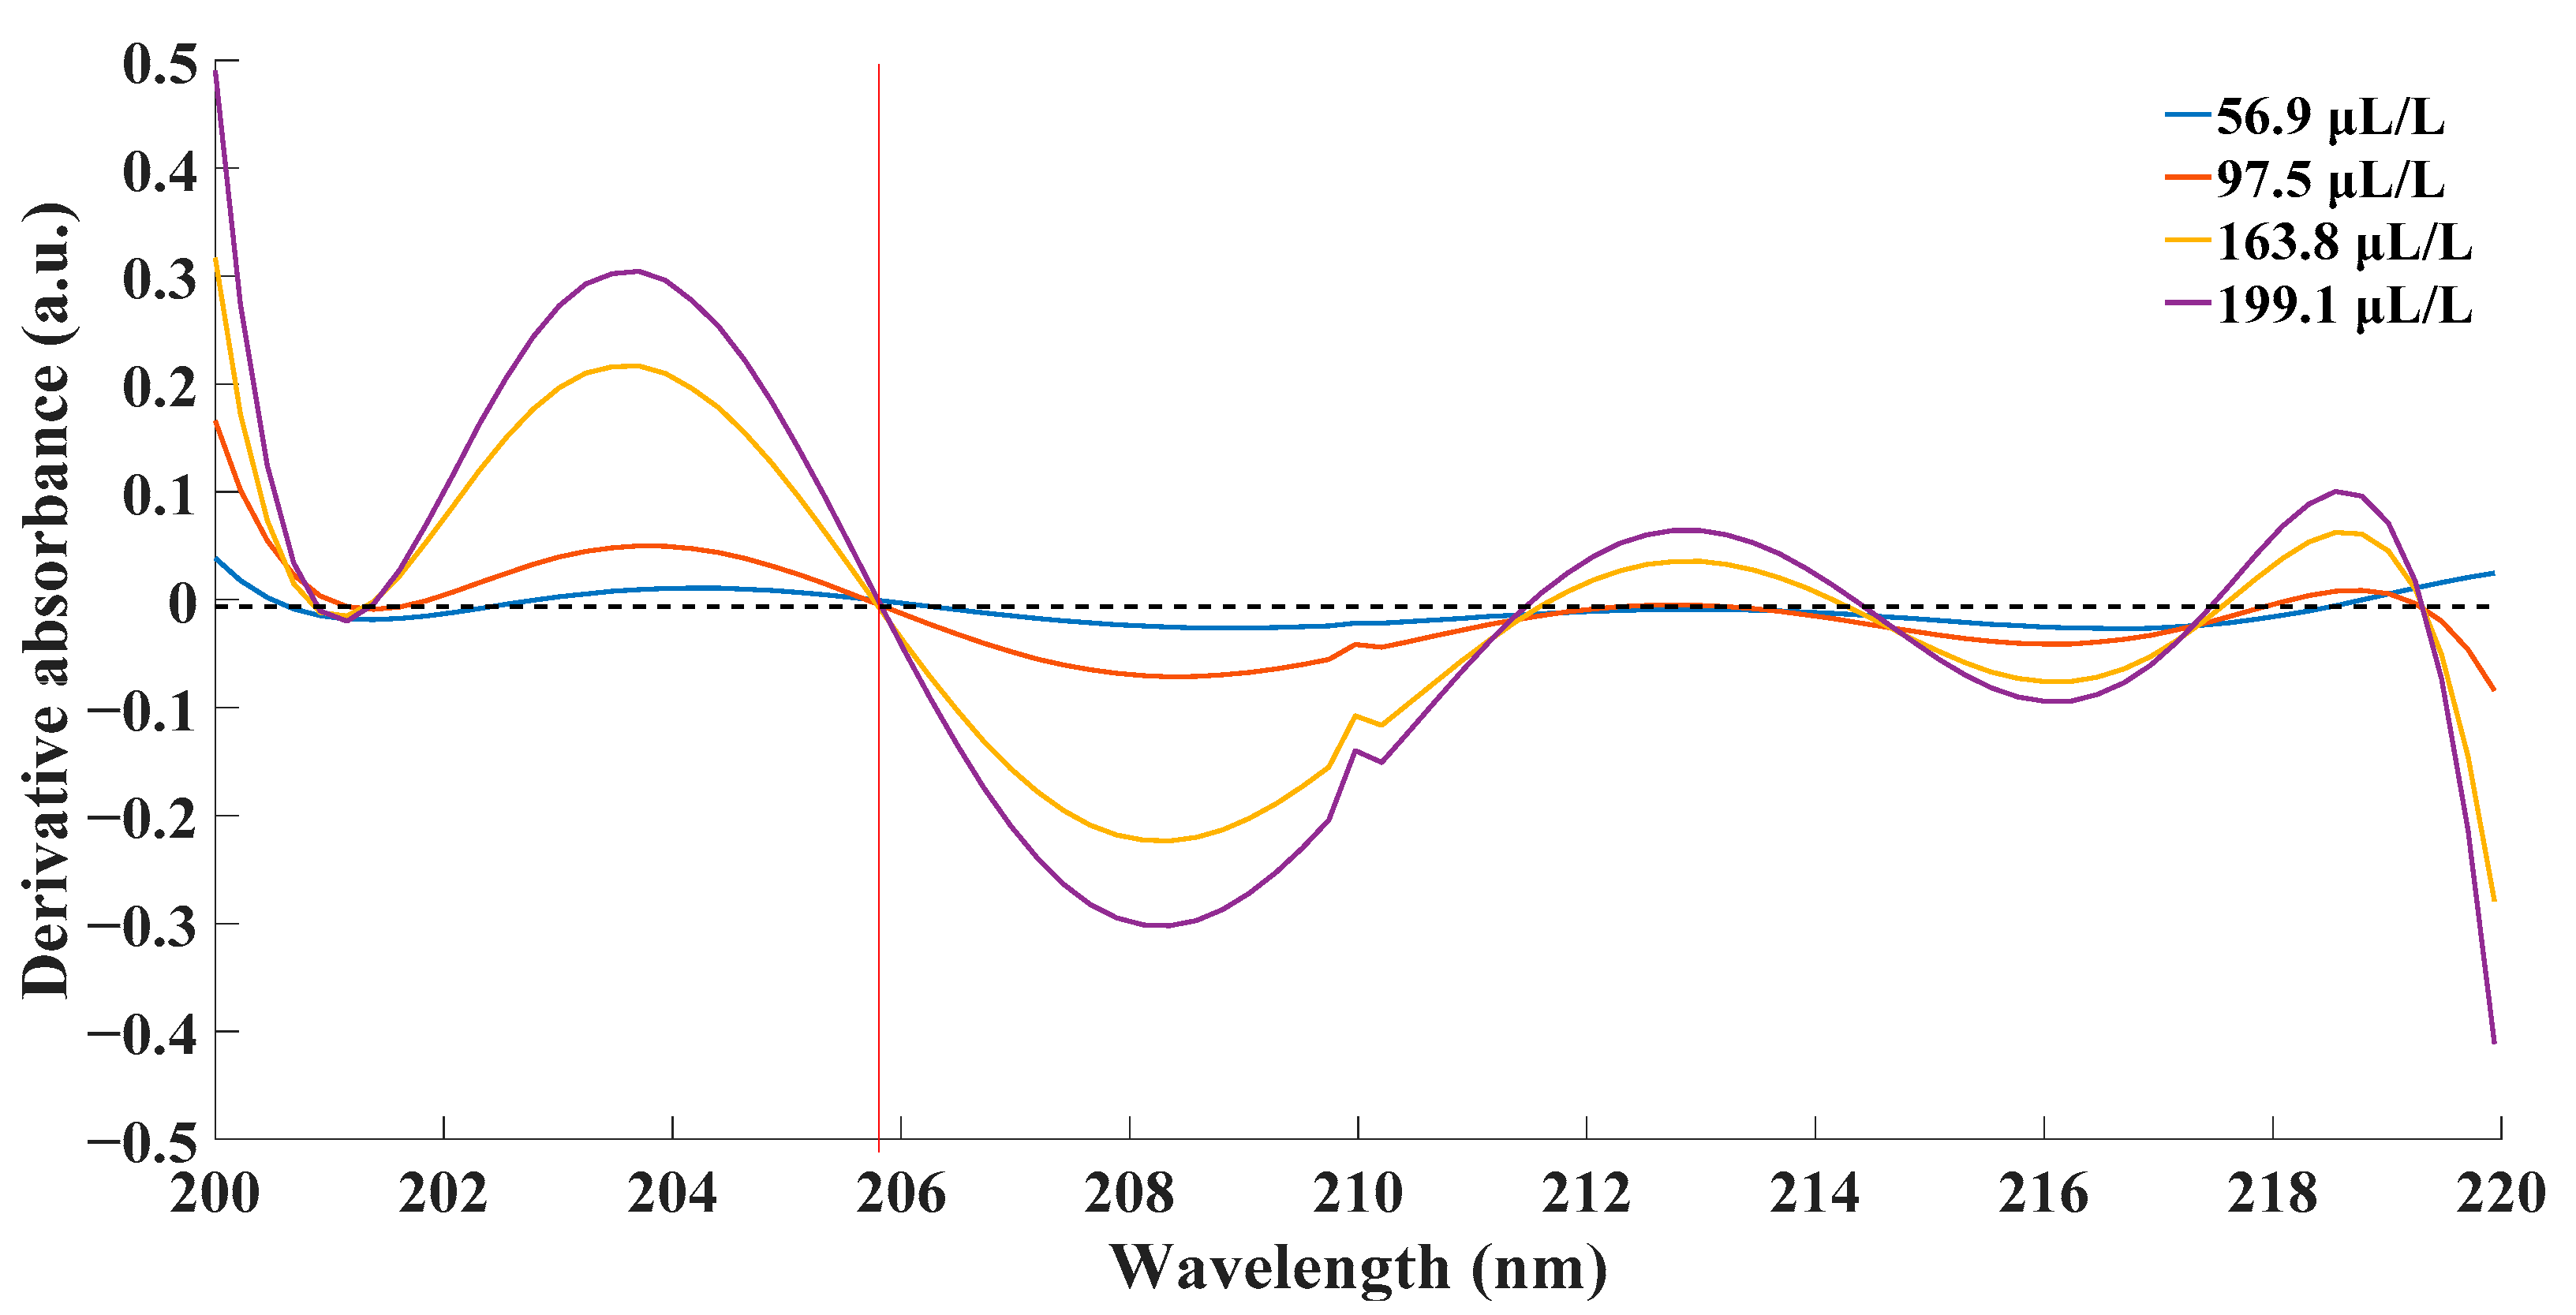
Selection of the most prominent absorption peak among the absorption spectra by calculating spectral derivative for quantitative analysis.
The result of this paper could serve as a reference for the application of excimer lamp in the field of gas insulated equipment fault diagnosis.

2. Theoretically Fundamental

2.1. Basic Principle of Excimer Lamp

Generally, excimer includes noble gas, halogen, noble gas-halogen and mercury-halogen dimer [18]. Noble gas–halogen is the most common working substance of an excimer lamp. The working principle of such an excimer lamp could be demonstrated as follows.
Excited by energetic electron, noble gas and halogen are ionized, and their processes are described as follows [19]:
e * + R g R g * + e
e * + R g R g + + 2 e
e * + X 2 X + X
where Rg represents noble gas particle, and X represents halogen particle. Then, the excimer is generated through a Harpooning reaction:
R g + + X + M R g X * + M
R g * + X 2 R g X * + X
where M represents three kinds of particle which include the atom, molecule and buffer gas. Such an excimer is not stable; it will decompose and release excitation energies through photons:
R g X * R g + X + h ν
where h represents the Planck constant, and ν represents the wavelength of the photon.
In this paper, a microwave was employed to bring electron kinetic energy and excite the working substance in the excimer lamp. Then, photons with certain wavelength could be obtained.

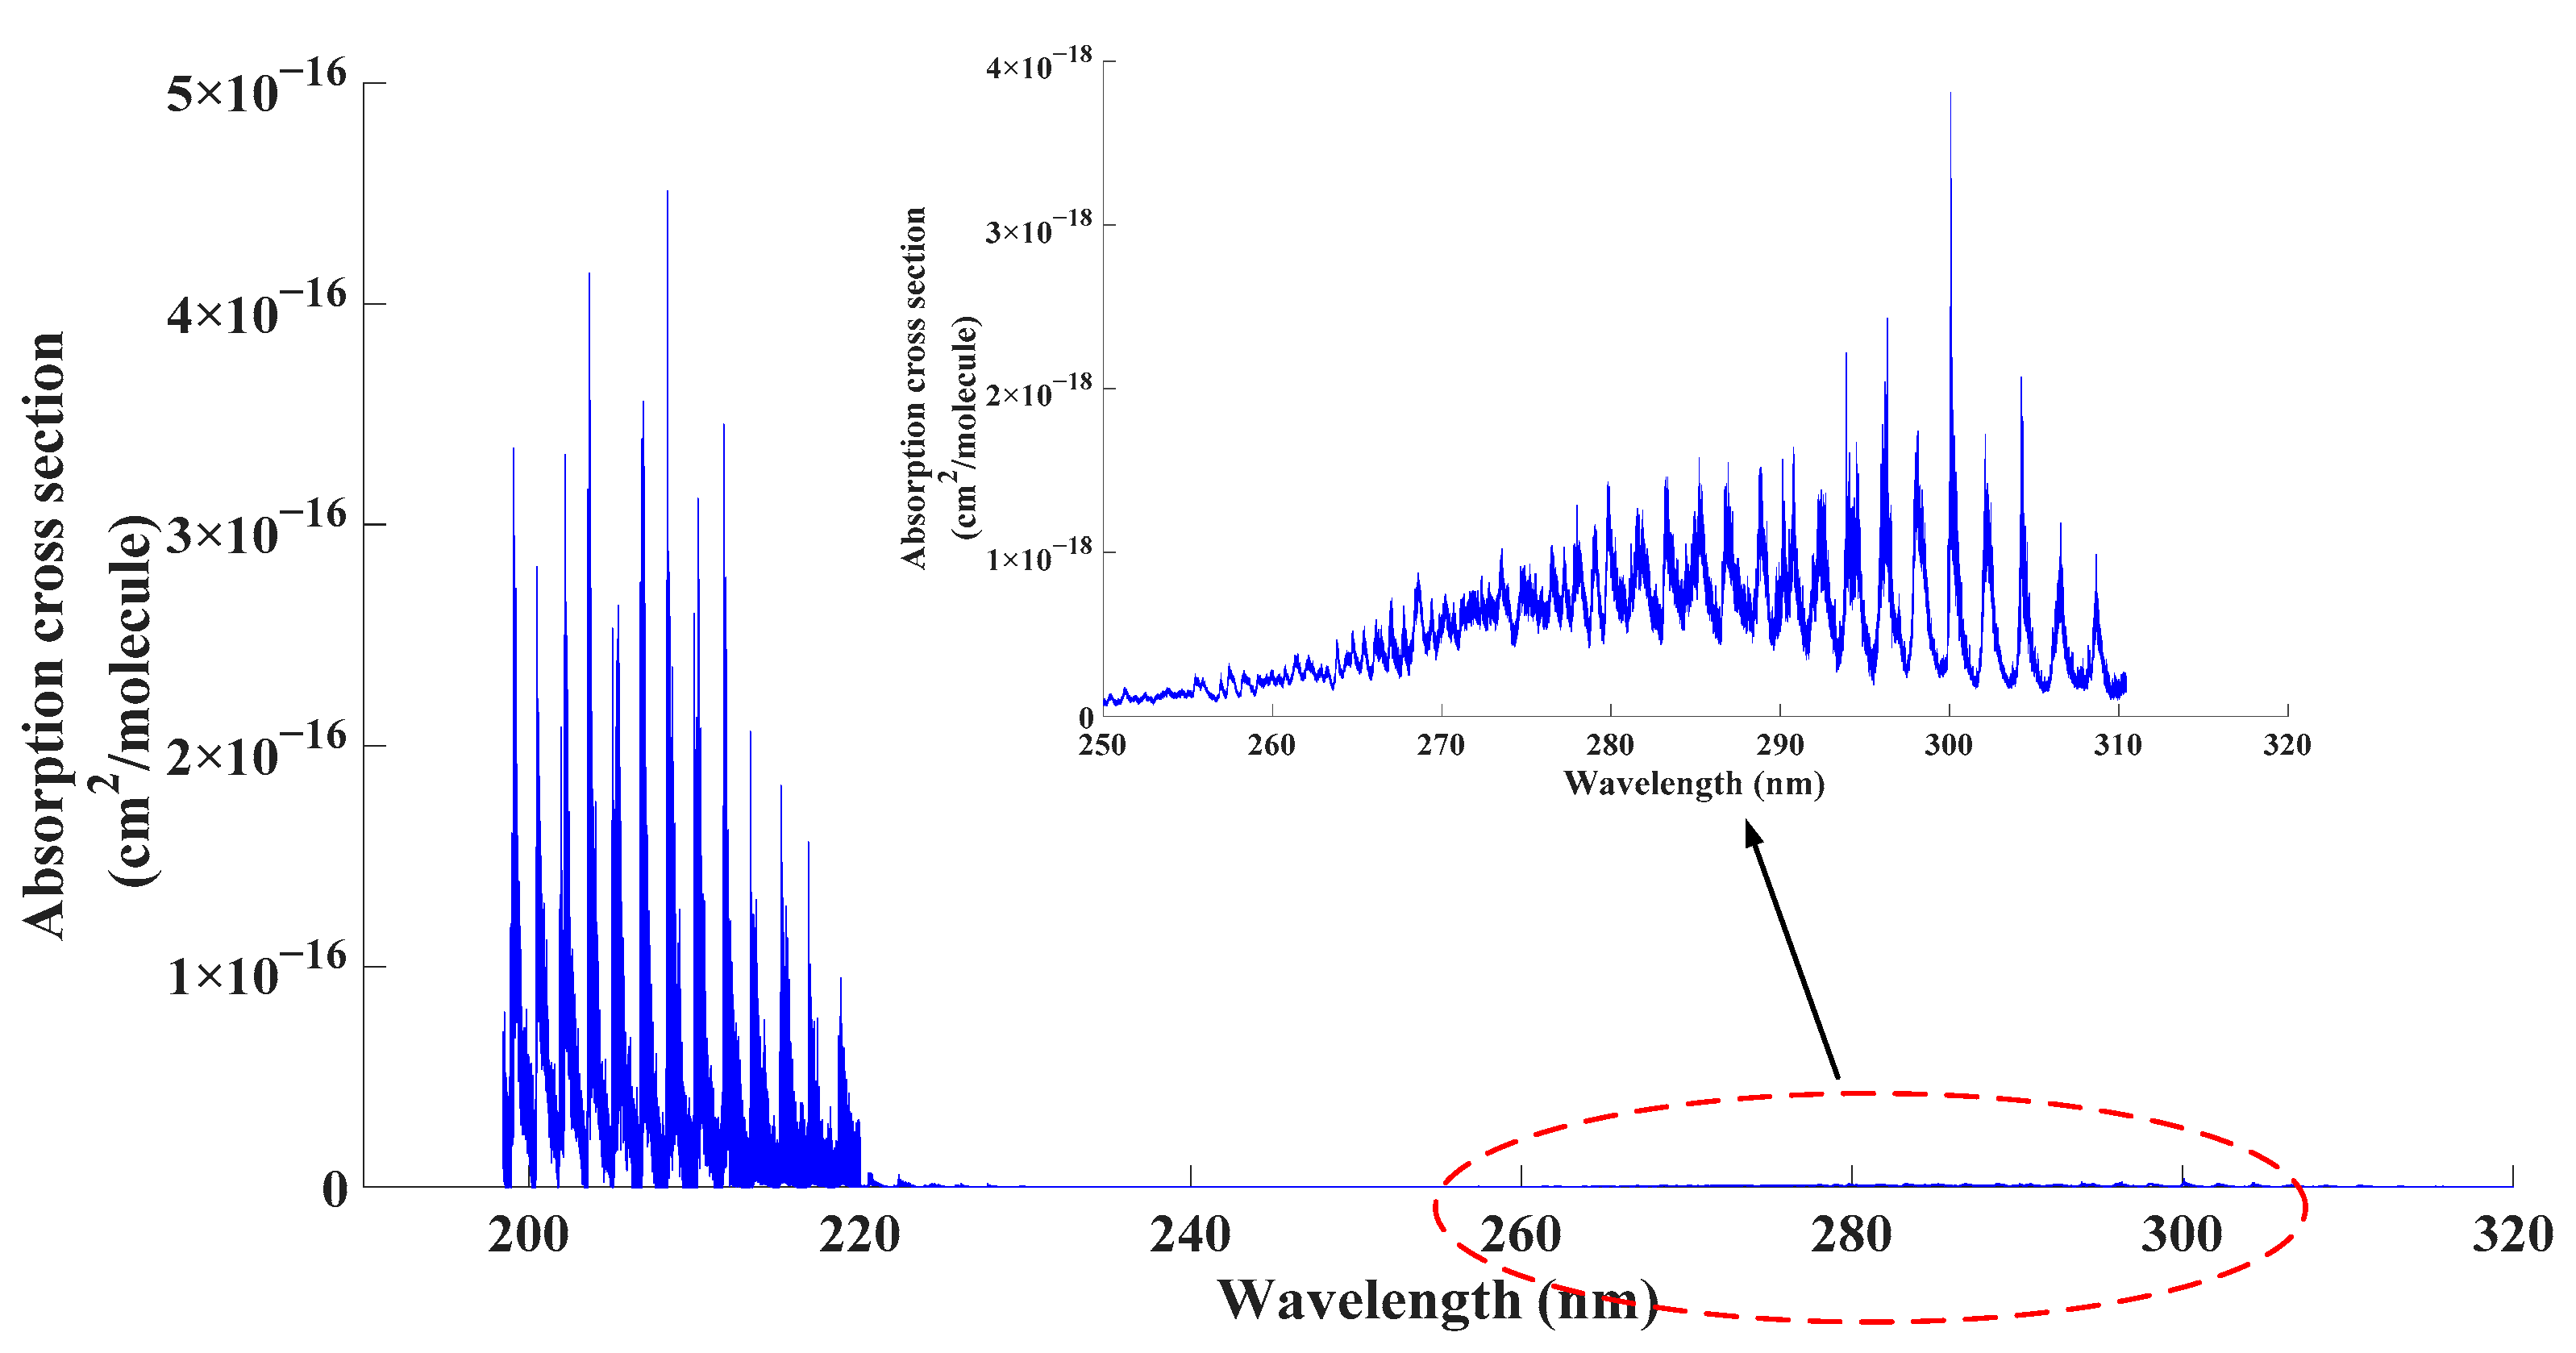
2.2. Basic Principle of Absorption Spectroscopy

According to Beer–Lambert’s Law, the absorption spectrum could be expressed as follows [20].
I ( λ ) = I 0 ( λ ) exp [ c L σ ( λ ) ]
Equation (7) can be rewritten as follows:
c = ln [ I 0 ( λ ) I ( λ ) ] L σ ( λ ) = A ( λ ) L σ ( λ )
where I 0 ( λ ) represents the initial intensity of UV light, I ( λ ) represents the transmission intensity of UV light, L represents the optical path length, σ ( λ ) represents the absorption cross-section of the investigated gas, c represents the concentration of investigated gas and λ represents the wavelength of incident light. In addition, absorbance is denoted as A ( λ ) = ln [ I 0 ( λ ) / I ( λ ) ] .

3. Experimental Setups

To quantitatively detect trace SO2, a detection system based on absorption spectroscopy was established in this paper. Crucial components of the detection system were introduced as follows.

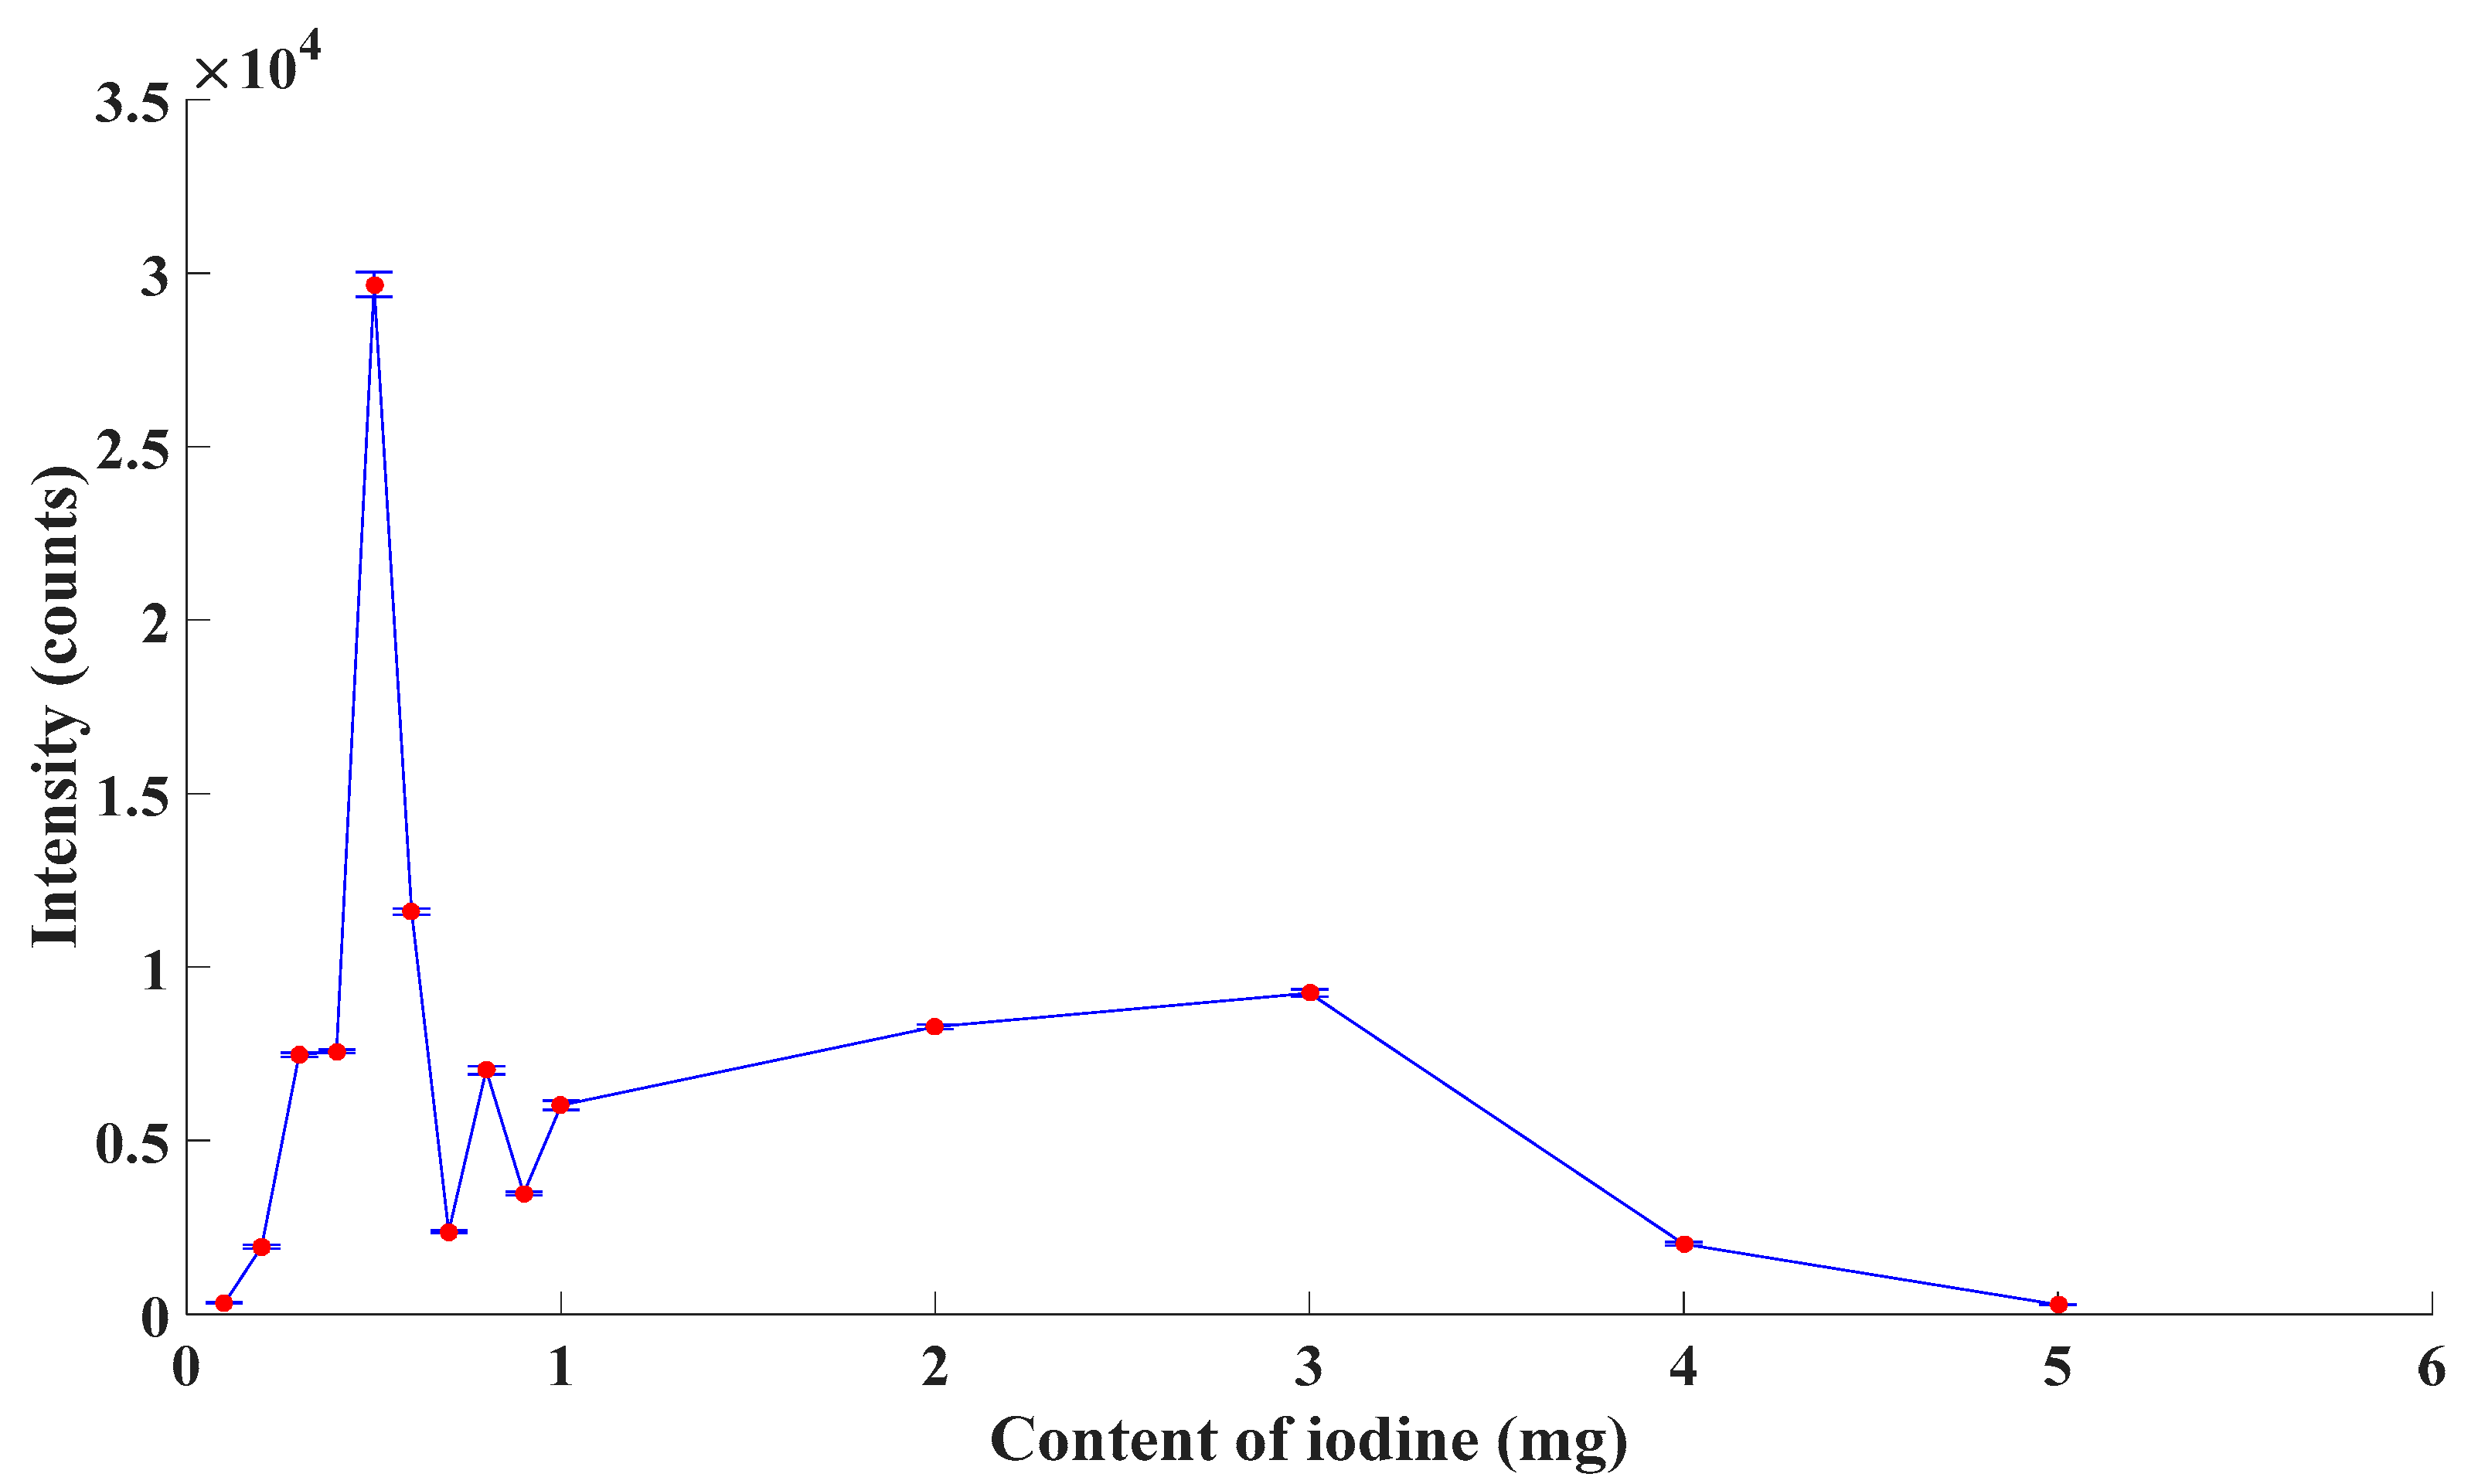
3.1. The Selection of the Formula of Excimer Lamp

In order to select a proper excitation for the detection system, the absorption characteristic of SO2 was studied first in this paper. Based on current studies, it was recognized that two major absorption bands of SO2 exist in UV band. According to the principle of absorption spectroscopy, the nominal wavelength of the excitation falling into the absorption band of investigated gas contributes to better performance of the detection system. Given the data provided by Gordon [21] and Blackie [22], the absorption cross section of SO2 in the UV band can be depicted as follows.
From Figure 1, according to current research studies [23,24], in the wavelength range between 198 nm and 310 nm, SO2 exhibited two strong absorption band, which were at 190 nm to 220 nm (1B21A1) and 250 nm to 310 nm (1A2, 1B11A1). Compared with the absorption band at 250 nm to 310 nm, the absorption band at 190 nm to 220 nm was one order of magnitude larger. In that case, it would be better if the nominal wavelength of employed excimer lamp was in the range of 190 nm to 220 nm.
Former scholars have performed abundant research on the characteristics of various excimer lamps. According to reference [25], regular formulas of noble gas–halogen excimer lamp and corresponding nominal wavelength are described as follows.
From Table 1, combined with the absorption band of SO2, a I-Kr lamp was selected as the excitation in this paper.
After the working substance has been selected, the corresponding contents were determined then. The luminance of excimer lamp relies on the gas discharge inside the lamp. On the one hand, light intensity was determined by the number of excited gas molecules. On the other hand, based on the theory of gas discharge, the mean free path of an electron was described as follows:
λ ¯ = 1 π N ( r 1 + r 2 ) 2
where λ ¯ represents the mean free path of electron, N represents the density of gas molecule r 1 and r 2 represent the radius of electron and gas molecule, respectively. From (9), higher pressure results in higher densities and smaller mean free path. Moreover, a smaller mean free path indicates less time to gain energy for an electron. Hence, the probability of gas molecules being ionized decreases accordingly. From a macro point of view, the emission intensity of an excimer lamp decreases. To conclude, the light intensity might increase first and decrease later when the content of I2 increases.
In order to verify the theory aforementioned and to select the proper formula of the excitation, in this paper, the emission spectroscopy of excimer lamps with different content of I2 was detected. In those excimer lamps, the content of I2 was 0.1 mg, 0.2 mg, 0.3 mg, 0.4 mg, 0.5 mg, 0.6 mg, 0.7 mg, 0.8 mg, 0.9 mg, 1 mg, 2 mg, 3 mg, 4 mg and 5 mg. As the ambient gas, the pressure of Kr was 2 Torr. The experimental results are described as Figure 2.
From Figure 2, the emission intensity of excimer lamps increased first and decreased later with an increase in the content of I2 roughly, which agreed with the statement above. The emission intensity reached a peak when the content of I2 was 0.5 mg. Thus, combined with both theoretical analysis and experimental outcome, the content of I2 was chosen as 0.5 mg in this paper.

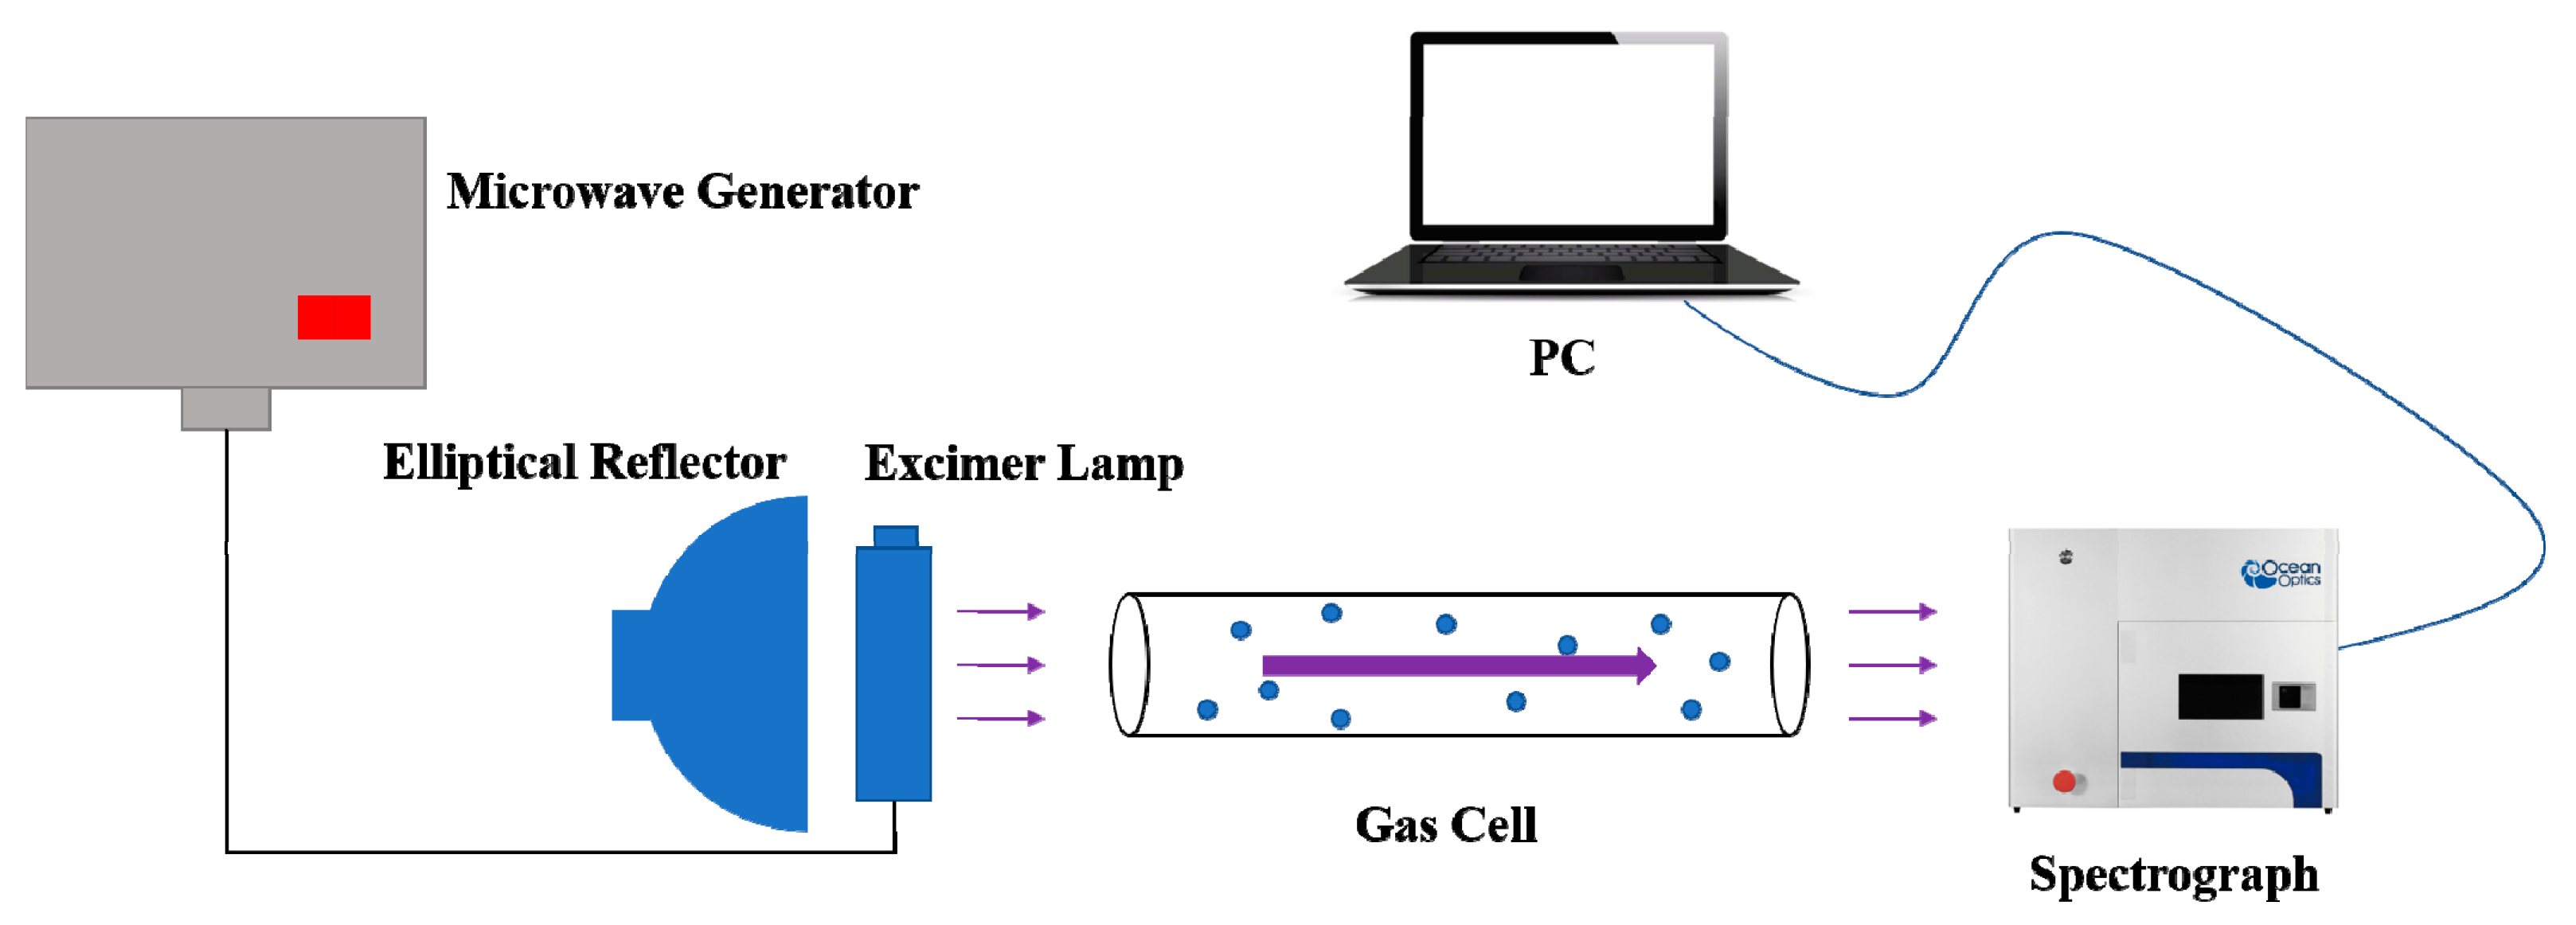
3.2. Basic Structure of Detection System

According to the basic principle of absorption spectroscopy, a trace SO2 detection system was built in this paper. The schematic diagram of the detection system is described as follows.
From Figure 3, the optical path length of the gas cell was 0.8 m, and the model of the spectrometer was OceanOptics MX2500+. A microwave generator comprised a transformer and a magnetron. A generated microwave was transmitted to an excimer lamp through a cable. The gas molecules were excited by the microwave and generated UV light, which entered the gas cell and was absorbed by the investigated gas. The elliptical reflector behind the excimer lamp was employed to enhance light intensity of the investigated gas. Then, the transmission light arrived at the probe of the spectrometer for detection. Finally, data obtained from the spectrometer were transmitted to a PC for further processing.

4. Experimental Results and Analysis

4.1. The Influence of Dark Current

Considering the interference from surrounding and background noise, the spectrometer would capture signals without the excitation being started. It is necessary to eliminate such influence before spectral data are further processed. Denote such influence as dark current, the modified absorbance is then calculated as follows:
A ( λ ) = ln I 0 ( λ ) I N ( λ ) I ( λ ) I N ( λ )
where A ( λ ) represents the absorbance of investigated gas at wavelength λ , I 0 ( λ ) represents the initial intensity of UV light, I ( λ ) represents the transmission intensity of UV light and I N ( λ ) represents the dark current.

4.2. Quantitative Analysis of Trace SO2 Detection

Standard SF6 gas of 99.999% purity was employed as the background gas. SO2 gas samples with the concentration of 0 μL/L, 56.9 μL/L, 97.5 μL/L, 163.8 μL/L and 199.1 μL/L were taken for experiment. SO2 with the concentration of 0 μL/L, which was pure SF6, was considered as the background. Gas samples were prepared by mixing certain volumes of standard SO2 gas with known concentrations and pure SF6. A spectrometer was used to detect the absorption spectra. Then, the dark current was deducted from detected data. With background subtraction, the modified absorption spectra of the aforementioned concentrations are depicted as Figure 4.
In order to determine the most prominent absorption peak among all wavelengths, spectral derivatives were obtained. By calculating the derivatives of the absorbance spectra, matching between the absorption cross section of the investigated gas and the emission spectrum of the excitation could be quantitatively determined. Therefore, the most prominent absorption peak could be located. Such processing had potential for various objects and scenarios instead of certain kinds of investigated gas.
In this paper, Savitzky–Golay convolution filtering was employed to smooth the original spectral data and to eliminate irrelevant noise [26]. The order of the Savitzky–Golay filter was set at nine. The filtered spectra are depicted as Figure 5.
Then, one-order derivative spectra of the absorbance at each concentration of SO2 were calculated and depicted as follows.
From Figure 6, it could be observed that the zeros of four derivative absorbance spectra met at the point of 205.79 nm. The fact indicated that all four spectra reached their extremums at this very point. Combined with original spectra, the absorbance at this point was the maximum. According to the theory of absorption spectroscopy, a more prominent phenomenon contributed to better performance of the detection system. Ergo, the experimental data at the wavelength of 205.79 nm were used for further calculation and analysis. Linear fitting between absorbance and concentration at this wavelength was as Figure 7.
From Figure 7, linear fitting R2 > 0.9996 confirmed the linearity of the absorbance response to the concentration of SO2. Moreover, the linear fitting function could be expressed as follows.
A = 0.0057 c 0.0102
From what has been discussed above, the fitting result proved the rationality of using a linear function to characterize the relationship between the absorbance and the concentration of SO2. As a result, SO2 gas with unknown concentrations could be calculated by (11) once the corresponding absorbance was measured.

4.3. Estimation of the Detection Performance

In this paper, the performance of the proposed detection system was evaluated from three aspects, accuracy, DL and drift over time, which are demonstrate successively.
Firstly, the accuracy of the proposed detection system was quantitatively estimated. In detail, in order to evaluate the accuracy of the proposed detection system, gas samples with different concentrations of SO2 were employed as the benchmark for comparison. Gas samples were prepared by mixing certain volumes of standard SO2 gas with known concentrations and pure SF6. Standard gas was purchased from Beijing Haipubeifen gas product company. Based on the error of standard gas and barometer employed in this work, the error value of the concentrations of gas samples was ±2.255%. The main process of obtaining detection results was as follows:
(1)
Introduce one gas sample into the gas cell for detection;
(2)
Detect five successive points of transmission light intensity and calculate their average as the detection transmission light intensity;
(3)
Take the detection transmission light intensity to calculate the corresponding concentration. The calculated concentration is then taken as the detection result;
(4)
Clean the detection system and repeat above procedure in order to obtain the detection result of each gas sample.
By comparing the detection result with the corresponding gas sample, the relative error could be obtained. Hence, the accuracy of proposed detection system could be evaluated. Furthermore, in order to fully evaluate the performance of the proposed detection system, the error budget was presented. In this study, the error mainly came from the error of standard gas, barometer and detection process. In detail, the error of purchased standard gas was 2%, and the error level of the barometer was 0.25. Therefore, the gas samples prepared in this study had an error of ±2.255%. Moreover, the errors of experimental data obtained from spectrometer were evaluated by calculating the standard deviation of raw data, which are given next. Finally, the comparison results are listed as follows.
From Table 2, it could be concluded that the proposed detection system could measure trace SO2 with high accuracy at both low and high concentrations. Such capability brought the applicative potential to the proposed detection system.
Secondly, the detection limit (DL) is a common criterion employed to gauge the capability of a detection system. The DL (1 σ ) of the presented detection system was calculated as follows [27]:
D L = c S N R
where c represents the concentration of SO2, and SNR represents the signal to noise ratio.
In this paper, the main process of obtaining DL was as follows:
(1)
Introduce pure SF6 into the gas cell for detection;
(2)
Detect five successive points and calculate their average as the background signal and the standard deviation of their absorbance as the systematic noise;
(3)
Clean the detection system and introduce gas samples into the gas cell for detection;
(4)
Detect five successive points of transmission light intensity and calculate the average of their absorbance;
(5)
Calculate DL.
Based on the aforementioned procedure, the performance of the proposed detection system could be evaluated. Particularly speaking, the systematic noise represented the fluctuation degree of obtained data from the spectrometer and reflected the uncertainty of calculation results. A gas sample with the concentration of 56.9 μL/L was taken to calculate SNR and DL. The calculation results are listed as follows.
From Table 3, low systematic noise indicated that the emission of the excitation was stable, which was beneficial to high SNR. Accordingly, low DL could be obtained. It could be observed that the DL (1 σ ) of the detection system was 0.632 μL/L. Currently, the SO2 diagnostic threshold level is about 1 μL/L. Therefore, the results proved the feasibility of the application of proposed detection system in failure diagnosis in SF6-insulated equipment.
Thirdly, the drift of the proposed detection system was analyzed over time. The drift of the proposed detection system mainly came from two perspectives: the drift of the excitation and the drift of the detector. In order to evaluate their drift, the excitations of the proposed detection system, which was the excimer lamp, and the detector, which was the spectrometer, were tested respectively. Power and energy meters were employed to detect the output of the excimer lamp. The measurement results are as Figure 8.
The excimer lamp was switched on at 30 s, and after a period of ascending, the light power tended to be stable. Finally, the light power fluctuated around 21.7 mW. The standard deviation of stable data was 0.111% of the average of stable data. It can be observed that the fluctuation degree of the emission was quite small once the excimer lamp stabilized. In that case, drift of the output of excimer lamp over time could barely be observed.
On the other hand, the spectrometer was employed to measure the emission of the excimer lamp after it stabilized. Considering that every detection process often lasted less than 1 min, the emission of the stable excimer lamp for 10 successive minutes was detected. The detection results were as follows.
From Figure 9, the standard deviation of experimental data was 1.22% of the average of detected data. According to experimental data, the performance of the spectrometer employed was stable over time. Hence, drift over time barely existed in the spectrometer.
In summary, the experimental results indicated that the minor fluctuation existed in the process of obtaining data. Therefore, drift over time did not emerge prominently. Such stability was beneficial for better performance of the proposed detection system.

4.4. Discussion and Future Works

According to above results, the feasibility of the excimer lamp in trace SO2 detection could be verified. On the one hand, due to the good linearity between the absorbance and the concentration of SO2, a gas sample with unknown concentration could be calculated via a calibrated relationship. Based on the calculation results presented in Section 4.3, it could be observed that good linearity resulted in accurate relationships and calculations. This result indicated that the proposed detection system had the capability of providing accurate detection results. On the other hand, the excimer lamp was capable in providing stable and emergent UV light as the excitation. Therefore, the emission of the excimer lamp had minor drift over time, which was beneficial to high SNR.
Based on the aforementioned experimental results, the proposed detection system possessed the DL of sub-ppm level and had fast response speed. For comparison, several common optical detection methods for trace SO2 are listed as follows.
From Table 4, the performance of the proposed detection system was comparable to common optical detection methods for SO2 such as DOAS, fluorescence, FTIR and PAS [28]. Thus, the proposed detection system has potential for practical applications.
Future studies derived from this paper may focus on two major aspects. First, due to the simple structure of proposed detection system, it was able to be highly integrated and modularized. Such a design is required when it is applied to equipment that is hard to reach, such as bushings. Second, during the operation of the microwave generator, a lot of heat was generated as well. Heat may cause the detection result to drift and the excimer lamp to quench. As a result, the heat dissipation problem is of great significance when such a detection system was implemented.

5. Conclusions

In this paper, a detection system for trace SO2 was established. Firstly, the emission characteristic of the excimer lamp was studied, and the working substance and corresponding formula of the excimer lamp were determined. Then, based on the selected excimer lamp, a UV absorption spectroscopy detection system was established for trace SO2. Next, the derivatives of absorbance spectra were calculated to locate the most prominent absorption peak for further linear fitting and analysis. Experimental results indicated that at the wavelength of selected absorption peak, good linearity existed between the absorbance and concentration of SO2. Moreover, experimental results testified the potential of a proposed detection system in trace SO2 quantitative measurements. Furthermore, the error budget of the proposed detection system was proposed. Based on the error budget, the detection results of the proposed detection system were quantitatively analyzed. According to the comparison the detection results and the known gas samples, the proposed detection system performed good accuracy when measuring trace SO2. In addition, the DL of the proposed detection system could reach a level of 10−7. In a nutshell, the study in this paper could verify the feasibility of the application of the excimer lamp in trace gas detection systems. The results of this paper may serve as a guideline for SF6-insulated equipment failure diagnosis.

Author Contributions

Conceptualization, T.C., F.M., X.Q. and G.Z.; methodology, T.C. and Z.L.; software, T.C.; validation, T.C. and Z.L.; formal analysis, T.C.; investigation, T.C. and Z.L.; resources, G.Z.; data curation, T.C.; writing—original draft preparation, T.C.; writing—review and editing, T.C., K.L., Z.Q. and G.Z.; supervision, K.L., Z.Q. and G.Z.; project administration, K.L., F.M., X.Q., Z.Q. and G.Z.; funding acquisition, K.L., F.M., X.Q., Z.Q. and G.Z. All authors have read and agreed to the published version of the manuscript.

Funding

This research was funded by the Science and Technology Project of State Grid Corporation of China, grant number 521205190014. The APC was funded by Science and Technology Project of State Grid Corporation of China, grant number 521205190014.

Institutional Review Board Statement

Not applicable.

Informed Consent Statement

Not applicable.

Data Availability Statement

Data sharing not applicable.

Acknowledgments

The authors especially thank Electrical Power Research Institute and Anhui Electrical Power Company, Ltd., State Grid, for their support.

Conflicts of Interest

The authors declare no conflict of interest.

References

  1. Tang, J.; Liu, F.; Meng, Q.; Zhang, X.; Tao, J. Partial discharge recognition through an analysis of SF6 decomposition products part 2: Feature extraction and decision tree-based pattern recognition. IEEE Trans. Dielectr. Electr. Insul. 2012, 19, 37–44. [Google Scholar] [CrossRef]
  2. Guozhi, Z.; Zhang, G.; Xingrong, H.; Jia, Y.; Tang, J.; Yue, Z.; Yuan, T.; Zhenze, L. On-Line Monitoring of Partial Discharge of Less-Oil Immersed Electric Equipment Based on Pressure and UHF. IEEE Access 2019, 7, 11178–11186. [Google Scholar] [CrossRef]
  3. N’Cho, J.S.; Fofana, I.; Hadjadj, Y.; Beroual, A. Review of Physicochemical-Based Diagnostic Techniques for Assessing Insulation Condition in Aged Transformers. Energies 2016, 9, 367. [Google Scholar] [CrossRef]
  4. Yang, J.G.; Shi, W.; Li, H.T.; Gong, B.; Jiang, W.Y. Analysis of partial discharge Ultrasonic wave characteristic on typical Defects in GIS. In MATEC Web of Conferences; EDP Sciences: Les Ulis, France, 2016; Volume 63, p. 1017. [Google Scholar] [CrossRef] [Green Version]
  5. Lin, T.; Han, D.; Zhang, G.; Liu, D. Influence of trace O2 on SF6 decomposition characteristics under partial discharge based on oxygen isotope tracer. IEEE Trans. Dielectr. Electr. Insul. 2017, 24, 1600–1607. [Google Scholar] [CrossRef]
  6. Sampaolo, A.; Patimisco, P.; Giglio, M.; Chieco, L.; Scamarcio, G.; Tittel, F.K.; Spagnolo, V. Highly sensitive gas leak detector based on a quartz-enhanced photoacoustic SF6 sensor. Opt. Express 2016, 24, 15872–15881. [Google Scholar] [CrossRef] [Green Version]
  7. Spagnolo, V.; Patimisco, P.; Borri, S.; Scamarcio, G.; Bernacki, B.E.; Kriesel, J. Part-per-trillion level SF6 detection using a quartz enhanced photoacoustic spectroscopy-based sensor with single-mode fiber-coupled quantum cascade laser excitation. Opt. Lett. 2012, 37, 4461–4463. [Google Scholar] [CrossRef] [PubMed]
  8. ION, SF6 Leakmate-Portable SF6 Leak Monitor. Available online: https://ionscience.com/en/products/sf6-leakmate-portable-sf6-leak-monitor/ (accessed on 10 November 2021).
  9. VAISALA, SF6 Gas Insulated Equipment. Available online: https://www.vaisala.com/en/industries-applications/power-industry-applications/sf6-gas-insulated-equipment?utm_medium=cpc&utm_source=google&utm_campaign=VIM-GLO-EN-POW&gclid=EAIaIQobChMIlb2R6pfq8wIV1-h3Ch3_4wWEEAAYAyAAEgKQ0vD_BwE (accessed on 10 November 2021).
  10. Yin, X.; Dong, L.; Wu, H.; Zhang, L.; Ma, W.; Yin, W.; Xiao, L.; Jia, S.; Tittel, F.K. Highly sensitive photoacoustic multicomponent gas sensor for SF6 decomposition online monitoring. Opt. Express 2019, 27, A224–A234. [Google Scholar] [CrossRef] [Green Version]
  11. Zhang, X.; Xiao, H.; Li, X.; Zhang, J. Ultraviolet differential spectroscopy quantitative analysis of SF 6 decomposition component SO2. IET Sci. Meas. Technol. 2018, 12, 328–334. [Google Scholar] [CrossRef]
  12. Yin, X.; Dong, L.; Wu, H.; Zheng, H.; Ma, W.; Zhang, L.; Yin, W.; Xiao, L.; Jia, S.; Tittel, F.K. Highly sensitive SO2 photoacoustic sensor for SF6 decomposition detection using a compact mW-level diode-pumped solid-state laser emitting at 303 nm. Opt. Express 2017, 25, 32581–32590. [Google Scholar] [CrossRef]
  13. Weng, W.; Aldén, M.; Li, Z. Quantitative SO2 Detection in Combustion Environments Using Broad Band Ultraviolet Absorption and Laser-Induced Fluorescence. Anal. Chem. 2019, 91, 10849–10855. [Google Scholar] [CrossRef] [PubMed] [Green Version]
  14. Zhang, X.; Liu, H.; Ren, J.; Li, J.; Li, X. Fourier transform infrared spectroscopy quantitative analysis of SF6 partial discharge decomposition components. Spectrochim. Acta Part A Mol. Biomol. Spectrosc. 2015, 136, 884–889. [Google Scholar] [CrossRef]
  15. Spangenberg, M.; Bryant, J.I.; Gibson, S.J.; Mousley, P.J.; Ramachers, Y.; Bell, G.R. Ultraviolet absorption of contaminants in water. Sci. Rep. 2021, 11, 3682. [Google Scholar] [CrossRef]
  16. Zhao, J.; Guo, J.; Shi, J.; Yu, Z.; Zhang, H. Ultra-low flue gas emission monitoring based on differential optical absorption spectroscopy. Int. Soc. Opt. Photonics 2019, 11189, 111891E. [Google Scholar] [CrossRef]
  17. Zhang, H.J.; Han, Q.Y.; Zhang, S.D. 254 nm Radiant Efficiency of High Output Low Pressure Mercury Discharge Lamps with Neon-Argon Buffer Gas. Appl. Mech. Mater. 2013, 325-326, 409–412. [Google Scholar] [CrossRef]
  18. Kogelschatz, U.; Eliasson, B.; Esrom, H. Industrial applications of excimer ultraviolet sources. Mater. Des. 1991, 12, 251–258. [Google Scholar] [CrossRef]
  19. Eliasson, B.; Kogelschatz, U. Modeling and applications of silent discharge plasmas. IEEE Trans. Plasma Sci. 1991, 19, 309–323. [Google Scholar] [CrossRef]
  20. Zou, J.; Wang, F. Simultaneous measurement of SO2 and NO2 concentration using an optical fiber-based LP-DOAS system. Chin. Opt. Lett. 2020, 18, 021201. [Google Scholar] [CrossRef]
  21. Gordon, I.E.; Rothman, L.S.; Hill, C.; Kochanov, R.V.; Tan, Y.; Bernath, P.F.; Birk, M.; Boudon, V.; Campargue, A.; Chance, K.V.; et al. The HITRAN2016 molecular spectroscopic database. J. Quant. Spectrosc. Radiat. Transf. 2017, 203, 3–69. [Google Scholar] [CrossRef]
  22. Blackie, D.; Blackwell-Whitehead, R.; Stark, G.; Pickering, J.C.; Smith, P.L.; Rufus, J.; Thorne, A.P. Correction to “High-resolution photoabsorption cross-section measurements of SO2 at 198 K from 213 to 325 nm”. J. Geophys. Res. Space Phys. 2011, 116, E12099. [Google Scholar] [CrossRef]
  23. Yin, X.; Wu, H.; Dong, L.; Li, B.; Ma, W.; Zhang, L.; Yin, W.; Xiao, L.; Jia, S.; Tittel, F.K. ppb-Level SO2 Photoacoustic Sensors with a Suppressed Absorption–Desorption Effect by Using a 7.41 μm External-Cavity Quantum Cascade Laser. ACS Sens. 2020, 5, 549–556. [Google Scholar] [CrossRef]
  24. Chen, T.; Ma, F.; Zhao, Y.; Liao, Z.; Qiu, Z.; Zhang, G. Cantilever enhanced based photoacoustic detection of SF6 decomposition component SO2 using UV LED. Sens. Rev. 2021. ahead-of-print. [Google Scholar] [CrossRef]
  25. Zhang, J.; Boyd, I.W. Efficient excimer ultraviolet sources from a dielectric barrier discharge in rare-gas/halogen mixtures. J. Appl. Phys. 1996, 80, 633–638. [Google Scholar] [CrossRef]
  26. Zhang, G.; Hao, H.; Wang, Y.; Jiang, Y.; Shi, J.; Yu, J.; Cui, X.; Li, J.; Zhou, S.; Yu, B. Optimized adaptive Savitzky-Golay filtering algorithm based on deep learning network for absorption spectroscopy. Spectrochim. Acta Part A Mol. Biomol. Spectrosc. 2021, 263, 120187. [Google Scholar] [CrossRef]
  27. Fonsen, J.; Koskinen, V.; Roth, K.; Kauppinen, J. Dual cantilever enhanced photoacoustic detector with pulsed broadband IR-source. Vib. Spectrosc. 2009, 50, 214–217. [Google Scholar] [CrossRef]
  28. Zhang, X.; Zhang, Y.; Tang, J.; Cui, Z.; Li, Y.; Zhou, H.; Zhang, G.; Yang, J. Optical technology for detecting the decomposition products of SF6: A review. Opt. Eng. 2018, 57, 110901. [Google Scholar] [CrossRef]
Figure 1. Absorption cross section of SO2 in UV range.
Sensors 21 08165 g001
Figure 2. Emission intensity of excimer lamps.
Sensors 21 08165 g002
Figure 3. Schematic diagram of the detection system.
Sensors 21 08165 g003
Figure 4. Absorption spectra of transmission at different concentration of SO2.
Sensors 21 08165 g004
Figure 5. Smoothed spectra at different concentration of SO2.
Sensors 21 08165 g005
Figure 6. Derivative spectra of absorbance at different concentration of SO2.
Sensors 21 08165 g006
Figure 7. Linear fitting between absorbance and concentration.
Sensors 21 08165 g007
Figure 8. Output of the excimer lamp.
Sensors 21 08165 g008
Figure 9. Fluctuation over time of the spectrometer.
Sensors 21 08165 g009
Table 1. Common formula and nominal wavelength of excimer lamp.
FormulaNominal Wavelength
F-Kr220 nm, 248 nm, 272 nm, 275 nm
Cl-Kr200 nm, 222 nm, 240 nm, 235 nm
Br-Kr207 nm, 222 nm, 228 nm
I-Kr190 nm, 195 nm, 206 nm, 225 nm
Table 2. Accuracy of detection system.
Gas SampleDetection Result (μL/L)Gas Concentration (μL/L)Relative Error (%)
13.9 (±23.189%)3.3 (±2.255%)18.1
26.2 (±20.239%)6.4 (±2.255%)3.1
315.5 (±7.026%)15.8 (±2.255%)1.9
484.6 (±2.023%)83.5 (±2.255%)1.3
5126.3 (±1.857%)116.9 (±2.255%)8.0
6139.5 (±3.393%)135.6 (±2.255%)2.9
Table 3. Systematic noise and detection limit of the detection system.
Signal of Gas SampleSystematic NoiseSignal to Noise RatioDetection Limit
0.3103.47 × 10−390.0380.632 μL/L
Table 4. Comparison of the performances of common optical detection methods.
MethodsDetection LimitResponse Speed
UV-DOASSub-ppmFast
UV fluorescenceSub-ppmFast
FTIRppmMedium
PASSub-ppmFast
Proposed detection systemSub-ppmFast
Publisher’s Note: MDPI stays neutral with regard to jurisdictional claims in published maps and institutional affiliations.

