
Refractive Index-Based Terahertz Sensor Using Graphene for Material Characterization

 ,
,  ,
,
Abstract
:1. Introduction
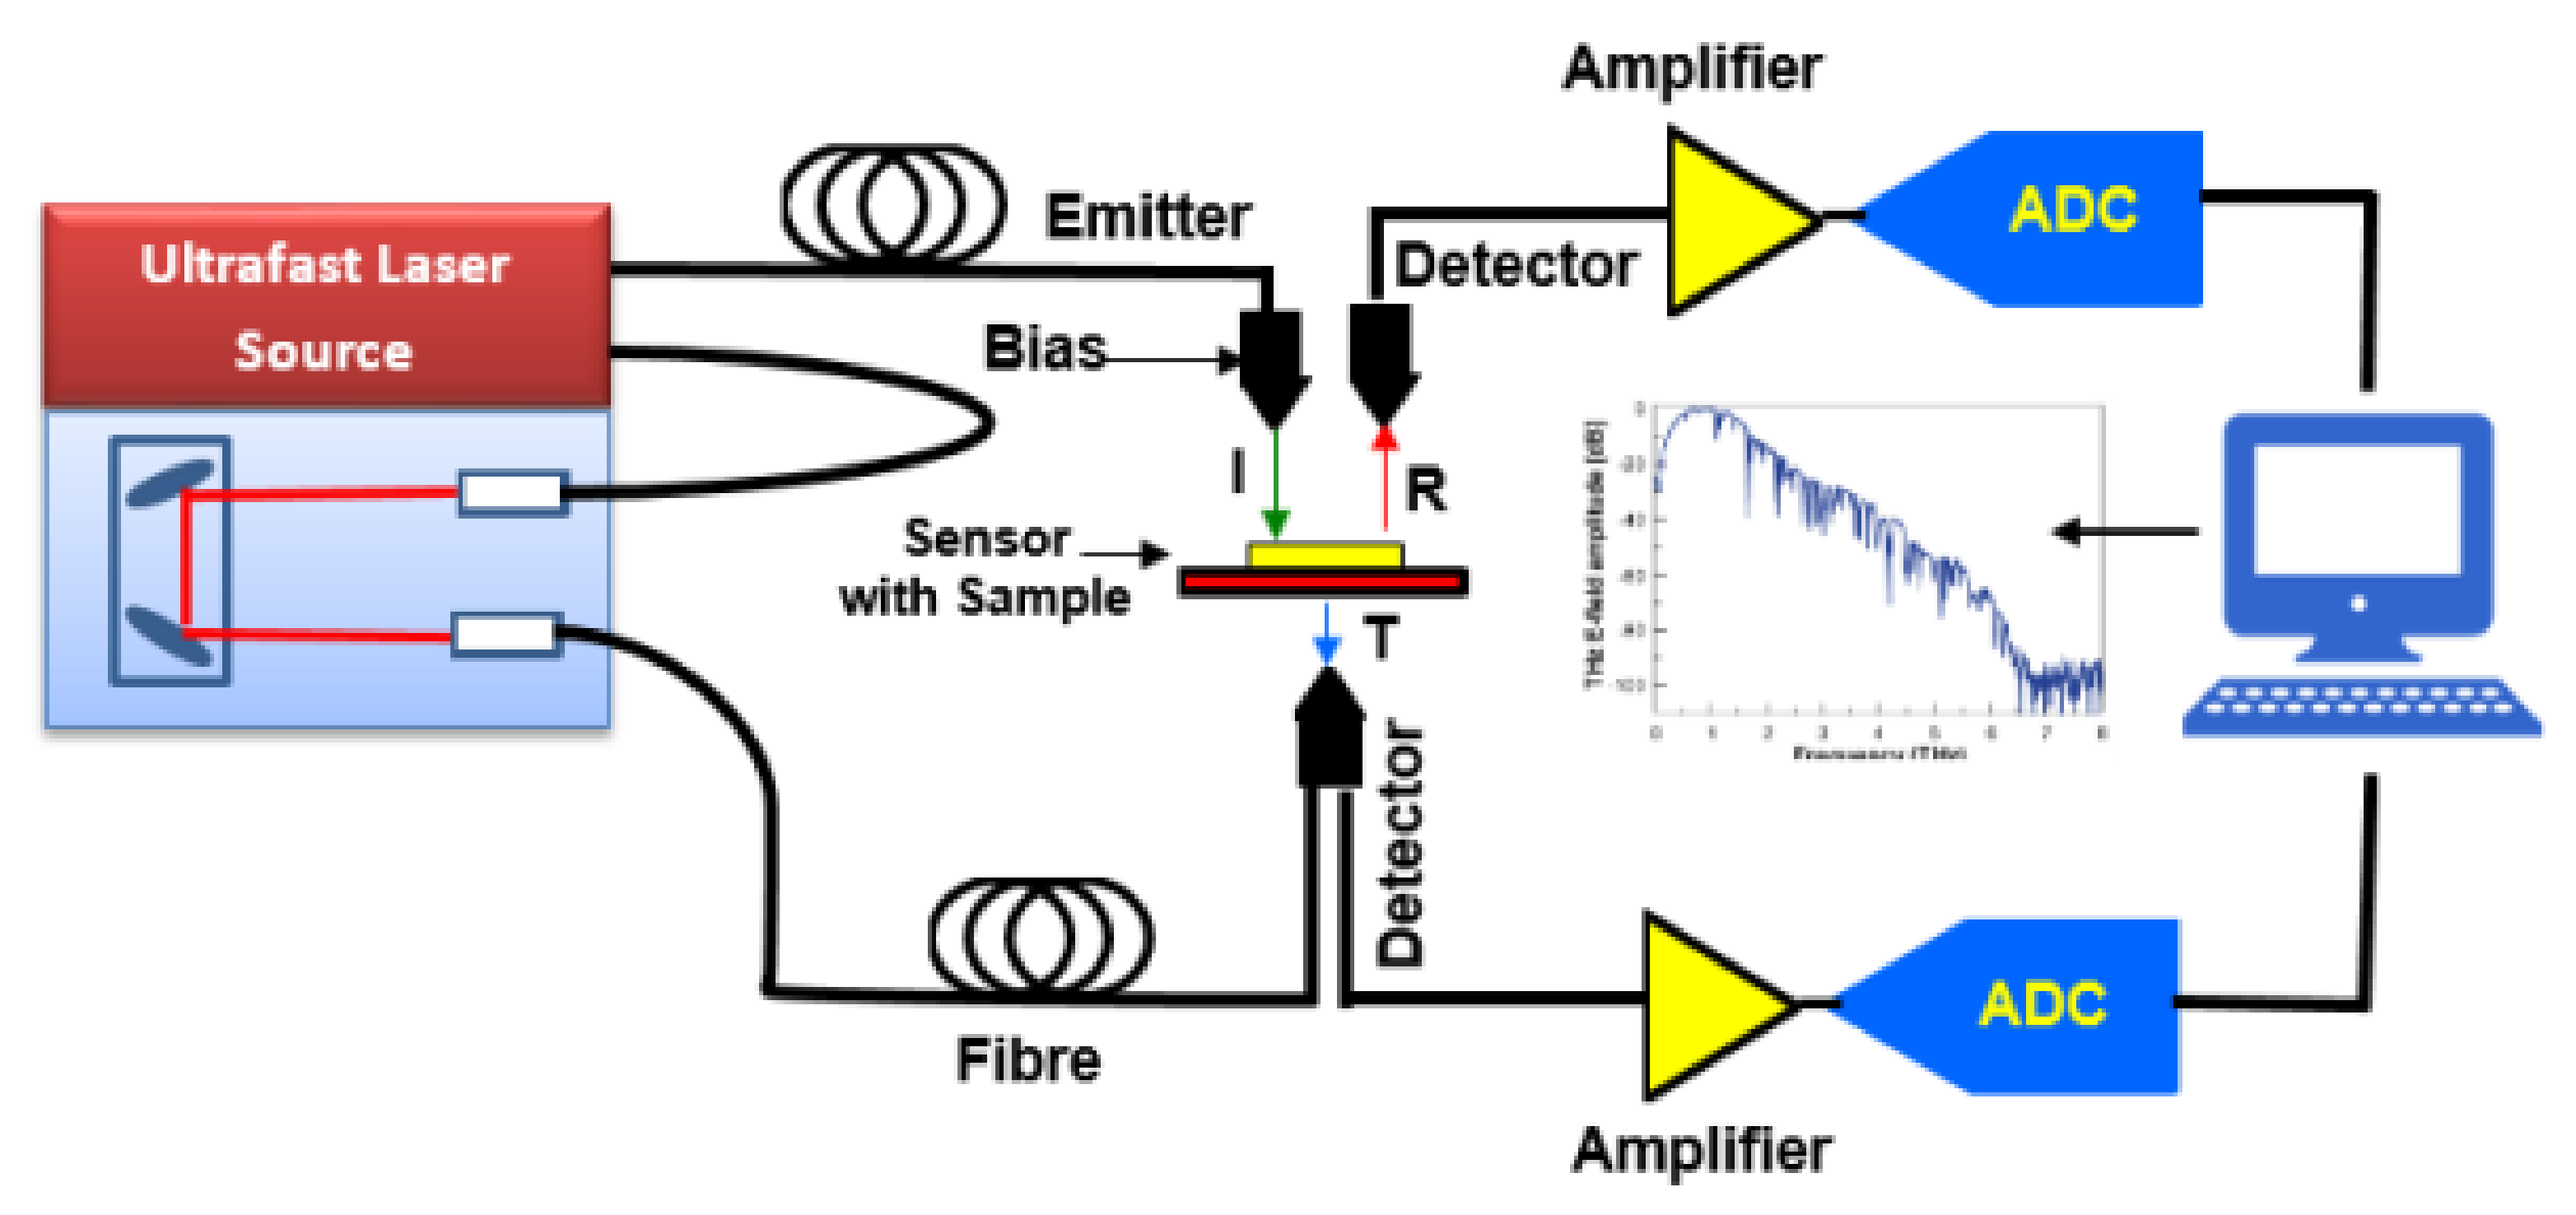
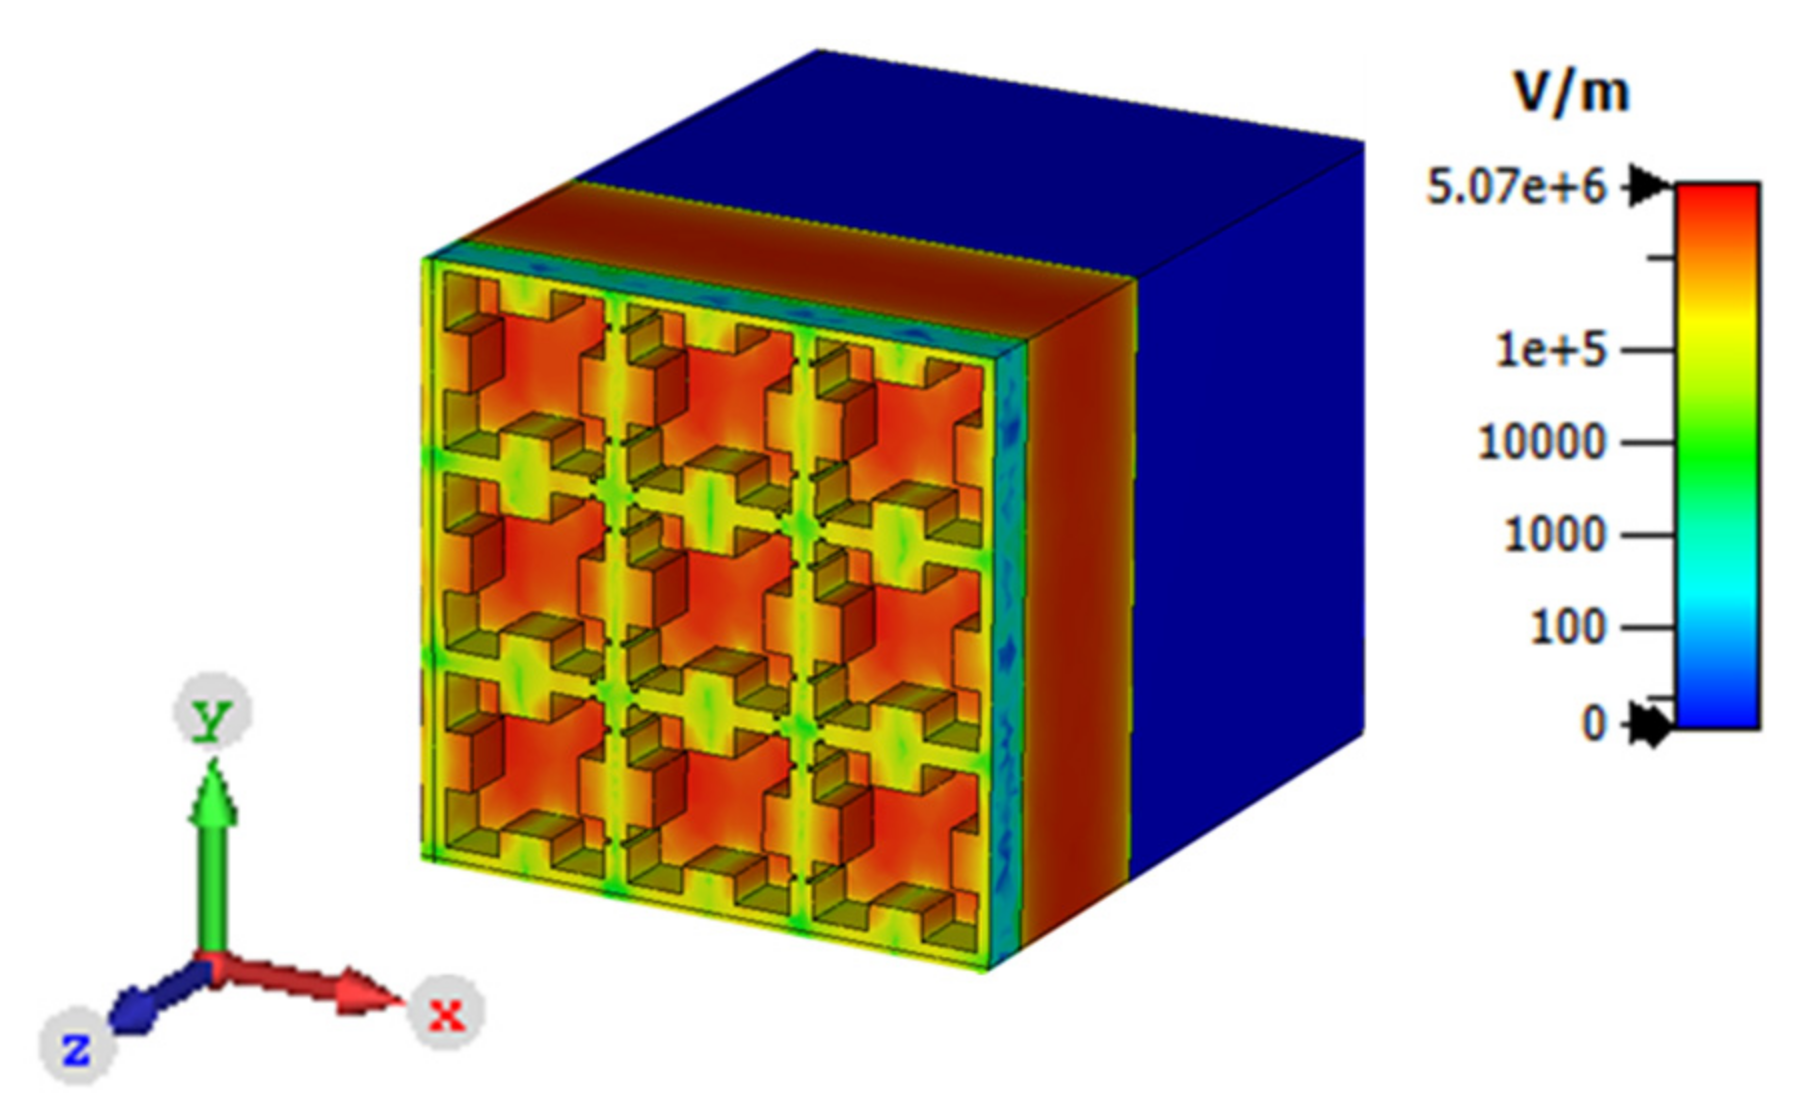
2. Sensor Design
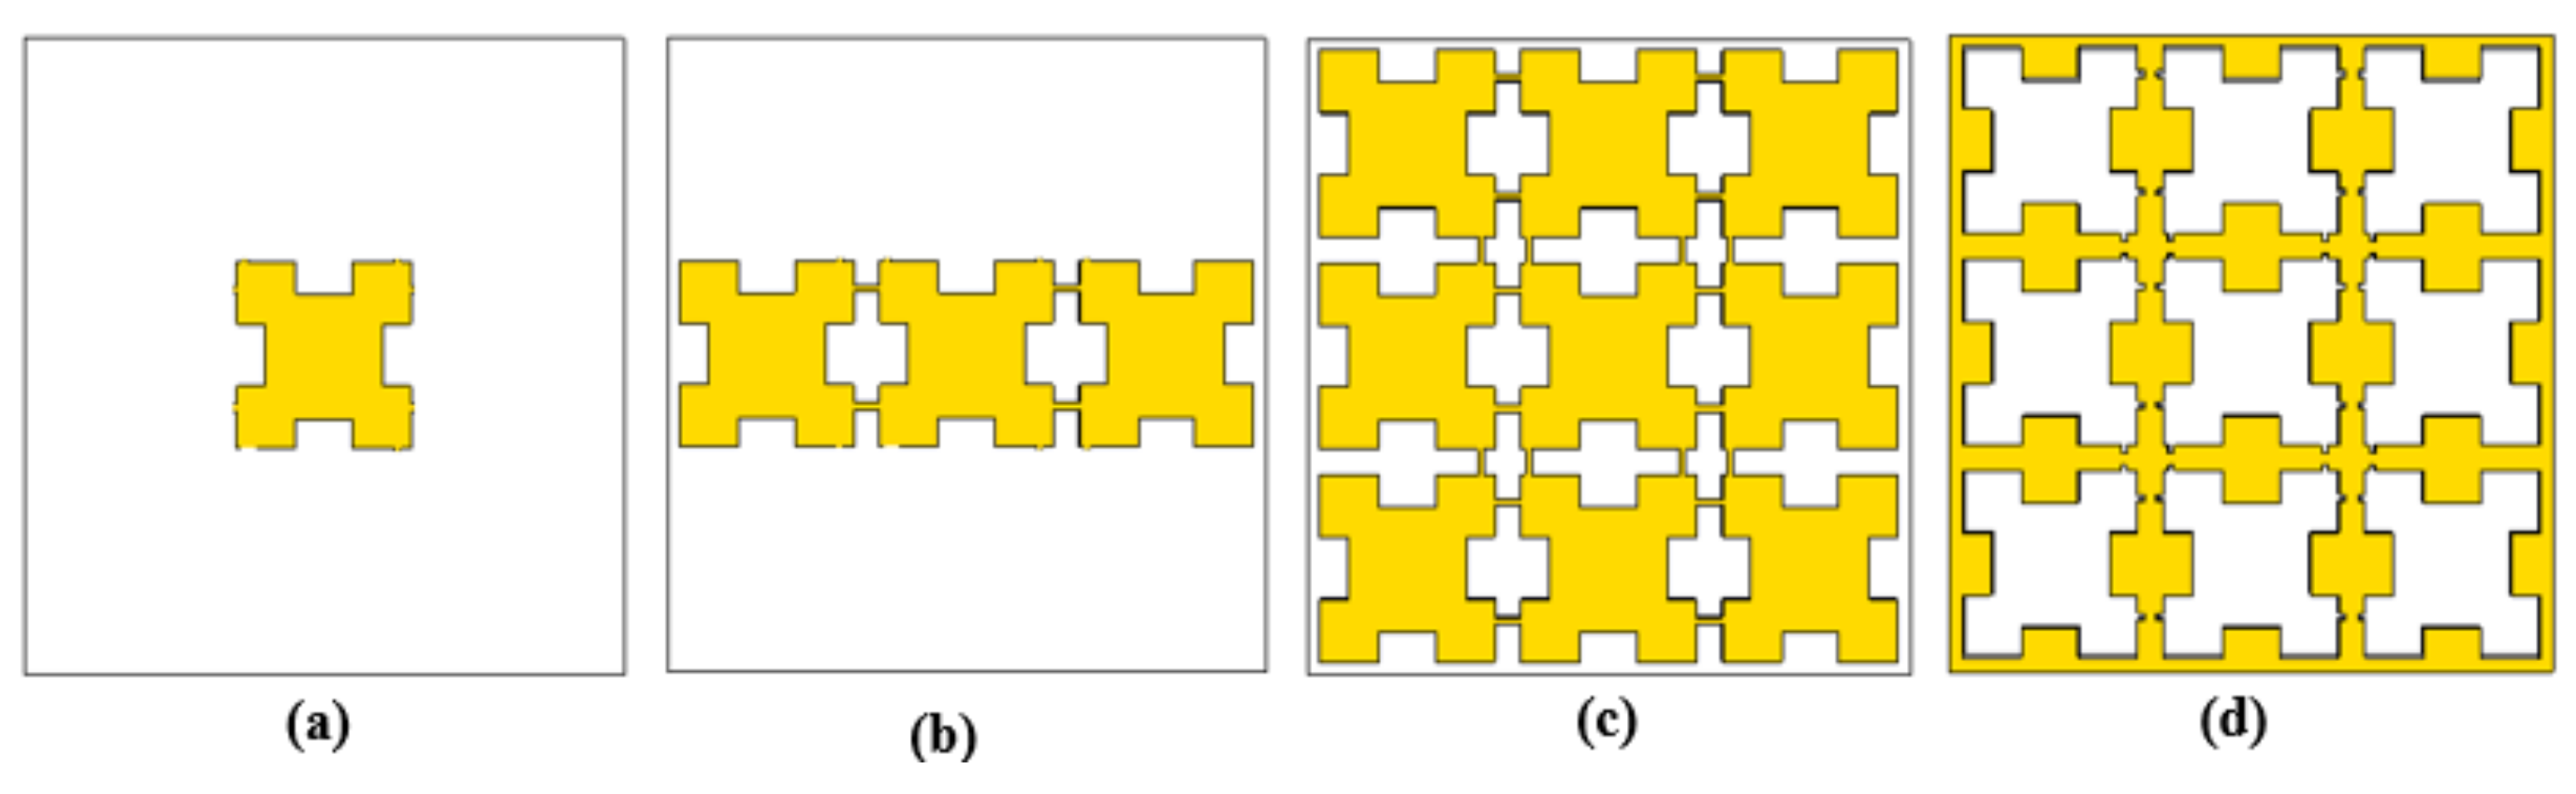
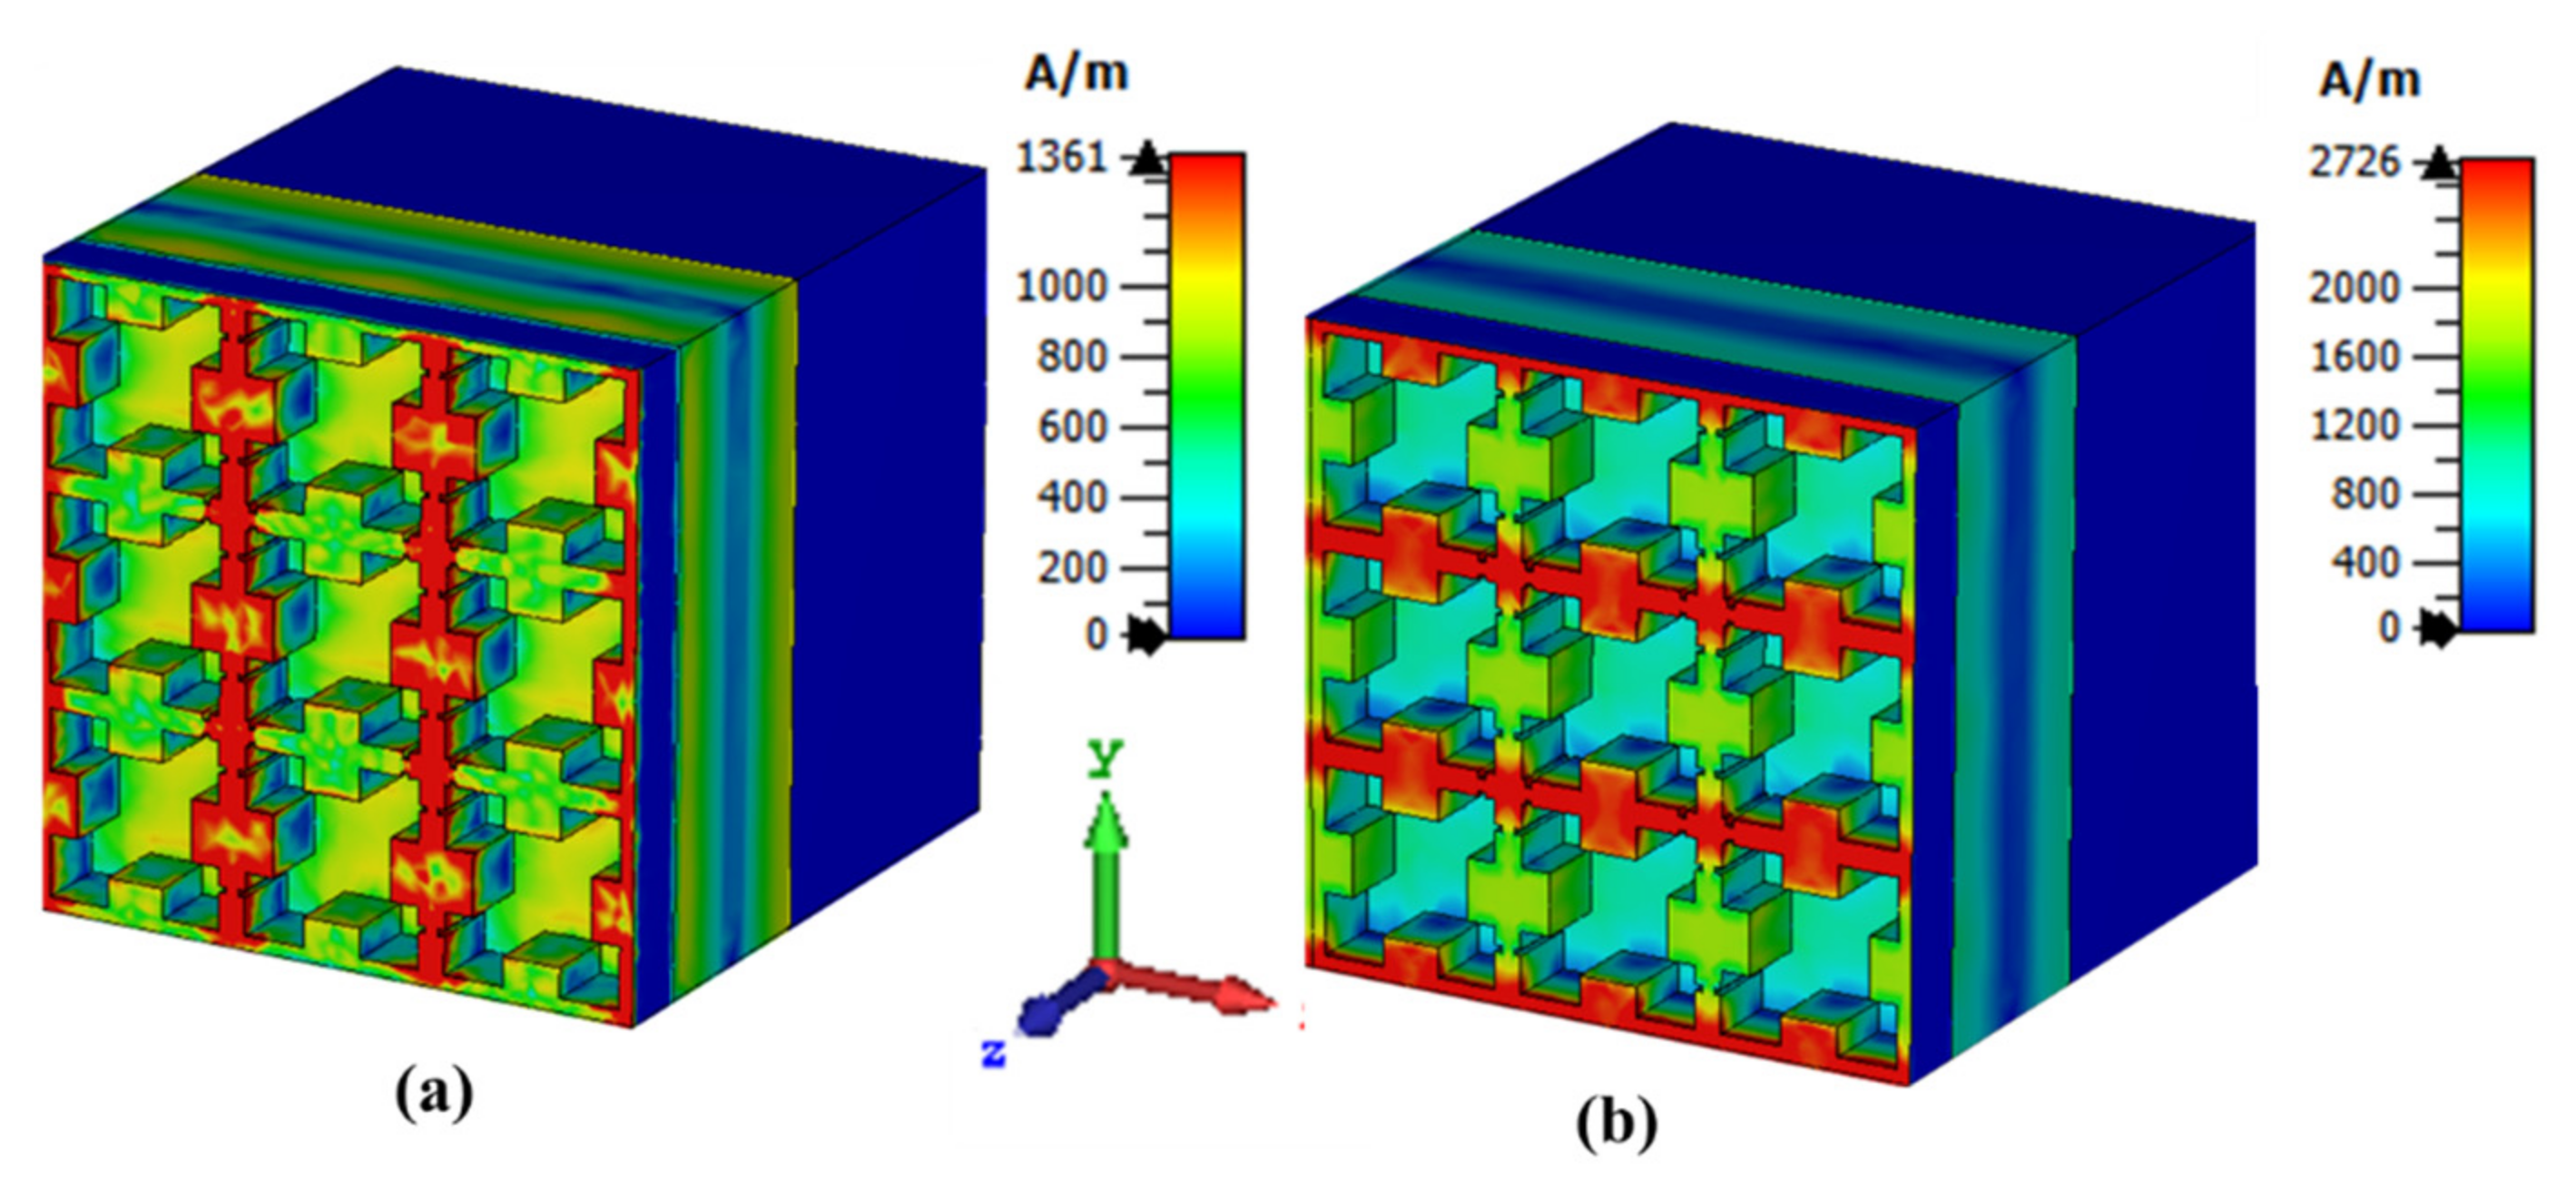
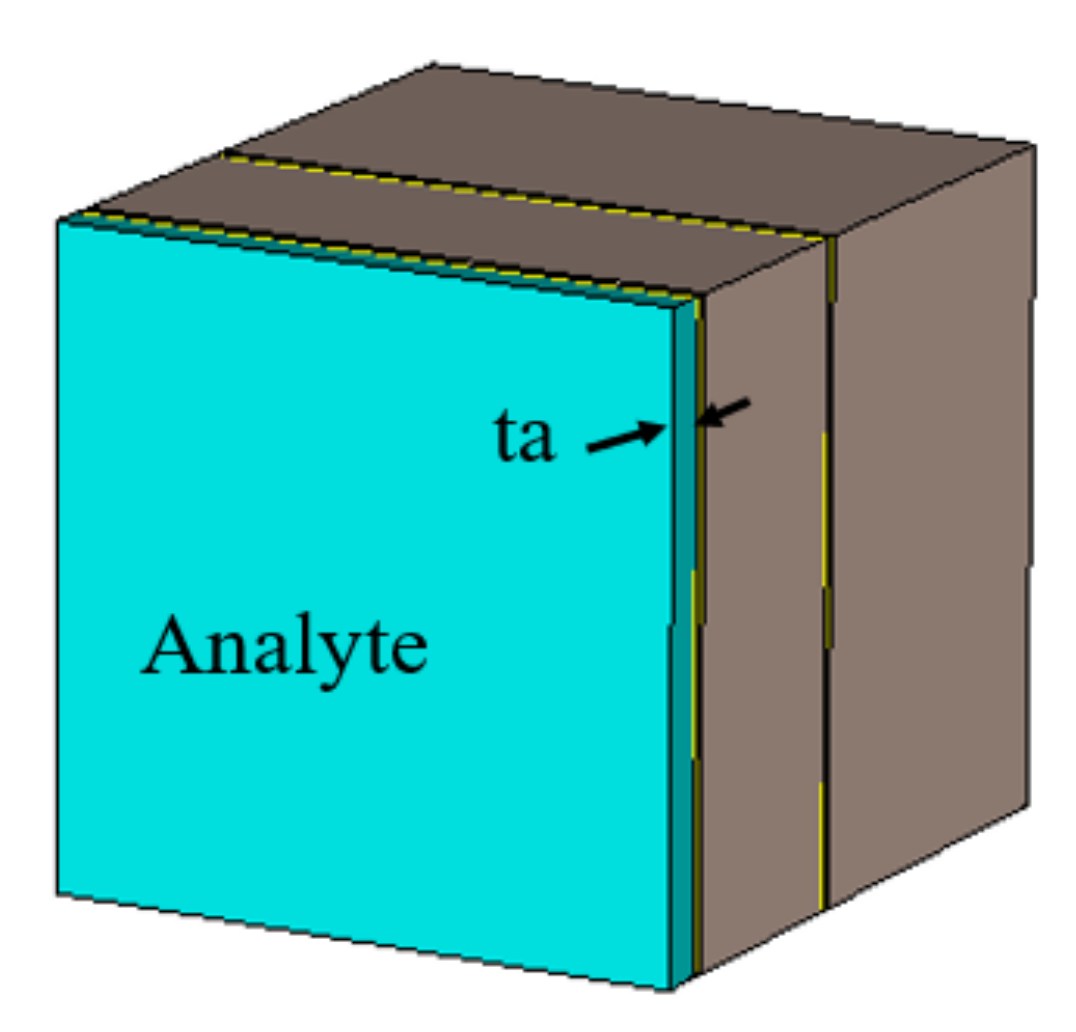
2.1. Construction
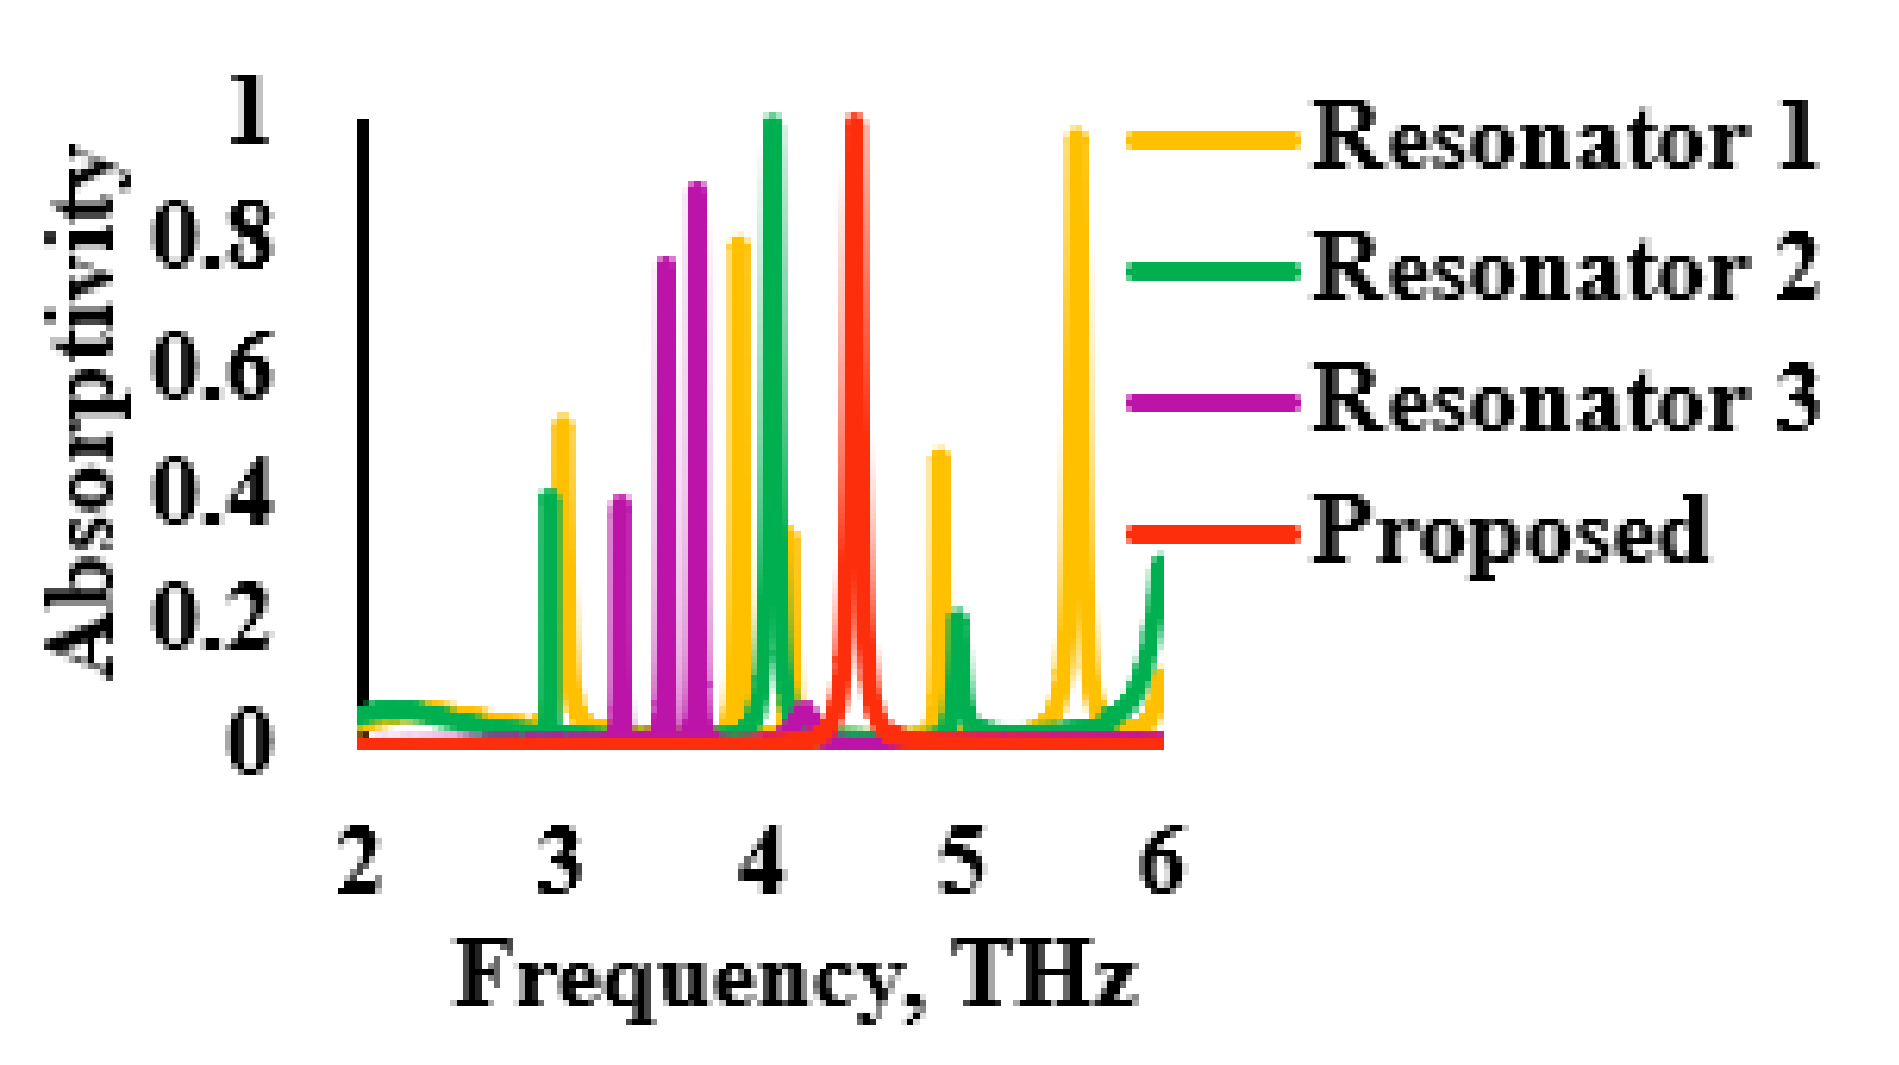
2.2. Evolution
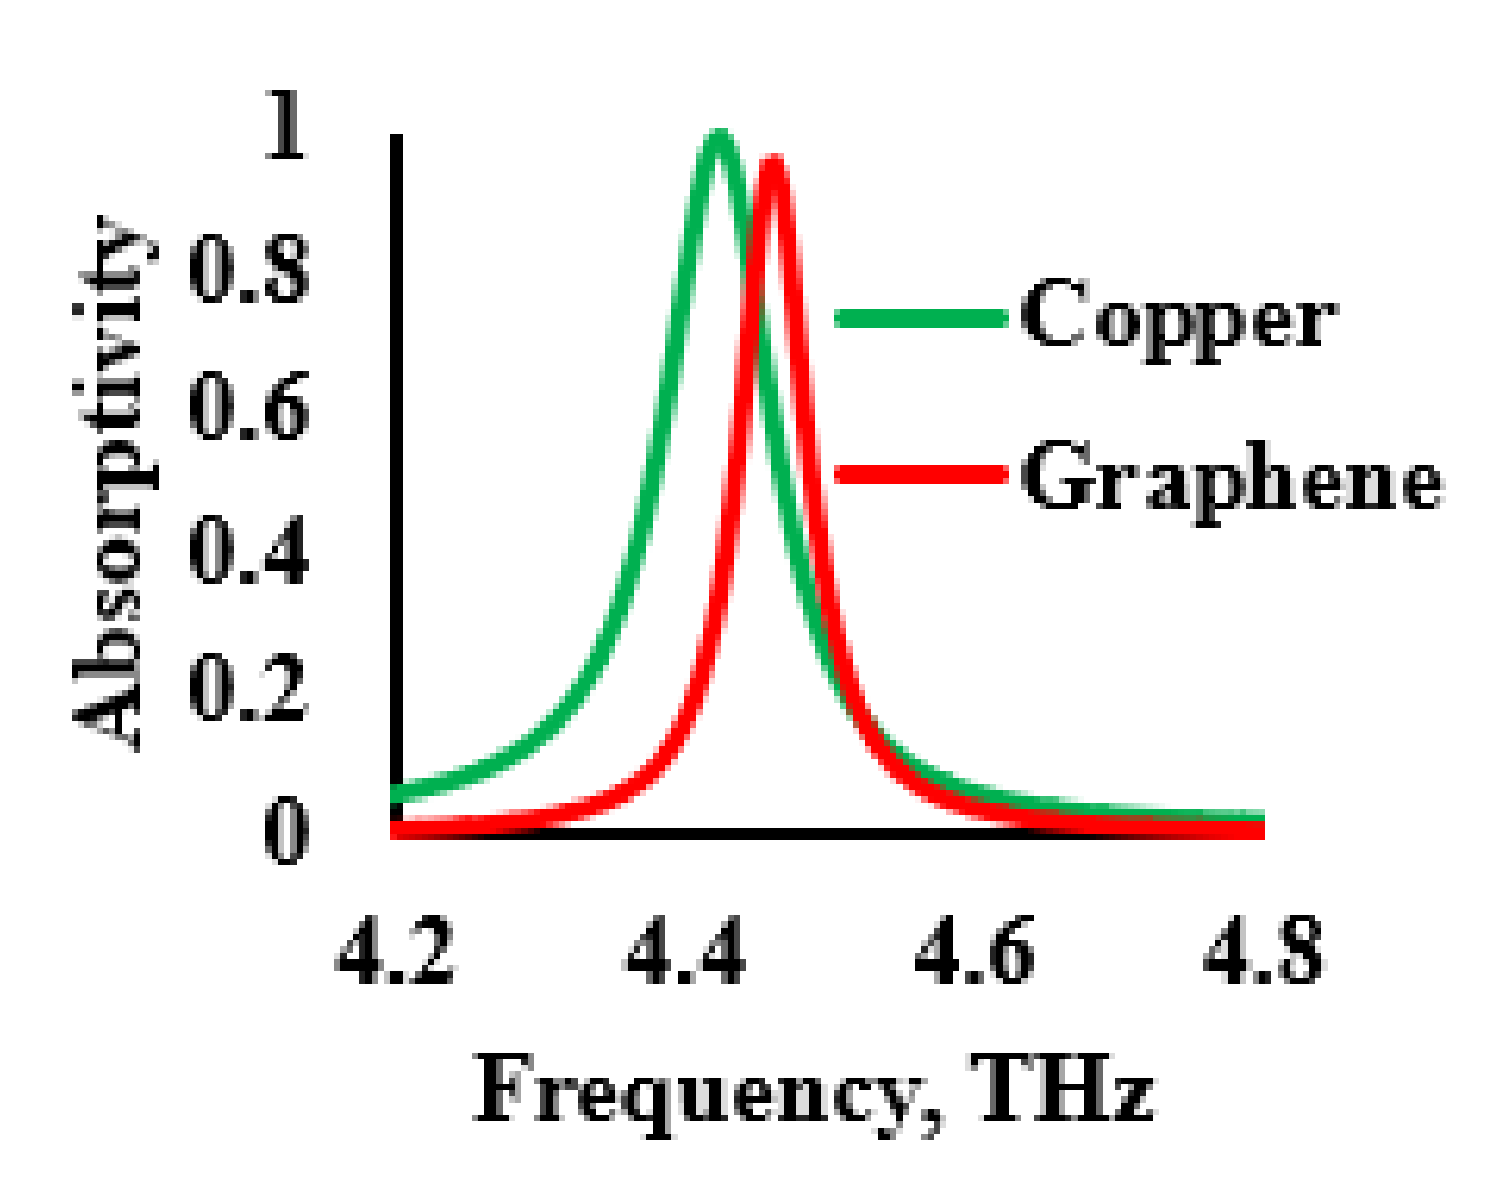
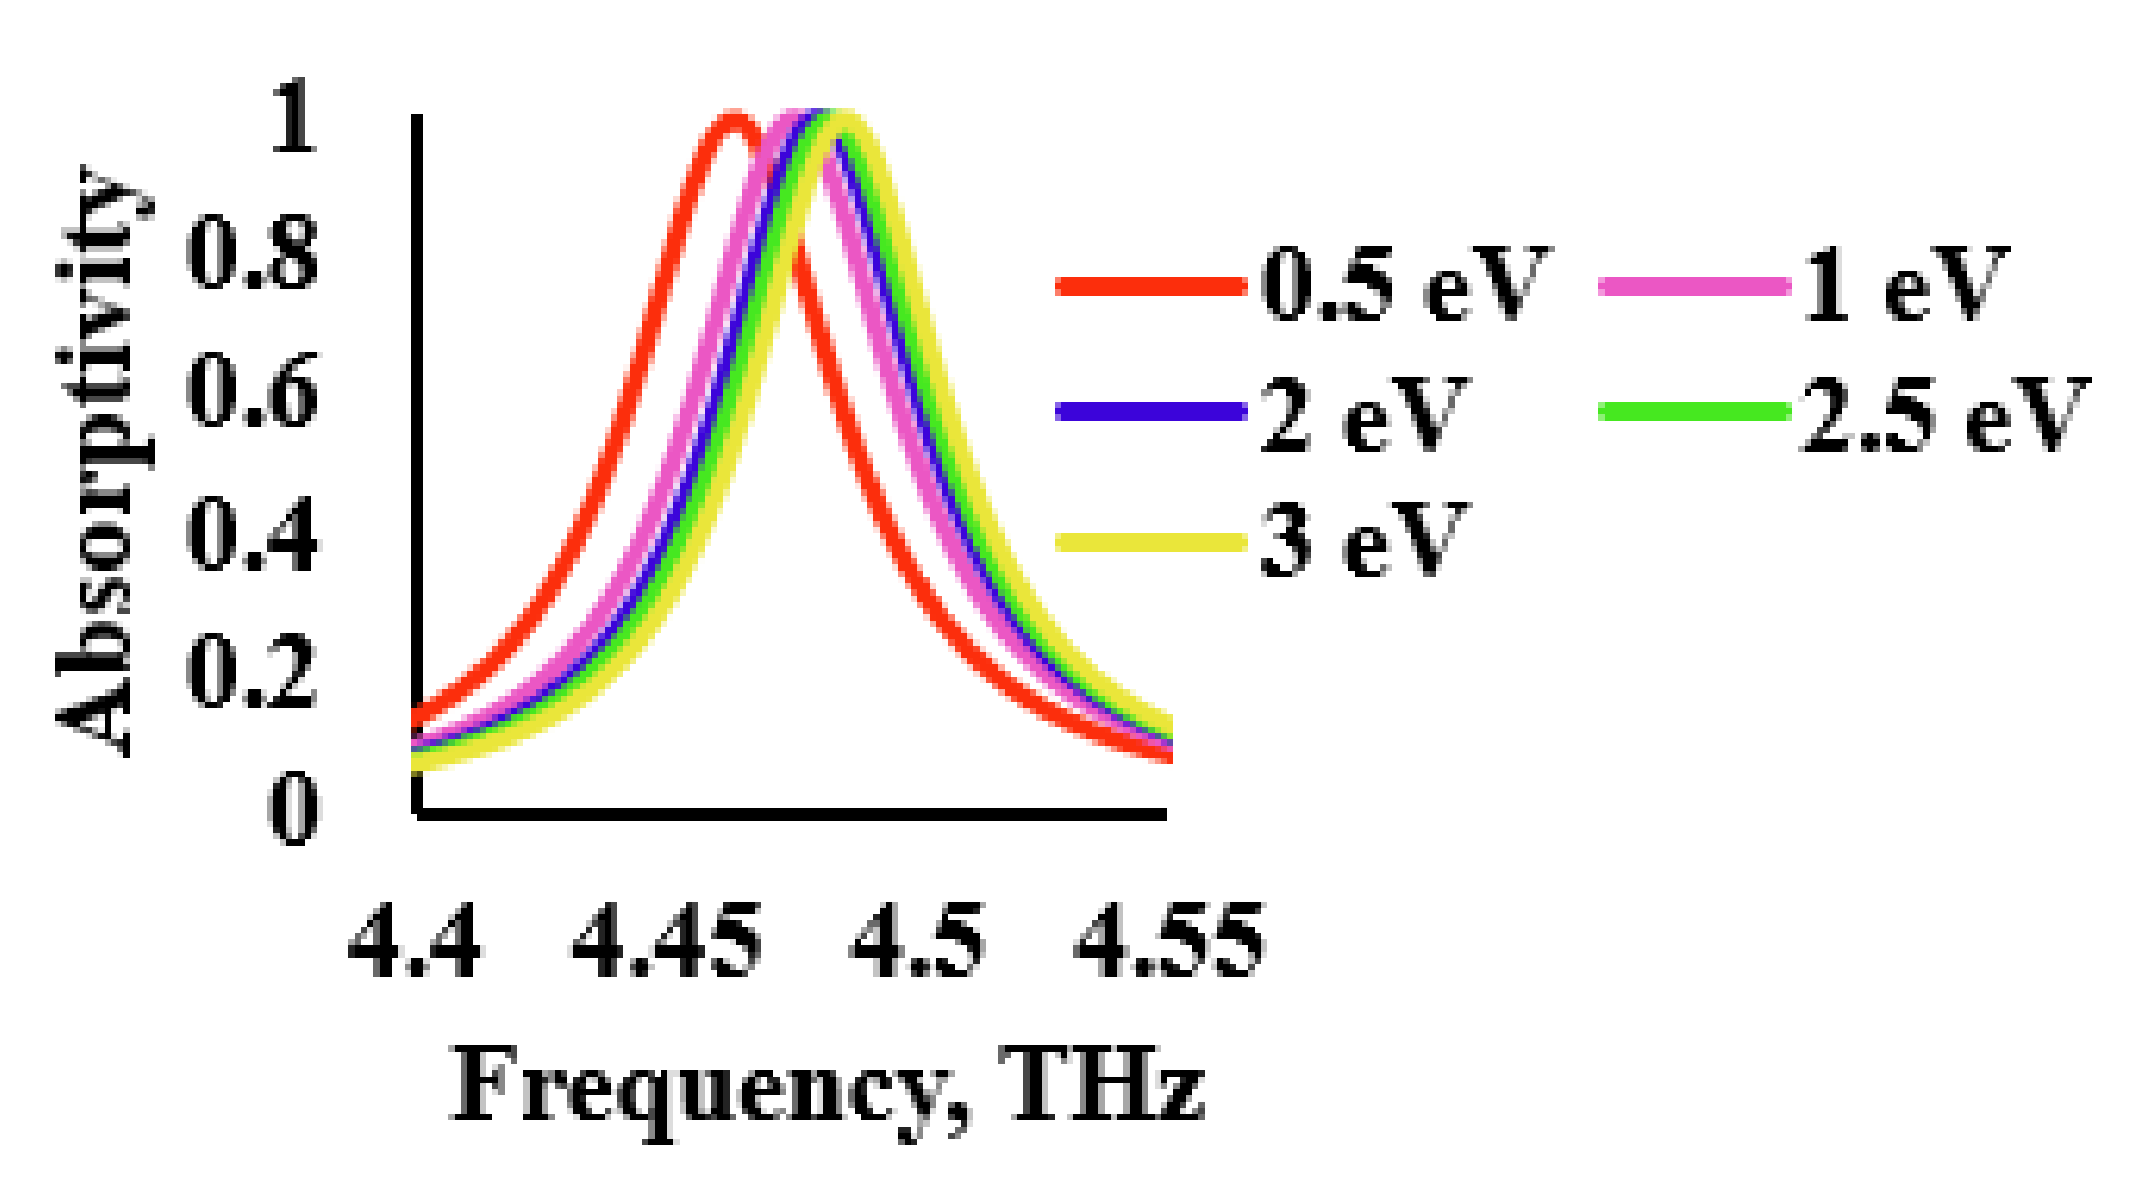
2.3. Influence of External Bias
3. Sensitivity Estimation
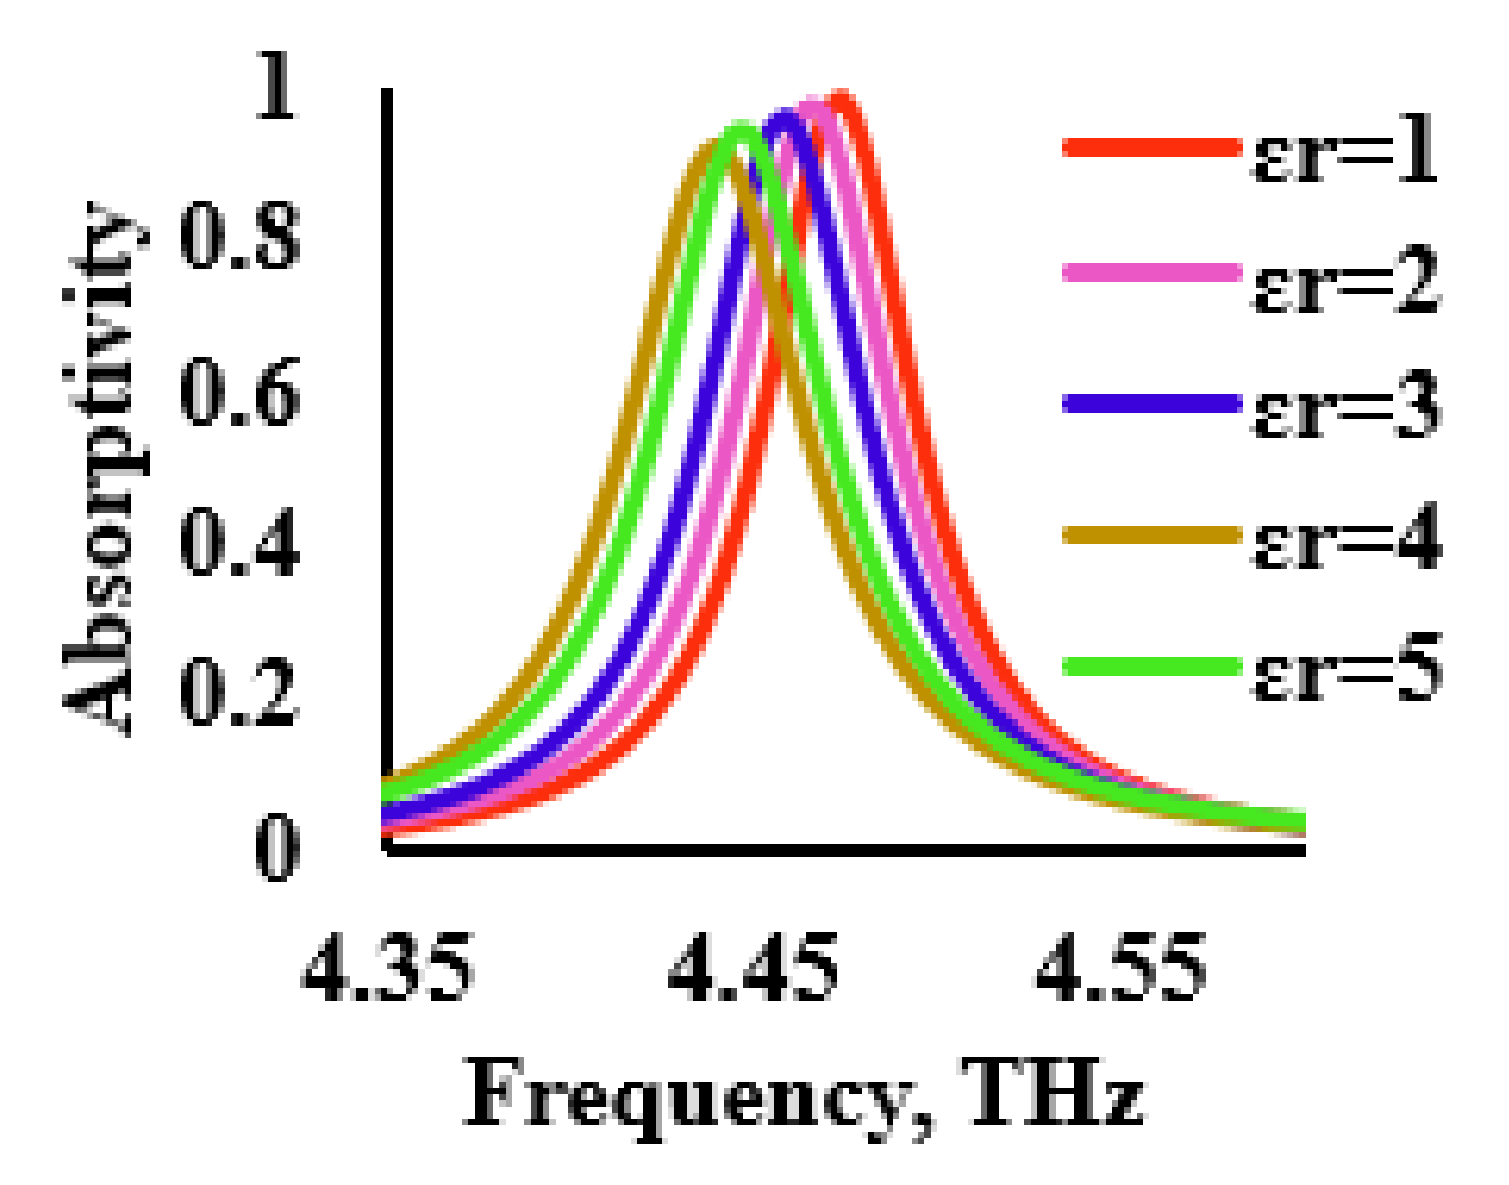
3.1. Effect of Varying Dielectric Constant
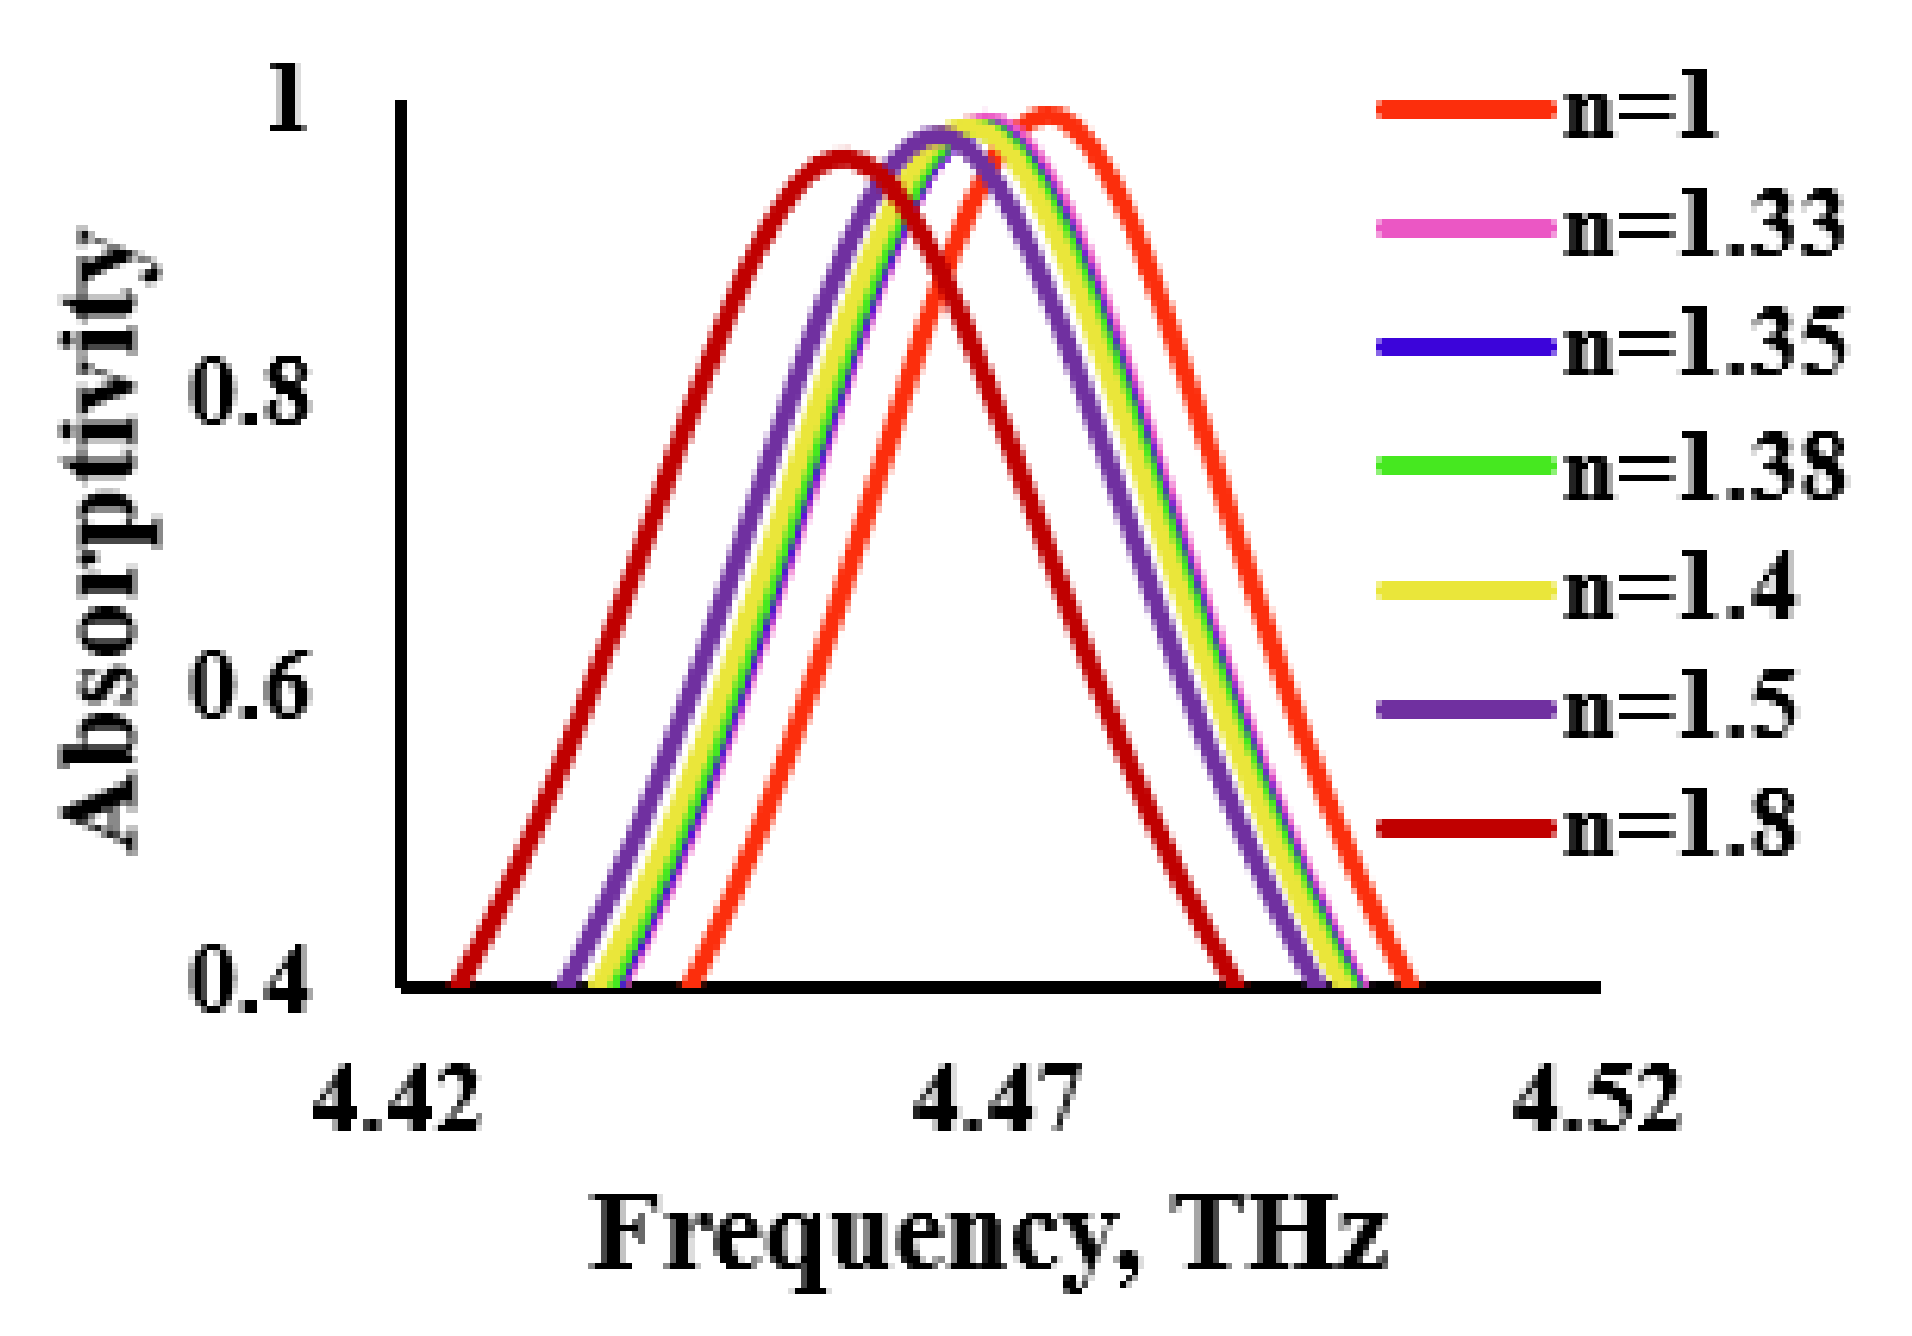
3.2. Effect of Varying Refractive Indices
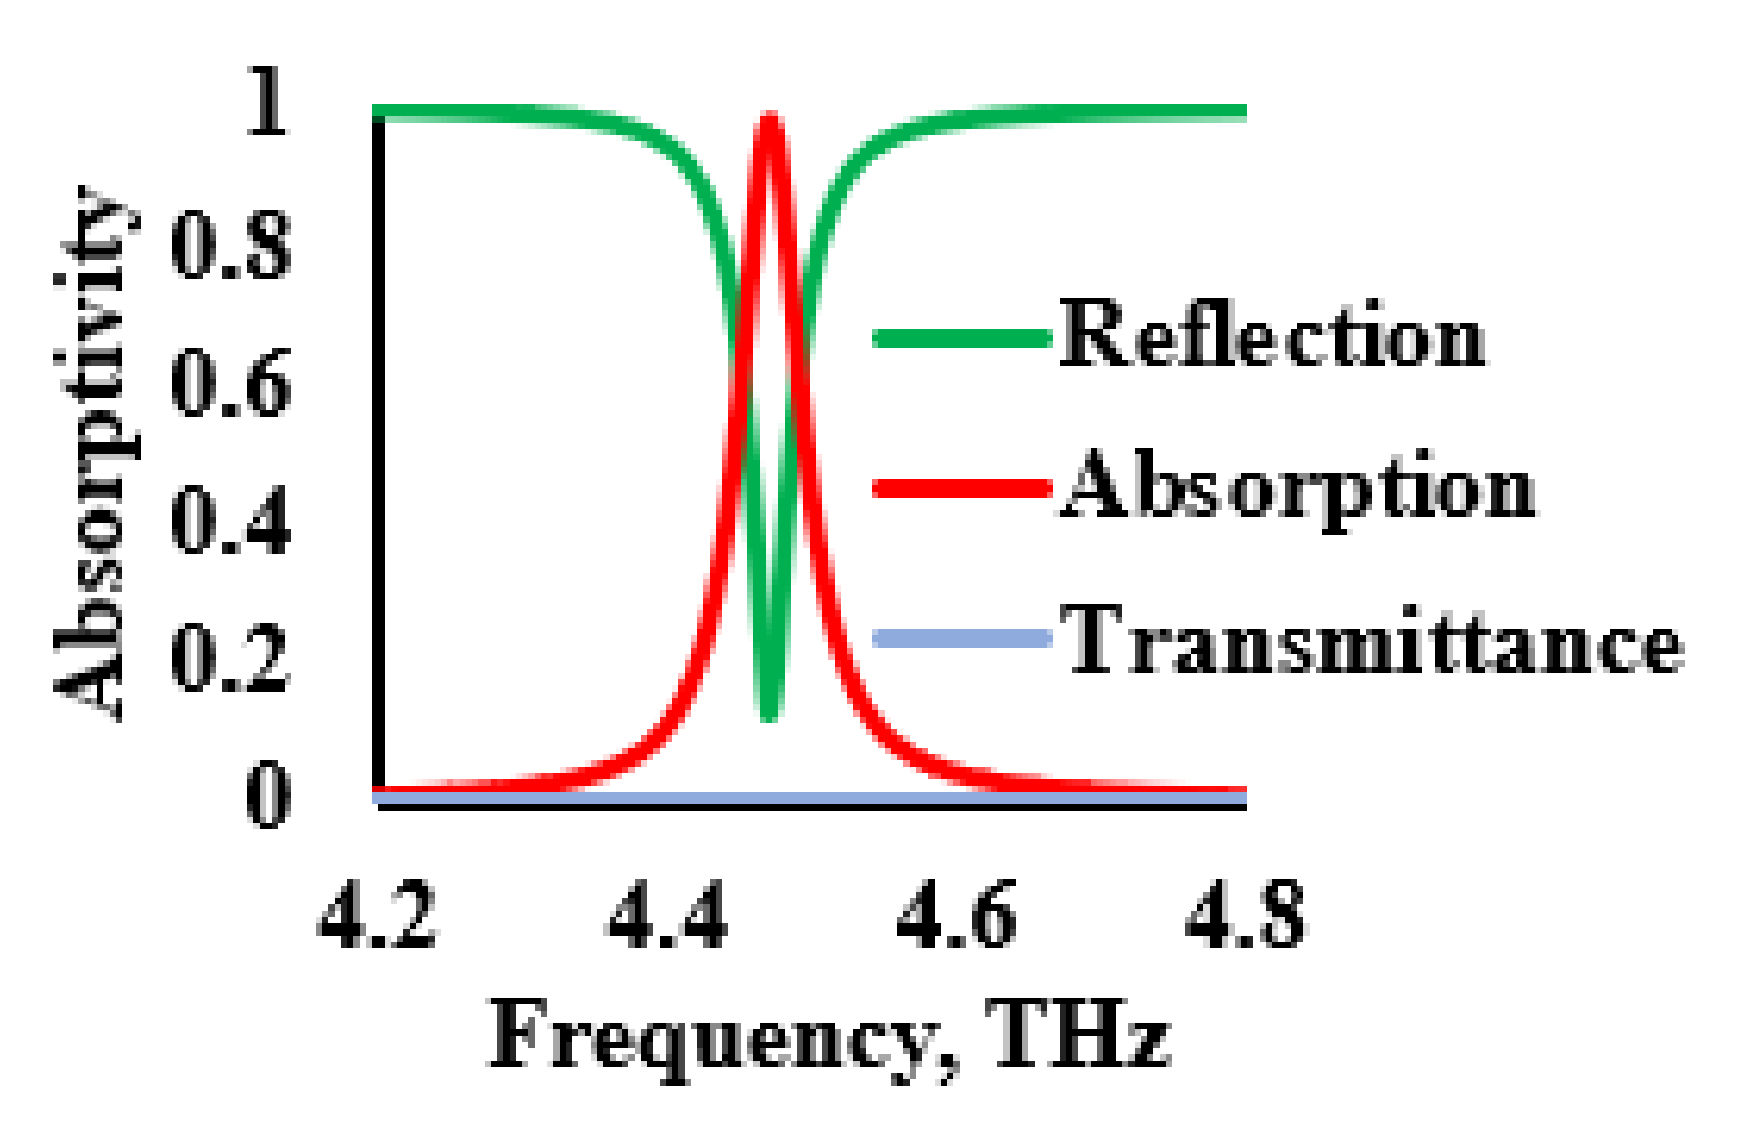
- The proposed sensor showed an average sensitivity of 10 GHz/PU greater than 6.94 GHz/PU [33] for the samples of various dielectric material loading.
- The sensor showed an average change in permittivity of 10 GHz/PU for different materials.
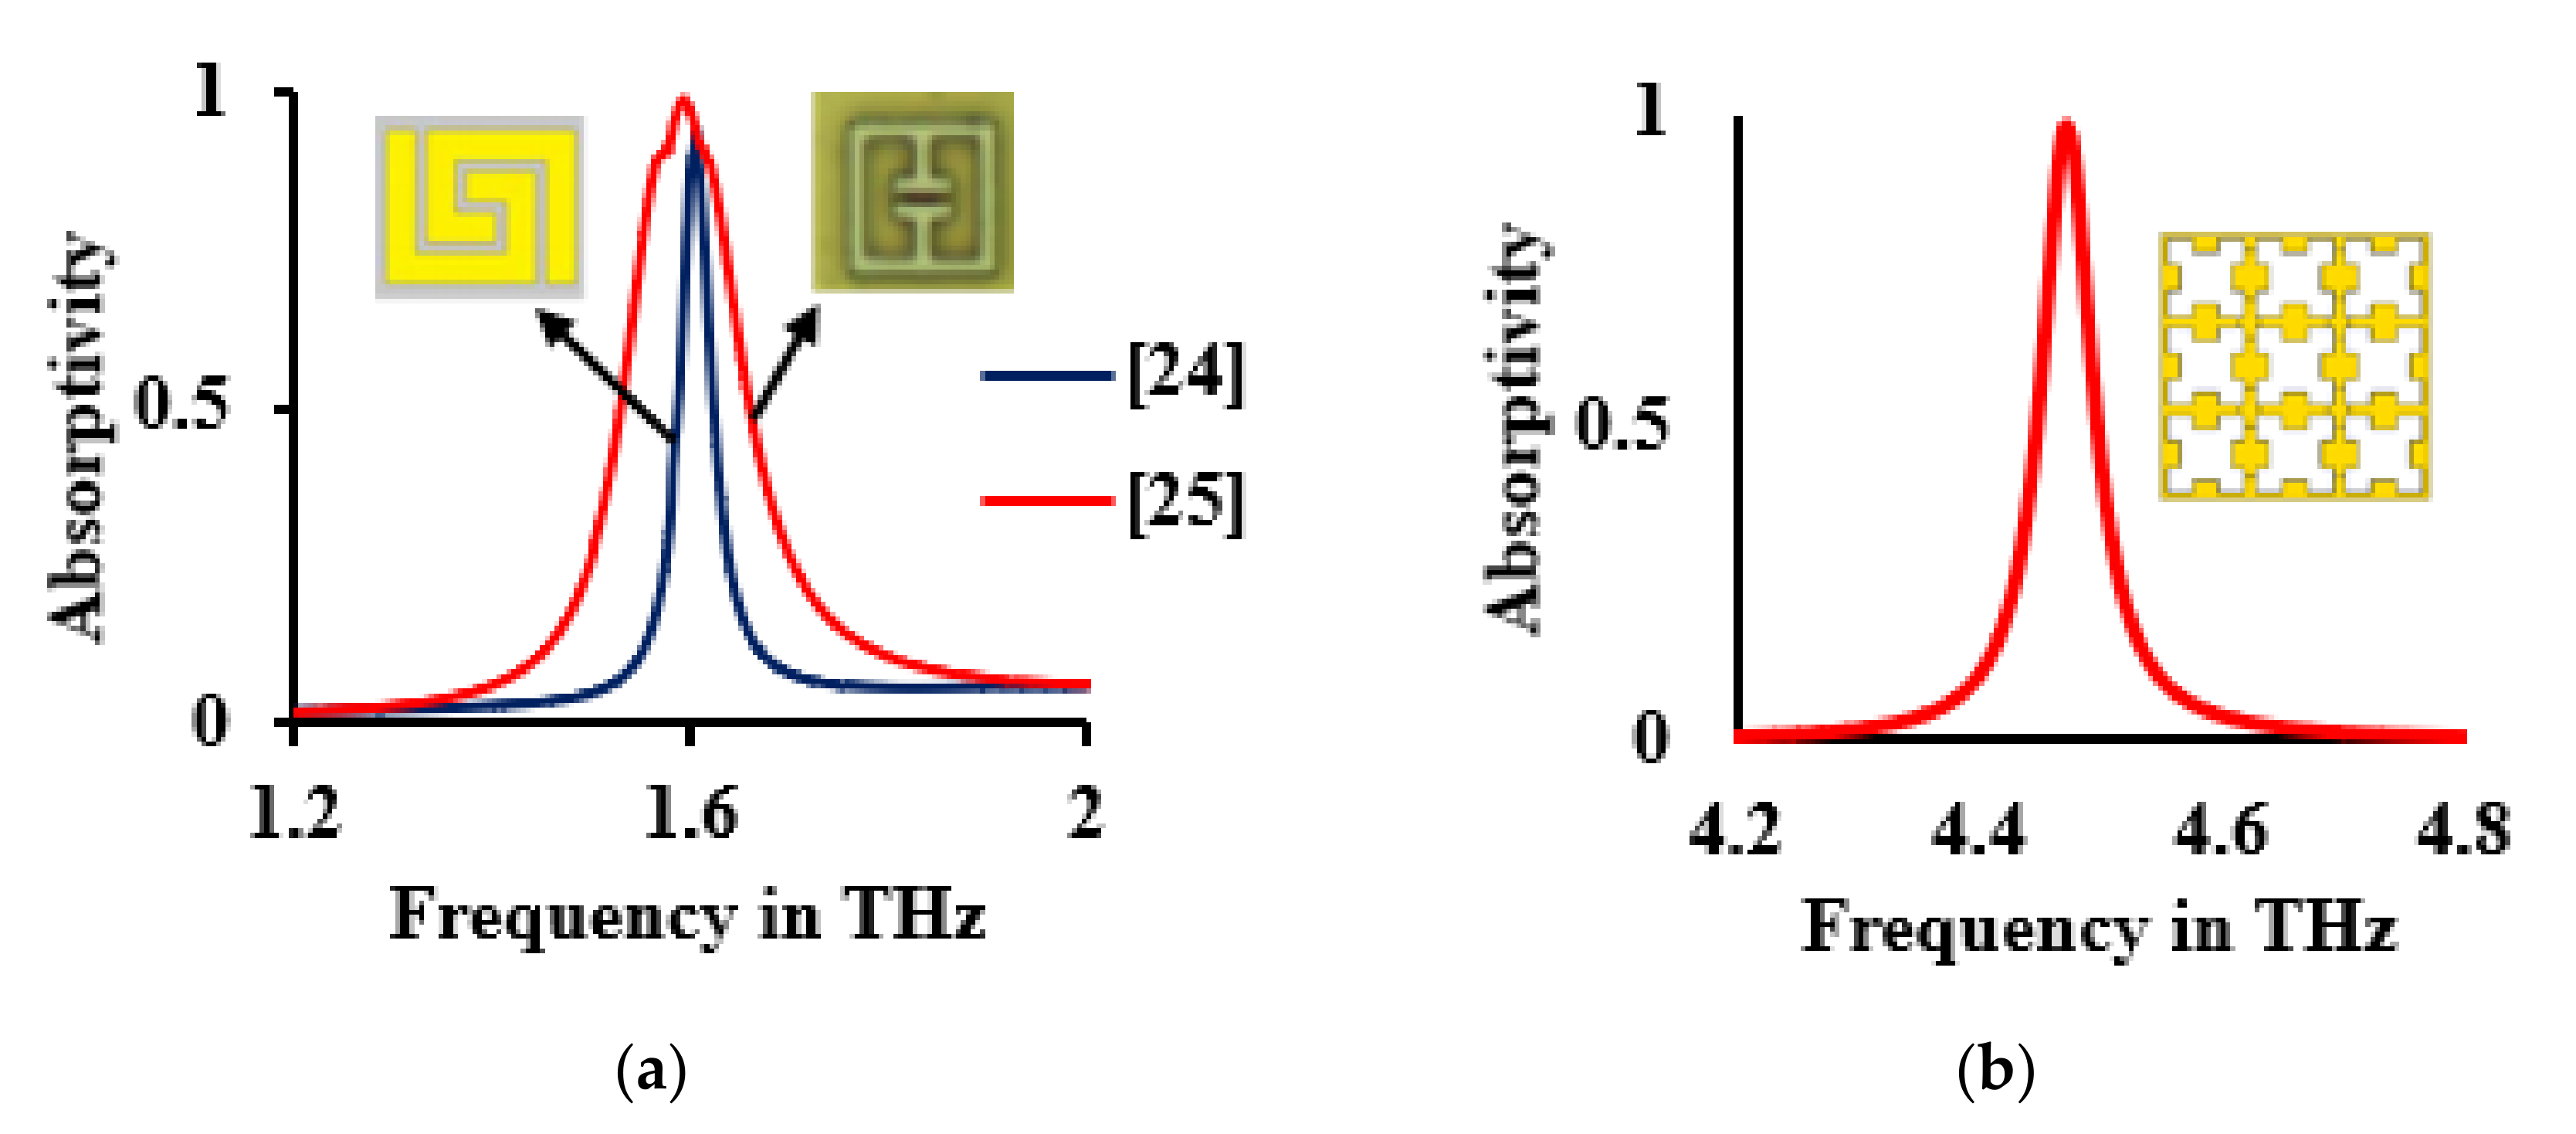
- The peak sensitivity of the proposed sensor was 22.75 GHz/RIU at 4.4754 THz, which is greater than the 14.2 GHz/RIU sensitivity level [23] that was realized for the refractive index loading of 1.8.
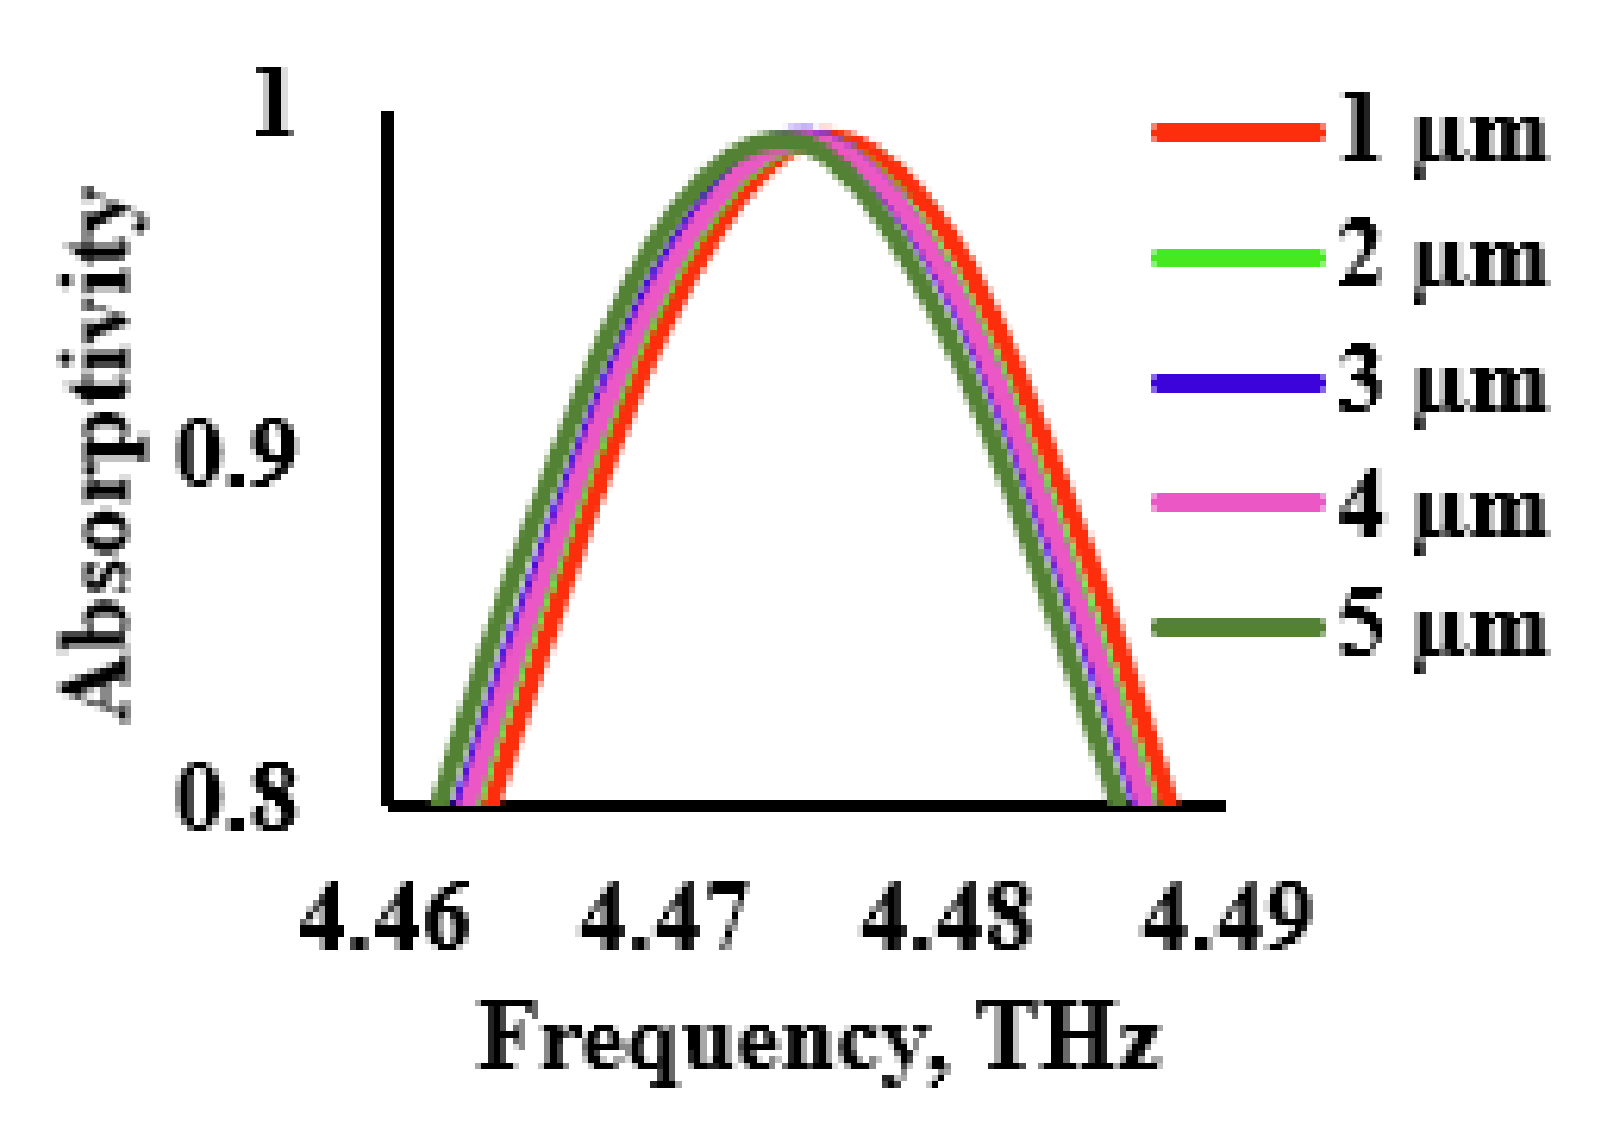
- The proposed sensor offered a detuning of 1 GHz/µm for samples of different thicknesses. This is a minimal deviation in comparison with the results of the research that was presented in [34].
- Graphene was used in the present research in order to improve the tunability of the proposed sensor, unlike [9] which used gold as the conducting layer.
4. Conclusions
Author Contributions
Funding
Conflicts of Interest
References
- Nejat, M.; Nozhat, N. Ultrasensitive THz Refractive Index Sensor Based on a Controllable Perfect MTM Absorber. IEEE Sens. J. 2019, 19, 10490–10497. [Google Scholar] [CrossRef]
- Gui, S.; Li, J.; Pi, Y. Security Imaging for Multi-Target Screening Based on Adaptive Scene Segmentation with Terahertz Radar. IEEE Sens. J. 2018, 19, 2675–2684. [Google Scholar] [CrossRef]
- Ajito, K. Terahertz Spectroscopy for Pharmaceutical and Biomedical Applications. IEEE Trans. Terahertz Sci. Technol. 2015, 5, 1140–1145. [Google Scholar]
- Tao, Y.H.; Fitzgerald, A.J.; Wallace, V.P. Non-Contact, Non-Destructive Testing in Various Industrial Sectors with Terahertz Technology. Sensors 2020, 20, 712. [Google Scholar] [CrossRef] [Green Version]
- Ahmed, K.; Ahmed, F.; Roy, S.; Paul, B.K.; Aktar, M.N.; Vigneswaran, D.; Islam, S. Refractive Index-Based Blood Components Sensing in Terahertz Spectrum. IEEE Sens. J. 2019, 19, 3368–3375. [Google Scholar] [CrossRef]
- Tao, H.; Landy, N.I.; Bingham, C.M.; Zhang, X.; Averitt, R.D.; Padilla, W.J. A metamaterial absorber for the terahertz regime: Design, fabrication and characterization. Opt. Express 2008, 16, 7181–7188. [Google Scholar] [CrossRef] [PubMed]
- Landy, N.I.; Sajuyigbe, S.; Mock, S.S.; Smith, D.R.; Padilla, W.J. Perfect Metamaterial Absorber. Phys. Rev. Lett. 2008, 100, 207402. [Google Scholar] [CrossRef] [PubMed]
- Ma, A.; Zhong, R.; Wu, Z.; Wang, Y.; Yang, L.; Liang, Z.; Fang, Z.; Liu, S. Ultrasensitive THz Sensor Based on Centrosymmetric F-Shaped Metamaterial Resonators. Front. Phys. 2020, 8, 584639. [Google Scholar] [CrossRef]
- Shoieb, A.; Nourinia, J.; Ghoabdi, C.; Karamirad, M.; Mohammadi, B. A Triple-Band THz Metamaterial Absorber Based on Symmetrical Split Rings. In Proceedings of the 5th Conference on Knowledge Based Engineering and Innovation, Tehran, Iran, 28 February–1 March 2019; pp. 042–045. [Google Scholar]
- Wang, B.X.; Zhai, X.; Wang, G.Z.; Huang, W.-Q.; Wang, L.L. Design of a Four-Band and Polarization-Insensitive Terahertz Metamaterial Absorber. IEEE Photonics J. 2014, 7, 1–8. [Google Scholar] [CrossRef]
- Wang, B.X.; Wang, G.Z.; Wang, L.L.; Zhai, X. Design of a Five-Band Terahertz Absorber Based on Three Nested Split-Ring Resonators. IEEE Photonics Technol. Lett. 2016, 28, 307–310. [Google Scholar] [CrossRef]
- You, B.; Lu, J.Y.; Yu, C.P.; Liu, T.A.; Peng, J.L. Terahertz refractive index sensors using dielectric pipe waveguides. Opt. Express 2012, 20, 5858. [Google Scholar] [CrossRef] [PubMed]
- Bae, J.; Sugawara, T.; Tsunekawa, T.; Suzuki, H. An Oscillator-Based Sensor using a Capacitive Metal Mesh for Sensitive Detection of Dielectric Materials in the Terahertz Region. IEICE Electron. Express 2018, 15, 20180619. [Google Scholar] [CrossRef]
- Wang, Y.; Cheng, W.; Qin, J.; Han, Z. Terahertz Refractive Index Sensor Based on the Guided Resonance in a Photonic Crystal Slab. Opt. Commun. 2019, 434, 163–166. [Google Scholar] [CrossRef]
- Tassin, P.; Koschny, T.; Soukoulis, C.M. Graphene for Terahertz Applications. Science 2013, 341, 620–621. [Google Scholar] [CrossRef] [Green Version]
- Song, J.; Xu, Y.; Ling, D.; Wei, D.; Yang, C.; Shen, Y. Graphene-based Tunable Terahertz Metamaterial Absorber with High Absorptivity. In Proceedings of the IEEE International Conference on Manipulation, Manufacturing and Measurement on the Nanoscale, Hangzhou, China, 13–17 August 2018; IEEE: Piscataway, NJ, USA, 2018; pp. 232–236. [Google Scholar]
- Jain, P.; Garg, S.; Singh, A.K.; Bansal, S.; Prakash, K.; Gupta, N.; Singh, A.K.; Sharma, N.; Kumar, S.; Sardana, N. Dual Band Graphene Based Metamaterial Absorber for Terahertz Applications. In Proceedings of the IEEE 13th Nanotechnology Materials and Devices Conference, Portland, OR, USA, 14–17 October 2018; pp. 1–4. [Google Scholar]
- Veeraselvam, A.; Mohammed, G.N.A.; Savarimuthu, K. A Novel Ultra-Miniaturized Highly Sensitive Refractive Index-Based Terahertz Biosensor. J. Light. Technol. 2021, 39, 7281–7287. [Google Scholar] [CrossRef]
- Veeraselvam, A.; Mohammed, G.N.A.; Savarimuthu, K.; Sankararajan, R. A novel multi-band biomedical sensor for THz regime. Opt. Quantum Electron. 2021, 53, 1–20. [Google Scholar] [CrossRef]
- Cen, C.; Zhang, Y.; Chen, X.; Yang, H.; Yi, Z.; Yao, W.; Tang, Y.; Yi, Y.; Wang, J.; Wu, P. A dual-band metamaterial absorber for graphene surface plasmon resonance at terahertz frequency. Phys. E Low-Dimens. Syst. Nanostruct. 2019, 117, 113840. [Google Scholar] [CrossRef]
- Teng, D.; Wang, K. Theoretical Analysis of Terahertz Dielectric–Loaded Graphene Waveguide. Nanomaterials 2021, 11, 210. [Google Scholar] [CrossRef] [PubMed]
- Maghoul, A.; Rostami, A.; Gnanakulasekaran, N.; Balasingham, I. Design and Simulation of Terahertz Perfect Absorber with Tunable Absorption Characteristic Using Fractal-Shaped Graphene Layers. Photonics 2021, 8, 375. [Google Scholar] [CrossRef]
- Zhang, W.; Lan, F.; Xuan, J.; Mazumder, P.; Aghadjani, M.; Yang, Z.; Men, L. Ultrasensitive Dual-Band Terahertz Sensing with Metamaterial Perfect Absorber. In Proceedings of the IEEE MTT-S International Microwave Workshop Series on Advanced Materials and Processes for RF and THz Applications, Pavia, Italy, 20–22 September 2017; IEEE: Piscataway, NJ, USA, 2017; pp. 1–3. [Google Scholar]
- Saadeldin, A.S.; Hameed, M.F.O.; Elkaramany, E.M.; Obayya, S.S. Highly Sensitive Terahertz Metamaterial Sensor. IEEE Sens. J. 2019, 19, 7993–7999. [Google Scholar] [CrossRef]
- Tao, H.; Bingham, C.M.; Strikwerda, A.C.; Pilon, D.; Shrekenhamer, D.; Landy, N.I.; Fan, K.; Zhang, X.; Padilla, W.J.; Averitt, R.D. Highly flexible wide angle of incidence terahertz metamaterial absorber: Design, fabrication, and characterization. Phys. Rev. B 2008, 78, 241103. [Google Scholar] [CrossRef]
- Chen, T.; Zhang, D.; Huang, F.; Li, Z.; Hu, F. Design of a terahertz metamaterial sensor based on split ring resonator nested square ring resonator. Mater. Res. Express 2020, 7, 095802. [Google Scholar] [CrossRef]
- Sharma, P.; Sharan, P. Design of photonic crystal based ring resonator for detection of different blood constituents. Opt. Commun. 2015, 348, 19–23. [Google Scholar] [CrossRef]
- Islam, M.S.; Sultana, J.; Ahmed, K.; Islam, M.R.; Dinovitser, A.; Ng, B.W.H.; Abbott, D. A Novel Approach for Spectroscopic Chemical Identification Using Photonic Crystal Fiber in the Terahertz Regime. IEEE Sens. J. 2018, 18, 575–582. [Google Scholar] [CrossRef]
- Di Primo, C.; Lebars, I. Determination of refractive index increment ratios for protein–nucleic acid complexes by surface plasmon resonance. Anal. Biochem. 2007, 368, 148–155. [Google Scholar] [CrossRef] [PubMed]
- Tang, P.R.; Li, J.; Du, L.H.; Liu, Q.; Peng, Q.X.; Zhao, J.H.; Zhu, B.; Li, Z.R.; Zhu, L.G. Ultrasensitive specific terahertz sensor based on tunable plasmon induced transparency of a graphene micro-ribbon array structure. Opt. Express 2018, 26, 30655–30666. [Google Scholar] [CrossRef]
- Rezagholizadeh, E.; Biabanifard, M.; Borzooei, S. Analytical design of tunable THz refractive index sensor for TE and TM modes using graphene disks. J. Phys. D Appl. Phys. 2020, 53, 295107. [Google Scholar] [CrossRef]
- Yan, F.; Li, L.; Wang, R.; Tian, H.; Liu, J.; Liu, J.; Tian, F.; Zhang, J. Ultrasensitive Tunable Terahertz Sensor with Graphene Plasmonic Grating. J. Light. Technol. 2018, 37, 1103–1112. [Google Scholar] [CrossRef]
- Sabah, C.; Mulla, B.; Altan, H.; Ozyuzer, L. Cross-like terahertz metamaterial absorber for sensing applications. Pramana 2018, 91, 17. [Google Scholar] [CrossRef]
- Han, X.; Zhang, Z.; Qu, X. A novel miniaturized tri-band metamaterial THz absorber with angular and polarization stability. Optik 2021, 228, 166086. [Google Scholar] [CrossRef]


| Parameters | L | W | W1 | W2 | W3 | W4 | G1 | G2 | tg | td | tc | t |
|---|---|---|---|---|---|---|---|---|---|---|---|---|
| Value (μm) | 50 | 50 | 4.9 | 4.7 | 2.55 | 4.9 | 0.5 | 0.59 | 5.2 | 18 | 0.25 | 40 |
| Refractive Index | A (%) | S (GHz/RIU) | Δf (GHz) | FWHM (GHz) | Q | FoM |
|---|---|---|---|---|---|---|
| 1 | 98.88 | - | - | 50 | 89.5 | - |
| 1.33 | 98.21 | 15.15 | 5 | 46 | 97.17 | 0.33 |
| 1.35 | 97.75 | 16.57 | 5.8 | 45 | 99.31 | 0.37 |
| 1.38 | 97.28 | 19.74 | 7.5 | 45 | 99.28 | 0.44 |
| 1.4 | 97.28 | 21.75 | 8.5 | 45 | 99.25 | 0.48 |
| 1.5 | 97.52 | 20.8 | 10.4 | 45 | 99.21 | 0.46 |
| 1.8 | 95.46 | 22.75 | 18.2 | 56 | 79.58 | 0.41 |
Publisher’s Note: MDPI stays neutral with regard to jurisdictional claims in published maps and institutional affiliations. |
© 2021 by the authors. Licensee MDPI, Basel, Switzerland. This article is an open access article distributed under the terms and conditions of the Creative Commons Attribution (CC BY) license (https://creativecommons.org/licenses/by/4.0/).
Share and Cite
Veeraselvam, A.; Mohammed, G.N.A.; Savarimuthu, K.; Anguera, J.; Paul, J.C.; Krishnan, R.K. Refractive Index-Based Terahertz Sensor Using Graphene for Material Characterization. Sensors 2021, 21, 8151. https://doi.org/10.3390/s21238151
Veeraselvam A, Mohammed GNA, Savarimuthu K, Anguera J, Paul JC, Krishnan RK. Refractive Index-Based Terahertz Sensor Using Graphene for Material Characterization. Sensors. 2021; 21(23):8151. https://doi.org/10.3390/s21238151
Chicago/Turabian StyleVeeraselvam, Aruna, Gulam Nabi Alsath Mohammed, Kirubaveni Savarimuthu, Jaume Anguera, Jessica Constance Paul, and Ram Kumar Krishnan. 2021. "Refractive Index-Based Terahertz Sensor Using Graphene for Material Characterization" Sensors 21, no. 23: 8151. https://doi.org/10.3390/s21238151
APA StyleVeeraselvam, A., Mohammed, G. N. A., Savarimuthu, K., Anguera, J., Paul, J. C., & Krishnan, R. K. (2021). Refractive Index-Based Terahertz Sensor Using Graphene for Material Characterization. Sensors, 21(23), 8151. https://doi.org/10.3390/s21238151