Review

Advanced Ultrasound and Photoacoustic Imaging in Cardiology

by
Min Wu
1,*,†,
Navchetan Awasthi
1,2,*,†,
Nastaran Mohammadian Rad
1,2,†,
Josien P. W. Pluim
2 and
Richard G. P. Lopata
1
1
Photoacoustics and Ultrasound Laboratory Eindhoven (PULS/e), Department of Biomedical Engineering, Eindhoven University of Technology, 5612 AZ Eindhoven, The Netherlands
2
Medical Image Analysis Group (IMAG/e), Department of Biomedical Engineering, Eindhoven University of Technology, 5612 AZ Eindhoven, The Netherlands
*
Authors to whom correspondence should be addressed.
These authors contributed equally to this work.
Sensors 2021, 21(23), 7947; https://doi.org/10.3390/s21237947
Submission received: 30 October 2021 / Revised: 23 November 2021 / Accepted: 26 November 2021 / Published: 28 November 2021
(This article belongs to the Special Issue Ultrasound Imaging and Sensing)

Abstract

:
Cardiovascular diseases (CVDs) remain the leading cause of death worldwide. An effective management and treatment of CVDs highly relies on accurate diagnosis of the disease. As the most common imaging technique for clinical diagnosis of the CVDs, US imaging has been intensively explored. Especially with the introduction of deep learning (DL) techniques, US imaging has advanced tremendously in recent years. Photoacoustic imaging (PAI) is one of the most promising new imaging methods in addition to the existing clinical imaging methods. It can characterize different tissue compositions based on optical absorption contrast and thus can assess the functionality of the tissue. This paper reviews some major technological developments in both US (combined with deep learning techniques) and PA imaging in the application of diagnosis of CVDs.

1. Introduction

Cardiovascular diseases (CVDs) are a class of diseases affecting the heart and/or the blood vessels. It is still an alarming threat to global health and is responsible for about one third of all deaths, being the number-one killer worldwide [1]. In addition, CVDs is also the major economic burden to the social health-care system due to the substantial direct and indirect cost related to the management of CVDs [2]. For an effective management and treatment of CVDs, accurate diagnosis of the disease and real-time interventional guidance is critical. Various imaging techniques such as X-ray-based imaging (cardiac CT, coronary angiogram), magnetic resonance imaging (MRI) and ultrasound (US) imaging are currently commonly applied in clinics for the diagnosis of CVDs [3]. However, X-ray-based imaging involves a high radiation dose, and MRI is relatively expensive and not always available for frequent, daily use. US imaging is safe, easy to operate, and is known for its high spatial and temporal resolution, low cost, and high accessibility. Therefore, US imaging has become the most commonly used diagnostic imaging technique in cardiology [4].
New imaging techniques are being investigated and developed. Photoacoustic (PA) oroptoacoustic) imaging is a novel imaging technique, taking advantage of both light and sound. In PA imaging, short pulses of laser light are transmitted to irradiate the tissue, and are absorbed in the tissue, generating ultrasound signals due to the thermo-elastic expansion. These ultrasound signals can be received by a conventional US transducer to reconstruct PA images [5]. Generally, the amplitude of the PA signal is proportional to the optical absorption of the tissue. By operating at different optical spectral ranges, the multispectral photoacoustic imaging can reveal the unique wavelength dependent behavior of different materials [6] and is useful to characterize different tissue compositions and assess tissue functionality [7,8,9]. Over recent decades, substantial improvements have been achieved in the field of PA imaging in the diagnosis of CVDs.
As mentioned above, US imaging has been and will remain one of the most widely applied imaging techniques in cardiology in the coming future. PA imaging is intrinsically bonded to and is complementary to US imaging, making it a promising new imaging technique towards clinical applications in cardiology. Furthermore, with the increase in GPU power, deep learning (DL) techniques have gained popularity. DL algorithms require less knowledge about the domain and can capture data features on their own, and hence can be easily applied in complex scenarios [10] while requiring few experts for manual annotations after the model development is complete [11,12]. DL techniques substantially impact the advancement of modern US and PA imaging processing methods. DL techniques generally have become the state-of-the-art methods for segmentation [13,14,15], classification [16], reconstruction [17,18], and registration tasks.
In this paper, we summarized the development of US and PA imaging and the application of DL techniques in both imaging modalities in cardiology. In Section 2, we will first give a condensed overview of the major developments in US imaging and then focus on the DL-based advanced US imaging processing methods. In Section 3, we will first comprehensively review the recent technical advances in PA imaging and then briefly discuss the application of DL-based PA imaging techniques in cardiology. Finally, findings are summarized, and some remaining/future challenges are discussed in Section 4.

2. Advanced US Imaging in Cardiology and DL Techniques

The use of ultrasound in cardiology was first introduced by Edler and Hertz [19,20]. They were the first one to record the echoes from the anterior leaflet of the mitral valve. The basic US imaging principle can be found in [21]. Since then, US imaging has evolved to 1-D A and M-mode imaging, real-time 2-D and 3-D B-mode, intravascular US imaging to directly visualize the artery wall from inside, e.g., in the coronaries, and the ultrafast US imaging to better characterize the cardiac functions [22,23,24]. Moreover, US is known for its many functional imaging modalities [4], such as US-based Doppler imaging to measure blood [25], strain imaging to quantify myocardial dynamics [26], shear wave elastography [27], and the use of contrast agents to further improve US imaging quality and flow imaging, and quantify tissue perfusion [28,29].

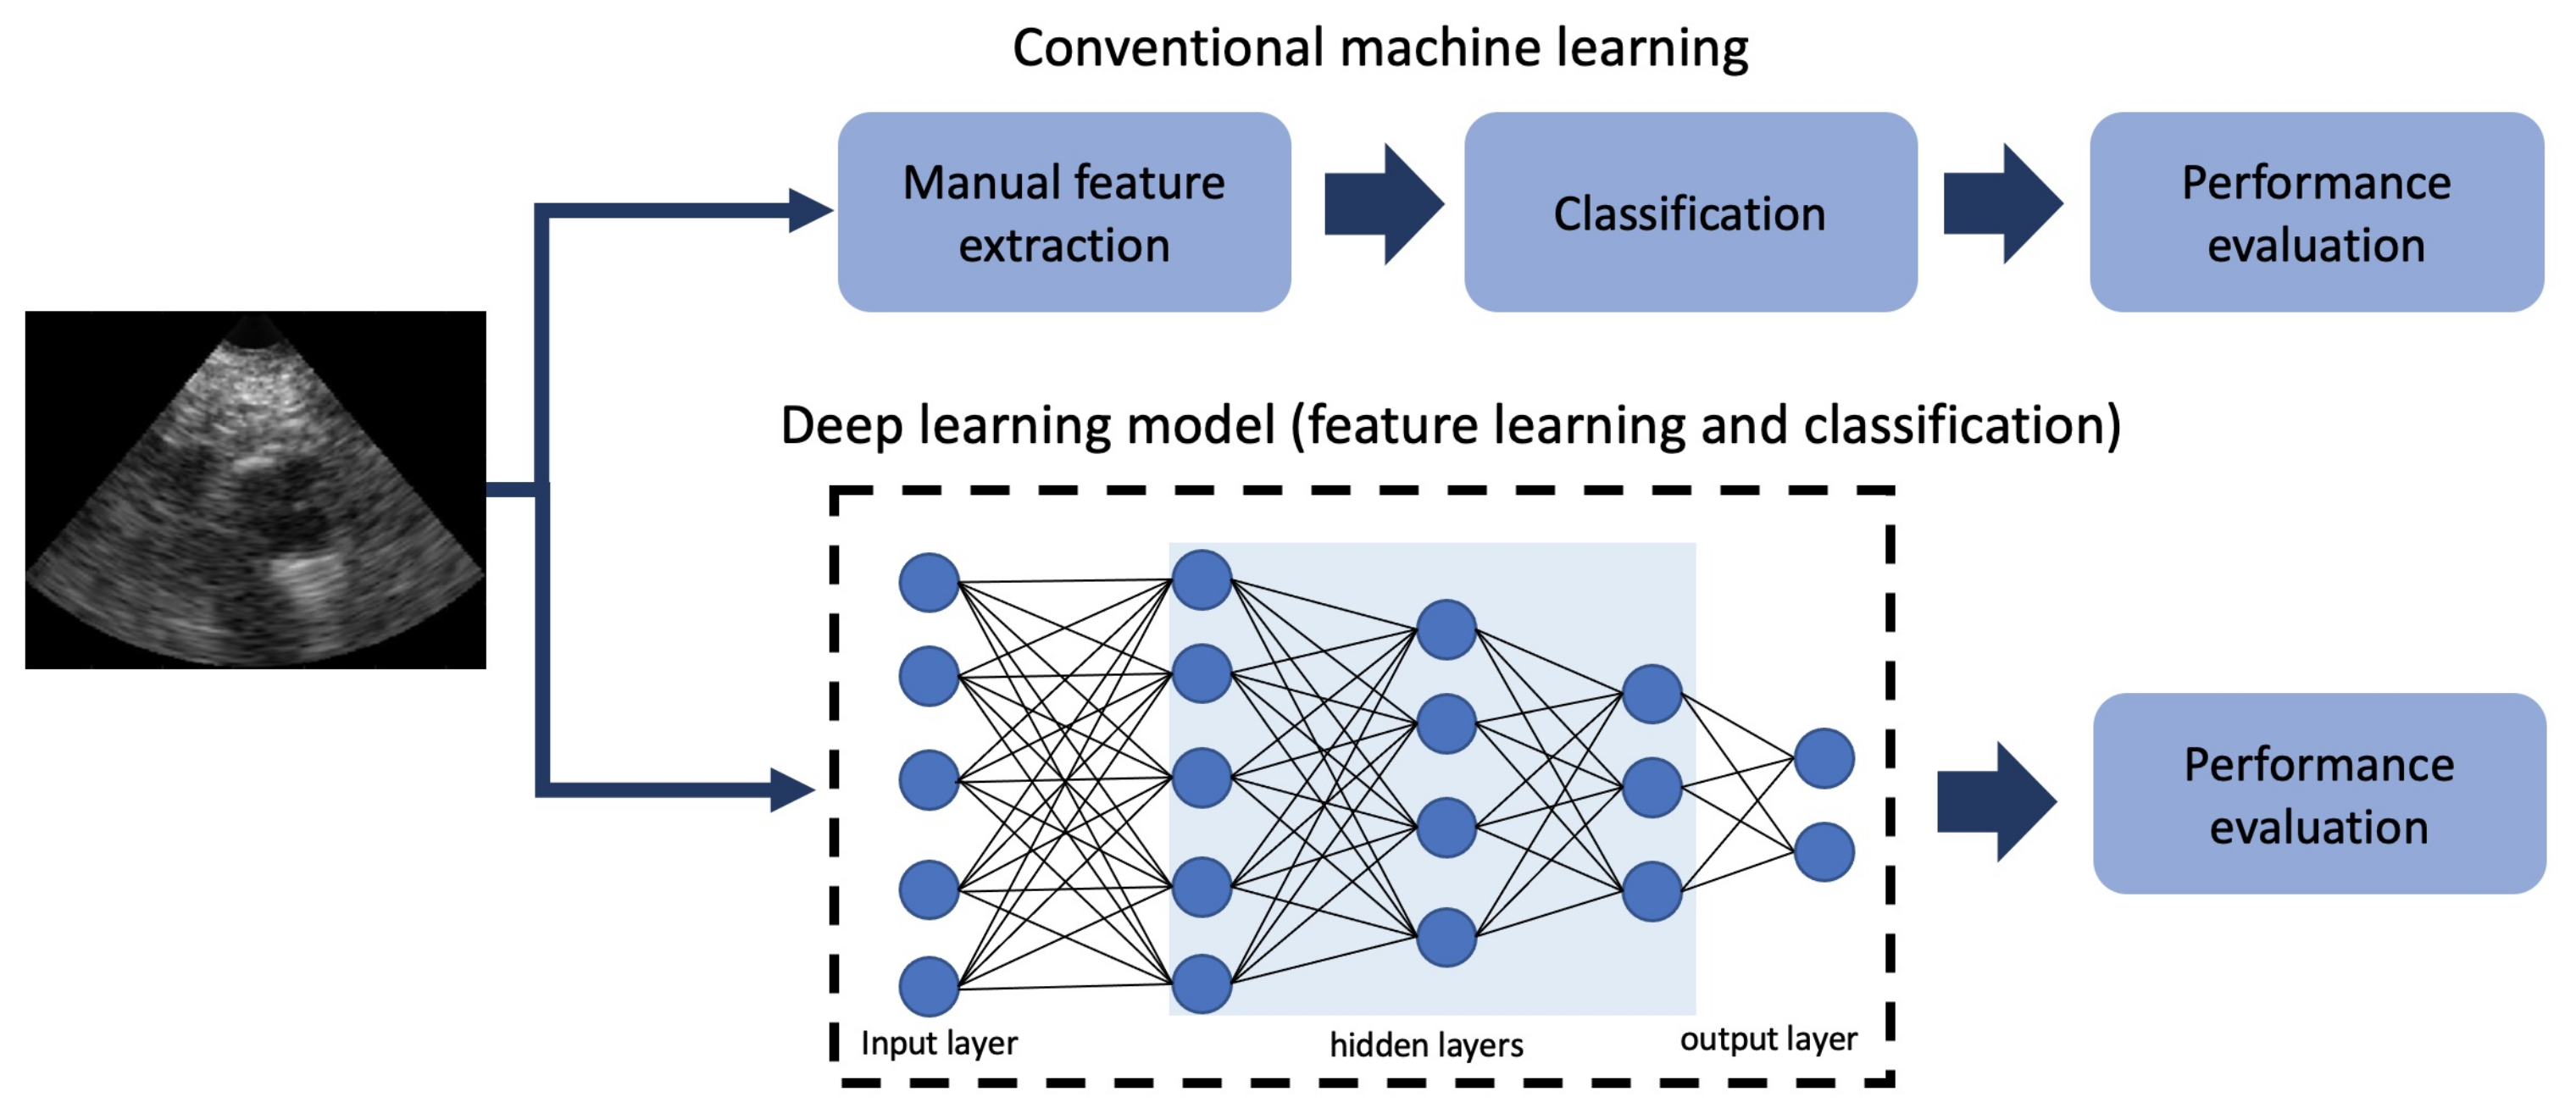
2.1. DL Techniques in US Imaging in Cardiology

Besides the developments in US imaging itself, with the introduction of DL, advanced imaging processing techniques are available and can further improve diagnosis and treatment of CVDs patients [30]. Unlike conventional machine learning algorithms, which mainly rely on manual feature extraction (see Figure 1), DL techniques do not require substantial domain knowledge [31]. Instead, they automatically learn a high-level representation of data.
Advances in DL extend the application of artificial neural network (NN) theory by providing the possibility of training a NN architecture with multiple hidden layers using a backpropagation algorithm [32]. Convolutional neural networks (CNN) [33], recurrent neural networks (RNN) [11], and generative adversarial neural networks (GAN) [34] are the most commonly used deep neural networks (DNN) for cardiovascular image analysis. In the following section, we will selectively focus on reviewing some typical work about the application of diverse DL methods that are gaining increased attention in the field, such as viewpoint classification, Left ventricle segmentation, and intravascular ultrasound segmentation. Furthermore, we state the importance of point of care ultrasound imaging.

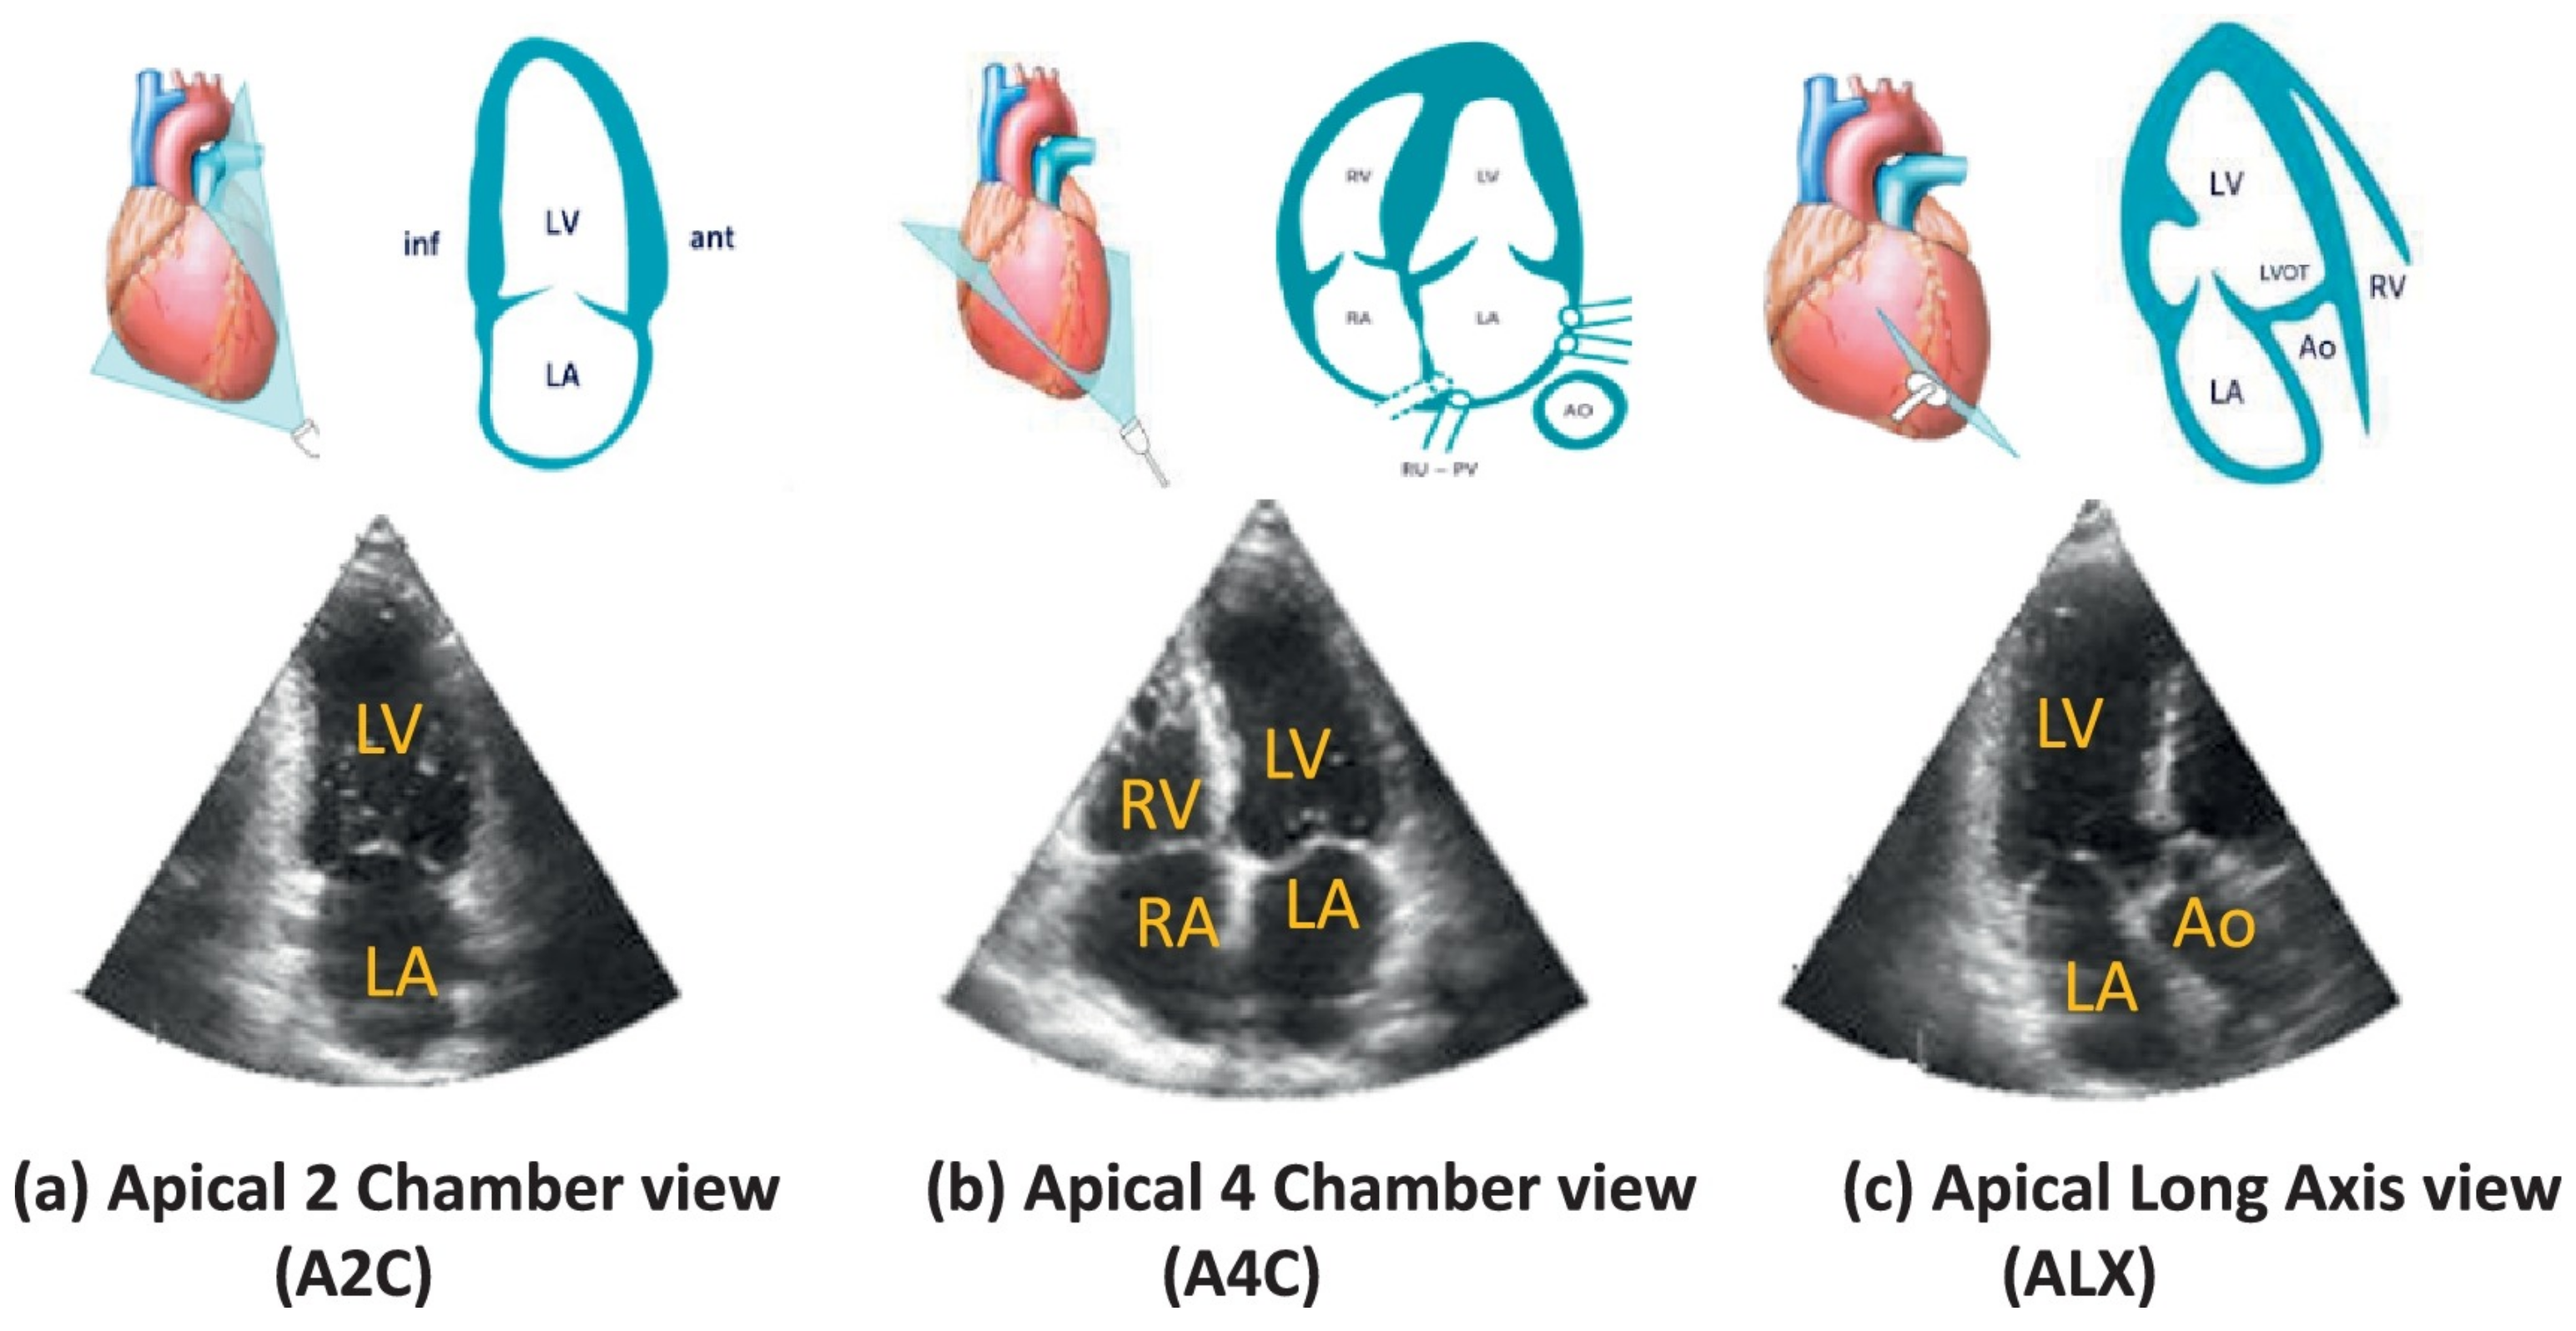
2.1.1. Advanced Techniques for Cardiac Viewpoint Classification

Different views of the heart are acquired using a transthoracic echocardiogram (TTE) which can help in understanding the complex anatomy and functions of the heart. These views consist of various video clips, Doppler images from different angles, as well as still images. The information is presented in terms of m-mode recordings, continuous and pulsed wave Doppler imaging. The determination of the view is a very important step in understanding the echocardiogram [35]. This step is challenging as the views sometimes differ very slightly from one another and cannot be classified so easily. The methods generally are time-consuming and require manual intervention by the operator for annotating the features.
Various techniques, classical as well as machine learning-based, have been used for classification of echo videos and images. Support vector machines (SVM) and linear discriminant analysis (LDA) have been used as one of the primary tools for classification by learning the decision boundaries and classifying the different views in space [36,37,38,39,40,41]. Multi-class logit-boost classifiers are also proposed for classification of the view in echocardiographic images [42,43]. Khamis et al. [44] proposed a multi-stage classification algorithm for employing spatio-temporal feature extraction and supervised dictionary learning to classify longitudinal scans namely: apical two-chamber (A2C), apical four-chamber (A4C) and apical long-axis (ALX), as shown in Figure 2. The inherent noise makes the classification challenging. Introducing discriminative dictionary learning helped reaching an average accuracy rate of 95% ( 97%, 91% and 97% of A2C, A4C and ALX respectively). Park et al. [45] proposed a probabilistic boosting network principle using the local structure dependence for identifying the cardiac view of B-mode images and then builds on this for inferring the final Doppler gate location in B-mode echocardiograms.
The classical methods for classifying view in echocardiograms are time-consuming and require operator-dependent manual intervention to obtain the desired results. Hence, there has been a wide interest in DL-based approaches for classifying the view of the heart. Penatti et al. [46] proposed a bag of visual words (BOVW) representation for the classification of four cardiac view planes. A BOVW for an image represents an image as a set of features which consists of keypoints and descriptors. Keypoints are the distinct points in the image while the descriptors are the descriptions for the keypoint. The keypoints and the descriptors are used to construct vocabularies of the image and represent the image as a frequency histogram of features. From the frequency histogram, we can predict the category of the image [47]. The technique was robust to noise filtering, down-sampling, and achieved a classification accuracy of 90%. Gao et al. [48] proposed a fused DL-based architecture for integration of spatial as well as temporal information for classifying the echocardiographic videos for eight viewpoints, and achieved an accuracy of 92.1%. Madani et al. [49] proposed a DL-based classification of echocardiograms using CNNs for classifying 15 standard views (3 still and 12 videos) from a large dataset consisting of 267 transthoracic echocardiograms. The model was able to achieve an accuracy of 97.8% and 91.7% for low-resolution images. Another area of research is developing lightweight models for performing viewpoint classification which have fewer parameters and can be used for fast mobile applications for point of care ultrasound applications. Vaseli et al. [50] proposed a lightweight model and used only 1% of the parameters normally comprising a DL model, and achieved a comparable accuracy of 88.1% for 12 view classification in a dataset of 16,612 echograms obtained from 3151 patients.

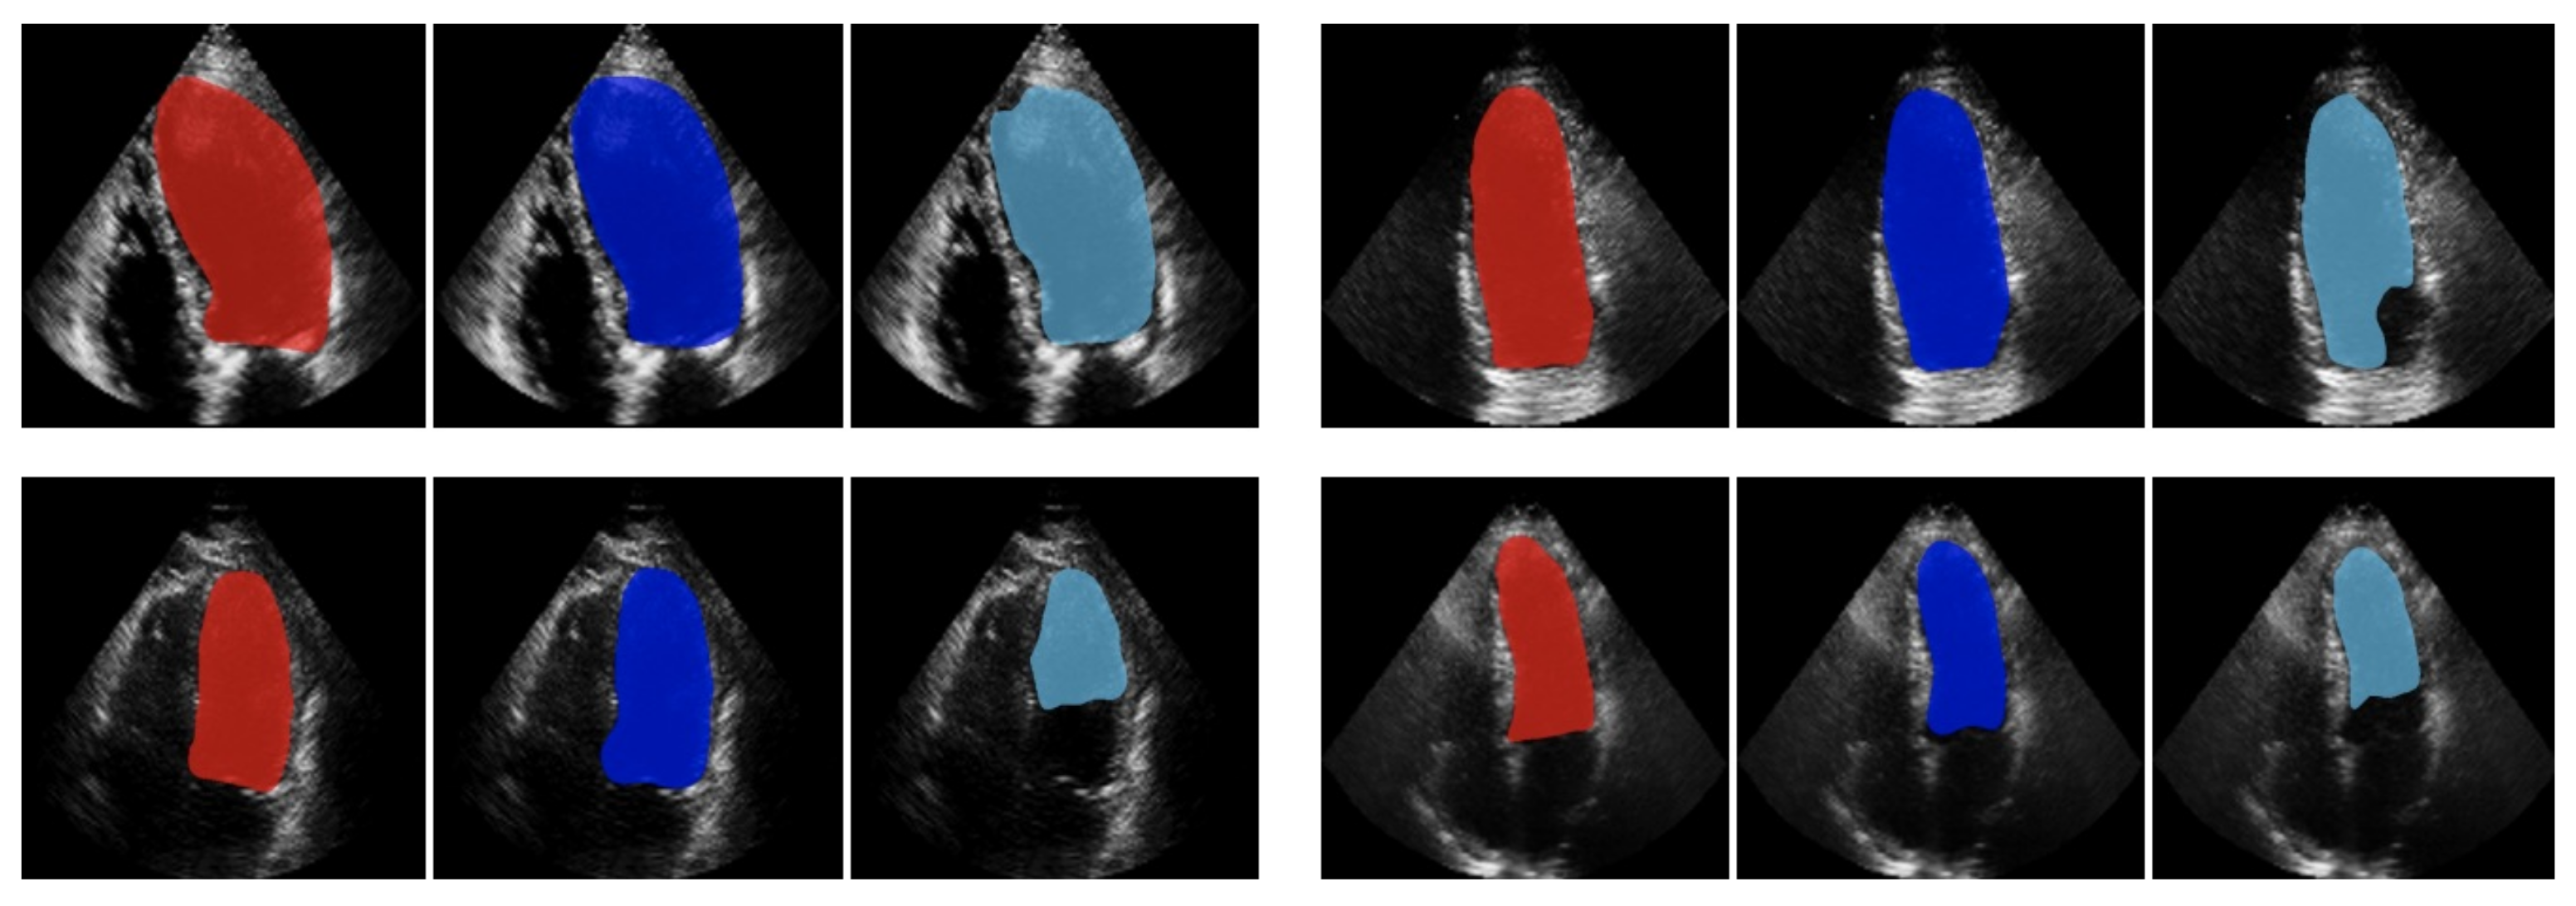
2.1.2. Advanced Techniques in US Imaging to Improve Left Ventricle Segmentation

Segmentation of the left ventricle (LV) of the heart is a very important step in diagnosing cardiopathies. Segmentation in US echocardiography image sequences is generally challenging, mainly due to the existence of speckle-noise, shadowing, artifacts, and edge dropouts. Earlier studies on cardiac image segmentation rely on deformable models [51], active contours [52], and classical feature extraction techniques [53]. Despite their popularity, these techniques suffer from some limitations. For example, active contours and deformable models need prior knowledge about the tissue shape and appearance [54,55]. Manual feature extraction is a computationally intensive process [56]. Furthermore, it is mainly based on generic researchers’ domain knowledge rather than encoding information in data. Thus, some important information present in the data may be left unused in the segmentation phase.
To tackle the issues mentioned above, recently, DL has been used in cardiac image segmentation and has shown considerable improvement in terms of accuracy and speed [57]. CNN-based models, i.e., fully convolutional neural networks (FCN) [58], U-net [14] and its variations are among the most commonly used DL-based models for cardiac image segmentation. These models have been widely employed for LV segmentation on 2D or 3-D US cardiac images [59,60,61,62,63,64].
The performance of LV segmentation relying on a single DL model might be limited due to the inherent challenges of US images, such as low signal-to-noise ratio, the existence of speckle and resulting low image contrast [65]. To overcome the above limitations and further improve the LV segmentation, several studies have proposed hybrid methods, combining a DL-based segmentation model, such as a CNN, with (i) a classical segmentation model, e.g., a deformable model [66]; or (ii) another DL architecture such as an RNN [67].
In the hybrid framework combining DL-based segmentation and deformable models [65,68,69,70,71], the deformable models act as a post-processing step to refine the output of segmentation. Experimental results of such a hybrid framework in [71] demonstrated the effectiveness of the proposed method in providing accurate segmentation of LV.
Another hybrid framework based on the combination of DL-based segmentation with RNNs was proposed to include spatio-temporal information of data in the learning procedure. In [67], the spatio-temporal information from echocardiography was simultaneously captured by this hybrid framework while segmenting LV structure. The proposed method was applied on the raw echocardiography frames, resulting in a segmentation accuracy of 97.9%.
Elsewhere, Oktay et al. [72] introduced an anatomically constrained CNN for LV segmentation. This model included prior knowledge about the organ’s shape in a CNN through a regularization model, which is based on an autoencoder network. This regularization model encourages the segmentation model to follow the anatomical priors of the underlying anatomy via learned nonlinear representations of the shape. The performance of the proposed segmentation method was evaluated using a Dice score which is defined as a ratio of overlap between the ground truth and the segmentation output, ranging from 0 (no overlap) to 1 (complete overlap). The experimental results on the CETUS’14 challenge dataset [73] showed a high performance with a Dice score of 0.91 for end-diastole and 0.87 for end-systole.
Most DL architectures applied for LV segmentation are trained in a supervised manner. In supervised learning, data with corresponding labels are given to a network for segmentation or classification purposes. However, data labeling is an expensive and time-consuming task. To overcome these challenges, semi-supervised learning algorithms are used to leverage the unlabeled data for improving the overall performance of LV segmentation [55,74,75]. In a more recent work by Ta et al. [75], a semi-supervised joint learning method was used for simultaneous LV segmentation and motion tracking in 2D+t echocardiographic sequences. A network with two branches, one for motion tracking and another for segmentation tasks, are trained simultaneously such that each branch gradually refines the result of the other. Their proposed method for LV segmentation showed the Dice score of 0.95 ± 0.01 on synthetic human echocardiographic sequences and 0.87 ± 0.01 on in vivo canine models. This framework was also applied on 3D+t echocardiographic sequences to further improve the segmentation and motion tracking of LV [76]. Jafari et al. [77] presented a semi-supervised learning framework based on a hybrid DL model comprised of a generative model and U-net for LV segmentation. The model was trained on the whole cine where the ground truth was only available for end-diastolic and end-systolic frames. The results on a dataset comprised of 648 AP4 echo cines demonstrated an enhancement of Dice score by an average of 3 % compared to a U-net trained on the end-diastolic and end-systolic frames in a supervised manner. Figure 3 demonstrates this improvement for four sample subjects.

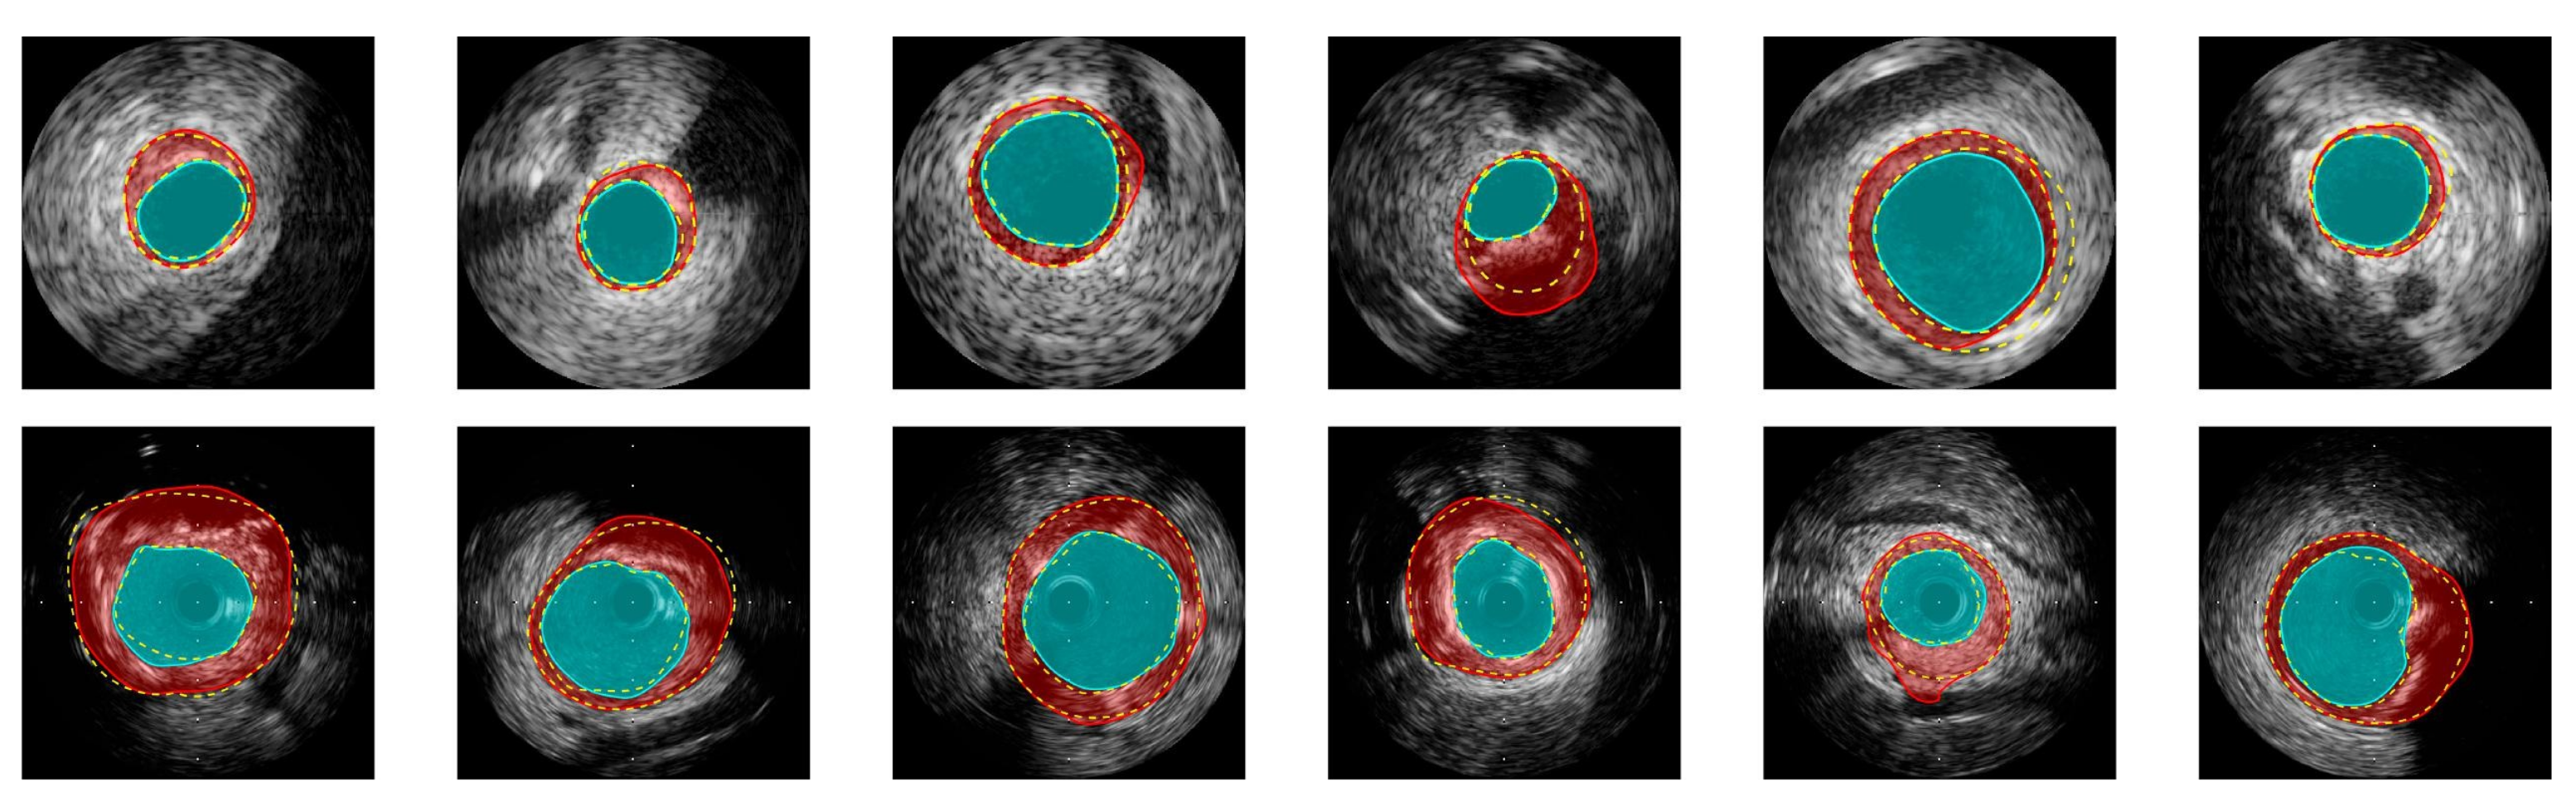
2.1.3. Advances in Intravascular Ultrasound (IVUS) Image Segmentation and Characterization

Atherosclerosis is the build-up of plaques inside the artery walls. The rupture of atherosclerotic plaques is the major cause of acute cardiovascular events, such as cardiac infarction or stroke. Clinically, local treatment of such a rupture-prone plaque (or vulnerable plaque) in coronary arteries is percutaneous coronary intervention (PCI), which is a catheter-based procedure to open up the narrowed or blocked arteries and restore the blood flow. Thus, the detection of such vulnerable plaques is of paramount importance in clinical applications to prevent the occurrence of acute fatal events, such as heart attack and stroke and to guide PCI.
Intravascular ultrasound imaging (IVUS) is an important minimally invasive imaging technique which offers a close visualization of the coronary arteries from inside, providing a direct measurement of a few mm of the atherosclerotic plaques [78]. It is considered the gold standard for in vivo imaging of coronary arterial walls and is routinely used in clinics to assess the degree of, for instance, lumen stenosis, plaque anatomy [79]. For this purpose, segmentation of the lumen, vessel wall (intima and media layer), and plaque is required. However, the segmentation of arterial structures in IVUS images can be very challenging due to the presence of artifacts, low contrast, and poor signal-to-noise ratio. Thus, new advanced techniques for accurate segmentation are necessary.
CNNs have been widely employed on IVUS data for segmentation purposes, but large datasets are not easily acquired or available. To circumvent this problem, several groups have focused on the use of data augmentation techniques and optimizing the CNN architecture to improve the feature learning capability of the network on small datasets [80,81,82,83]. For example, in [80], the authors applied an FCN, called IVUS-Net, followed by a post-processing step on a publicly available IVUS B-mode dataset [84] to segment the lumen and media–adventitia regions of the artery. Compared with the state-of-the-art methods, their proposed method showed an improvement by 8 % and 20 % in terms of Hausdorff distance [85] for the lumen and the media segmentation, respectively. In a more recent study, Yang et al. [81] proposed an optimized extension of IVUS-Net, called DPU-Net, for the lumen and media–adventitia segmentation. Furthermore, to tackle the lack of training data, the authors introduced a real-time augmenter to generate more IVUS data with artifacts. The model was applied on a publicly available dataset with a center frequency of 40 MHz and 20 MHz frames, respectively [84]. The experimental results illustrated the superiority of the proposed architecture over several competing methods, such as SegNet [86] and U-net. DPU-Net also demonstrated high generalizability for predicting images in the test sets that contain a significant number of artifacts that are not presented in the training set. Figure 4 depicts a visual comparison between the manual segmentation by experts and predictions based on DPU-Net.
To further improve the performance and the generalizability of CNNs for the IVUS segmentation, Bargsten et al. [87] applied anatomical constraints to train a U-net architecture. These constraints were represented by regularization terms which considered some prior knowledge about the lumen and vessel wall, such as location and shape. Compared to a baseline U-net model, the experimental results showed a performance improvement of up to 59.3% in terms of the modified Hausdorff distance.
In addition to the lumen and vessel wall segmentation, several other studies in the field employed CNN-based models for plaque segmentation. These studies usually use a two-stage segmentation framework: a network for plaque region localization followed by a segmentation network. For example, Olender et al. [88] used a CNN architecture for arterial tissue classification. The method comprised three steps. First, the area between the lumen-intima border and the media–adventitia border were identified. This region was then divided into pathological and non-pathological tissue. Pathological areas were then fed into a CNN architecture for plaque-type classification. The experimental results showed an overall accuracy of 93.5%. Li et al. [89] presented a U-net architecture in a two-stage pipeline to segment calcified plaque, luminal regions, and media–adventitia. In the first stage, a U-net architecture segmented the lumen and media–adventitia regions. Then, the output of this stage was provided to another U-net architecture for the calcified plaque identification. Using a two-stage U-net prevented the model from recognizing bright speckle-noise outside the plaque as the calcification. The proposed model was applied on a dataset containing 713 grayscale IVUS images with three different loss functions. The proposed method showed high accuracy even when the target vessel was surrounded by shadow artifacts or side vessels.

2.1.4. Advances of Point of Care Ultrasound (POCUS)

Point of care ultrasound (POCUS) refers to ultrasound examination outside the ultrasound lab, such as bedside care, ambulant care, or in emergency departments. POCUS has been a widely used tool for imaging and therefore reducing the time in clinical decision-making ([90]), pediatric emergency, medical education. It has achieved even more success because of the development of portable technologies as well as increased availability of POCUS machines [91,92,93]. There are still barriers to widespread use of POCUS because of the lack of a structured curriculum to educate physicians [94].
Kimura [95] presented a review of literature for point of care cardiac ultrasound techniques for physical examination. It provides insight on the utility of POCUS in detection of left atrial enlargement, signs of left ventricular systolic dysfunction, lung congestion, and elevated central venous pressures which are missed in the routine cardiac examination. It also focused on the utility of POCUS as a standard physical examination in cardiovascular medicine for augmenting cardiac physical examination and improving bedside diagnosis. These devices play a very important role in screening, complementing the abilities of physicians for performing cardiac auscultation [96]. The importance of handheld echocardiography has been studied extensively and it was shown that pocket size echocardiography (PSE) combined with other tests had a significant impact on the cardiology examination helping in finding the proper diagnosis [97]. Additionally, the benefits of the devices can be increased if proper training of personnel is done so that they can use these devices correctly, and with ease. Fox et al. [98] studied the impact of student volunteers with minimal training on the screening of Hypertrophic Cardiomyopathy (HCM) which is a life-threatening condition. The number of participants involved were 2332, and it was found that the volunteers were able to successfully screen for HCM with a sensitivity of 100%.
Kalagara et al. [99] in their review discussed the utility of POCUS for various clinical tasks such as in the operating room (OR), preoperative clinic, intensive care unit (ICU) and concluded that it is a valuable diagnostic bedside tool. They also discussed the affordability of the ultrasound systems, POCUS related education as well as the benefits of the POCUS in the clinical side. Gaspari et al. [100] performed a study based on 20 hospitals (793 patients) including patients from Advanced Cardiac Life Support (ACLS). Ultrasound was performed before and after the ACLS and it was found that the POCUS of the cardiac activity was the most important variable for deciding survival to hospital admission, survival to hospital discharge and return of spontaneous circulation. There have been many efforts to discuss these approaches and the common limitations of these techniques. Since these approaches are becoming quite popular the need to educate the practitioners for acquiring high-quality images, and interpreting, is becoming increasingly urgent [101].
The use of DL-based methods for POCUS imaging is a rapidly developing field. A review of the popular and most recent architectures was done by Blaivas and Blaivas [102] using AlexNet, VGG-16, VGG-19, ResNet50, DenseNet201, and Inception-v4. They used a public dataset with 750,018 individual ultrasound images of five different types and showed that the classification accuracy varied from 96% to 85.6% for the various models, with VGG-16 giving the best performance while the DenseNet201 performed the worst for classification. Another work by Blaivas et al. [103] proposed a LSTM network for inferior vena cava (IVC) POCUS videos in patients undergoing the intravenous fluid resuscitation and use 211 videos and achieved the receiver operating characteristic curve of 0.70 (95% confidence interval [CI], 0.43–1.00) for predicting the fluid responsiveness. Generative Adversarial Networks (GANS) have also gained popularity for generating more data as well as applicable in the cases where the paired input/output pairs are not easily available for training the models. Using the idea, Khan et al. [104] proposed a CycleGAN for improving the contrast and resolution of POCUS images for images acquired in vivo as well as phantoms. Thus, recently DL-based models have gained a lot of importance in the advanced development of POCUS-based imaging.
Another research area where DL is making significant progress is in improving the quality of image acquisition using POCUS [105]. Blaivas et al. [106] developed a DL-based model for image quality assurance for automatic image classification. They used a large dataset of 121,000 images extracted from US sequences and had an accuracy of 98%. Cheema et al. [107] highlighted the importance of DL-based models trained on highly skilled cardiac sonographers to train novice users to acquire high-quality images which can be easily extended to POCUS systems. Shokoohi et al. [105] further emphasized on using DL-based models for removing the background noise, which can help in training newly trained sonographers by focusing them on finding specific features and hence enhancing the image quality. Thus, DL-based models are also helpful in acquiring good quality images in POCUS-based systems.
In summary, we have outlined all the aforementioned applications of major DL-based models in Table 1.

3. PA Imaging and DL Techniques in Cardiology

3.1. The Development of PA Imaging Techniques in Cardiology

The detection of the vulnerable plaque is crucial to guide cardiovascular interventions and thus prevent the occurrences of the acute cardiac events. The vulnerability of the plaques is highly related to their compositions. Specifically, the typical composition of the vulnerable plaques can be concluded as the presence of lipid, calcification, intraplaque hemorrhage and macrophages [108,109]. All these typical components in vulnerable plaques can be well visualized by PA imaging, making PA imaging a very powerful tool to characterize vulnerable plaques. Over recent years, PA imaging for vulnerable plaque detection and characterization has become a massive research topic with a lot of ongoing efforts.
In general, there are two typical approaches in PA imaging of vulnerable plaques: endoscopic catheter-based PA imaging, i.e., intravascular PA (IVPA) imaging, and non-invasive PA imaging. In the following section, the major technological developments of both PA imaging approaches are reviewed.

3.2. Intravascular PA Imaging of Vulnerable Atherosclerotic Plaques

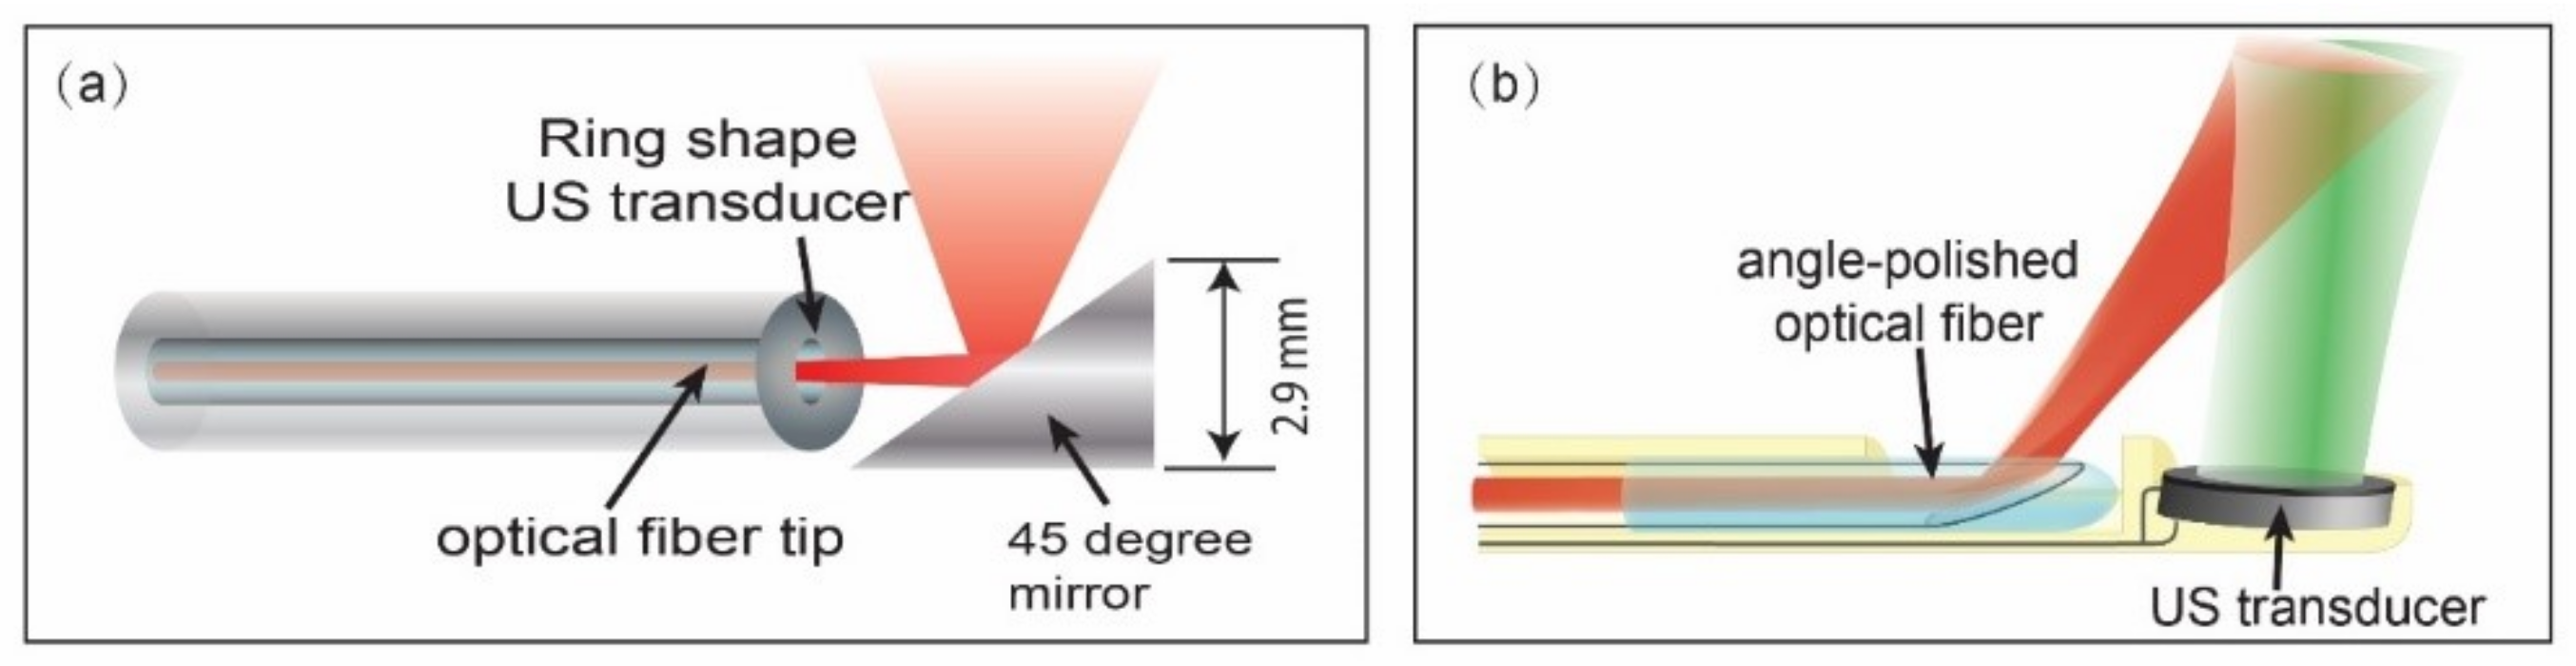
3.2.1. IVPA Imaging Catheter Development

As an essential part of the general IVPA imaging system, an IVPA catheter mainly consists of a light delivery part, and an ultrasound transducer. A good IVPA catheter requires small dimensions, high imaging sensitivity, and sufficient mechanical support while advancing in the coronary arteries. It is one of the key challenges for the application of IVPA imaging to detect vulnerable plaques. So far, there are two typical designs of a IVPA catheter based on the configuration of light delivery and an US transducer: a co-linear design and an offset design, which are shown in Figure 5. The co-linear design offers the most overlap between the optical and acoustic beams, resulting in a higher imaging sensitivity; however, miniaturization is difficult. Cao. et al. developed the first co-linear IVPA catheter with the outer diameter of 1.6 mm [110]. The second catheter design, with an offset (longitudinally or laterally) between the optical and acoustic beams, is preferred in practice due to its great potential of miniaturization. However, the offset in the catheter can lead to signal loss when the imaging targets are close by and far away from the transducer [111,112]. The smallest IVPA catheter reported so far has a diameter of 0.09 mm [113].

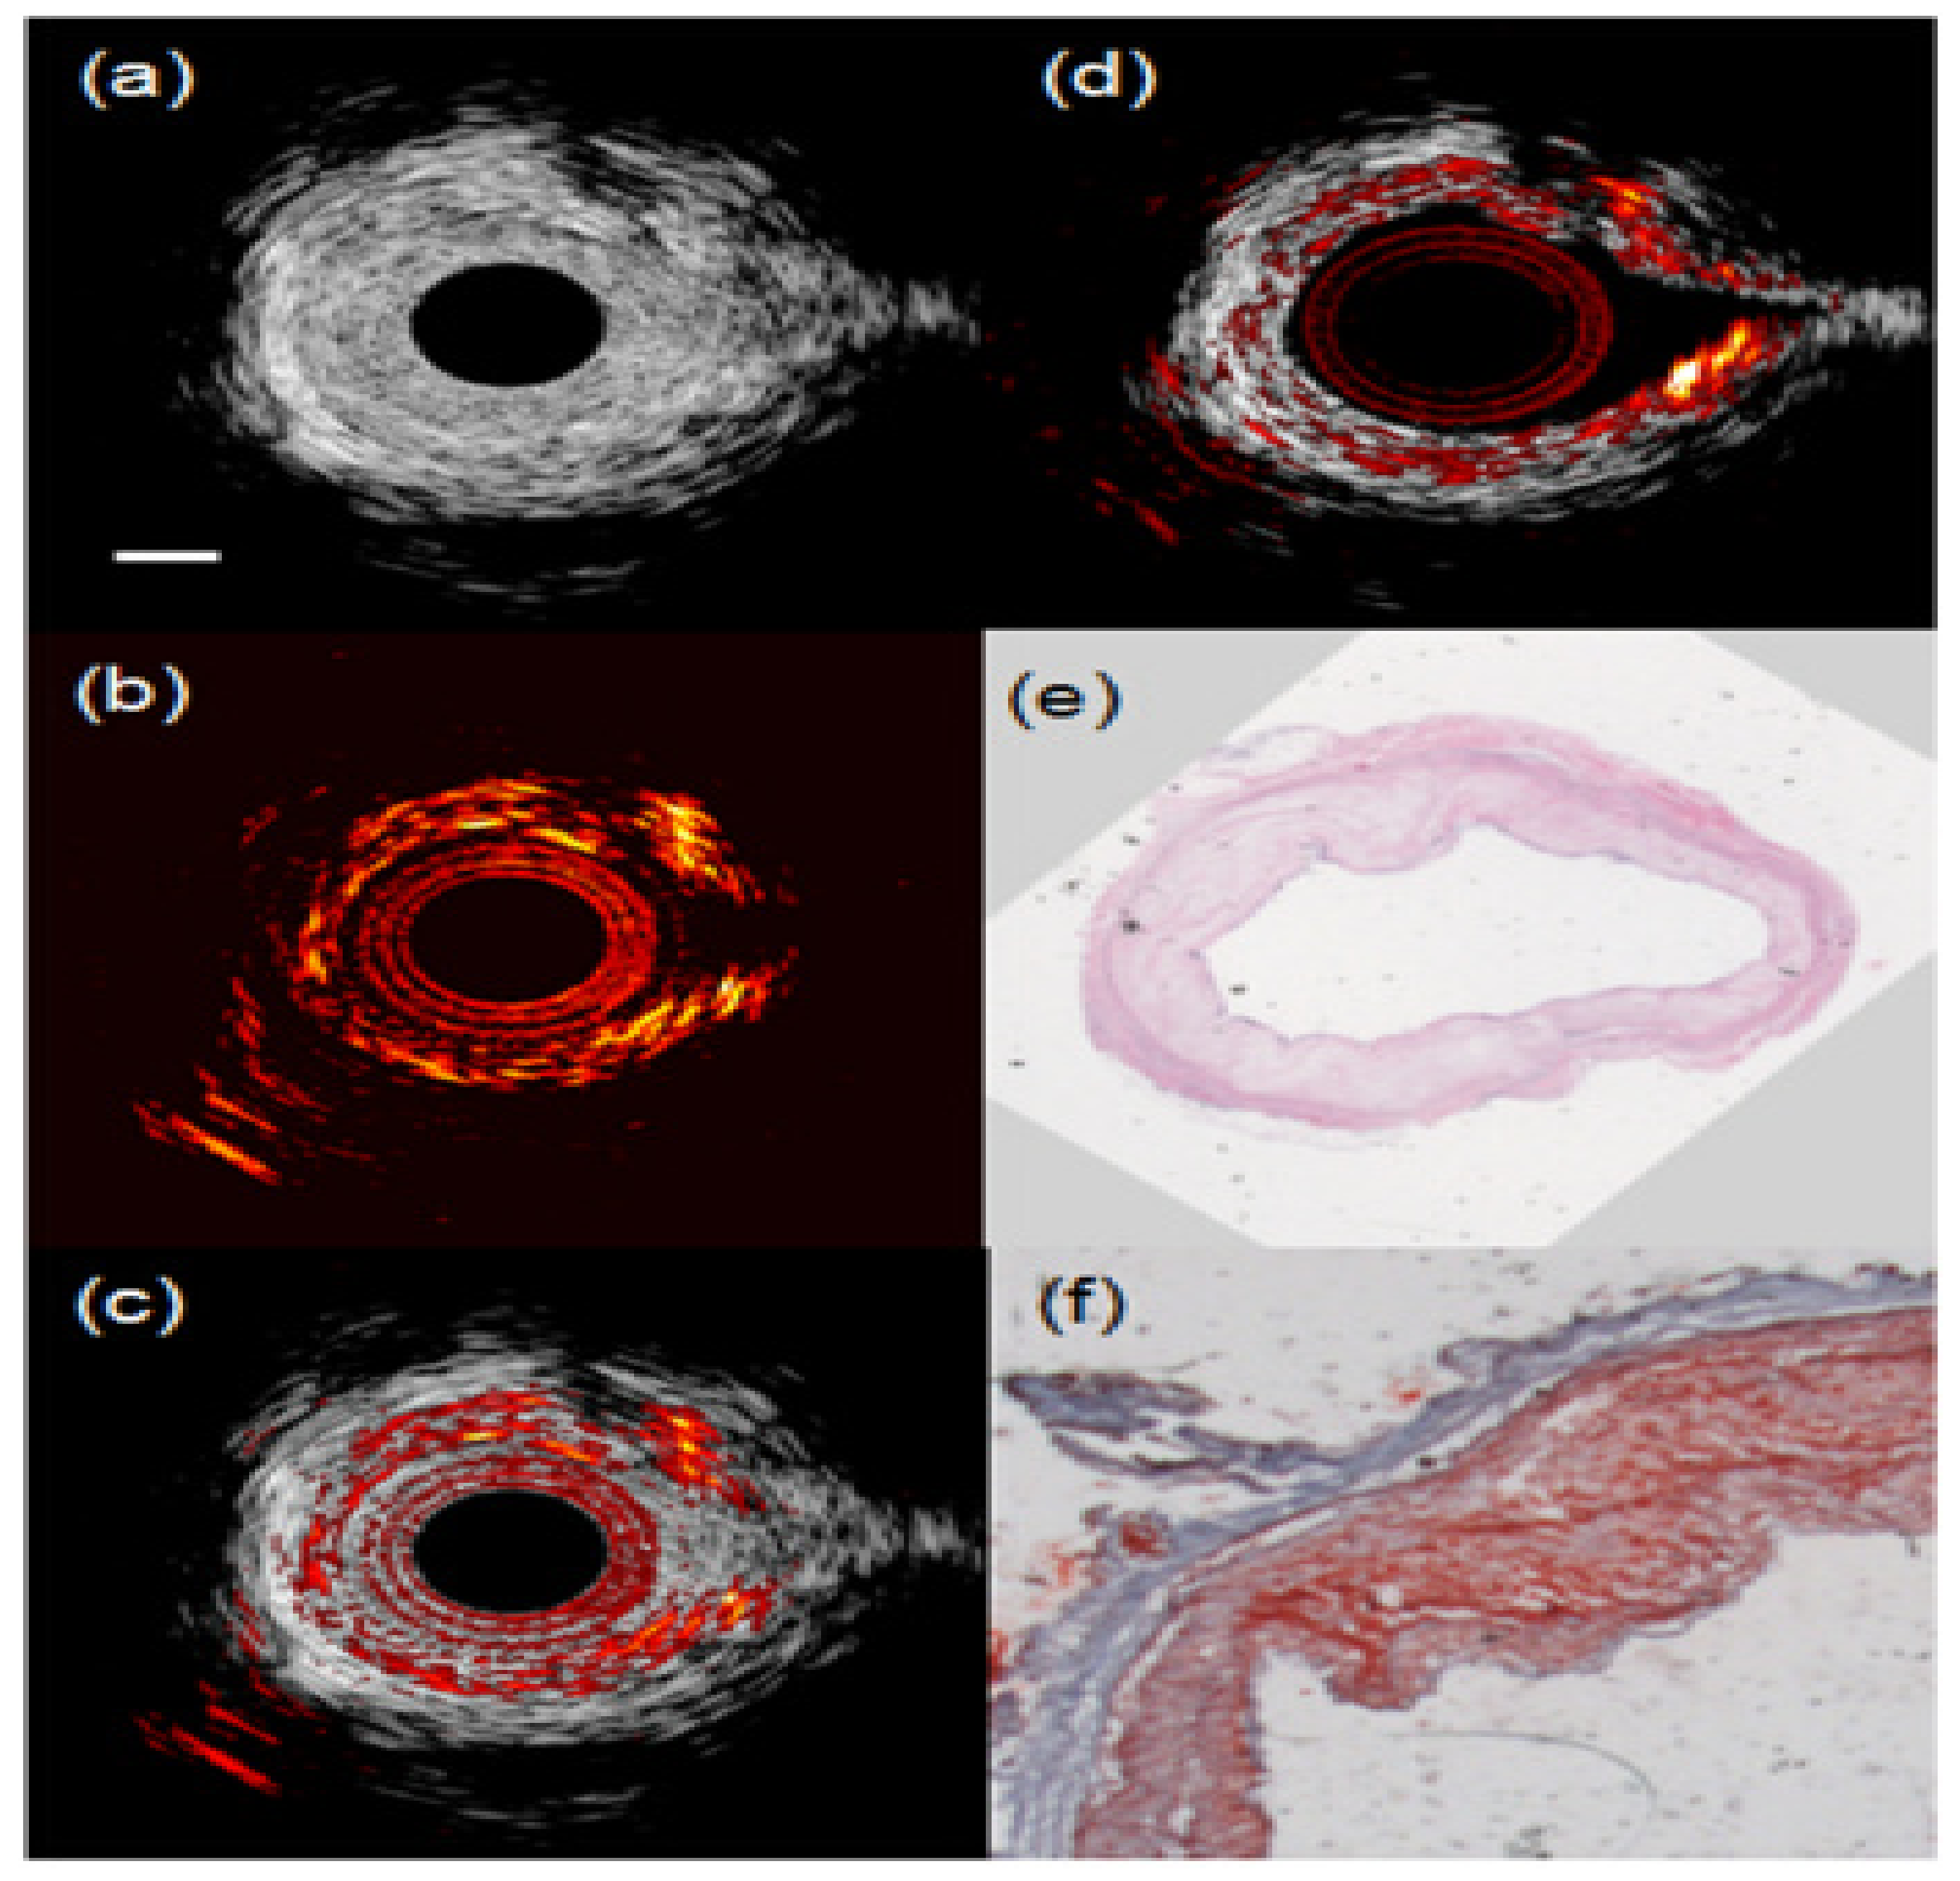
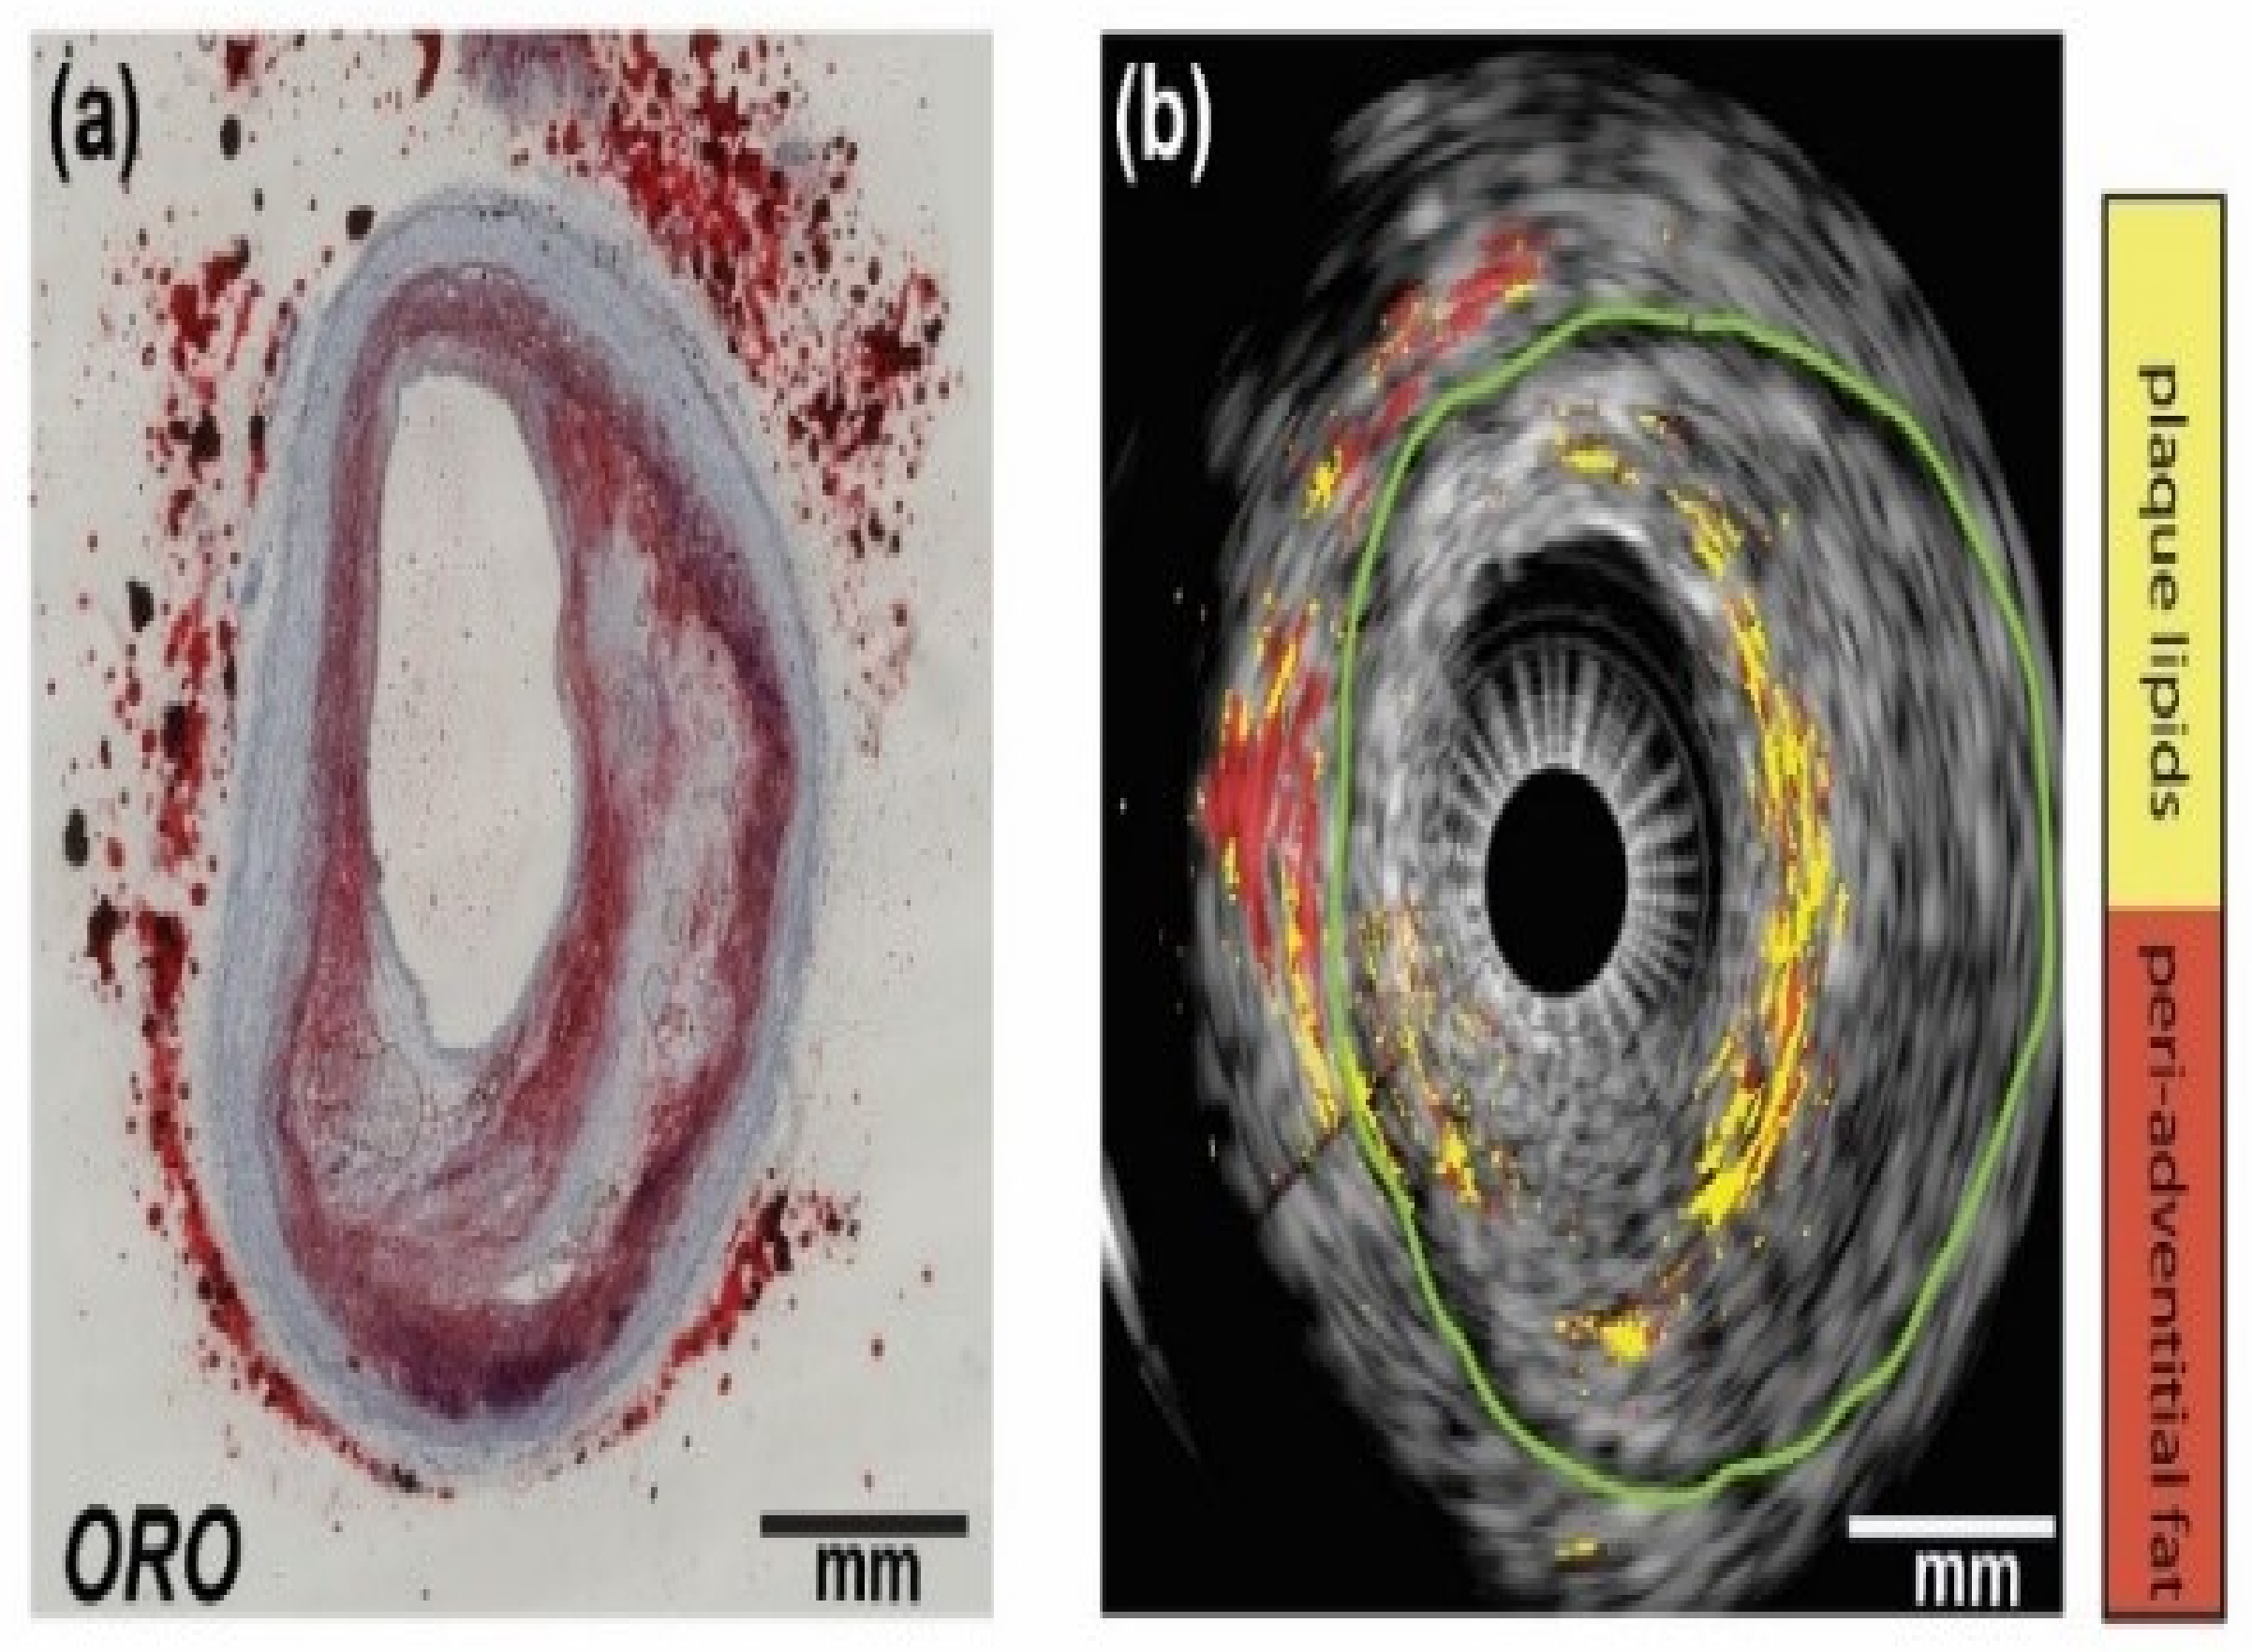
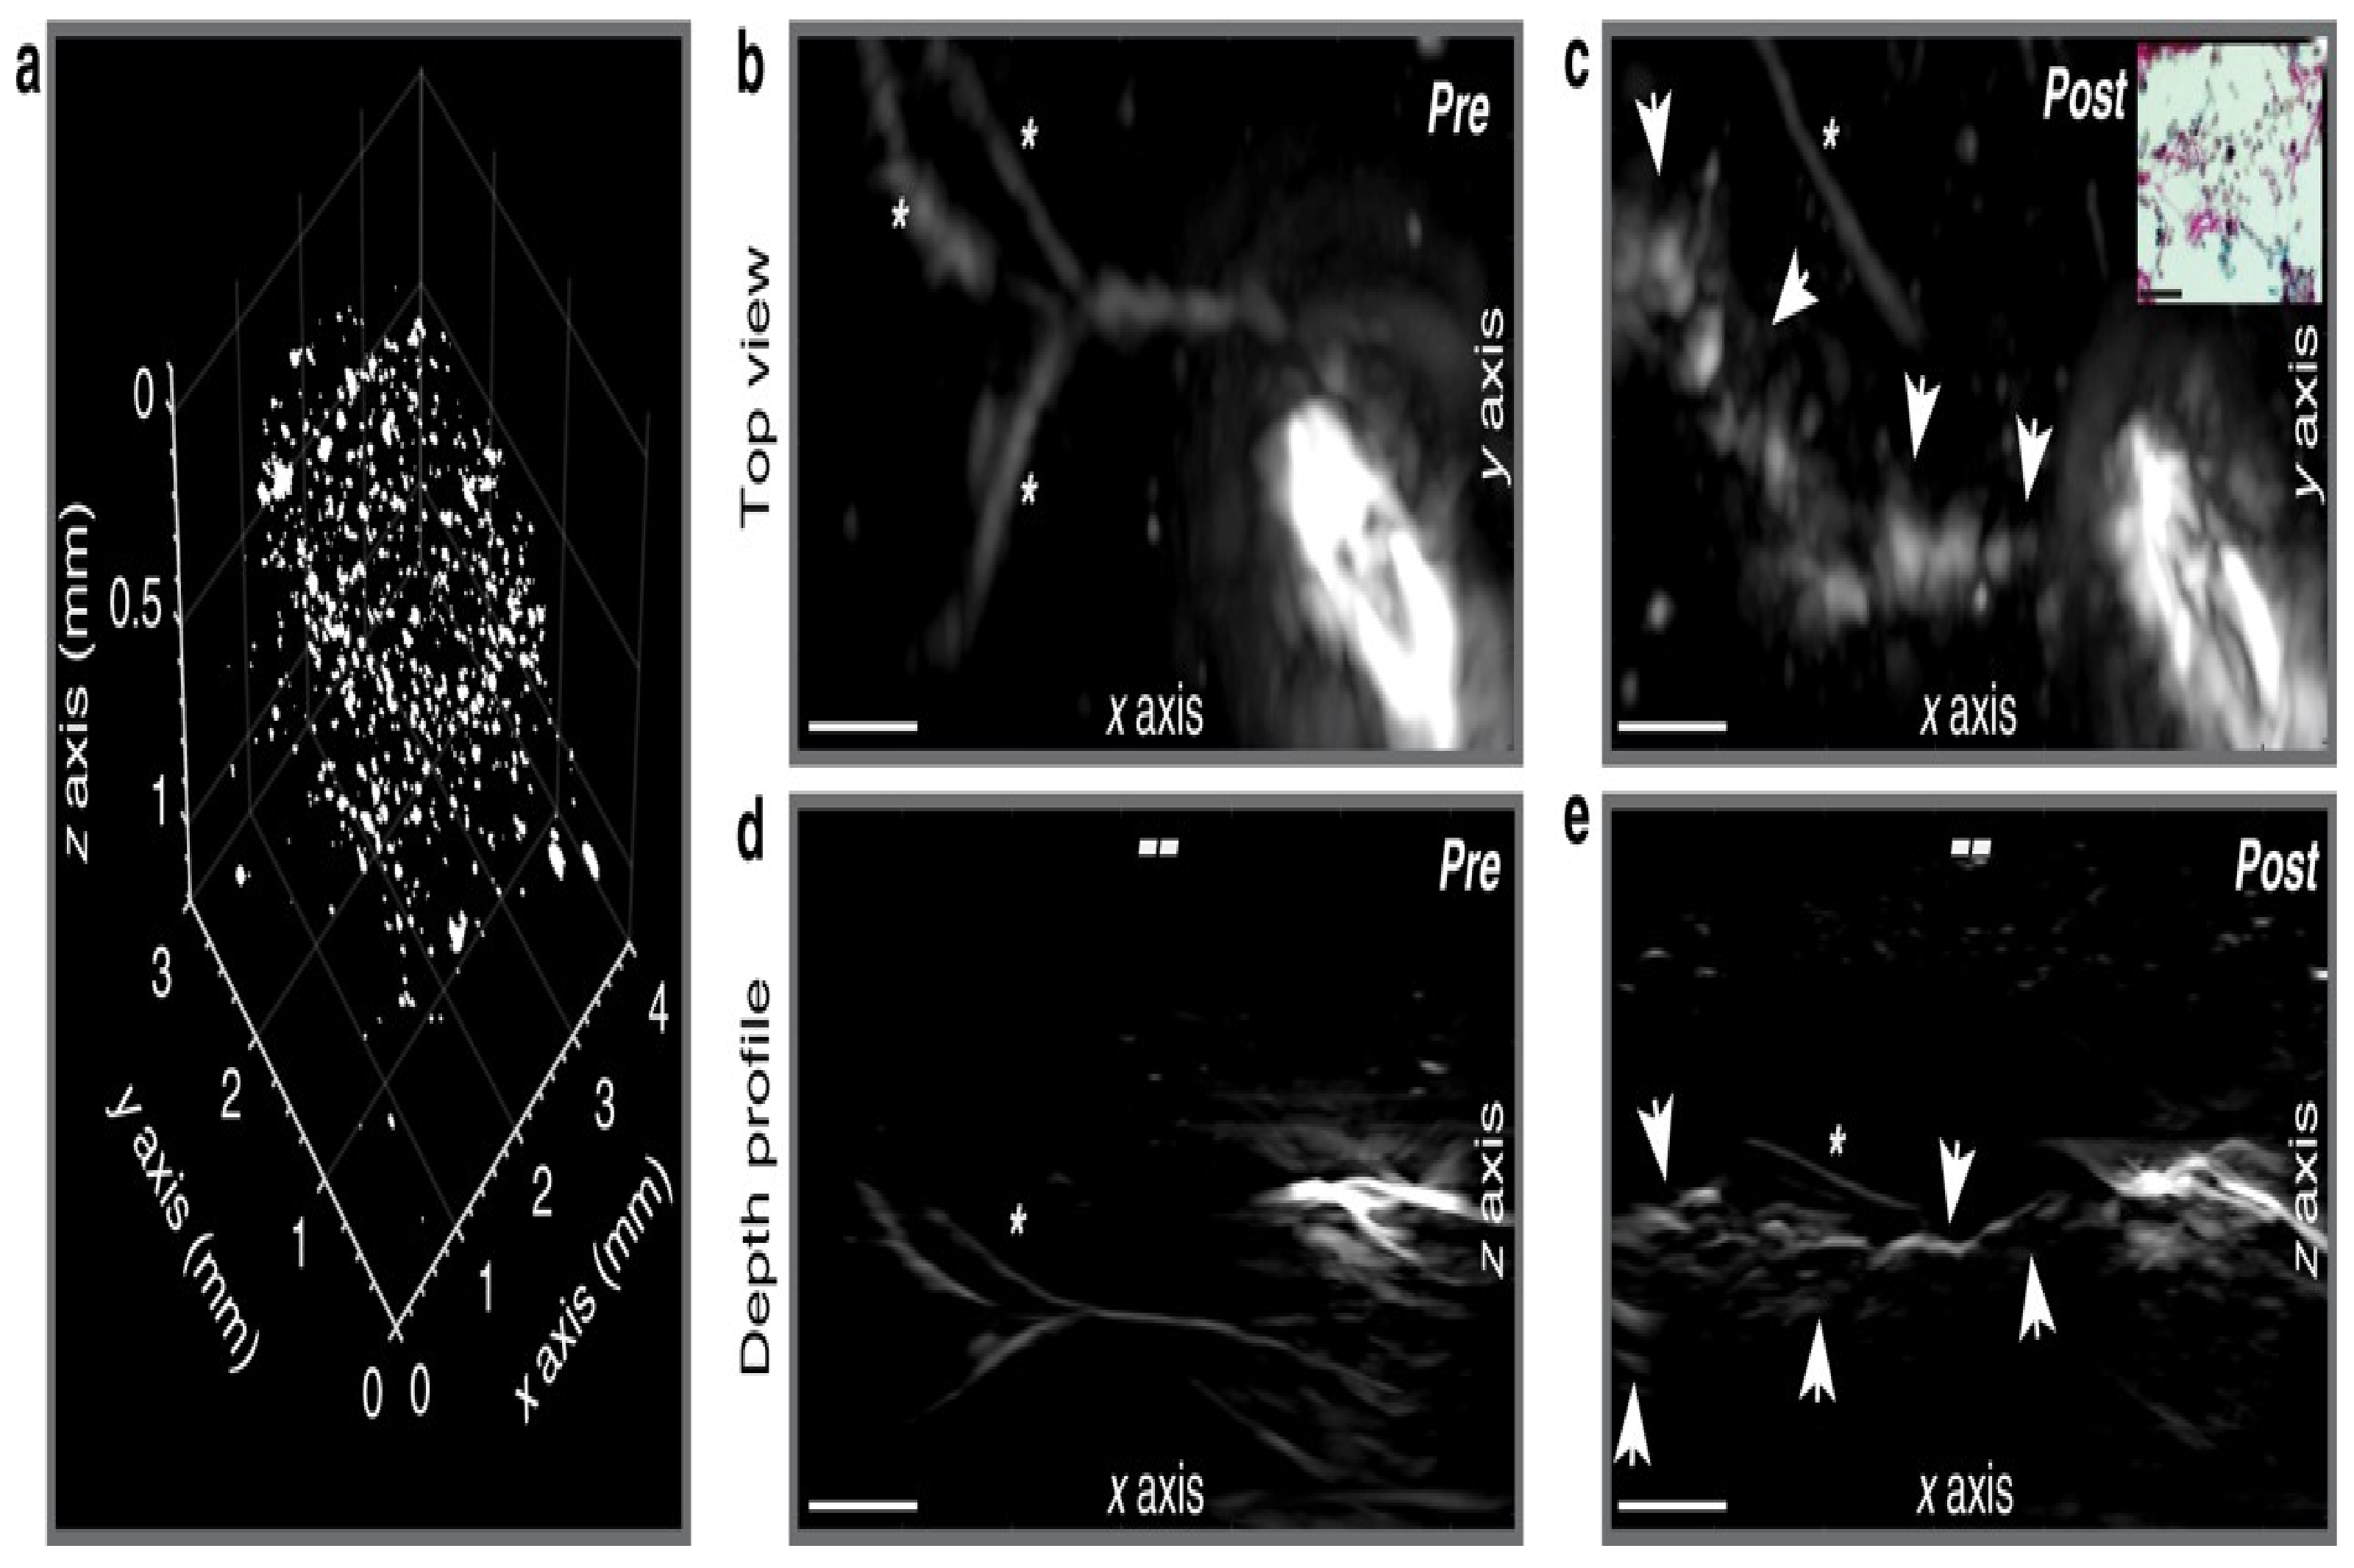
3.2.2. IVPA Imaging of Diverse Compositions in Vulnerable Plaques

As mentioned before, compositions such as lipid accumulations, intraplaque hemorrhages, and inflammation can be imaged and are used as effective indicators to detect vulnerable plaques with IVPA imaging. Among these compositions, lipid is the most commonly used PA biomarker and has been studied intensively [9,110,115,116,117,118,119,120,121]. It is well established that the best wavelengths for imaging lipid-rich plaque is around 1200 nm and 1700 nm [116]. It is even possible to image lipid in the presence of blood [122]. Figure 6 shows an IVPA image of a lipid-rich plaque in a rabbit aorta through blood.
Moreover, multispectral PA imaging has been proposed to characterize different lipid types in a plaque as well as the surrounding peri-adventitial adipose tissue with only two wavelengths (Figure 7) [123]. A further characterization of the lipid’s PA spectral signatures in human plaques (and) corresponding molecular validation has been achieved recently based on a novel PA slide microscope ( μ sPA) system [124]. As lipids are involved in all stages of the development of plaques, a comprehensive characterization of lipids can potentially guide the development of PA-based atherosclerosis disease staging [124].
As another key component involved in the pathology of atherosclerosis, macrophages are present at a relatively early stage in atherosclerosis due to the initial inflammation in the arterial endothelial layer. Macrophages can accelerate the progression of atherosclerosis by the release of matrix metalloproteinases (MMPs), which weaken the fibrous cap and make the plaques more prone to rupture. Therefore, the visualization of macrophages or MMPs can detect vulnerable atherosclerotic plaques at an early stage. However, due to their insufficient endogenous PA contrast, it requires special PA contrast agents to visualize macrophages and MMPs.
Contrast agents such as gold nanoparticles and organic dyes such as ICG or ICG-based PA nanoprobes were introduced to selectively label the macrophages and MMPs, and enhance the PA visualization [125,126,127,128]. Later, Weidenfeld et al. introduced a novel homogentisic acid-derived pigment (HDP) as a biocompatible label to “paint macrophages black”, which can be easily visualized by PA imaging [129]. The PA image of such HDP-labeled macrophages is shown in Figure 8. This HDP cell label has the great potential for in vivo applications and will provide new insights into the behavior of macrophages during different pathophysiological states of atherosclerosis.

3.2.3. Towards In Vivo IVPA Imaging of Vulnerable Atherosclerotic Plaques

To move towards in vivo clinical applications, ongoing efforts to develop a real-time IVPA imaging system and to initialize in vivo PA imaging in animal models were made. Wu et al. developed a real-time IVPA/US imaging system capable of IVPA imaging of lipid-rich plaques in a swine model at 20 frames per second in vivo [9]. Later, Xie et al. developed a new IVPA imaging system that can reach an imaging speed as fast as 100 frames per second and can imaging without blood flush [130]. All these results showcase the great potential of clinical translation of IVPA imaging to detect vulnerable plaques and therefore guide PCI.

3.3. Non-Invasive PA Imaging for Cardiovascular Applications

As PA imaging is very sensitive to different types of hemoglobin, it can be a non-invasive and cost-effective imaging method for the detection of vulnerable plaques with intraplaque hemorrhages and for extra cardiovascular hemodynamic measurement (such as blood flow and oxygen saturation, etc.) to facilitate accurate diagnosis and prevention of CVDs.
Arabul et al. presented the first PA images of intraplaque hemorrhages from human carotid plaques based on a diode-based handheld PA imaging system with limited optical wavelengths (one or two) [131]. Recently, with the updated version of the PA imaging system, Muller et al. reported the first in vivo clinical results, i.e., intra-operative PA imaging of intraplaque hemorrhages in carotid artery plaques [132]. This unique intra-operative study can facilitate a more comprehensive understanding of the properties of the PA signals generated from intraplaque hemorrhages. In this study, strong PA response were related to the presence of the intraplaque hemorrhages (Figure 9), and a diffused signal pattern was observed in the hemorrhage lesion, probably caused by the heterogeneity in the composition of the plaque [132].
Another advanced and handheld-based multispectral optoacoustic tomography system (MSOT) was developed and implemented by the research group from the Technical University of Munich, Germany. The MSOT system typically uses a single-pulse-per-frame (SPPF) acquisition scheme to minimize motion artifacts, and it typically operates in the “optical window” of 680–980 nm for a deeper imaging depth for soft biomedical tissues [133]. The MSOT system has been applied in various CVD applications in vivo both in animal and in human [134,135,136,137,138,139]. Figure 10 is an example of non-invasive PA imaging of the carotid artery to estimate the oxygenation in vivo. Please note that the MSOT systems have been given clinical approval, which may enable more opportunities of (pre)clinical studies for a wide range of diagnostic imaging applications in general. Specifically, promising results have been reported recently and demonstrated the great potential of MSOT to visualize vulnerable plaque in carotid artery in patient [140,141], which may accelerate the clinical translation of PA imaging in cardiology.
Another study by Kang [142,143] introduced a new concept of a non-invasive PA-based indicator dilution measurement, and developed an advanced method to measure the cardiac output, which is an important hemodynamic parameter for assessment of cardiac function, and is especially helpful for monitoring and optimizing the fluid status in high-risk surgical and critically ill patients.

3.4. PA Imaging of Cardiac Arrhythmia

Atrial fibrillation (AF) is a common and persistent cardiac arrhythmia with high morbidity and mortality rates [144] and is associated with a high risk of stroke and heart failure. Currently, catheter-based radiofrequency (RF) ablation to interrupt the aberrant conduction paths in the heart is an effective treatment of AF. However, many complications such as the control of the catheter and pulmonary vein reconnection are typically present during the RF ablation, making it a long-lasting and low success rate procedure (the success rate is generally 60–80% even including secondary ablations). To overcome the challenges related to ablation, accurate real-time feedback on the lesion formation during ablation, as well as post-treatment lesion assessment is necessary.
Multispectral photoacoustic imaging is powerful for tissue characterization, and many studies have explored the possibility of multispectral photoacoustic imaging to visualize the underlying structures and lesion gaps during RF ablation [121,145,146,147,148], showing very promising results. Figure 11 is an example of PA -based differentiation between the ablated and non-ablated regions. It was found that PA spectral differences were clearly observed between non-ablated and ablated regions, and that these spectral differences can be related to changes in the hemichrome, methmyoglobin, and protein denaturalization content of the tissue [146].
To move towards the clinical application of PA imaging guided RF ablation, Iskander-Rikz introduced a new design of intracardiac ablation imaging, and explored the possibility of two wavelength (790 nm and 930 nm) PA imaging to characterize ablation, and successfully validated the method ex vivo. The results shown in Figure 12 demonstrated that the dual wavelength photoacoustics can provide real-time monitoring of intra-atrial RF ablation procedures in a blood-filled beating heart. Real-time visualization of ablation lesion formation and lesion gaps was achieved with a modified clinical device consisting of a custom ablation catheter (modified for illumination) and intracardiac echography (ICE) for signal acquisition. This setup provides a good solution for the clinical translation of PA imaging to guide RF ablation. Another study from Li et al. [149] proposed a new strategy to enhance the internal illumination based on the designed graded-scattering fiber diffuser, which may be applied to improve the optical illumination for PA imaging of ablation progression.
Moreover, a new study by Ozsoy et al. [150] recently proposed a sparse PA sensing (SOS) technique for ultrafast four-dimensional imaging of cardiac mechanical wave propagation. This dedicated system can characterize the cardiac mechanical waves at high contrast, high spatial resolution (around 115µm) and sub-millisecond temporal resolution in murine models, which can further enhance the understanding of the cardiac function in arrhythmia.

3.5. Application of DL in PA Imaging in Cardiology

Although PA imaging is still a relatively new imaging modality and is at an early phase along its revolution path, increased attention is devoted to DL techniques in the PA imaging field, and the relevant studies are booming, especially in the last few years. However, unlike US imaging, which has been widely applied in clinics in cardiology, PA imaging is still at the pre-clinical phase so far. Moreover, DL techniques have not been spread in PA imaging for cardiology as largely as in the case of US imaging. There are many recent studies to comprehensively review the applications of DL in PA imaging in general [151,152,153]. Here, in this section, we only briefly introduce the DL-based applications related to PA imaging in cardiology, which can be simply summarized as the application of DL in PA image reconstruction, PA imaging quantification, and tissue segmentation [151].
Among the three applications mentioned above, DL-based PA image reconstruction is the most popular topic [17,18,154,155,156,157,158,159]. Due to the broad-band nature of PA signal and non-ideal data acquisition, the conventional PA image reconstruction method, such as delay and sum, usually results in the degradation of image quality due to information loss and high artifacts and noise. DL-based image reconstruction, which can be mainly summarized into the learning-based post-processing reconstruction and the model-based learning reconstruction methods, can reduce the artifacts and background noise in PA images and then improve overall imaging quality [157]. A recent study from Lan et al. [159] demonstrated the application of DL in PA imaging reconstruction for in vivo imaging of the human palm with great success.
Moreover, DL techniques also play an essential role in PA quantification imaging. For instance, DL can help to estimate oxygenation saturation, which is an important physiological parameter to assess metabolic function in clinics. Cai et al. [160] employed a ResU-net (a U-net with residual blocks) on 2D multi-wavelength PA images to estimate the oxygen saturation and the absolute concentration of indocyanine green. The experimental results demonstrated the high accuracy of the proposed method and its robustness to the optical property variations. Moreover, DL techniques have also been applied for automated segmentation of vascular structure in PA images [161,162]. Chlis et al. [161] used a sparse U-net model to identify the most important illumination wavelengths while segmenting the blood vessels (arteries and veins) in clinical multispectral PA (MSOT) images. The experimental results on a dataset with 33 images showed a performance comparable with a standard U-net. More recently, the study from Gröhl et al. [163] has demonstrated the feasibility of using DL for fully automatic multi-label tissue annotation in multispectral PA images in humans. The combination of these DL-based vascular segmentation and oxygen saturation measurements could potentially be useful for assessing cardiac functions in clinics.

4. Discussion and Future Opportunities

Since the first application of US imaging in cardiology, we have witnessed many advancements in US imaging, which has been widely used in clinics to diagnose various CVDs. In recent years, with the introduction of DL techniques, which can provide good performance as well as fast and real-time solution, learning-based advanced US imaging has gained considerable attention for different cardiology applications. In this paper, we reviewed some typical work of these learning-based US image analysis methods ranging from selecting a view, performing the required segmentation, and finally, the application in point of care ultrasound imaging. We discussed some of the most effective DL-based segmentation methods on US images. Current learning-based US segmentation methods are mainly based on CNN models. Some research studies focused on improving the feature learning capabilities of CNNs by optimizing the network architecture and including shape constraint-based loss. Others used a hybrid framework by combining CNNs with other DL or traditional machine learning methods to include additional information, such as temporal dependency between consecutive US slices, to further enhance US cardiac image segmentation performance. However, based on current results from the literature, more efforts are required to translate these segmentation methods to clinical practice. DL-based segmentation methods require large and high-quality annotated datasets to perform and generalize well. This requirement, however, has been rarely satisfied, especially in the field of medical imaging, where data collection and annotating are challenging and expensive procedures. To tackle this problem, data augmentation techniques have been commonly used. Effective data augmentation, however, needs domain knowledge. Furthermore, augmented data might not necessarily present all possible variants of clinical data. Thus, developing task-specific augmentation methods from existing data using generative models such as GANs and adversarial example generation is crucial and needs to be more investigated in future research.
Another area where DL-based models are making an impact is POCUS imaging. POCUS imaging would also be an important trend in future clinical applications due to its great flexibility. The development of cost-effective and easily integrable hardware combined with lightweight networks will also benefit POCUS imaging.
Contrary to US imaging, PA imaging is currently still in the research and pre-clinical phase. However, due to its hybrid nature, PA imaging could be a perfect imaging modality next to US imaging and can provide complementary information such as tissue compositions. These features make PA imaging especially useful for the characterization of vulnerable plaques in cardiology. As reviewed in this paper, research efforts are ongoing to move PA imaging forward along its clinical translation path. For instance, a Dutch start-up company has further developed the IVPA techniques for potential eventual use in patients since 2020. Moreover, various studies have been done using DL to improve PA image reconstruction and image processing tasks. The application of DL techniques to improve the PA reconstruction based on the co-registered US information as in the study proposed by yang et al. [164] would be interesting to explore in the future. Despite a lot of ongoing efforts, the application of DL on PA data in CVD is not mature enough. The efforts have been limited to several studies on blood vessel segmentation [161] and estimating the oxygenation saturation so far. The major challenge that restricts the application of DL on PA data is the lack of high-quality labeled experimental data. To tackle this issue, most research studies have mainly focused on using simulated data for training DL models, but it leads to a drop in performance when tested on the experimental data due to the different data distribution used in the training and inference phases. Domain adaptation methods [165,166] could help in reducing the gap between the distribution of simulated data and real-PA data.
Recent studies have established that atherosclerotic plaque composition is a crucial and informative factor for identifying patients at risk of fatal cardiovascular events [3]. IVUS has been recently used for the identification of calcified plaque-type [88]. However, it is not a suitable imaging modality for the characterization of all plaque components. In contrast, PA imaging is considered to be a promising modality for identifying plaque components using multiple wavelengths, and, to this end, and many different PA spectral unmixing techniques have been developed [167,168,169,170]. To further improve the capability of PA characterization of plaque compositions, more effort should be put in the direction of application of DL techniques for plaque decomposition in PA images acquired from human plaque lesions.
In general, the current state-of-the-art DL methods for CVD applications consider pixel-value information of images to diagnose and assess the disease. However, in practice, accurate non-imaging data based on the clinical records enable cardiologists to interpret imaging findings appropriately, leading to more accurate diagnosis, disease assessment, and decision-making. Thus, the integration of imaging data with clinical records needs to be more studied in the context of DL.
Another key aspect is that most published studies for DL in cardiovascular US/PA imaging are in the context of exploratory and preliminary applications. Thus, they suffer from the lack of validation on the large cohort, multi-center datasets. Therefore, there is no guarantee of the generalization performance of these studies. To better diagnose CVDs, a multi-modality imaging method combined with DL techniques would be a good future option. For instance, the combination of IVUS/IVPA and cardiac US imaging may allow both a global and local visualization of cardiovascular lesions. However, the registration between different imaging modalities at different length scales, imaging positions, and time frames is required, and these challenging image registration problems may be solved with the help of the data-driven DL methods.

Author Contributions

Conceptualization, methodology, writing—original draft preparation, writing—review and editing, M.W., N.A., N.M.R.; editing, supervision, funding acquisition, J.P.W.P., R.G.P.L. All authors have read and agreed to the published version of the manuscript.

Funding

This work is funded in part by the 4TU Precision Medicine program supported by High Tech for a Sustainable Future, a framework commissioned by the four Universities of Technology of The Netherlands.

Institutional Review Board Statement

Not applicable.

Informed Consent Statement

Not applicable.

Data Availability Statement

Not applicable.

Conflicts of Interest

The authors have no conflict of interest.

References

  1. World Health Organization. Cardiovascular Disease Programme; Noncommunicable Disease and Mental Health Cluster. In Integrated Management of Cardiovascular Risk; World Health Organization: Geneva, Switzerland, 2002; ISBN 9241562242. [Google Scholar]
  2. Tarride, J.E.; Lim, M.; DesMeules, M.; Luo, W.; Burke, N.; O’Reilly, D.; Bowen, J.; Goeree, R. A review of the cost of cardiovascular disease. Can. J. Cardiol. 2009, 25, e195–e202. [Google Scholar] [CrossRef] [Green Version]
  3. Karlas, A.; Fasoula, N.A.; Paul-Yuan, K.; Reber, J.; Kallmayer, M.; Bozhko, D.; Seeger, M.; Eckstein, H.H.; Wildgruber, M.; Ntziachristos, V. Cardiovascular optoacoustics: From mice to men—A review. Photoacoustics 2019, 14, 19–30. [Google Scholar] [CrossRef] [PubMed]
  4. Dave, J.K.; Mc Donald, M.E.; Mehrotra, P.; Kohut, A.R.; Eisenbrey, J.R.; Forsberg, F. Recent technological advancements in cardiac ultrasound imaging. Ultrasonics 2018, 84, 329–340. [Google Scholar] [CrossRef] [PubMed]
  5. Beard, P. Biomedical photoacoustic imaging. Interface Focus 2011, 1, 602–631. [Google Scholar] [CrossRef] [PubMed]
  6. Cox, B.T.; Laufer, J.G.; Beard, P.C.; Arridge, S.R. Quantitative spectroscopic photoacoustic imaging: A review. J. Biomed. Opt. 2012, 17, 061202. [Google Scholar] [CrossRef] [Green Version]
  7. Wang, L.V.; Hu, S. Photoacoustic tomography: In vivo imaging from organelles to organs. Science 2012, 335, 1458–1462. [Google Scholar] [CrossRef] [PubMed] [Green Version]
  8. Lei, H.; Johnson, L.A.; Liu, S.; Moons, D.S.; Ma, T.; Zhou, Q.; Rice, M.D.; Ni, J.; Wang, X.; Higgins, P.D.; et al. Characterizing intestinal inflammation and fibrosis in Crohn’s disease by photoacoustic imaging: Feasibility study. Biomed. Opt. Express 2016, 7, 2837–2848. [Google Scholar] [CrossRef] [PubMed] [Green Version]
  9. Wu, M.; Springeling, G.; Lovrak, M.; Mastik, F.; Iskander-Rizk, S.; Wang, T.; Van Beusekom, H.M.; Van Der Steen, A.; Van Soest, G. Real-time volumetric lipid imaging in vivo by intravascular photoacoustics at 20 frames per second. Biomed. Opt. Express 2017, 8, 943–953. [Google Scholar] [CrossRef] [PubMed]
  10. Bengio, Y.; LeCun, Y. Scaling learning algorithms towards AI. Large-Scale Kernel Mach. 2007, 34, 1–41. [Google Scholar]
  11. Goodfellow, I.; Bengio, Y.; Courville, A.; Bengio, Y. Deep Learning; MIT Press: Cambridge, UK, 2016; Volume 1. [Google Scholar]
  12. LeCun, Y.; Bengio, Y.; Hinton, G. Deep learning. Nature 2015, 521, 436–444. [Google Scholar] [CrossRef] [PubMed]
  13. Garcia-Garcia, A.; Orts-Escolano, S.; Oprea, S.; Villena-Martinez, V.; Garcia-Rodriguez, J. A review on deep learning techniques applied to semantic segmentation. arXiv 2017, arXiv:1704.06857. [Google Scholar]
  14. Ronneberger, O.; Fischer, P.; Brox, T. U-net: Convolutional networks for biomedical image segmentation. In Proceedings of the International Conference on Medical Image Computing and Computer-Assisted Intervention, Munich, Germany, 5–9 October 2015; Springer: Berlin/Heidelberg, Germany, 2015; pp. 234–241. [Google Scholar]
  15. Van Boxtel, J.; Vousten, V.R.; Pluim, J.; Rad, N.M. Hybrid Deep Neural Network for Brachial Plexus Nerve Segmentation in Ultrasound Images. arXiv 2021, arXiv:2106.00373. [Google Scholar]
  16. Krizhevsky, A.; Sutskever, I.; Hinton, G.E. Imagenet classification with deep convolutional neural networks. Adv. Neural Inf. Process. Syst. 2012, 25, 1097–1105. [Google Scholar] [CrossRef]
  17. Awasthi, N.; Jain, G.; Kalva, S.K.; Pramanik, M.; Yalavarthy, P.K. Deep Neural Network-Based Sinogram Super-Resolution and Bandwidth Enhancement for Limited-Data Photoacoustic Tomography. IEEE Trans. Ultrason. Ferroelectr. Freq. Control 2020, 67, 2660–2673. [Google Scholar] [CrossRef] [PubMed]
  18. Awasthi, N.; Prabhakar, K.R.; Kalva, S.K.; Pramanik, M.; Babu, R.V.; Yalavarthy, P.K. PA-Fuse: Deep supervised approach for the fusion of photoacoustic images with distinct reconstruction characteristics. Biomed. Opt. Express 2019, 10, 2227–2243. [Google Scholar] [CrossRef] [PubMed]
  19. Edler, I.; Hertz, C.H. The use of ultrasonic reflectoscope for the continuous recording of the movements of heart walls. Clin. Physiol. Funct. Imaging 2004, 24, 118–136. [Google Scholar] [CrossRef]
  20. Chesler, E. Ultrasound in cardiology. S. Afr. Med. J. 1973, 47, 1625–1637. [Google Scholar] [PubMed]
  21. Cobbold, R.S. Foundations of Biomedical Ultrasound; Oxford University Press: Oxford, UK, 2006. [Google Scholar]
  22. Provost, J.; Papadacci, C.; Arango, J.E.; Imbault, M.; Fink, M.; Gennisson, J.L.; Tanter, M.; Pernot, M. 3D ultrafast ultrasound imaging in vivo. Phys. Med. Biol. 2014, 59, L1. [Google Scholar] [CrossRef] [Green Version]
  23. Cikes, M.; Tong, L.; Sutherland, G.R.; D’hooge, J. Ultrafast cardiac ultrasound imaging: Technical principles, applications, and clinical benefits. JACC Cardiovasc. Imaging 2014, 7, 812–823. [Google Scholar] [CrossRef] [PubMed] [Green Version]
  24. Villemain, O.; Baranger, J.; Friedberg, M.K.; Papadacci, C.; Dizeux, A.; Messas, E.; Tanter, M.; Pernot, M.; Mertens, L. Ultrafast ultrasound imaging in pediatric and adult cardiology: Techniques, applications, and perspectives. JACC Cardiovasc. Imaging 2020, 13, 1771–1791. [Google Scholar] [CrossRef] [PubMed]
  25. Wells, P. Ultrasonic colour flow imaging. Phys. Med. Biol. 1994, 39, 2113. [Google Scholar] [CrossRef] [PubMed]
  26. Tee, M.; Noble, J.A.; Bluemke, D.A. Imaging techniques for cardiac strain and deformation: Comparison of echocardiography, cardiac magnetic resonance and cardiac computed tomography. Expert Rev. Cardiovasc. Ther. 2013, 11, 221–231. [Google Scholar] [CrossRef] [PubMed]
  27. Bercoff, J.; Tanter, M.; Fink, M. Supersonic shear imaging: A new technique for soft tissue elasticity mapping. IEEE Trans. Ultrason. Ferroelectr. Freq. Control 2004, 51, 396–409. [Google Scholar] [CrossRef] [PubMed]
  28. Schinkel, A.F.; Kaspar, M.; Staub, D. Contrast-enhanced ultrasound: Clinical applications in patients with atherosclerosis. Int. J. Cardiovasc. Imaging 2016, 32, 35–48. [Google Scholar] [CrossRef] [PubMed] [Green Version]
  29. Versluis, M.; Stride, E.; Lajoinie, G.; Dollet, B.; Segers, T. Ultrasound contrast agent modeling: A review. Ultrasound Med. Biol. 2020, 46, 2117–2144. [Google Scholar] [CrossRef]
  30. Raffort, J.; Adam, C.; Carrier, M.; Ballaith, A.; Coscas, R.; Jean-Baptiste, E.; Hassen-Khodja, R.; Chakfé, N.; Lareyre, F. Artificial intelligence in abdominal aortic aneurysm. J. Vasc. Surg. 2020, 72, 321–333. [Google Scholar] [CrossRef] [PubMed]
  31. Loh, B.C.; Then, P.H. Deep learning for cardiac computer-aided diagnosis: Benefits, issues & solutions. Mhealth 2017, 3, 45. [Google Scholar]
  32. Rumelhart, D.E.; Hinton, G.E.; Williams, R.J. Learning representations by back-propagating errors. Nature 1986, 323, 533–536. [Google Scholar] [CrossRef]
  33. LeCun, Y.; Bengio, Y. Convolutional networks for images, speech, and time series. Handb. Brain Theory Neural Netw. 1995, 3361, 1995. [Google Scholar]
  34. Goodfellow, I.J.; Pouget-Abadie, J.; Mirza, M.; Xu, B.; Warde-Farley, D.; Ozair, S.; Courville, A.; Bengio, Y. Generative adversarial networks. arXiv 2014, arXiv:1406.2661. [Google Scholar] [CrossRef]
  35. Wharton, G.; Steeds, R.; Allen, J.; Phillips, H.; Jones, R.; Kanagala, P.; Lloyd, G.; Masani, N.; Mathew, T.; Oxborough, D.; et al. A minimum dataset for a standard adult transthoracic echocardiogram: A guideline protocol from the British Society of Echocardiography. Echo Res. Pract. 2015, 2, G9–G24. [Google Scholar] [CrossRef] [Green Version]
  36. Ebadollahi, S.; Chang, S.F.; Wu, H. Automatic view recognition in echocardiogram videos using parts-based representation. In Proceedings of the 2004 IEEE Computer Society Conference on Computer Vision and Pattern Recognition, Washington, DC, USA, 27 June–2 July 2004. [Google Scholar]
  37. Otey, M.; Bi, J.; Krishna, S.; Rao, B.; Stoeckel, J.; Katz, A.; Han, J.; Parthasarathy, S. Automatic view recognition for cardiac ultrasound images. In Proceedings of the 1st international workshop on computer vision for intravascular and intracardiac imaging, Copenhagen, Denmark, 6 October 2006; pp. 187–194. [Google Scholar]
  38. Agarwal, D.; Shriram, K.; Subramanian, N. Automatic view classification of echocardiograms using histogram of oriented gradients. In Proceedings of the 2013 IEEE 10th International Symposium on Biomedical Imaging, San Francisco, CA, USA, 7–11 April 2013; pp. 1368–1371. [Google Scholar]
  39. Wu, H.; Bowers, D.M.; Huynh, T.T.; Souvenir, R. Echocardiogram view classification using low-level features. In Proceedings of the 2013 IEEE 10th International Symposium on Biomedical Imaging, San Francisco, CA, USA, 7–11 April 2013; pp. 752–755. [Google Scholar]
  40. Qian, Y.; Wang, L.; Wang, C.; Gao, X. The synergy of 3D SIFT and sparse codes for classification of viewpoints from echocardiogram videos. In Proceedings of the MICCAI International Workshop on Medical Content-Based Retrieval for Clinical Decision Support, Nice, France, 1 October 2012; Springer: Berlin/Heidelberg, Germany; pp. 68–79. [Google Scholar]
  41. Aschkenasy, S.V.; Jansen, C.; Osterwalder, R.; Linka, A.; Unser, M.; Marsch, S.; Hunziker, P. Unsupervised image classification of medical ultrasound data by multiresolution elastic registration. Ultrasound Med. Biol. 2006, 32, 1047–1054. [Google Scholar] [CrossRef] [PubMed] [Green Version]
  42. Zhou, S.K.; Park, J.; Georgescu, B.; Comaniciu, D.; Simopoulos, C.; Otsuki, J. Image-based multiclass boosting and echocardiographic view classification. In Proceedings of the 2006 IEEE Computer Society Conference on Computer Vision and Pattern Recognition (CVPR’06), New York, NY, USA, 17–22 June 2006; Volume 2, pp. 1559–1565. [Google Scholar]
  43. Park, J.H.; Zhou, S.K.; Simopoulos, C.; Otsuki, J.; Comaniciu, D. Automatic cardiac view classification of echocardiogram. In Proceedings of the 2007 IEEE 11th International Conference on Computer Vision, Rio de Janeiro, Brazil, 14–21 October 2007; pp. 1–8. [Google Scholar]
  44. Khamis, H.; Zurakhov, G.; Azar, V.; Raz, A.; Friedman, Z.; Adam, D. Automatic apical view classification of echocardiograms using a discriminative learning dictionary. Med. Image Anal. 2017, 36, 15–21. [Google Scholar] [CrossRef] [PubMed]
  45. Park, J.; Zhou, S.K.; Simopoulos, C.; Comaniciu, D. AutoGate: Fast and automatic Doppler gate localization in B-mode echocardiogram. In Proceedings of the International Conference on Medical Image Computing and Computer-Assisted Intervention, New York, NY, USA, 6–10 September; Springer: Berlin/Heidelberg, Germany; pp. 230–237.
  46. Penatti, O.A.; Werneck, R.d.O.; de Almeida, W.R.; Stein, B.V.; Pazinato, D.V.; Júnior, P.R.M.; Torres, R.d.S.; Rocha, A. Mid-level image representations for real-time heart view plane classification of echocardiograms. Comput. Biol. Med. 2015, 66, 66–81. [Google Scholar] [CrossRef] [PubMed]
  47. Ahmed, M.; Noble, J.A. Fetal ultrasound image classification using a bag-of-words model trained on sonographers’ eye movements. Procedia Comput. Sci. 2016, 90, 157–162. [Google Scholar] [CrossRef] [Green Version]
  48. Gao, X.; Li, W.; Loomes, M.; Wang, L. A fused deep learning architecture for viewpoint classification of echocardiography. Inf. Fusion 2017, 36, 103–113. [Google Scholar] [CrossRef]
  49. Madani, A.; Arnaout, R.; Mofrad, M.; Arnaout, R. Fast and accurate view classification of echocardiograms using deep learning. NPJ Dig. Med. 2018, 1, 1–8. [Google Scholar] [CrossRef]
  50. Vaseli, H.; Liao, Z.; Abdi, A.H.; Girgis, H.; Behnami, D.; Luong, C.; Dezaki, F.T.; Dhungel, N.; Rohling, R.; Gin, K.; et al. Designing lightweight deep learning models for echocardiography view classification. In Proceedings of the Medical Imaging 2019: Image-Guided Procedures, Robotic Interventions, and Modeling, San Diego, CA, USA, 16–21 February 2019; Volume 10951, p. 109510F. [Google Scholar]
  51. Mignotte, M.; Meunier, J.; Tardif, J.C. Endocardial boundary e timation and tracking in echocardiographic images using deformable template and markov random fields. Pattern Anal. Appl. 2001, 4, 256–271. [Google Scholar] [CrossRef]
  52. Kass, M.; Witkin, A.; Terzopoulos, D. Snakes: Active contour models. Int. J. Comput. Vis. 1988, 1, 321–331. [Google Scholar] [CrossRef]
  53. Khellaf, F.; Leclerc, S.; Voorneveld, J.D.; Bandaru, R.S.; Bosch, J.G.; Bernard, O. Left ventricle segmentation in 3D ultrasound by combining structured random forests with active shape models. In Proceedings of the Medical Imaging 2018: Image Processing, International Society for Optics and Photonics, Houston, TX, USA, 11–13 February 2018; Volume 10574, p. 105740J. [Google Scholar]
  54. Georgescu, B.; Zhou, X.S.; Comaniciu, D.; Gupta, A. Database-guided segmentation of anatomical structures with complex appearance. In Proceedings of the 2005 IEEE Computer Society Conference on Computer Vision and Pattern Recognition (CVPR’05), San Diego, CA, USA, 20–26 June 2005; Volume 2, pp. 429–436. [Google Scholar]
  55. Carneiro, G.; Nascimento, J.C. Incremental on-line semi-supervised learning for segmenting the left ventricle of the heart from ultrasound data. In Proceedings of the 2011 International Conference on Computer Vision, Barcelona, Spain, 6–13 November 2011; pp. 1700–1707. [Google Scholar]
  56. Martinez, H.P.; Bengio, Y.; Yannakakis, G.N. Learning deep physiological models of affect. IEEE Comput. Intell. Mag. 2013, 8, 20–33. [Google Scholar] [CrossRef] [Green Version]
  57. Chen, C.; Qin, C.; Qiu, H.; Tarroni, G.; Duan, J.; Bai, W.; Rueckert, D. Deep learning for cardiac image segmentation: A review. Front. Cardiovasc. Med. 2020, 7, 25. [Google Scholar] [CrossRef] [PubMed]
  58. Long, J.; Shelhamer, E.; Darrell, T. Fully convolutional networks for semantic segmentation. In Proceedings of the IEEE Conference on Computer Vision and Pattern Recognition, Boston, MA, USA, 12 June 2015; pp. 3431–3440. [Google Scholar]
  59. Smistad, E.; Østvik, A. 2D left ventricle segmentation using deep learning. In Proceedings of the 2017 IEEE International Ultrasonics Symposium (IUS), Washington, DC, USA, 6–9 September 2017; pp. 1–4. [Google Scholar]
  60. Zyuzin, V.; Sergey, P.; Mukhtarov, A.; Chumarnaya, T.; Solovyova, O.; Bobkova, A.; Myasnikov, V. Identification of the left ventricle endocardial border on two-dimensional ultrasound images using the convolutional neural network Unet. In Proceedings of the 2018 Ural Symposium on Biomedical Engineering, Radioelectronics and Information Technology (USBEREIT), Yekaterinburg, Russia, 7–8 May 2018; pp. 76–78. [Google Scholar]
  61. Yu, L.; Guo, Y.; Wang, Y.; Yu, J.; Chen, P. Segmentation of fetal left ventricle in echocardiographic sequences based on dynamic convolutional neural networks. IEEE Trans. Biomed. Eng. 2016, 64, 1886–1895. [Google Scholar] [CrossRef]
  62. Zyuzin, V.; Chumarnaya, T. Comparison of Unet architectures for segmentation of the left ventricle endocardial border on two-dimensional ultrasound images. In Proceedings of the 2019 Ural Symposium on Biomedical Engineering, Radioelectronics and Information Technology (USBEREIT), Yekaterinburg, Russia, 25–26 April 2019; pp. 110–113. [Google Scholar]
  63. Ahn, S.S.; Ta, K.; Thorn, S.; Langdon, J.; Sinusas, A.J.; Duncan, J.S. Multi-frame Attention Network for Left Ventricle Segmentation in 3D Echocardiography. In Proceedings of the International Conference on Medical Image Computing and Computer-Assisted Intervention, Strasbourg, France, 27 September–1 October 2021; pp. 348–357. [Google Scholar]
  64. Smistad, E.; Salte, I.M.; Dalen, H.; Lovstakken, L. Real-time temporal coherent left ventricle segmentation using convolutional LSTMs. In Proceedings of the IEEE International Ultrasonics Symposium, Virtual Symposium, 11–16 September 2021. [Google Scholar]
  65. Carneiro, G.; Nascimento, J.C.; Freitas, A. The segmentation of the left ventricle of the heart from ultrasound data using deep learning architectures and derivative-based search methods. IEEE Trans. Image Process. 2011, 21, 968–982. [Google Scholar] [CrossRef] [PubMed] [Green Version]
  66. Osher, S.; Sethian, J.A. Fronts propagating with curvature-dependent speed: Algorithms based on Hamilton-Jacobi formulations. J. Comput. Phys. 1988, 79, 12–49. [Google Scholar] [CrossRef] [Green Version]
  67. Jafari, M.H.; Girgis, H.; Liao, Z.; Behnami, D.; Abdi, A.; Vaseli, H.; Luong, C.; Rohling, R.; Gin, K.; Tsang, T.; et al. A unified framework integrating recurrent fully-convolutional networks and optical flow for segmentation of the left ventricle in echocardiography data. In Deep Learning in Medical Image Analysis and Multimodal Learning for Clinical Decision Support; Springer: Berlin/Heidelberg, Germany, 2018; pp. 29–37. [Google Scholar]
  68. Carneiro, G.; Nascimento, J.; Freitas, A. Robust left ventricle segmentation from ultrasound data using deep neural networks and efficient search methods. In Proceedings of the 2010 IEEE International Symposium on Biomedical Imaging: From Nano to Macro, Rotterdam, The Netherlands, 14–17 April 2010; pp. 1085–1088. [Google Scholar]
  69. Nascimento, J.C.; Carneiro, G. Non-rigid segmentation using sparse low dimensional manifolds and deep belief networks. In Proceedings of the IEEE Conference on Computer Vision and Pattern Recognition, Columbus, OH, USA, 24–27 June 2014; pp. 288–295. [Google Scholar]
  70. Nascimento, J.C.; Carneiro, G. One shot segmentation: Unifying rigid detection and non-rigid segmentation using elastic regularization. IEEE Trans. Pattern Anal. Mach. Intell. 2019, 42, 3054–3070. [Google Scholar] [CrossRef]
  71. Veni, G.; Moradi, M.; Bulu, H.; Narayan, G.; Syeda-Mahmood, T. Echocardiography segmentation based on a shape-guided deformable model driven by a fully convolutional network prior. In Proceedings of the 2018 IEEE 15th International Symposium on Biomedical Imaging (ISBI 2018), Washington, DC, USA, 4–7 April 2018; pp. 898–902. [Google Scholar]
  72. Oktay, O.; Ferrante, E.; Kamnitsas, K.; Heinrich, M.; Bai, W.; Caballero, J.; Cook, S.A.; De Marvao, A.; Dawes, T.; O‘Regan, D.P.; et al. Anatomically constrained neural networks (ACNNs): Application to cardiac image enhancement and segmentation. IEEE Trans. Med. Imaging 2017, 37, 384–395. [Google Scholar] [CrossRef] [Green Version]
  73. Bernard, O.; Bosch, J.G.; Heyde, B.; Alessandrini, M.; Barbosa, D.; Camarasu-Pop, S.; Cervenansky, F.; Valette, S.; Mirea, O.; Bernier, M.; et al. Standardized evaluation system for left ventricular segmentation algorithms in 3D echocardiography. IEEE Trans. Med. Imaging 2015, 35, 967–977. [Google Scholar] [CrossRef] [PubMed]
  74. Carneiro, G.; Nascimento, J.C. The use of on-line co-training to reduce the training set size in pattern recognition methods: Application to left ventricle segmentation in ultrasound. In Proceedings of the 2012 IEEE Conference on Computer Vision and Pattern Recognition, Providence, RI, USA, 16–21 June 2012; pp. 948–955. [Google Scholar]
  75. Ta, K.; Ahn, S.S.; Lu, A.; Stendahl, J.C.; Sinusas, A.J.; Duncan, J.S. A semi-supervised joint learning approach to left ventricular segmentation and motion tracking in echocardiography. In Proceedings of the 2020 IEEE 17th International Symposium on Biomedical Imaging (ISBI), Iowa City, IA, USA, 3–7 April 2020; pp. 1734–1737. [Google Scholar]
  76. Ta, K.; Ahn, S.S.; Stendahl, J.C.; Sinusas, A.J.; Duncan, J.S. A Semi-supervised Joint Network for Simultaneous Left Ventricular Motion Tracking and Segmentation in 4D Echocardiography. In Proceedings of the International Conference on Medical Image Computing and Computer-Assisted Intervention, Lima, Peru, 4–8 October 2020; pp. 468–477. [Google Scholar]
  77. Jafari, M.H.; Girgis, H.; Abdi, A.H.; Liao, Z.; Pesteie, M.; Rohling, R.; Gin, K.; Tsang, T.; Abolmaesumi, P. Semi-supervised learning for cardiac left ventricle segmentation using conditional deep generative models as prior. In Proceedings of the 2019 IEEE 16th International Symposium on Biomedical Imaging (ISBI 2019), Venice, Italy, 8–11 April 2019; pp. 649–652. [Google Scholar]
  78. Parrillo, J.E.; Dellinger, R.P. Critical Care Medicine e-Book: Principles of Diagnosis and Management in the Adult; Elsevier Health Sciences: Amsterdam, The Netherlands, 2018; ISBN 978-0-323-44676-1. [Google Scholar]
  79. Garcìa-Garcìa, H.M.; Gogas, B.D.; Serruys, P.W.; Bruining, N. IVUS-based imaging modalities for tissue characterization: Similarities and differences. Int. J. Cardiovasc. Imaging 2011, 27, 215–224. [Google Scholar] [CrossRef] [Green Version]
  80. Yang, J.; Tong, L.; Faraji, M.; Basu, A. IVUS-Net: An intravascular ultrasound segmentation network. In Proceedings of the International Conference on Smart Multimedia, Toulon, France, 24–26 August 2018; pp. 367–377. [Google Scholar]
  81. Yang, J.; Faraji, M.; Basu, A. Robust segmentation of arterial walls in intravascular ultrasound images using Dual Path U-Net. Ultrasonics 2019, 96, 24–33. [Google Scholar] [CrossRef] [PubMed]
  82. Su, S.; Hu, Z.; Lin, Q.; Hau, W.K.; Gao, Z.; Zhang, H. An artificial neural network method for lumen and media-adventitia border detection in IVUS. Comput. Med. Imaging Graph. 2017, 57, 29–39. [Google Scholar] [CrossRef]
  83. Balakrishna, C.; Dadashzadeh, S.; Soltaninejad, S. Automatic detection of lumen and media in the IVUS images using U-Net with VGG16 Encoder. arXiv 2018, arXiv:1806.07554. [Google Scholar]
  84. Balocco, S.; Gatta, C.; Ciompi, F.; Wahle, A.; Radeva, P.; Carlier, S.; Unal, G.; Sanidas, E.; Mauri, J.; Carillo, X.; et al. Standardized evaluation methodology and reference database for evaluating IVUS image segmentation. Comput. Med. Imaging Graph. 2014, 38, 70–90. [Google Scholar] [CrossRef] [PubMed] [Green Version]
  85. Rockafellar, R.T.; Wets, R.J.B. Variational Analysis; Springer Science & Business Media: Berlin/Heidelberg, Germany, 2009; Volume 317. [Google Scholar]
  86. Badrinarayanan, V.; Kendall, A.; Cipolla, R. Segnet: A deep convolutional encoder-decoder architecture for image segmentation. IEEE Trans. Pattern Anal. Mach. Intell. 2017, 39, 2481–2495. [Google Scholar] [CrossRef] [PubMed]
  87. Bargsten, L.; Riedl, K.A.; Wissel, T.; Brunner, F.J.; Schaefers, K.; Sprenger, J.; Grass, M.; Seiffert, M.; Blankenberg, S.; Schlaefer, A. Tailored methods for segmentation of intravascular ultrasound images via convolutional neural networks. In Proceedings of the Medical Imaging 2021: Ultrasonic Imaging and Tomography, San Diego, CA, USA, 15–20 February 2021; Volume 11602, p. 1160204. [Google Scholar]
  88. Olender, M.L.; Athanasiou, L.S.; Michalis, L.K.; Fotiadis, D.I.; Edelman, E.R. A Domain Enriched Deep Learning Approach to Classify Atherosclerosis Using Intravascular Ultrasound Imaging. IEEE J. Sel. Top. Signal Process. 2020, 14, 1210–1220. [Google Scholar] [CrossRef] [PubMed]
  89. Li, Y.C.; Shen, T.Y.; Chen, C.C.; Chang, W.T.; Lee, P.Y.; Huang, C.C.J. Automatic detection of atherosclerotic plaque and calcification from intravascular ultrasound images by using deep convolutional neural networks. IEEE Trans. Ultrason. Ferroelectr. Freq. Control 2021, 68, 1762–1772. [Google Scholar] [CrossRef]
  90. Junker, R.; Schlebusch, H.; Luppa, P.B. Point-of-care testing in hospitals and primary care. Dtsch. Ärztebl. Int. 2010, 107, 561. [Google Scholar] [CrossRef]
  91. Killu, K.; Coba, V.; Mendez, M.; Reddy, S.; Adrzejewski, T.; Huang, Y.; Ede, J.; Horst, M. Model point-of-care ultrasound curriculum in an intensive care unit fellowship program and its impact on patient management. Crit. Care Res. Pract. 2014, 2014, 934796. [Google Scholar] [CrossRef] [Green Version]
  92. Marin, J.R.; Lewiss, R.E.; American Academy of Pediatrics; Committee on Pediatric Emergency Medicine; American College of Emergency Physicians; Pediatric Emergency Medicine Committee. Point-of-care ultrasonography by pediatric emergency medicine physicians. Pediatrics 2015, 135, e1113–e1122. [Google Scholar] [CrossRef] [Green Version]
  93. Solomon, S.D.; Saldana, F. Point-of-care ultrasound in medical education–stop listening and look. N. Engl. J. Med. 2014, 370, 1083–1085. [Google Scholar] [CrossRef] [Green Version]
  94. Singh, M.R.; Jackson, J.S.; Newberry, M.A.; Riopelle, C.; Tran, V.H.; PoSaw, L.L. Barriers to point-of-care ultrasound utilization during cardiac arrest in the emergency department: A regional survey of emergency physicians. Am. J. Emerg. Med. 2021, 41, 28–34. [Google Scholar] [CrossRef]
  95. Kimura, B.J. Point-of-care cardiac ultrasound techniques in the physical examination: Better at the bedside. Heart 2017, 103, 987–994. [Google Scholar] [CrossRef] [PubMed]
  96. Montinari, M.R.; Minelli, S. The first 200 years of cardiac auscultation and future perspectives. J. Multidiscip. Healthc. 2019, 12, 183. [Google Scholar] [CrossRef] [Green Version]
  97. Di Bello, V.; La Carrubba, S.; Conte, L.; Fabiani, I.; Posteraro, A.; Antonini-Canterin, F.; Barletta, V.; Nicastro, I.; Mariotti, E.; Severino, S.; et al. Incremental value of pocket-sized echocardiography in addition to physical examination during inpatient cardiology evaluation: A multicenter Italian study (SIEC). Echocardiography 2015, 32, 1463–1470. [Google Scholar] [CrossRef] [PubMed]
  98. Fox, J.C.; Lahham, S.; Maldonado, G.; Klaus, S.; Aish, B.; Sylwanowicz, L.V.; Yanuck, J.; Wilson, S.P.; Shieh, M.; Anderson, C.L.; et al. Hypertrophic cardiomyopathy in youth athletes: Successful screening with point-of-care ultrasound by medical students. J. Ultrasound Med. 2017, 36, 1109–1115. [Google Scholar] [CrossRef]
  99. Kalagara, H.; Coker, B.; Gerstein, N.S.; Kukreja, P.; Deriy, L.; Pierce, A.; Townsley, M.M. Point of Care Ultrasound (POCUS) for the Cardiothoracic Anesthesiologist. J. Cardiothorac. Vasc. Anesth. 2021, in press. [Google Scholar] [CrossRef] [PubMed]
  100. Gaspari, R.; Weekes, A.; Adhikari, S.; Noble, V.E.; Nomura, J.T.; Theodoro, D.; Woo, M.; Atkinson, P.; Blehar, D.; Brown, S.M.; et al. Emergency department point-of-care ultrasound in out-of-hospital and in-ED cardiac arrest. Resuscitation 2016, 109, 33–39. [Google Scholar] [CrossRef] [PubMed]
  101. Montoya, J.; Stawicki, S.; Evans, D.C.; Bahner, D.; Sparks, S.; Sharpe, R.; Cipolla, J. From FAST to E-FAST: An overview of the evolution of ultrasound-based traumatic injury assessment. Eur. J. Trauma Emerg. Surg. 2016, 42, 119–126. [Google Scholar] [CrossRef]
  102. Blaivas, M.; Blaivas, L. Are all deep learning architectures alike for point-of-care ultrasound? Evidence from a cardiac image classification model suggests otherwise. J. Ultrasound Med. 2020, 39, 1187–1194. [Google Scholar] [CrossRef]
  103. Blaivas, M.; Blaivas, L.; Philips, G.; Merchant, R.; Levy, M.; Abbasi, A.; Eickhoff, C.; Shapiro, N.; Corl, K. Development of a deep learning network to classify inferior vena cava collapse to predict fluid responsiveness. J. Ultrasound Med. 2021, 40, 1495–1504. [Google Scholar] [CrossRef] [PubMed]
  104. Khan, S.; Huh, J.; Ye, J.C. Contrast and Resolution Improvement of POCUS Using Self-consistent CycleGAN. In Domain Adaptation and Representation Transfer, and Affordable Healthcare and AI for Resource Diverse Global Health; Springer: Berlin/Heidelberg, Germany, 2021; pp. 158–167. [Google Scholar]
  105. Shokoohi, H.; LeSaux, M.A.; Roohani, Y.H.; Liteplo, A.; Huang, C.; Blaivas, M. Enhanced point-of-care ultrasound applications by integrating automated feature-learning systems using deep learning. J. Ultrasound Med. 2019, 38, 1887–1897. [Google Scholar] [CrossRef]
  106. Blaivas, M.; Arntfield, R.; White, M. DIY AI, deep learning network development for automated image classification in a point-of-care ultrasound quality assurance program. J. Am. Coll. Emerg. Physicians Open 2020, 1, 124–131. [Google Scholar] [CrossRef] [Green Version]
  107. Cheema, B.S.; Walter, J.; Narang, A.; Thomas, J.D. Artificial intelligence–enabled POCUS in the COVID-19 ICU: A new spin on cardiac ultrasound. Case Rep. 2021, 3, 258–263. [Google Scholar]
  108. Naghavi, M.; Libby, P.; Falk, E.; Casscells, S.W.; Litovsky, S.; Rumberger, J.; Badimon, J.J.; Stefanadis, C.; Moreno, P.; Pasterkamp, G.; et al. From vulnerable plaque to vulnerable patient: A call for new definitions and risk assessment strategies: Part I. Circulation 2003, 108, 1664–1672. [Google Scholar] [CrossRef] [PubMed]
  109. Gao, P.; Chen, Z.Q.; Bao, Y.H.; Jiao, L.Q.; Ling, F. Correlation between carotid intraplaque hemorrhage and clinical symptoms: Systematic review of observational studies. Stroke 2007, 38, 2382–2390. [Google Scholar] [CrossRef] [Green Version]
  110. Cao, Y.; Hui, J.; Kole, A.; Wang, P.; Yu, Q.; Chen, W.; Sturek, M.; Cheng, J.X. High-sensitivity intravascular photoacoustic imaging of lipid–laden plaque with a collinear catheter design. Sci. Rep. 2016, 6, 1–8. [Google Scholar] [CrossRef] [PubMed] [Green Version]
  111. Wu, M.; Jansen, K.; Springeling, G.; van der Steen, A.F.; van Soest, G. Impact of device geometry on the imaging characteristics of an intravascular photoacoustic catheter. Appl. Opt. 2014, 53, 8131–8139. [Google Scholar] [CrossRef] [PubMed]
  112. Iskander-Rizk, S.; Wu, M.; Springeling, G.; Mastik, F.; Beurskens, R.H.; van der Steen, A.F.; van Soest, G. Catheter design optimization for practical intravascular photoacoustic imaging (IVPA) of vulnerable plaques. In Proceedings of the Diagnostic and Therapeutic Applications of Light in Cardiology 2018, San Francisco, CA, USA, 27–28 January 2018; Volume 10471, p. 1047111. [Google Scholar]
  113. Li, Y.; Gong, X.; Liu, C.; Lin, R.; Hau, W.; Bai, X.; Song, L. High-speed intravascular spectroscopic photoacoustic imaging at 1000 A-lines per second with a 0.9-mm diameter catheter. J. Biomed. Opt. 2015, 20, 065006. [Google Scholar] [CrossRef]
  114. Wu, M.; van der Steen, A.F.; Regar, E.; van Soest, G. Emerging technology update intravascular photoacoustic imaging of vulnerable atherosclerotic plaque. Interv. Cardiol. Rev. 2016, 11, 120. [Google Scholar] [CrossRef] [Green Version]
  115. Jansen, K.; Wu, M.; van der Steen, A.F.; van Soest, G. Lipid detection in atherosclerotic human coronaries by spectroscopic intravascular photoacoustic imaging. Opt. Express 2013, 21, 21472–21484. [Google Scholar] [CrossRef] [Green Version]
  116. Jansen, K.; Wu, M.; van der Steen, A.F.; van Soest, G. Photoacoustic imaging of human coronary atherosclerosis in two spectral bands. Photoacoustics 2014, 2, 12–20. [Google Scholar] [CrossRef] [Green Version]
  117. Piao, Z.; Ma, T.; Li, J.; Wiedmann, M.T.; Huang, S.; Yu, M.; Kirk Shung, K.; Zhou, Q.; Kim, C.S.; Chen, Z. High speed intravascular photoacoustic imaging with fast optical parametric oscillator laser at 1.7 μm. Appl. Phys. Lett. 2015, 107, 083701. [Google Scholar] [CrossRef] [Green Version]
  118. Sethuraman, S.; Amirian, J.H.; Litovsky, S.H.; Smalling, R.W.; Emelianov, S.Y. Ex vivo characterization of atherosclerosis using intravascular photoacoustic imaging. Opt. Express 2007, 15, 16657–16666. [Google Scholar] [CrossRef] [PubMed]
  119. Zhang, J.; Yang, S.; Ji, X.; Zhou, Q.; Xing, D. Characterization of lipid-rich aortic plaques by intravascular photoacoustic tomography: Ex vivo and in vivo validation in a rabbit atherosclerosis model with histologic correlation. J. Am. Coll. Cardiol. 2014, 64, 385–390. [Google Scholar] [CrossRef] [PubMed] [Green Version]
  120. Wang, B.; Su, J.L.; Amirian, J.; Litovsky, S.H.; Smalling, R.; Emelianov, S. Detection of lipid in atherosclerotic vessels using ultrasound-guided spectroscopic intravascular photoacoustic imaging. Opt. Express 2010, 18, 4889–4897. [Google Scholar] [CrossRef] [PubMed] [Green Version]
  121. Iskander-Rizk, S.; van der Steen, A.F.W.; van Soest, G. Photoacoustic imaging for guidance of interventions in cardiovascular medicine. Phys. Med. Biol. 2019, 64, 16TR01. [Google Scholar] [CrossRef] [Green Version]
  122. Wang, B.; Karpiouk, A.; Yeager, D.; Amirian, J.; Litovsky, S.; Smalling, R.; Emelianov, S. Intravascular photoacoustic imaging of lipid in atherosclerotic plaques in the presence of luminal blood. Opt. Lett. 2012, 37, 1244–1246. [Google Scholar] [CrossRef]
  123. Wu, M.; Jansen, K.; van der Steen, A.F.; van Soest, G. Specific imaging of atherosclerotic plaque lipids with two-wavelength intravascular photoacoustics. Biomed. Opt. Express 2015, 6, 3276–3286. [Google Scholar] [CrossRef] [PubMed] [Green Version]
  124. Iskander-Rizk, S.; Visscher, M.; Moerman, A.M.; Korteland, S.A.; Van der Heiden, K.; Van der Steen, A.F.; Van Soest, G. Micro Spectroscopic Photoacoustic (μsPA) imaging of advanced carotid atherosclerosis. Photoacoustics 2021, 22, 100261. [Google Scholar] [CrossRef] [PubMed]
  125. Wang, B.; Yantsen, E.; Larson, T.; Karpiouk, A.B.; Sethuraman, S.; Su, J.L.; Sokolov, K.; Emelianov, S.Y. Plasmonic intravascular photoacoustic imaging for detection of macrophages in atherosclerotic plaques. Nano Lett. 2009, 9, 2212–2217. [Google Scholar] [CrossRef]
  126. Bui, N.Q.; Hlaing, K.K.; Lee, Y.W.; Kang, H.W.; Oh, J. Ex vivo detection of macrophages in atherosclerotic plaques using intravascular ultrasonic-photoacoustic imaging. Phys. Med. Biol. 2016, 62, 501. [Google Scholar]
  127. Qin, H.; Zhao, Y.; Zhang, J.; Pan, X.; Yang, S.; Xing, D. Inflammation-targeted gold nanorods for intravascular photoacoustic imaging detection of matrix metalloproteinase-2 (MMP2) in atherosclerotic plaques. Nanomed. Nanotechnol. Biol. Med. 2016, 12, 1765–1774. [Google Scholar] [CrossRef]
  128. Wu, C.; Zhang, Y.; Li, Z.; Li, C.; Wang, Q. A novel photoacoustic nanoprobe of ICG@ PEG-Ag 2 S for atherosclerosis targeting and imaging in vivo. Nanoscale 2016, 8, 12531–12539. [Google Scholar] [CrossRef] [PubMed]
  129. Weidenfeld, I.; Zakian, C.; Duewell, P.; Chmyrov, A.; Klemm, U.; Aguirre, J.; Ntziachristos, V.; Stiel, A.C. Homogentisic acid-derived pigment as a biocompatible label for optoacoustic imaging of macrophages. Nat. Commun. 2019, 10, 1–12. [Google Scholar] [CrossRef] [Green Version]
  130. Xie, Z.; Shu, C.; Yang, D.; Chen, H.; Chen, C.; Dai, G.; Lam, K.H.; Zhang, J.; Wang, X.; Sheng, Z.; et al. In vivo intravascular photoacoustic imaging at a high speed of 100 frames per second. Biomed. Opt. Express 2020, 11, 6721–6731. [Google Scholar] [CrossRef] [PubMed]
  131. Arabul, M.U.; Heres, M.; Rutten, M.C.; van Sambeek, M.R.; van de Vosse, F.N.; Lopata, R.G. Toward the detection of intraplaque hemorrhage in carotid artery lesions using photoacoustic imaging. J. Biomed. Opt. 2016, 22, 041010. [Google Scholar] [CrossRef]
  132. Muller, J.W.; van Hees, R.; van Sambeek, M.; Boutouyrie, P.; Rutten, M.; Brands, P.; Wu, M.; Lopata, R. Towards in vivo photoacoustic imaging of vulnerable plaques in the carotid artery. Biomed. Opt. Express 2021, 12, 4207–4218. [Google Scholar] [CrossRef]
  133. Neuschmelting, V.; Burton, N.C.; Lockau, H.; Urich, A.; Harmsen, S.; Ntziachristos, V.; Kircher, M.F. Performance of a multispectral optoacoustic tomography (MSOT) system equipped with 2D vs. 3D handheld probes for potential clinical translation. Photoacoustics 2016, 4, 1–10. [Google Scholar] [CrossRef] [PubMed] [Green Version]
  134. Merčep, E.; Deán-Ben, X.L.; Razansky, D. Imaging of blood flow and oxygen state with a multi-segment optoacoustic ultrasound array. Photoacoustics 2018, 10, 48–53. [Google Scholar] [CrossRef]
  135. Taruttis, A.; Herzog, E.; Razansky, D.; Ntziachristos, V. Real-time imaging of cardiovascular dynamics and circulating gold nanorods with multispectral optoacoustic tomography. Opt. Express 2010, 18, 19592–19602. [Google Scholar] [CrossRef]
  136. Deán-Ben, X.L.; Razansky, D. Functional optoacoustic human angiography with handheld video rate three dimensional scanner. Photoacoustics 2013, 1, 68–73. [Google Scholar] [CrossRef] [Green Version]
  137. Ivankovic, I.; Merčep, E.; Schmedt, C.G.; Deán-Ben, X.L.; Razansky, D. Real-time volumetric assessment of the human carotid artery: Handheld multispectral optoacoustic tomography. Radiology 2019, 291, 45–50. [Google Scholar] [CrossRef] [PubMed] [Green Version]
  138. Karlas, A.; Reber, J.; Diot, G.; Bozhko, D.; Anastasopoulou, M.; Ibrahim, T.; Schwaiger, M.; Hyafil, F.; Ntziachristos, V. Flow-mediated dilatation test using optoacoustic imaging: A proof-of-concept. Biomed. Opt. Express 2017, 8, 3395–3403. [Google Scholar] [PubMed] [Green Version]
  139. Taruttis, A.; Timmermans, A.C.; Wouters, P.C.; Kacprowicz, M.; van Dam, G.M.; Ntziachristos, V. Optoacoustic imaging of human vasculature: Feasibility by using a handheld probe. Radiology 2016, 281, 256–263. [Google Scholar] [CrossRef] [Green Version]
  140. Karlas, A.; Kallmayer, M.; Bariotakis, M.; Fasoula, N.A.; Liapis, E.; Hyafil, F.; Pelisek, J.; Wildgruber, M.; Eckstein, H.H.; Ntziachristos, V. Multispectral optoacoustic tomography of lipid and hemoglobin contrast in human carotid atherosclerosis. Photoacoustics 2021, 23, 100283. [Google Scholar] [CrossRef]
  141. Steinkamp, P.J.; Vonk, J.; Huisman, L.A.; Meersma, G.J.; Diercks, G.F.; Hillebrands, J.L.; Nagengast, W.B.; Zeebregts, C.J.; Slart, R.H.; Boersma, H.H.; et al. VEGF-Targeted Multispectral Optoacoustic Tomography and Fluorescence Molecular Imaging in Human Carotid Atherosclerotic Plaques. Res. Square 2021. [Google Scholar] [CrossRef] [PubMed]
  142. Kang, D.; Huang, Q.; Li, Y. Measurement of cardiac output by use of noninvasively measured transient hemodilution curves with photoacoustic technology. Biomed. Opt. Express 2014, 5, 1445–1452. [Google Scholar] [CrossRef] [Green Version]
  143. Kang, D.; Huang, Q.; Li, Y. Noninvasive photoacoustic measurement of the composite indicator dilution curve for cardiac output estimation. Biomed. Opt. Express 2015, 6, 536–543. [Google Scholar] [CrossRef] [PubMed] [Green Version]
  144. Stewart, S.; Hart, C.L.; Hole, D.J.; McMurray, J.J. A population-based study of the long-term risks associated with atrial fibrillation: 20-year follow-up of the Renfrew/Paisley study. Am. J. Med. 2002, 113, 359–364. [Google Scholar] [CrossRef]
  145. Bouchard, R.; Dana, N.; Di Biase, L.; Natale, A.; Emelianov, S. Photoacoustic characterization of radiofrequency ablation lesions. In Proceedings of the Photons Plus Ultrasound: Imaging and Sensing 2012, San Francisco, CA, USA, 22–24 January 2012; Volume 8223, p. 82233K. [Google Scholar]
  146. Iskander-Rizk, S.; Kruizinga, P.; Beurskens, R.; Springeling, G.; Mastik, F.; de Groot, N.M.; Knops, P.; van der Steen, A.F.; van Soest, G. Real-time photoacoustic assessment of radiofrequency ablation lesion formation in the left atrium. Photoacoustics 2019, 16, 100150. [Google Scholar] [CrossRef]
  147. Dana, N.; Di Biase, L.; Natale, A.; Emelianov, S.; Bouchard, R. In vitro photoacoustic visualization of myocardial ablation lesions. Heart Rhythm 2014, 11, 150–157. [Google Scholar] [CrossRef] [PubMed] [Green Version]
  148. Özsoy, Ç.; Floryan, M.; Deán-Ben, X.L.; Razansky, D. Endocardial irrigated catheter for volumetric optoacoustic mapping of radio-frequency ablation lesion progression. Opt. Lett. 2019, 44, 5808–5811. [Google Scholar] [CrossRef] [PubMed]
  149. Li, M.; Vu, T.; Sankin, G.; Winship, B.; Boydston, K.; Terry, R.; Zhong, P.; Yao, J. Internal-illumination photoacoustic tomography enhanced by a graded-scattering fiber diffuser. IEEE Trans. Med. Imaging 2020, 40, 346–356. [Google Scholar] [CrossRef]
  150. Özsoy, Ç.; Özbek, A.; Reiss, M.; Deán-Ben, X.L.; Razansky, D. Ultrafast four-dimensional imaging of cardiac mechanical wave propagation with sparse optoacoustic sensing. Proc. Natl. Acad. Sci. USA 2021, 118, 45. [Google Scholar] [CrossRef] [PubMed]
  151. Deng, H.; Qiao, H.; Dai, Q.; Ma, C. Deep learning in photoacoustic imaging: A review. J. Biomed. Opt. 2021, 26, 040901. [Google Scholar] [CrossRef] [PubMed]
  152. Yang, C.; Lan, H.; Gao, F.; Gao, F. Review of deep learning for photoacoustic imaging. Photoacoustics 2021, 21, 100215. [Google Scholar] [CrossRef]
  153. Gröhl, J.; Schellenberg, M.; Dreher, K.; Maier-Hein, L. Deep learning for biomedical photoacoustic imaging: A review. Photoacoustics 2021, 22, 100241. [Google Scholar] [CrossRef] [PubMed]
  154. Waibel, D.; Gröhl, J.; Isensee, F.; Kirchner, T.; Maier-Hein, K.; Maier-Hein, L. Reconstruction of initial pressure from limited view photoacoustic images using deep learning. In Proceedings of the Photons Plus Ultrasound: Imaging and Sensing 2018, San Francisco, CA, USA, 28 January–1 February 2018; Volume 10494, p. 104942S. [Google Scholar]
  155. Lan, H.; Yang, C.; Jiang, D.; Gao, F. Reconstruct the photoacoustic image based on deep learning with multi-frequency ring-shape transducer array. In Proceedings of the 2019 41st Annual International Conference of the IEEE Engineering in Medicine and Biology Society (EMBC), Berlin, Germany, 23–27 July 2019; pp. 7115–7118. [Google Scholar]
  156. Antholzer, S.; Haltmeier, M.; Schwab, J. Deep learning for photoacoustic tomography from sparse data. Inverse Probl. Sci. Eng. 2019, 27, 987–1005. [Google Scholar] [CrossRef] [PubMed] [Green Version]
  157. Hsu, K.T.; Guan, S.; Chitnis, P.V. Comparing deep learning frameworks for photoacoustic tomography image reconstruction. Photoacoustics 2021, 23, 100271. [Google Scholar] [CrossRef] [PubMed]
  158. Kim, M.; Jeng, G.S.; Pelivanov, I.; O’Donnell, M. Deep-learning image reconstruction for real-time photoacoustic system. IEEE Trans. Med. Imaging 2020, 39, 3379–3390. [Google Scholar] [CrossRef]
  159. Lan, H.; Jiang, D.; Yang, C.; Gao, F.; Gao, F. Y-Net: Hybrid deep learning image reconstruction for photoacoustic tomography in vivo. Photoacoustics 2020, 20, 100197. [Google Scholar]
  160. Cai, C.; Deng, K.; Ma, C.; Luo, J. End-to-end deep neural network for optical inversion in quantitative photoacoustic imaging. Opt. Lett. 2018, 43, 2752–2755. [Google Scholar] [CrossRef] [PubMed]
  161. Chlis, N.K.; Karlas, A.; Fasoula, N.A.; Kallmayer, M.; Eckstein, H.H.; Theis, F.J.; Ntziachristos, V.; Marr, C. A sparse deep learning approach for automatic segmentation of human vasculature in multispectral optoacoustic tomography. Photoacoustics 2020, 20, 100203. [Google Scholar] [CrossRef] [PubMed]
  162. Yuan, A.Y.; Gao, Y.; Peng, L.; Zhou, L.; Liu, J.; Zhu, S.; Song, W. Hybrid deep learning network for vascular segmentation in photoacoustic imaging. Biomed. Opt. Express 2020, 11, 6445–6457. [Google Scholar] [CrossRef] [PubMed]
  163. Gröhl, J.; Schellenberg, M.; Dreher, K.K.; Holzwarth, N.; Tizabi, M.D.; Seitel, A.; Maier-Hein, L. Semantic segmentation of multispectral photoacoustic images using deep learning. In Proceedings of the Photons Plus Ultrasound: Imaging and Sensing 2021, Online, 6–11 March 2021; Volume 11642, p. 116423F. [Google Scholar]
  164. Yang, H.; Jüstel, D.; Prakash, J.; Karlas, A.; Helfen, A.; Masthoff, M.; Wildgruber, M.; Ntziachristos, V. Soft ultrasound priors in optoacoustic reconstruction: Improving clinical vascular imaging. Photoacoustics 2020, 19, 100172. [Google Scholar]
  165. Voulodimos, A.; Doulamis, N.; Doulamis, A.; Protopapadakis, E. Deep learning for computer vision: A brief review. Comput. Intell. Neurosci. 2018, 2018, 7068349. [Google Scholar] [CrossRef] [PubMed]
  166. Kouw, W.M.; Loog, M. A review of single-source unsupervised domain adaptation. arXiv 2019, arXiv:1901.05335. [Google Scholar]
  167. Arabul, M.; Rutten, M.; Bruneval, P.; van Sambeek, M.; van de Vosse, F.; Lopata, R. Unmixing multi-spectral photoacoustic sources in human carotid plaques using non-negative independent component analysis. Photoacoustics 2019, 15, 100140. [Google Scholar] [CrossRef]
  168. An, L.; Cox, B. Independent component analysis for unmixing multi-wavelength photoacoustic images. In Proceedings of the Photons Plus Ultrasound: Imaging and Sensing 2016, San Francisco, CA, USA, 14–17 February 2016; Volume 9708, p. 970851. [Google Scholar]
  169. Ding, L.; Deán-Ben, X.L.; Burton, N.C.; Sobol, R.W.; Ntziachristos, V.; Razansky, D. Constrained inversion and spectral unmixing in multispectral optoacoustic tomography. IEEE Trans. Med. Imaging 2017, 36, 1676–1685. [Google Scholar] [CrossRef]
  170. Cao, Y.; Kole, A.; Lan, L.; Wang, P.; Hui, J.; Sturek, M.; Cheng, J.X. Spectral analysis assisted photoacoustic imaging for lipid composition differentiation. Photoacoustics 2017, 7, 12–19. [Google Scholar] [CrossRef] [PubMed]
Figure 1. Conventional machine learning vs. DL for a classification task.
Sensors 21 07947 g001
Figure 2. Echocardiographic apical views: (a) Apical 2 Chamber view (A2C), (b) Apical 4 Chamber view (A4C) and (c) Apical Long-Axis view (ALX). (Courtesy and copyrights: 123sonography.com) (Reprinted from [44] with permission).
Sensors 21 07947 g002
Figure 3. Illustration of LV segmentation for four sample subjects. The results of the semi-supervised method and U-net are shown by blue and cyan colors, respectively. The red color indicates the ground truth. Reprint from [77] with permission.
Sensors 21 07947 g003
Figure 4. Example results of detecting the lumen and media borders for images obtained at 20 MHz (first row) and 40 MHz (second row). The segmentation results for lumen and media are shown by cyan and red colors, respectively. The yellow dashed lines show manual annotations by experts [84]. Reprint from [81] with permission.
Sensors 21 07947 g004
Figure 5. Schematic of different IVPA catheter designs. (a) Schematic of a collinear IVPA catheter design. (b) Schematic of an IVPA catheter with a longitudinal offset between optical and acoustic beams (red optical beam and green ultrasound beam). Reprinted from [114] with permission.
Sensors 21 07947 g005
Figure 6. (a) IVUS, (b) IVPA, and (c) combined IVUS/IVPA images of an atherosclerotic rabbit aorta acquired in the presence of blood. (d) Combined IVUS/IVPA image of the same cross section of the aorta imaged in saline. IVUS and IVPA images are displayed at 35 dB and 20 dB, respectively. The scale bar is 1 mm. (e) H&E and (f) Oil red O stain of the tissue slice adjacent to the imaged tissue cross section indicate that the aorta has lipid-rich plaque. (Reprint from [122] with permission).
Sensors 21 07947 g006
Figure 7. Ex vivo lipid differentiation result of an atherosclerotic human coronary artery. (a) Histology: Oil Red O staining of the IVPA/IVUS imaging cross section (lipids are in red). (b) Lipid differentiation map overlaid on a co-registered US image of the coronary artery. The lipids in plaques are in yellow whereas lipids in the peri-adventitial tissue are in red. The dynamic range of the US image is 45 dB. Reprint from [123] with permission.
Sensors 21 07947 g007
Figure 8. HDP facilitates single-cell visualization with raster-scan optoacoustic mesoscopy (RSOM). Signals of HDP-laden primary macrophages are separated from hemoglobin in blood-agar phantoms and depicted in a volumetric scatter plot. Subcutaneous injection in the dorsal area of a FoxN1 nude mouse of the cells measured in (a). A catheter was used to determine the injection area and scans were recorded pre- (b,d) and post (c,e) cell injection showing the top view and a depth profile. The opening of the needle is seen on the right side of the images from which the macrophages emerge post injection as a dense line-up (arrows), 0.7–1 mm below the skin surface (–). Blood vessels are faintly detected at 630 nm and indicated by *. Scale bars are 500 µm in x, y, and z. Inset in panel (c) shows labeled macrophages in histological tissue sections with Schmorl’s staining. The outtake corresponds to an area near the needle tip. Scale bar is 50 µm. Reprinted from [129] with permission.
Sensors 21 07947 g008
Figure 9. In vivo PA and US image of a human carotid artery with intraplaque hemorrhage; (A) US image; (B) overlaid PA/US image (808 nm, dynamic range 23 dB); (C) photo of the carotid plaque during the CEA surgery; (D) Masson’s trichrome staining of the artery. The area indicated in green is a lipid core filled with a large hemorrhage. The highlighted boxes show two regions of hemorrhages found in the plaque. Reprinted from [132] with permission.
Sensors 21 07947 g009
Figure 10. PA image of the common carotid artery based on the MSOT system. (a) PA image at 800 nm shows increased vascularization of the skin, strap and sternocleidomastoid muscles, allowing for a clear identification of the common carotid artery and internal jugular vein. (b) US image revealing the common carotid artery and jugular vein as echo-free structures. (c) Map of the unmixed distribution of oxygenated hemoglobin (HbO2). (d) The corresponding map of the deoxygenated hemoglobin (Hb). CCA: common carotid artery; STM: sternocleidomastoid muscle; SM: strap muscle; IJV: internal jugular vein; L: thyroid lobe. Reprinted from [134] with permission.
Sensors 21 07947 g010
Figure 11. Three-dimensional rendering (A) of TCM volume with clipping plane corresponding to tissue bisection (B). Matching top- (C) and side-view (D) gross pathology photographs with axes and FOVs indicated by arrows and boxes, respectively. Reprinted from [147] with permission.
Sensors 21 07947 g011
Figure 12. Ablation monitoring in a beating heart. (a) 2 λ PA images before, during and after ablation, available as Movie 2. (b) I790 equivalents. 2 λ PA data confirm lesion formation. (c) Photograph of lesion made. (d) Video endoscopy frame confirming a lesion was made. (e) Sketch of instruments positions. Round inset: ICE-C and RFPA-C relative to the valve, oriented as in the images in (a,b). ICE catheter (ICE-C); PA-enabled ablation catheter (RFPA-C). Mitral valve (MV). Cyan arrows indicate indentation formed by ablation. Reprinted from [146] with permission.
Sensors 21 07947 g012
Table 1. Popular DL models used for various cardiac ultrasound applications.
ApplicationPopular Deep Learning Models
Cardiac viewpoint classificationCustom architecture based on VGG, ResNet, DenseNet [50]; Custom architecture based on CNNs [49]; Custom architecture fusing spatial and temporal information using CNNs [48]
LV segmentationU-net-based architectures [59,60,62,63,71]; CNN [61]; Deep belief network (DBN) [55,68,69,70,74]; U-net combined with RNNs [64,67,75]; U-net with TL-net [72,77]
IVUS image segmentationU-net-based architectures [80,81,83,87,89], Autoencoder [82], CNN [88]
Point of care ultrasound (POCUS)AlexNet, VGG-16, VGG-19, ResNet50, DenseNet201 [102]; LSTM [103]; CycleGAN [104];
Publisher’s Note: MDPI stays neutral with regard to jurisdictional claims in published maps and institutional affiliations.

