Abstract
Infrared Thermography (IRT) is a non-contact, non-intrusive, and non-ionizing radiation tool used for detecting breast lesions. This paper analyzes the surface temperature distribution (STD) on an optimal Region of Interest (RoI) for extraction of suitable internal heat source parameters. The physiological parameters are estimated through the inverse solution of the bio-heat equation and the STD of suspicious areas related to the hottest spots of the RoI. To reach these values, the STD is analyzed by means: the Depth-Intensity-Radius (D-I-R) measurement model and the fitting method of Lorentz curve. A highly discriminative pattern vector composed of the extracted physiological parameters is proposed to classify normal and abnormal breast thermograms. A well-defined RoI is delimited at a radial distance, determined by the Support Vector Machines (SVM). Nevertheless, this distance is less than or equal to cm due to the maximum temperature location close to the boundary image. The methodology is applied to 87 breast thermograms that belong to the Database for Mastology Research with Infrared Image (-). This methodology does not apply any image enhancements or normalization of input data. At an optimal position, the three-dimensional scattergrams show a correct separation between normal and abnormal thermograms. In other cases, the feature vectors are highly correlated. According to our experimental results, the proposed pattern vector extracted at optimal position cm reaches the highest sensitivity, specificity, and accuracy. Even more, the proposed technique utilizes a reduced number of physiological parameters to obtain a Correct Rate Classification (CRC) of 100%. The precision assessment confirms the performance superiority of the proposed method compared with other techniques for the breast thermogram classification of the -.
1. Introduction
It is well known that body temperature is a standard indicator of health status in humans. IRT records radiant energy that is emitted by the human body at wavelengths between 2 μm and 14 μm. Infrared energy is a function of skin temperature with an average emissivity of 0.97–0.99 [1], then an IR image gives the temperature distribution of the human body. In 1963, Lawson and Chughtai [2] reported the use of surface temperature measurements as a possible tool for breast cancer diagnosis. They found that the diseases make the thermal gradient vary in this area, and subtle thermal abnormalities can be related to a particular disorder. Thenceforth, research on medical applications of infrared technology has been published, and different databases have been created, such as the public - [3,4]. The first one on the quantitative relationship describing the temperature distribution in human tissue and considering blood flow effects based on the continuum theory was presented by Harry H. Pennes [5]. Even more, a hot spot in the surface temperature distribution, related to tumor tissue, has been modeled as a point heat source [6]. A model of the internal heat source is illustrated in Figure 1. Several papers [6,7,8,9,10,11,12] point out that an inverse solution of the bio-heat equation can be used for the estimation of a point heat source parameters: intensity q, depth d, position a, and radius R, from the STD of the thermal input data. Table 1 describes the thermal and biological parameters used in this paper.
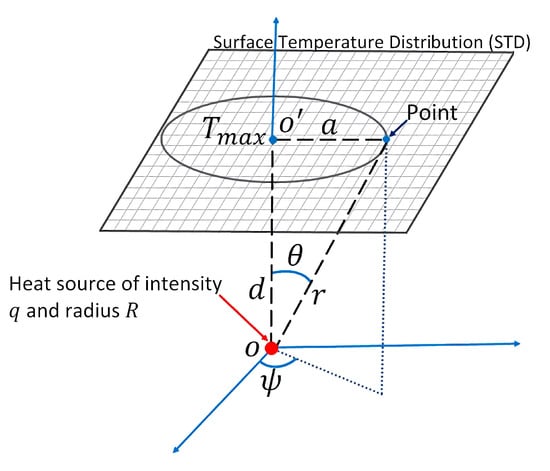
Figure 1.
Scheme of the theoretical model of an internal heat source with depth d, intensity q, and radius R.

Table 1.
Thermal and physical parameters of tumor.
Guilian Shi et al. [8,9] make use of the biological heat transfer model and the fitting method of Lorentz curve for the extraction of the above-mentioned physiological parameters. The distribution and tendency of the curve are related to the typification of breast lesions. They established a criterion based on the angle of inclination of the curves to solve this problem. Nevertheless, the curve shows ripples or oscillations that make it difficult to establish a single angle value. Hossain et al. [6] developed a methodology for the heat source parameters calculation, and it is based on the D-I-R measurement model. This model has been implemented numerically to calculate the parameters. Rastgar-Jazi et al. [10] establish a range for intensity q depending on the a position when the D-I-R model is applied. In this context, mostly numerical and simulated analyses have been done [6,7,10,11,12]. In general, most of the authors establish a range of values for q [10,11,12]. It leads to ambiguous risk decisions when a single value for q is defined. Even more, a unique value of q in a well-defined a position is needed to classify normal and abnormal breast thermograms. Some works [8,9] make use of the angle of the mentioned above curve for the diagnosis of breast diseases. Then again, the trend of the curve also causes uncertainty when a unique angle must be defined. Additionally, the breast thermogram categorization can use other thermal characteristics as the temperature increases for the tissue [13], but it is not a determining feature since the maximum temperature in the thermal breast data can be greater than 3 °C and be labeled as healthy.
Therefore, based on the solution of the inverse heat conduction problem, we propose a highly discriminative pattern vector composed of physiological parameters to classify normal and abnormal thermograms. In addition, a well-defined RoI from the input STD is analyzed to extract the internal heat source parameters. Through SVM, the optimal radial distance a of the RoI is determined [14]. The proposed methodology was applied to 87 breast thermograms that belong to the - [3,4]. The proposed pattern vector is composed of the physiological parameters {} and is used for the classification by means of SVM. The three-dimensional feature space proofs the discrimination power of the proposed pattern vector, allowing the correct separation of both classes. At an optimal radial distance a of the RoI and through (1) the fitting method of Lorentz curve and (2) the D-I-R model, a CRC of % and 100%, respectively, are obtained using the physiological descriptors. The applied methodology allows reducing the rate of false-positives or false-negatives. Figure 2 shows the research methodology flowchart.
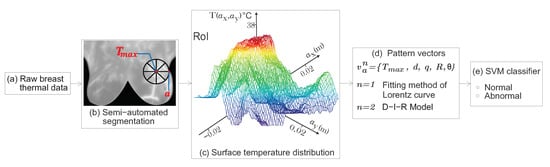
Figure 2.
Flowchart of the proposed method. (a) Thermal data were obtained from the -. (b) A well-defined RoI is delimited at an optimal radial distance a. As we can see, the RoI encircle the temperature area to be analyzed. (c) Surface temperature distribution related to the hottest spot of the RoI. (d) A proposed highly discriminative pattern vector is composed by the physiological parameters from the point heat source. (e) Classification step using SVM.
In this manuscript, the sections are organized as follows: The raw thermal data and the semi-automated segmentation algorithm are reported in Section 2. Moreover, a review of the methods for estimating physiological parameters based on an inverse solution of the bio-heat equation from the input surface temperature matrix is given. The classification process of a set of breast thermograms belonging to the - in normal and abnormal classes using SVM is also described. In Section 3, the experimental results obtained by extracting the physiological parameters of a well-defined RoI from the breast thermograms are presented. Furthermore, the three-dimensional feature space of the above-mentioned parameters and the classification percentages are given. Section 4 is dedicated to discussing the results. Finally, the conclusions are summarized in Section 5.
2. Materials and Methods
2.1. Image Database
The public - has been used to evaluate the performance of statistical methods to classify breast thermograms into normal and abnormal [3,4,15,16]. This database contains thermal images with their corresponding clinical data. It consists of 287 volunteers, of which 244 are reported as healthy, 39 sick, and 4 with an unknown diagnosis [4]. The diagnosis in people was made by mammography and/or biopsy. Frontal images are considered for this analysis. Table 2 shows the FLIR thermal camera specifications used by Silva et al. [4] to capture breast thermograms. The FLIR camera has a 24 standard lens with focal length mm [17]. The standard distance between the thermal camera and the patient is 1 m [4]. The object height is given by cm [18]. Therefore, the pixel size in the object plane is cm.
Table 2.
Technical specifications of the FLIR sensor [4,17].
2.2. Segmentation of Breast Thermograms
A semi-automated segmentation algorithm is implemented employing a cubic degree polynomial curve fitting [19,20]. A binary image mask of size pixels is created to eliminate the area under the inframammary curves detected by the polynomial curve fitting [21]. Neither image enhancements nor normalization of input data is done. Once the breast image is segmented, the temperature changes are clustered using the thermal gradient, thus facilitating the location of the RoI, which is shown in Figure 3b. The hottest region of thermal images is defined as the RoI with a radial distance a, and it is shown in Figure 3c.
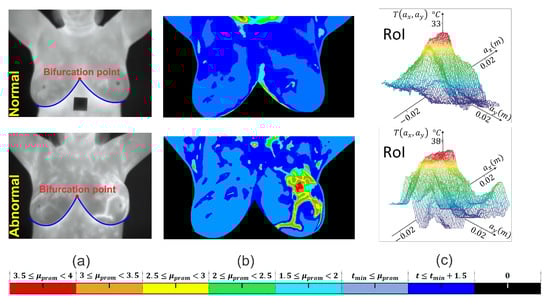
Figure 3.
RoI delimitation process. (a) Segmentation procedure based on the detection of the inframammary line by a polynomial curve fitting. (b) Visualization of a clustered thermal pattern through thermal gradients. (c) Centered RoI around the hottest point with radial distance a.
2.3. Heat Source Model: A Mathematical Review
The Pennes bio-heat equation is used to analyze the interior temperature distribution of biological tissue. It is given as [5],
Table 1 describes each variable in Equation (1). The terms are merged to be the internal heat source. A solution of Equation (1) is given by [6,7,12],
The maximum temperature is obtained when , which is the temperature at the point in Figure 1. Suppose a is the distance from point to an arbitrary point on body surface, then . Therefore,
Abnormal tissue can be modeled as a spherical heat source with intensity q, radius R, and depth d [6,10]. Then,
where is the temperature at any arbitrary point a on the STD of the thermal input data. The temperature distribution is obtained from the thermal input data at each side of the maximum temperature point . Thermal vectors are acquired in all four directions and are represented as straight lines of radial distance a as shown in Figure 4a. In this work, the four thermal vectors are averaged. Figure 4b shows the mean surface temperature distribution.
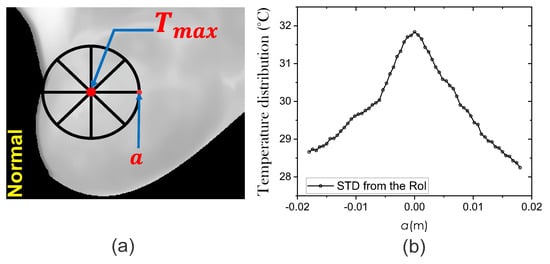
Figure 4.
(a) The extraction process of the STD using thermal input data. (b) Mean temperature distribution around the hottest point with radial distance a.
2.3.1. Fitting Method of Lorentz Curve
As is shown in Figure 5a, the experimental surface temperature distribution fits the Lorentz curve to obtain information of an internal heat source [8]. We have implemented a plugin in Matlab to obtain the STD fitted by the Lorentz curve method [22]. In this way, the estimated depth and intensity are acquired as and , for advisability, set . As is shown in Figure 5c, the angle of the curve can be obtained by .
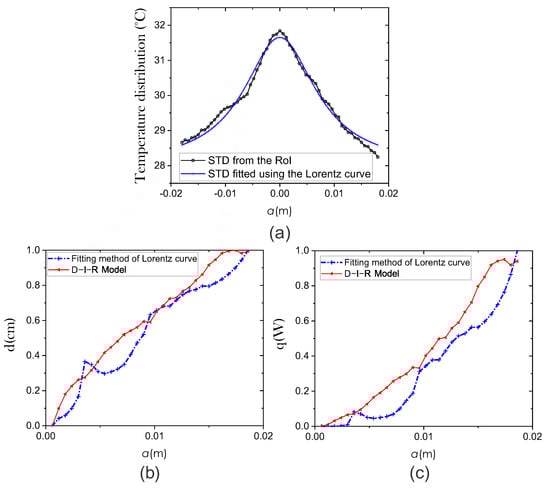
Figure 5.
Comparison of the efficiency of two methods for extracting physiological parameters: fitting method of Lorentz curve (blue line) and the D-I-R model (red line). (a) STD fitted using the Lorentz curve method. We use the coefficient of determination (R-squared) to quantify the fitting between the surface temperature curve and the Lorentz curve. Estimation of physiological parameters (b) Depth d and (c) Intensity q.
2.3.2. D-I-R Model
The heat source parameters are obtained through the D-I-R model as [6],
and
for W/m3, W/m2 · °C, and volume of cell is μm [6]. The and curves are obtained using Equations (5) and (6) and shown in Figure 5b,c, respectively.
Then, a set of physiological parameters is estimated at different positions :: m and through the fitting method of Lorentz curve () and the D-I-R model (). In this way, two pattern vectors are defined as {} for by using the extracted physiological parameters. The classification step make use of the physiological pattern vectors.
2.4. Thermal Pattern Classification Using SVM
Cortes and Vapnik in 1995 developed the Support Vector Machines [23]. SVM has multiple applications and can be used to solve classification problems. This section describes the classification process of a set of breast thermograms from the - into normal and abnormal classes. Generally, this stage involves two datasets: training and testing. We use a K-fold cross-validation with . Each one is a composite of data instances. The training set {, } for contains the several features or “attributes” accompanied of target class values or “labels”. The proposed pattern vectors or attributes {} for are composed of the physiological parameters at a given position a with . There are 49 thermograms labeled as healthy and 38 labeled as unhealthy. The principal objective of SVM is to find a computationally efficient way to produce a model to predict target class values given a testing dataset with attributes only. As is shown in Figure 6, a separating hyperplane into a -dimensional feature space must be implemented.
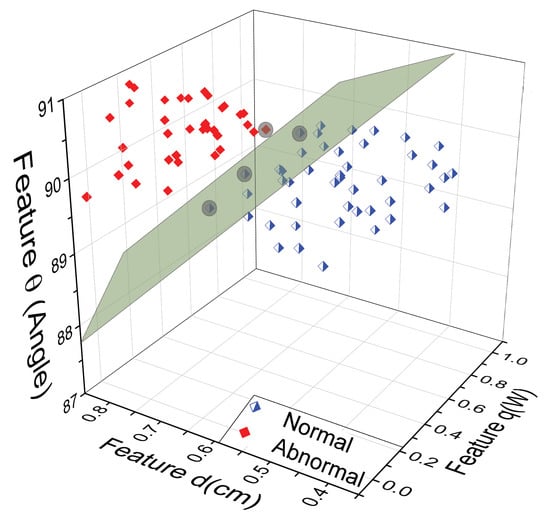
Figure 6.
Three-dimensional space using the proposed physiological parameters {} obtained through the D-I-R model, corresponding to at a given position a. The support vectors define the margin’s greatest separation between the normal and abnormal classes.
For the classification task, we use the model formulation C-classification given as [24],
To reduce some error measure above the training data, are the weights from the i-th hidden unit to the output unit, b is the bias, e is the unity vector, C is the upper bound, , , and is the mapping function [25].
Assuming that the nonlinear separation limit can be linearized in a larger-dimensional feature space using a mapping method: (x), where v is the increased dimension of H space [25]. The nonlinear SVM classifier is given as [25,26],
The Radial Basis Function (RBF) is the kernel, defined as , where is gamma function, are the training vectors, and are called support vectors.
3. Results
The STD for a set of 87 thermograms, 49 normal and 38 abnormal of the -, is analyzed [3]. Abnormal thermal patterns that may be linked to breast lesions are highlighted by an increase in the temperature of the affected tissue [13]. An increase in surface temperature is calculated for each thermogram. The Figure 7 shows that all the abnormal thermograms presenting temperature increases °C. Hence, the maximum temperature point of the RoI will be part of the pattern vector for the thermogram categorization.
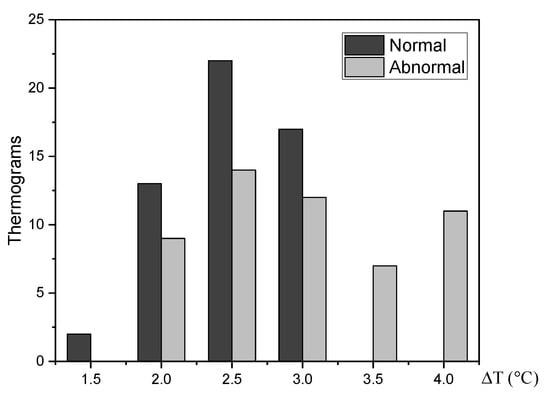
Figure 7.
The temperature at the vicinity of affected tissue is about 2 °C higher than normal tissue.
Extraction of the Input Heat Source Parameters
The surface temperature distribution , environment temperature °C [4], and maximum temperature at the RoI are needed to extract the internal heat source parameters. For extraction of parameters, we applied the methodology mentioned in Section 2. Firstly, to measure the correlation between the STD from the RoI and the STD fitted by the Lorentz curve, we use the coefficient of determination R-squared [27]. In the same way, the correlation between the STD estimated using the Equation (4) of the D-I-R model and the STD of the RoI is measured. Therefore, the mean R-squared values corresponding to the 87 thermograms are and , respectively. Figure 8 shows the estimated STD employing the two methods.
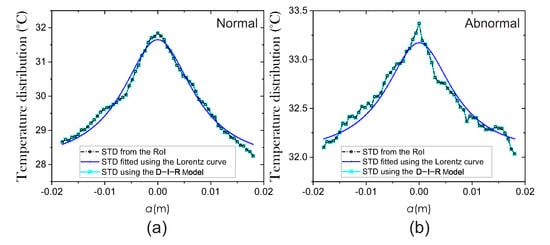
Figure 8.
Surface temperature distribution from (a) normal and (b) abnormal breast thermograms.
Thus, the internal heat source parameters d, q, and R are extracted from the obtained STD at different a positions. Figure 9, Figure 10 and Figure 11 show the three-dimensional feature spaces using the physiological parameters , d, q, and extracted at different a positions. The heat source parameters were obtained (a) by fitting the temperature distribution with the Lorentz curve () and (b) the D-I-R model () from Equations (5)–(7). Scattergrams proof the correct separation between normal and abnormal thermograms at the optimal position m that was determined using SVM. At different a positions, the physiological parameters are scattered from their respective cluster.
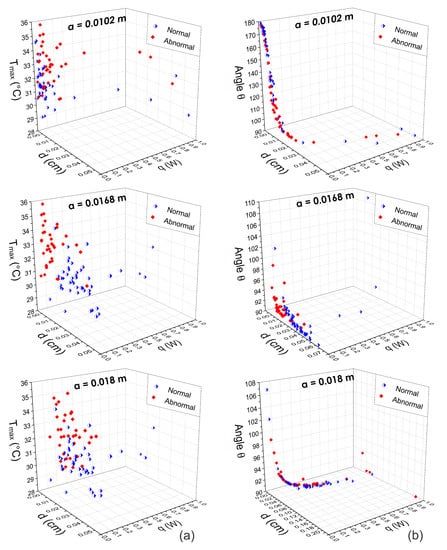
Figure 9.
Three-dimensional scattergrams using the physiological parameters obtained by means of the fitting method of Lorentz curve at different positions m, m, and m. Column (a) corresponds to the pattern vector {, d, q} and column (b) corresponds to the pattern vector {, d, q}. As can be seen, at the optimal position m, the scattergrams show a correct separation between normal and abnormal thermograms. In other cases, the feature vectors are highly correlated.
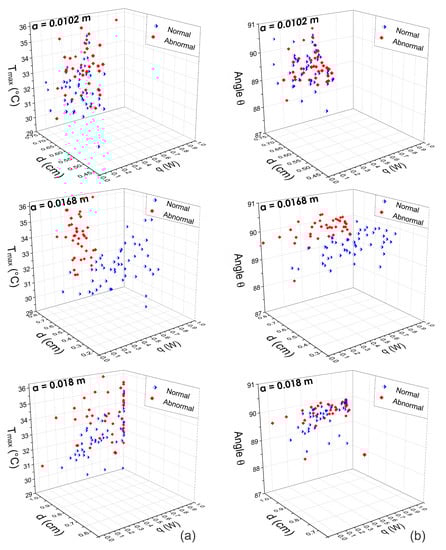
Figure 10.
Three-dimensional scattergrams using the physiological parameters obtained by means of the D-I-R model at different positions m, m, and m. Column (a) corresponds to the pattern vector {, d, q} and column (b) corresponds to the pattern vector {, d, q}. As can be observed, at the optimal position m, the scattergram shows a correct separation between normal and abnormal thermograms. In other cases, the feature vectors are highly correlated.
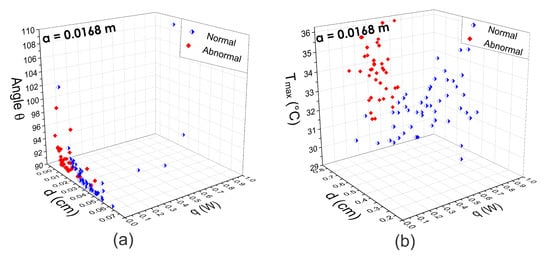
Figure 11.
Three-dimensional scattergrams using the physiological parameters extracted from (a) the fitting method of Lorentz curve and (b) the D-I-R model. As can be seen, at the same optimal position m, the scattergrams show a correct separation between normal and abnormal thermograms in both cases.
For the classification task, physiological pattern vectors composed of {} are used. Using SVM as a classifier, we obtain the CRC of Table 3. As can be observed, the higher classification percentages are obtained using the estimated pattern vector based on the D-I-R model. In this case, the STD from the RoI indicates a good fitting with the estimated STD. The results are achieved using the proposed pattern vector extracted at an optimal m position and through the SVM algorithm. In addition, we analyze the performance of the proposed methodology using the AUC of the Receiver Operating Characteristic (ROC) curve for the two methods employed.
Table 3.
Results of CRC and Area Under Curve (AUC) using the proposed pattern vector composed of physiological parameters.
Figure 12 shows the CRC percentages achieved at distinct a positions. As can be seen, the highest percentages using the pattern vectors extracted with the fitting method of Lorentz curve and D-I-R model resulted in the same m position.
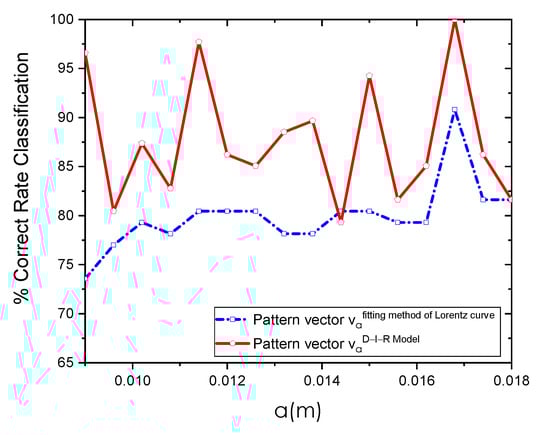
Figure 12.
Classification results using the pattern vector {} obtained through the fitting method of Lorentz curve and D-I-R model at different a positions using SVM as a classifier.
Table 4 shows the accuracy, sensitivity, and specificity of the two methods used for the extraction of physiological parameters. These values indicate that the performance of the pattern vector obtained employing the fitting method of Lorentz curve was lower than the results given by the pattern vector calculated with the D-I-R model. These measures of diagnostic accuracy are obtained at optimal m position using SVM.
Table 4.
Measures of accuracy.
The ROC curves from the two tested methods reached high performances, as shown in Figure 13. On the other hand, the area under ROC confirms that the proposed pattern vector has better performance since it has an area of 1, followed by the proposed vector with an area of . In this study, for the pattern vectors obtained with the fitting method of Lorentz curve and the D-I-R model, we achieve higher performance CRC rates of % and 100%, respectively, and an area under the ROC curve of and 1 for the two methods employed.
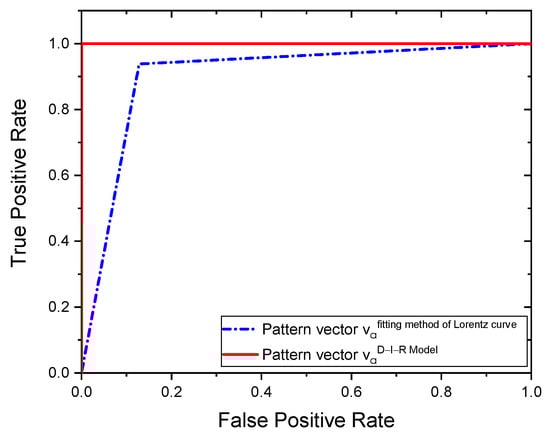
Figure 13.
ROC curves.
4. Discussion
An analytical-based solution for the thermal inverse problem was used, considering a point heat source embedded in tissue. From this solution and using the D-I-R model, the physiological parameters, q, d, and R of an internal heat source are estimated. During thermal analysis of breast thermograms from the -, we observe that several factors can affect the accuracy of the extracted parameters, such as imaging acquisition conditions, localization of the hottest spots, and the radial extension a of the RoI. Despite these drawbacks, our experimental results show that the proposed method can classify breast thermograms without intensity preprocessing or normalization of the raw thermal data. The three-dimensional feature space in Figure 9, Figure 10 and Figure 11 supports the discrimination power of the proposed pattern vectors {}, allowing the correct separation of both classes according to the optimal a position. Each normal and abnormal class forms a cluster, and they are well separated. The proposed pattern vectors {} are obtained using the fitting method of Lorentz curve and the D-I-R model. We can see that at position m and m, descriptors values are widely correlated. Because of that, we determine the optimal position as m through the SVM algorithm. The physiological parameters extracted at this position are suitable for breast thermogram classification, despite some descriptors in the 3D scattergrams that have been sparse from their respective class due to the human body complex and the inherent nature of the acquisition data. Figure 11 shows that the highest classification percentages are obtained when the physiological pattern vectors are extracted at the position m. We find that the optimal position is m for both the fitting method of Lorentz curve and the D-I-R model, with a CRC of % and 100%, respectively, by using the proposed pattern vector.
On the other hand, the - database has been used to evaluate the efficiency of the most common extracted features such as texture [19,28,29,30,31], shape [32], and morphology [33] descriptors to classify thermal patterns. However, the discriminative power of the physiological descriptors has not been evaluated on the above-mentioned database. Table 5 summarizes research that aims to classify breast tumors into two categories: benign and malignant. As can be seen, the classification percentages below % are reached using the - database with a maximum of 80 thermograms. In this work, we proposed highly discriminative physiological pattern vectors for breast thermogram categorization. Furthermore, our proposed method uses a minimal number of descriptors to obtain a CRC of 100% when 87 thermograms are used.
Table 5.
Summary of research works that make use of the -.
5. Conclusions
Based on an inverse solution of the bio-heat equation and using the surface temperature distribution of the RoI, the physiological parameters of an input heat source are estimated using the fitting method of Lorentz curve and the D-I-R model. In this research, we analyze breast thermograms from - with clinically confirmed cases as sick or healthy. Highly discriminative proposed pattern vectors were extracted, and they are composed of physiological parameters {} for breast thermogram classification. The pattern vector employing the D-I-R model is able to classify when the parameters are extracted at an optimal a position. As can be seen in Table 3, we obtain a CRC of 100% using SVM as a classifier. According to the achieved results, we found that the optimal position m is suitable for the thermal analysis using both the fitting method of Lorentz curve and the D-I-R model. Furthermore, the proposed technique utilizes a reduced number of physiological parameters , and it does not apply any image normalization or contrast improvement. Our proposed method allows delimitation of the RoI using SVM for analysis and raw thermal pattern classification. Nevertheless, the experimental radial distance a of the RoI is less than or equal to cm due to maximum the temperature location close to the boundary image. In a future work, we will use lateral view breast thermograms to overcome this limitation and analyze the whole breast region, including the armpit and lymph nodes. Thus, this method will be greatly valuable for determining the size and description of the RoI when it shows a pathological change not only in infrared imaging of the breast but also in the legs thermograms, abdomen, arms, and head.
Author Contributions
Investigation, L.B.A.-C., C.T.-Q., R.C.-O., A.P.-V. and J.H.A.-N.; Conceptualization, L.B.A.-C., C.T.-Q., R.C.-O., A.P.-V. and J.H.A.-N.; Methodology, L.B.A.-C., C.T.-Q. and R.C.-O.; Software, L.B.A.-C., C.T.-Q., R.C.-O., A.P.-V. and J.H.A.-N.; Validation, L.B.A.-C.; Formal Analysis, L.B.A.-C.; Funding Acquisition, Consejo Nacional de Ciencia y Tecnología (CONACyT); with No. CVU 786815 and Ministerio de Economía y Competitividad de España (PID2020-115909RB-I00); Project Coordination, C.T.-Q.; Writing—Original Draft, L.B.A.-C., C.T.-Q., R.C.-O., A.P.-V. and J.H.A.-N. All authors have read and agreed to the published version of the manuscript.
Funding
This work was supported by the Consejo Nacional de Ciencia y Tecnología (CONACyT); with No. CVU 786815 and Ministerio de Economía y Competitividad de España (PID2020-115909RB-I00).
Institutional Review Board Statement
Not applicable.
Informed Consent Statement
Not applicable.
Data Availability Statement
All data used in this research were obtained from breast thermographic dataset - and are completely available at http://visual.ic.uff.br/dmi (accessed on 1 March 2021).
Acknowledgments
L. B. Alvarado Cruz gives thanks to the Consejo Nacional de Ciencia y Tecnología (CONACyT) with no. CVU 786815.
Conflicts of Interest
The authors declare no conflict of interest.
References
- Fernández, C.I.; Bouzas, J.; Arnáiz, J.; Gómez, P.; Piñonosa, C.; García, M.; Sillero, M. Classification of factors influencing the use of infrared thermography in humans: A review. Infrared Phys. Technol. 2015, 71, 28–55. [Google Scholar] [CrossRef]
- Lawson, R.; Chughtai, M.S. Breast Cancer and Body Temperature. Can. Med. Assoc. J. 1963, 88, 68–70. [Google Scholar]
- Silva, L.F.; Saade, D.C.; Sequeiros, G.O.; Silva, A.C.; Paiva, A.C.; Bravo, R.S.; Conci, A. Database for Mastology Research with Infrared Image (DMR-IR). Available online: http://visual.ic.uff.br/dmi (accessed on 1 March 2021).
- Silva, L.F.; Saade, D.C.; Sequeiros, G.O.; Silva, A.C.; Paiva, A.C.; Bravo, R.S.; Conci, A. A new database for breast research with infrared image. J. Med. Imaging Health Inform. 2014, 4, 92–100. [Google Scholar] [CrossRef]
- Pennes, H.H. Analysis of tissue and arterial blood temperatures in the resting human forearm. J. Appl. Physiol. 1998, 85, 5–34. [Google Scholar] [CrossRef] [PubMed]
- Hossain, S.; Mohammadi, F.A.; Nejad, E.T. Neural network approach for the determination of heat source parameters from surface temperature image. In Proceedings of the 2011 24th Canadian Conference on Electrical and Computer Engineering (CCECE), Niagara Falls, ON, Canada, 8–11 May 2011; Volume 5, pp. 1109–1112. [Google Scholar]
- Chunfang, G.; Kaiyang, L.; Shaoping, Z. A Novel Approach of Analyzing the Relation between the Inner Heat Source and the Surface Temperature Distribution in Thermal Texture Maps. In Proceedings of the Annual International Conference of the IEEE Engineering in Medicine and Biology Society, Shanghai, China, 1–4 September 2005; pp. 623–626. [Google Scholar]
- Shi, G.; Han, F.; Wang, L.; Liang, C.; Li, K. Q-r curve of thermal tomography and its clinical application on breast tumor diagnosis. Biomed. Opt. Express 2015, 64, 1109–1123. [Google Scholar] [CrossRef] [PubMed] [Green Version]
- Shi, G.; Wang, L.; Han, F.; Liang, C.; Li, K. Diagnosis of breast tumor using thermal tomography q-r curve. J. Biomed. Opt. 2015, 20, 68001. [Google Scholar] [CrossRef] [PubMed]
- Rastgar-Jazi, M.; Mohammadi, F. Parameters sensitivity assessment and heat source localization using infrared imaging techniques. BioMed. Eng. Online 2017, 16, 113. [Google Scholar] [CrossRef] [PubMed] [Green Version]
- Han, F.; Shi, G.; Liang, C.; Wang, L.; Li, k. A Simple and Efficient Method for Breast Cancer Diagnosis Based on Infrared Thermal Imaging. Cell Biochem. Biophys. 2015, 71, 491–498. [Google Scholar] [CrossRef]
- Minhua, Z.; Qian, C. Study of the Surface Temperature Distribution of the Tissue Affected by the Point Heat Source. In Proceedings of the 2007 1st International Conference on Bioinformatics and Biomedical Engineering, Wuhan, China, 6–8 July 2007; pp. 474–477. [Google Scholar]
- Zermeño, L.O.; Orozco, E.; Toxqui, C.; Padilla, A.; Mejias, Y.N. Caracterización de imágenes en la región espectral del infrarrojo para la detección de lesiones en mama. Rev. Inst. TecnolóGico Cd. JuáRez Acad. J. 2017, 6, 75–82. [Google Scholar]
- Cristianini, N.; Taylor, J.S. An Introduction to Support Vector Machines and Other Kernel-Based Learning Methods; Cambridge University Press: Cambridge, UK, 2000. [Google Scholar]
- Farooq, M.A.; Corcoran, P. Infrared Imaging for Human Thermography and Breast Tumor Classification using Thermal Images. In Proceedings of the 2020 31st Irish Signals and Systems Conference (ISSC), Letterkenny, Ireland, 11–12 June 2020; pp. 1–6. [Google Scholar]
- Silva, T.A.E.D.; Silva, L.F.D.; Muchaluat-Saade, D.C.; Conci, A. A computational method to assist the diagnosis of breast disease using dynamic thermography. Sensors 2020, 20, 3866. [Google Scholar] [CrossRef] [PubMed]
- FLIR Systems. FLIR SC620 Infrared Camera Datasheet FLIR Systems. Available online: http://w1.sayato.com/7040/file/FLIR%20SC620.pdf (accessed on 21 March 2020).
- Castro, R.; Toxqui, C.; Padilla, A.; Solís J., F.; Orozco E., E. Zernike moment invariants for hand vein pattern description from raw biometric data. J. Electron. Imaging 2019, 28, 053019. [Google Scholar]
- Sathish, D.; Kamath, S.; Prasad, K.; Kadavigere, R.; Roshan, J. Asymmetry analysis of breast thermograms using automated segmentation and texture features. Signal Image Video Process. 2017, 11, 745–752. [Google Scholar] [CrossRef]
- Garduño, R.M.A.; Vega, M.S.G.; Morales, H.L.A.; Osornio, R.R.A. Supportive Noninvasive Tool for the Diagnosis of Breast Cancer Using a Thermographic Camera as Sensor. Sensors 2017, 17, 497. [Google Scholar] [CrossRef] [Green Version]
- Alvarado, L.B.; Toxqui, C.; Hernández, J.A.; Padilla, A. Breast thermography: A non-invasive technique for the detection of lesions. In Proceedings of the Applications of Digital Image Processing XLI, San Diego, CA, USA, 20–23 August 2018; Volume 10752, p. 1075230. [Google Scholar]
- STD Plugin Computer Vision Laboratory. Available online: https://sites.google.com/view/lvc-upt/inicio (accessed on 1 October 2021).
- Cortes, C.; Vapnik, V. Support-vector networks. Mach. Learn. 1995, 20, 273–297. [Google Scholar] [CrossRef]
- Karatzoglou, A.; Meyer, D.; Hornik, K. Support vector machines in R. J. Stat. Softw. 2006, 15, 1–28. [Google Scholar] [CrossRef] [Green Version]
- Lin, W.; Yuan, X. Classification of in vivo autofluorescence spectra using support vector machines. J. Biomed. Opt. 2004, 9, 180–186. [Google Scholar] [CrossRef] [PubMed] [Green Version]
- Castro, J.; Toxqui, C.; Manriquez, F.; Orozco, E.; Padilla, A.; Sánchez, J.J. Detecting Jaundice by using digital image processing. In Proceedings of the Three-Dimensional and Multidimensional Microscopy: Image Acquisition and Processing XXI, San Francisco, CA, USA, 1–6 February 2014; Volume 8949, p. 89491U. [Google Scholar]
- Steel, R.G.; Torrie, J.H. Principles and Procedures of Statistics with Special Reference to the Biological Sciences; McGraw Hill: New York, NY, USA, 1960; pp. 187–287. [Google Scholar]
- Devi, R.R.; Anandhamala, G.S. Analysis of breast thermograms using asymmetry in infra-mammary curves. J. Med. Syst. 2019, 43, 146. [Google Scholar] [CrossRef] [PubMed]
- Acharya, U.R.; Ng, E.Y.K.; Tan, J.H.; Sree, S.V.; Saade, D.M.; Conci, A. Thermography Based Breast Cancer Detection Using Texture Features and Support Vector Machine. J. Med. Syst. 2012, 36, 1503–1510. [Google Scholar] [CrossRef] [PubMed]
- Vartika, M.; Rath, S.K. Detection of breast cancer tumours based on feature reduction and classification of thermograms. Quant. Infrared Thermogr. J. 2020, 18, 300–313. [Google Scholar]
- Gogoi, U.R.; Majumdar, G.; Bhowmikl, M.K.; Ghoshl, A.K.; Bhattacharjee, D. Breast abnormality detection through statistical feature analysis using infrared thermograms. In Proceedings of the 2015 International Symposium on Advanced Computing and Communication (ISACC), Silchar, India, 14–15 September 2015; pp. 258–265. [Google Scholar]
- Suganthi, S.S.; Ramakrishnan, S. Analysis of breast thermograms using gabor wavelet anisotropy index. J. Med. Syst. 2014, 38, 101. [Google Scholar] [CrossRef] [PubMed]
- Alvarado, L.B.; Delgadillo, M.; Toxqui, C.; Padilla, A.; Castro, R.; Arreola, M.M. Fractal analysis for classification of breast lesions. In Proceedings of the Current Developments in Lens Design and Optical Engineering XX, San Diego, CA, USA, 12 August 2019; SPIE: Bellingham, WA, USA, 2019; Volume 11104. [Google Scholar]
- Resmini, R.; Silva, L.; Araujo, A.S.; Medeiros, P.; Saade, D.M.; Conci, A. Combining Genetic Algorithms and SVM for Breast Cancer Diagnosis Using Infrared Thermography. Sensors 2021, 21, 4802. [Google Scholar] [CrossRef] [PubMed]
Publisher’s Note: MDPI stays neutral with regard to jurisdictional claims in published maps and institutional affiliations. |
© 2021 by the authors. Licensee MDPI, Basel, Switzerland. This article is an open access article distributed under the terms and conditions of the Creative Commons Attribution (CC BY) license (https://creativecommons.org/licenses/by/4.0/).