
Data Augmentation of Backscatter X-ray Images for Deep Learning-Based Automatic Cargo Inspection


Abstract
:1. Introduction
2. Related Work
2.1. Automated Container Inspection
2.2. Data Augmentation Using a Generative Adversarial Network
3. Method
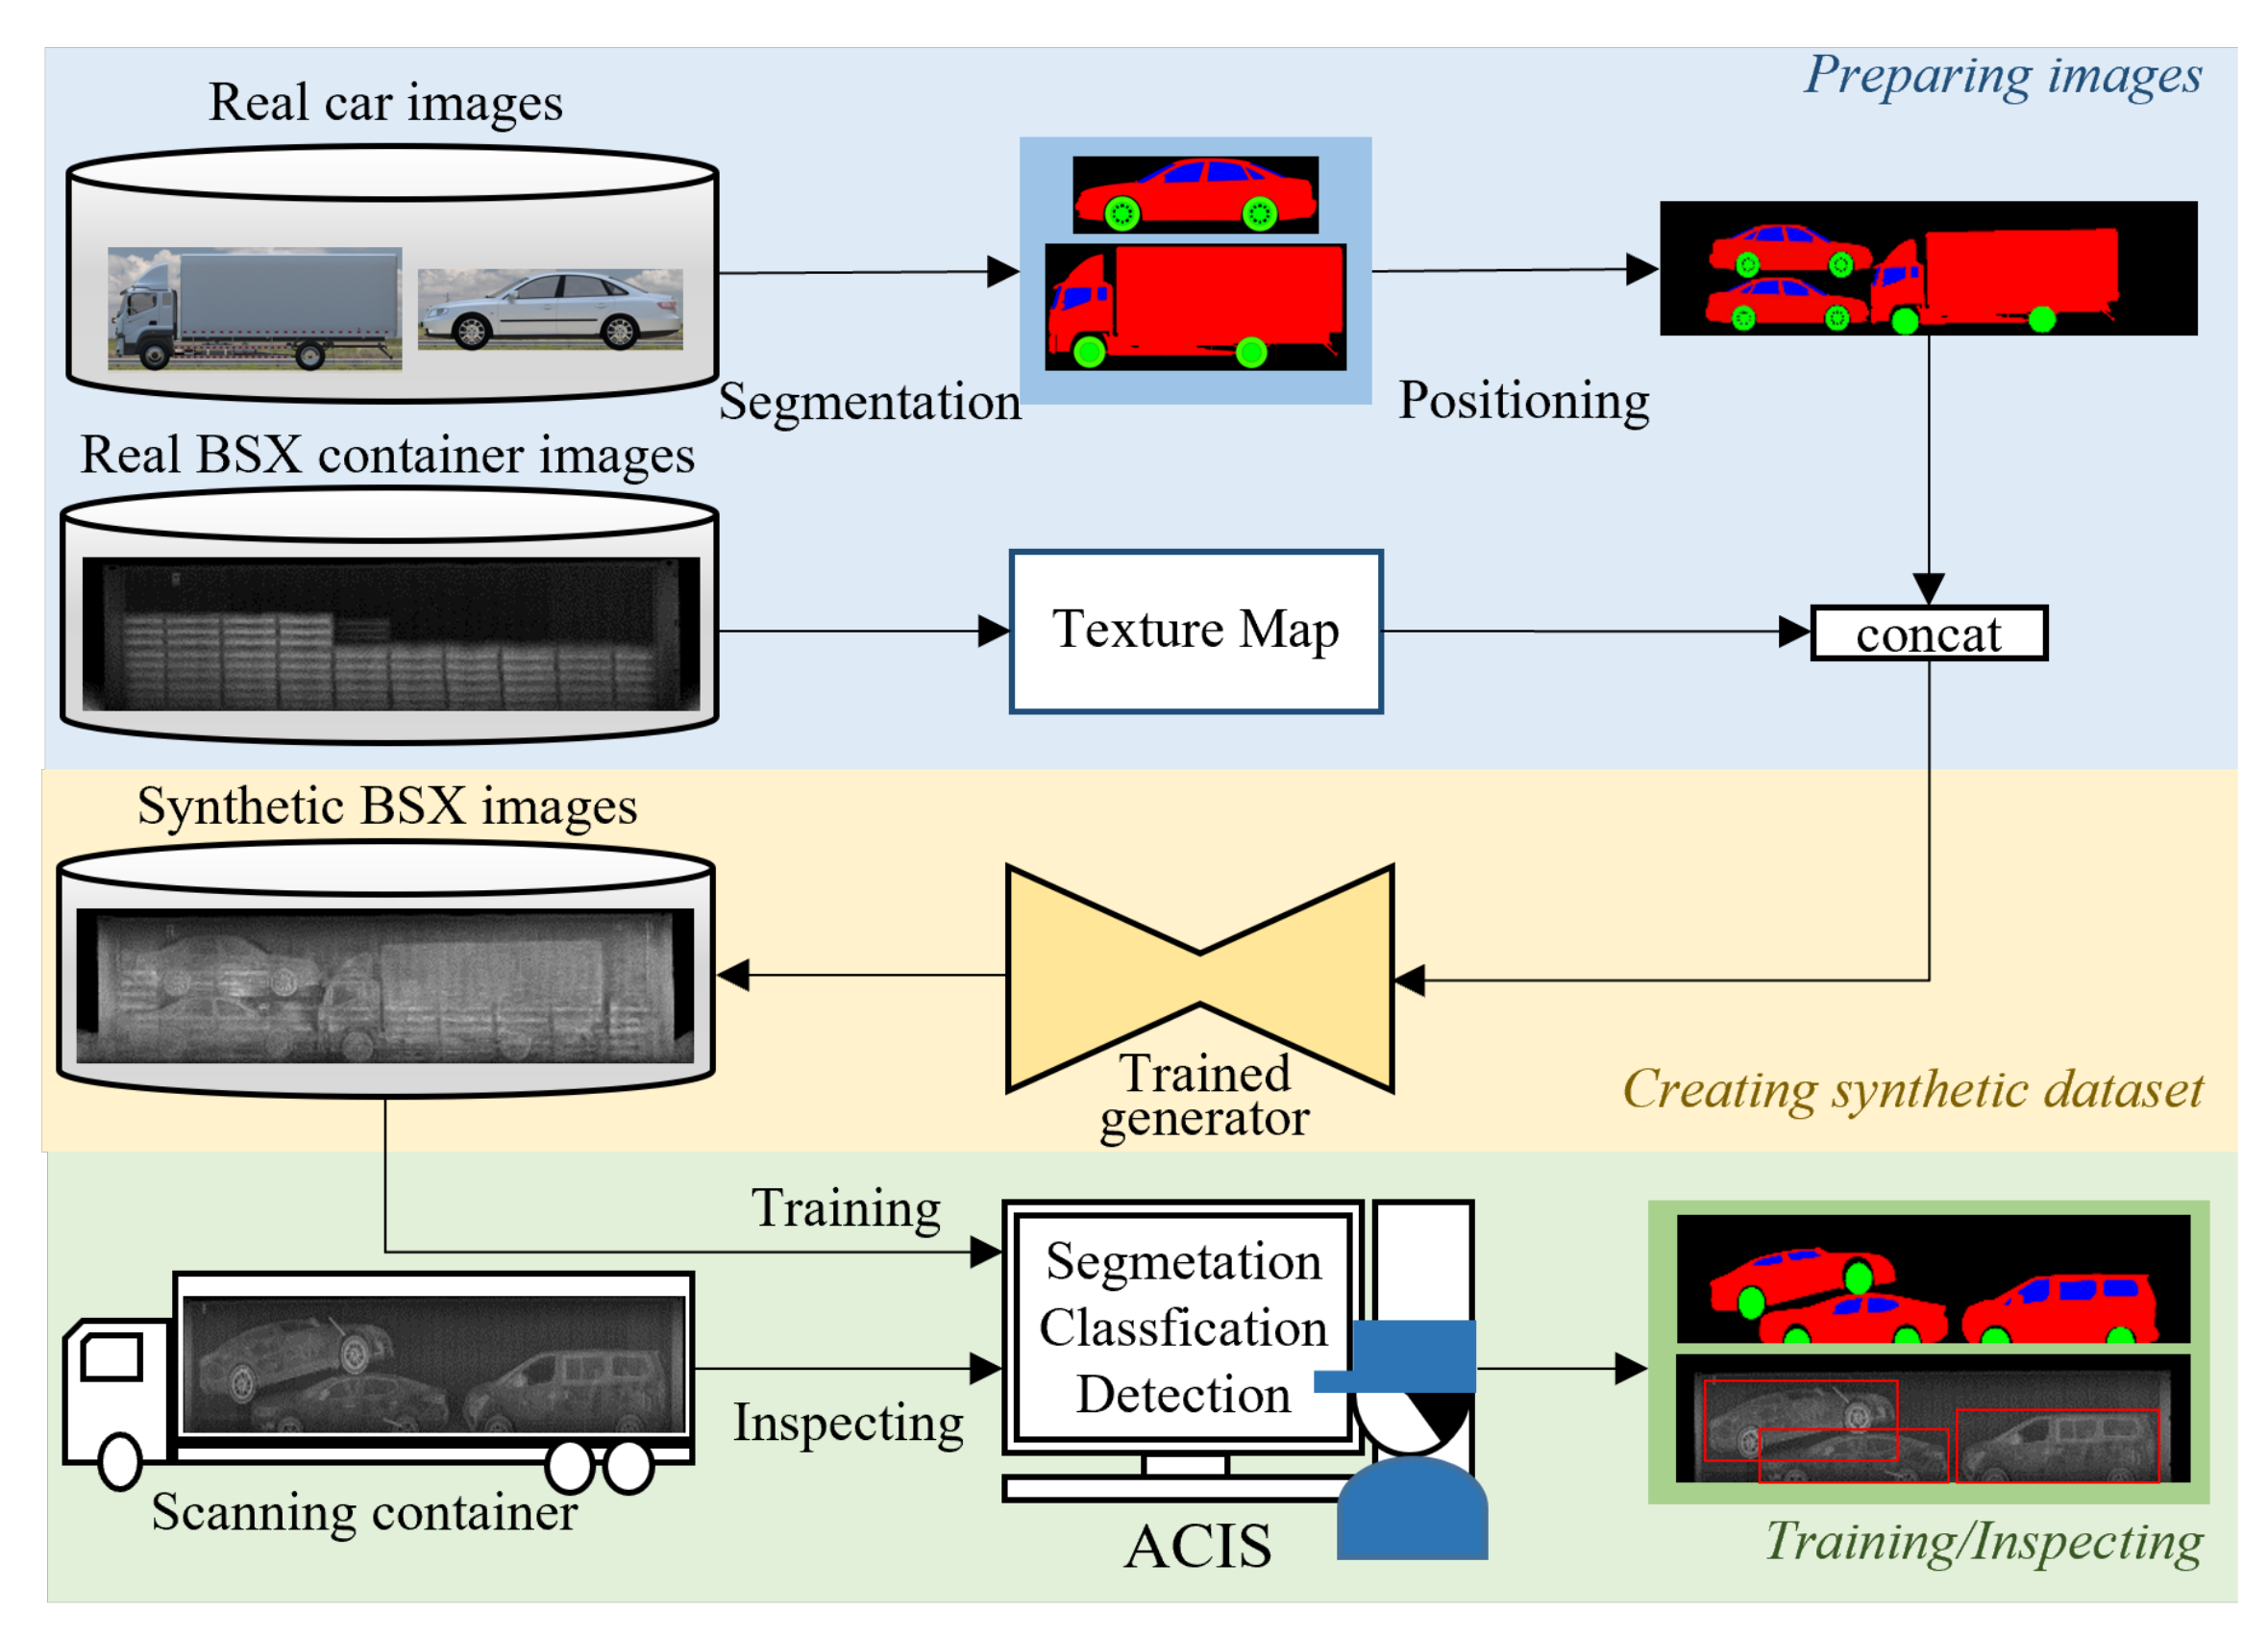
3.1. Proposed Data Augmentation and Inspection Process
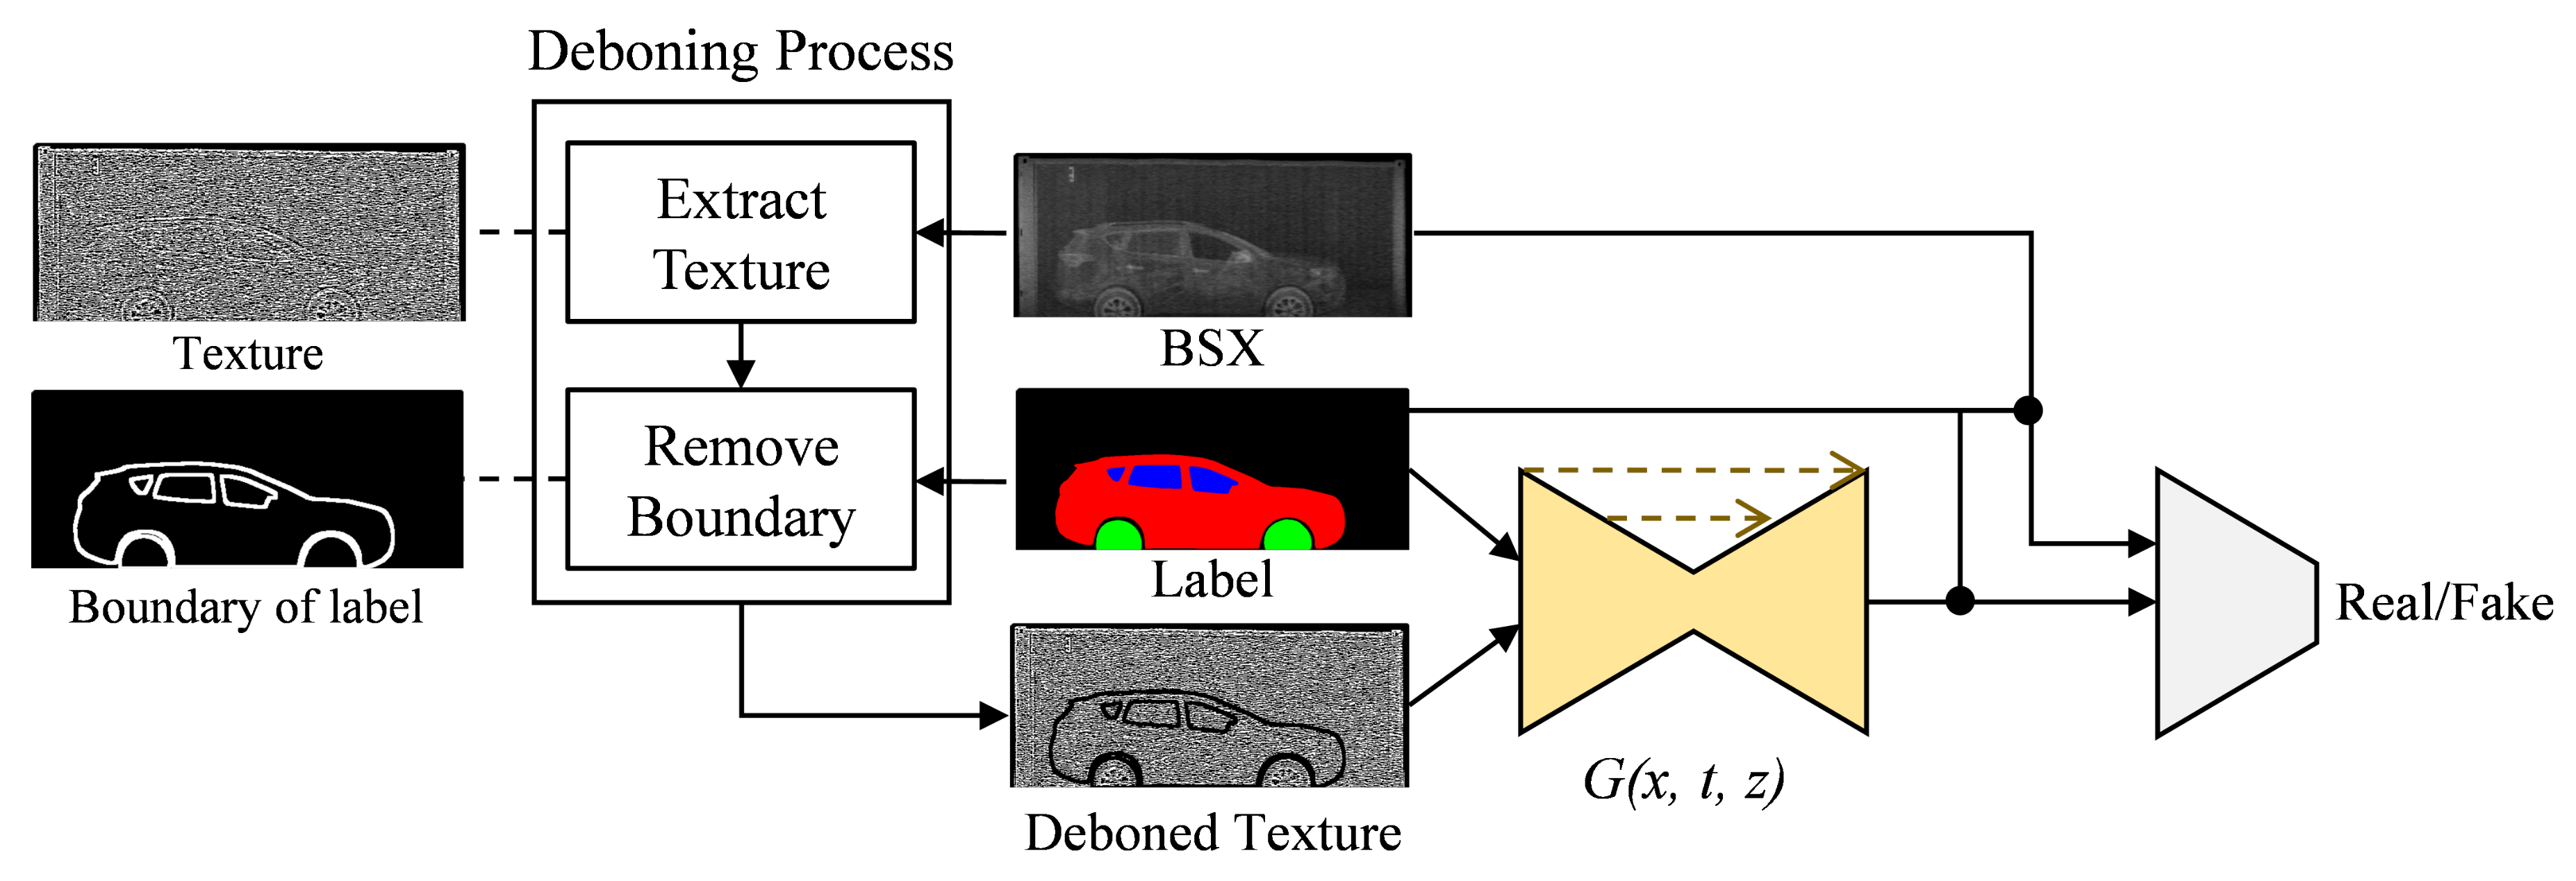
3.2. Proposed GAN Network
- Input:
- BSX-car images and their paired labels
- Step1:
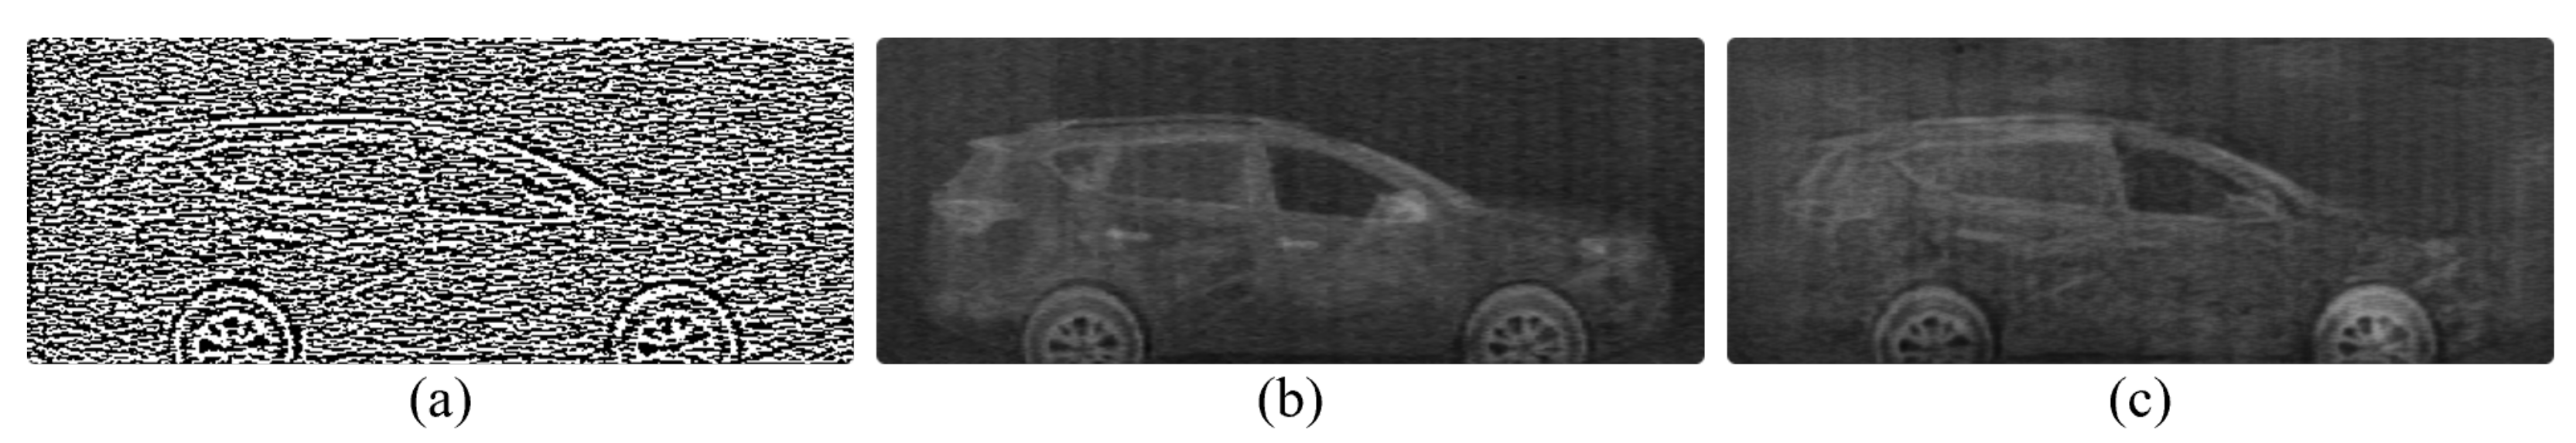
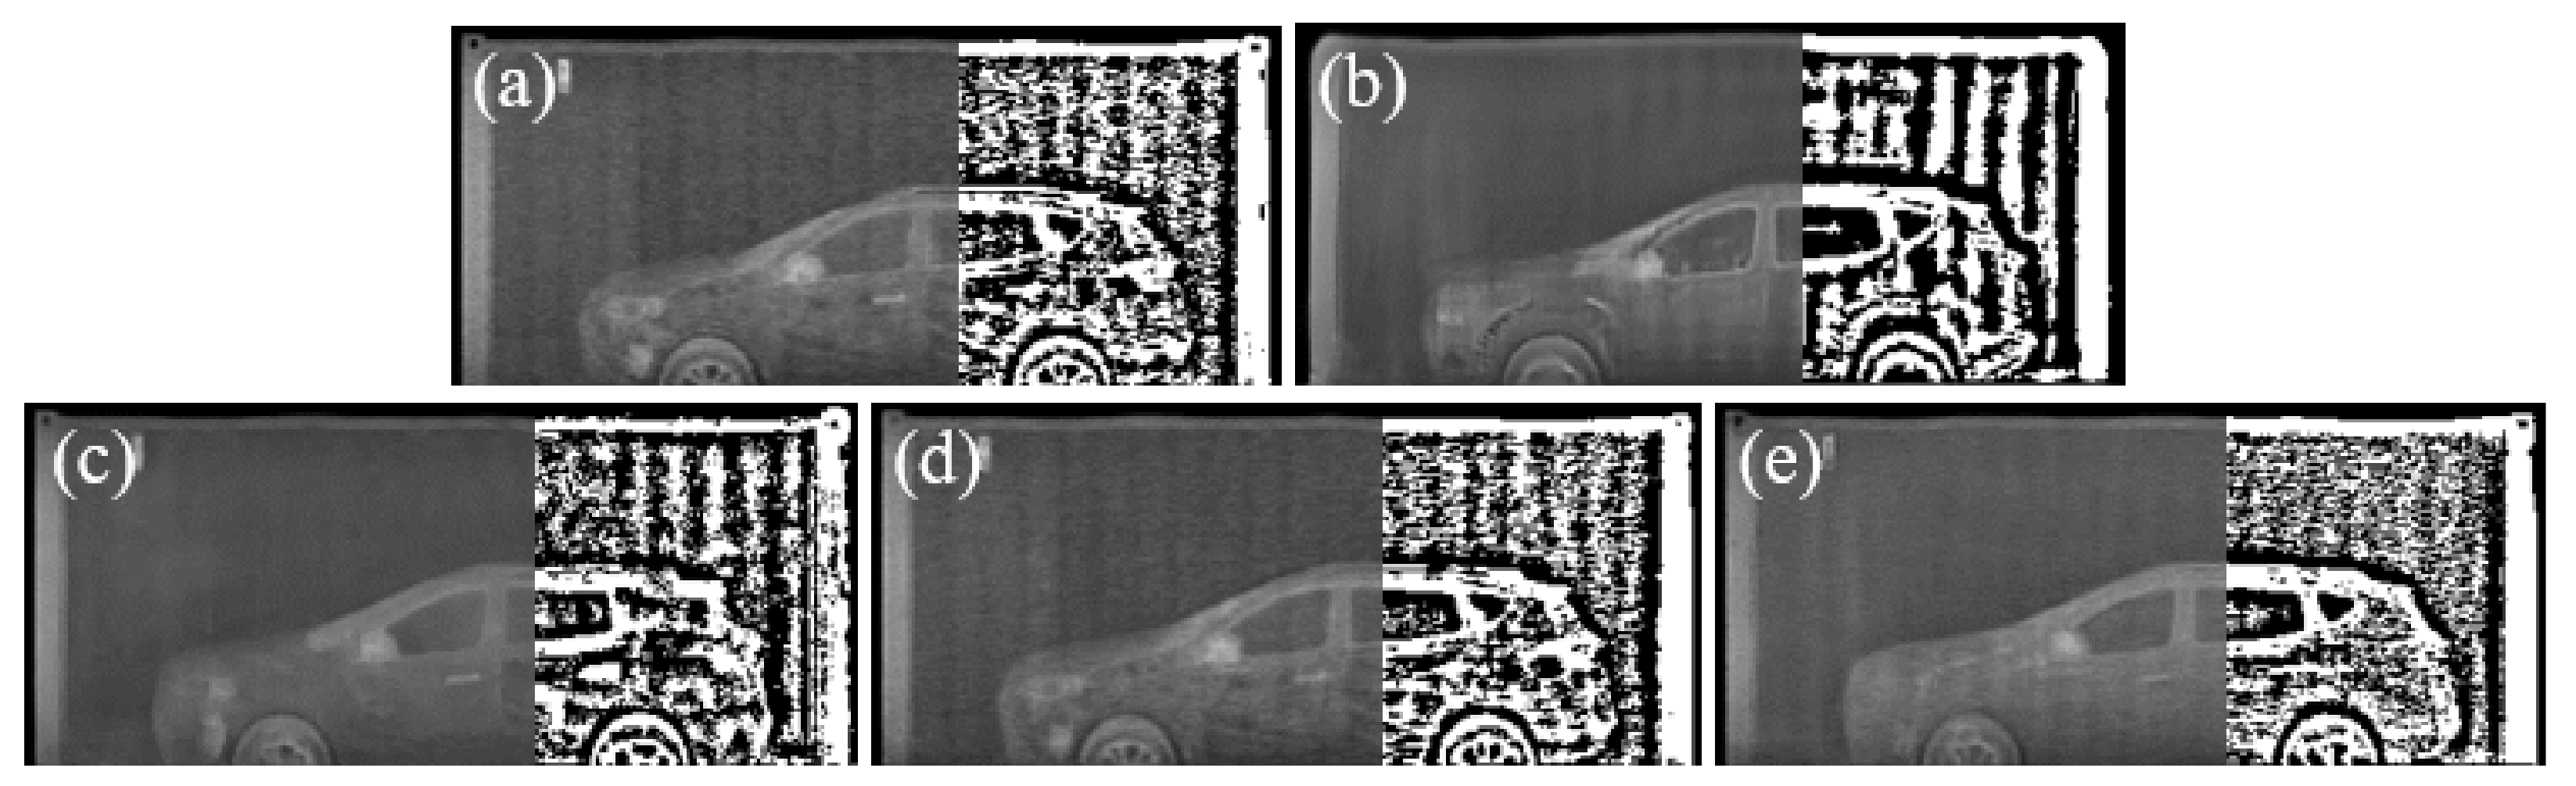
- Extract texture maps from BSX-car images using one of (7), (10) and (15).
- Step2:
- Remove object’s boundaries from the texture maps using the labels.
- Step3:
- Train the networks using the texture maps and the pairs of images and labels.
- Input:
- Arbitrary BSX-background images and labels
- Step1:
- Extract texture maps from BSX-background images using one of (7), (10) and (15) used for training.
- Step2:
- Remove object’s boundaries from the texture maps using the labels.
- Step3:
- Generate synthetic BSX images from the trained generator with the texture maps and the labels as inputs.
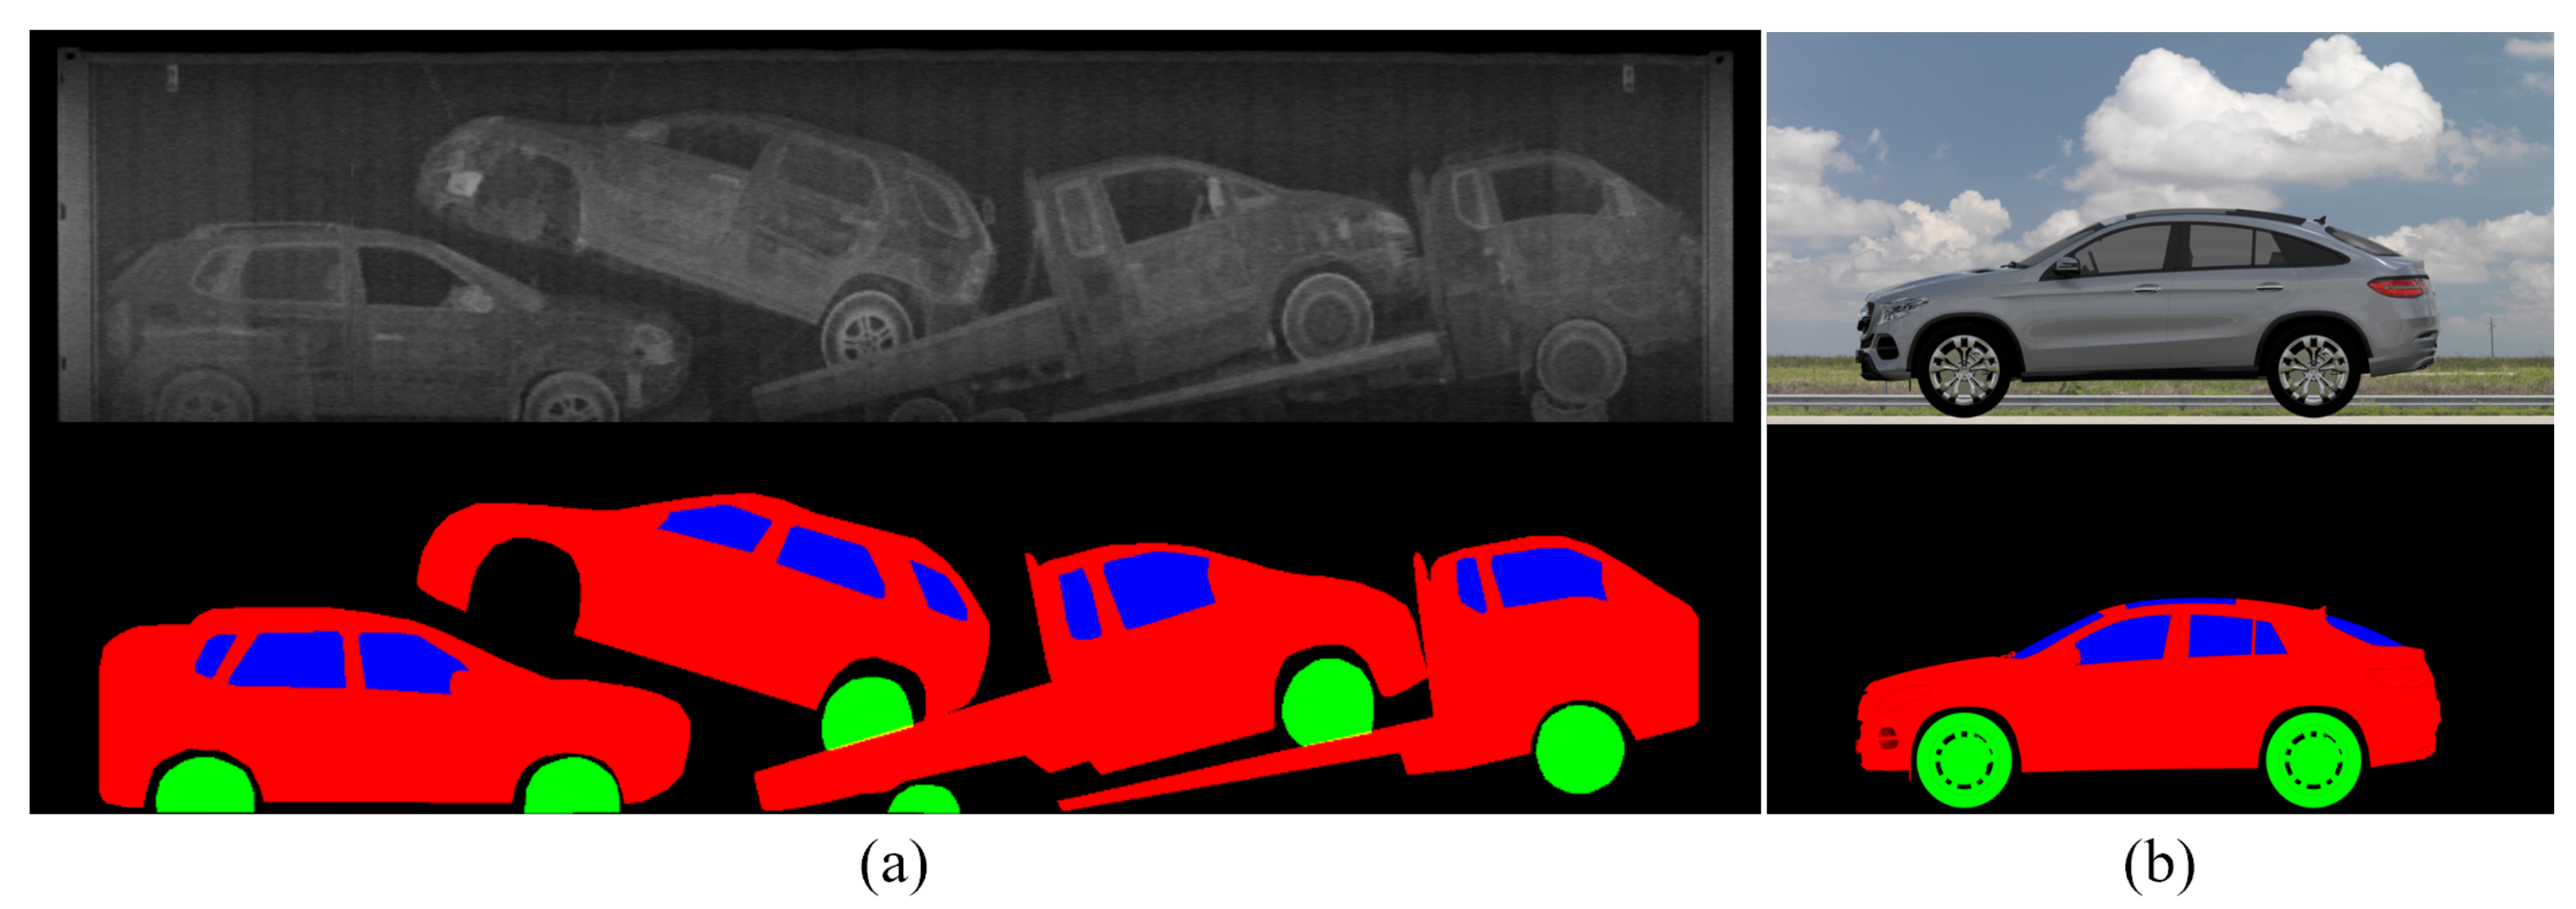
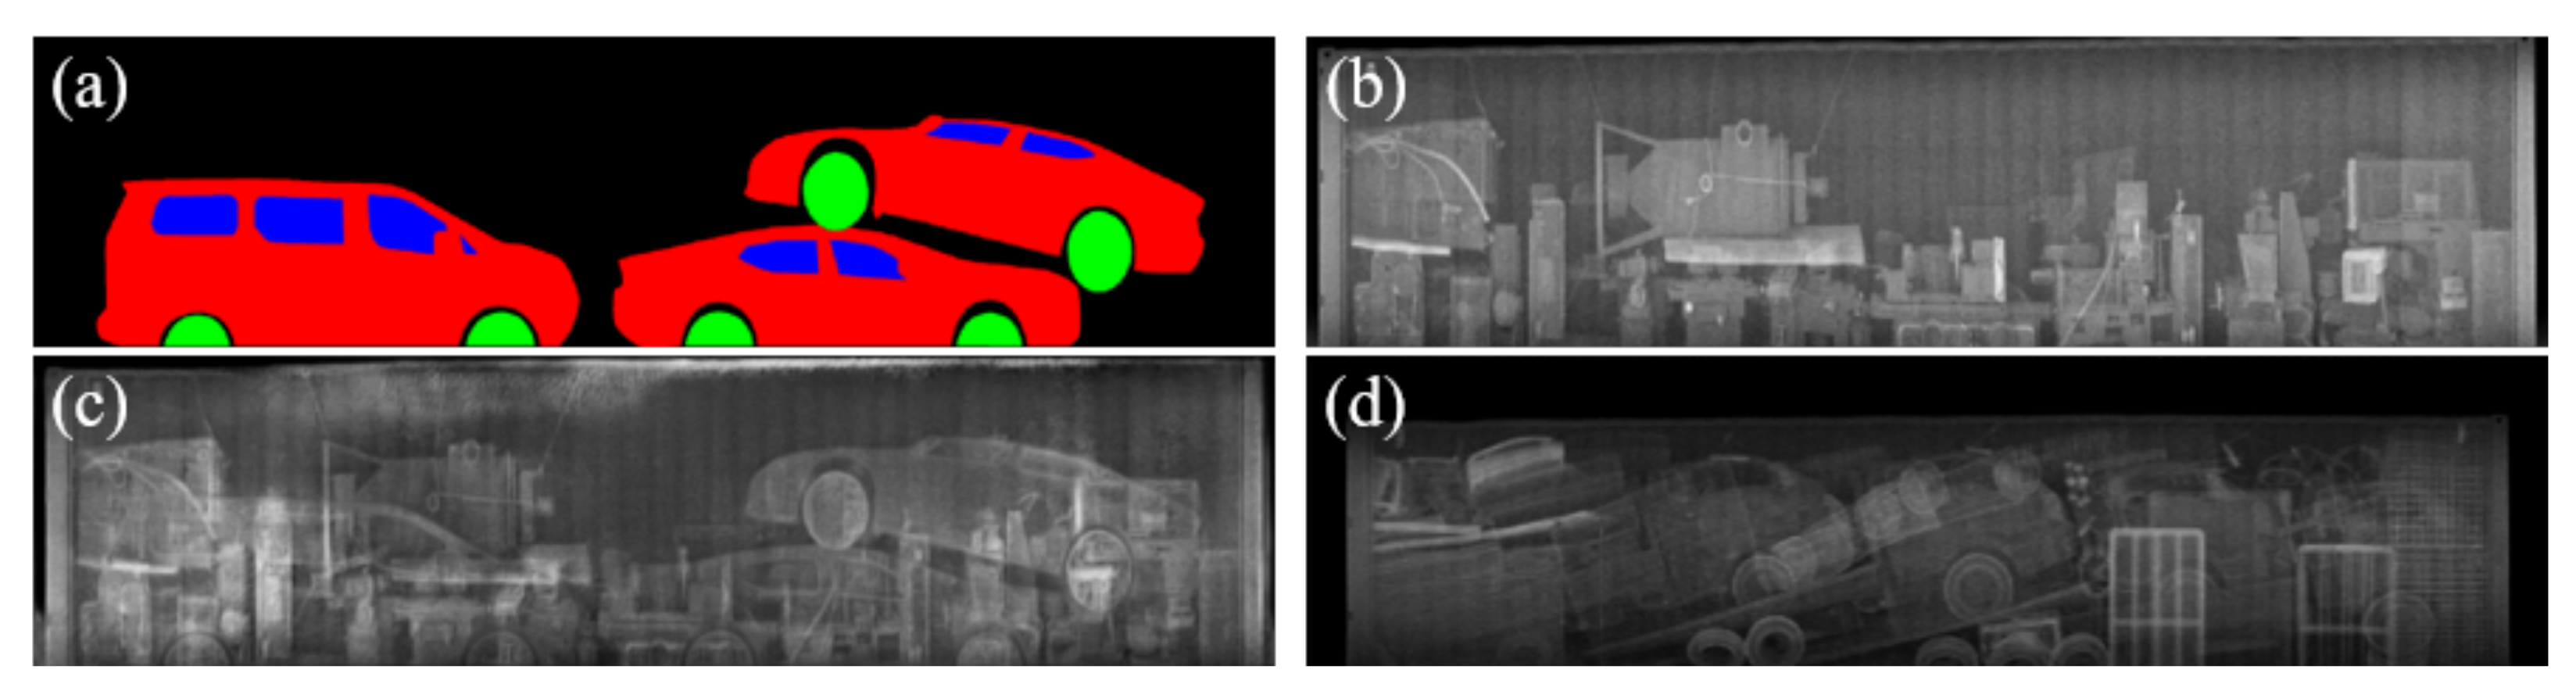
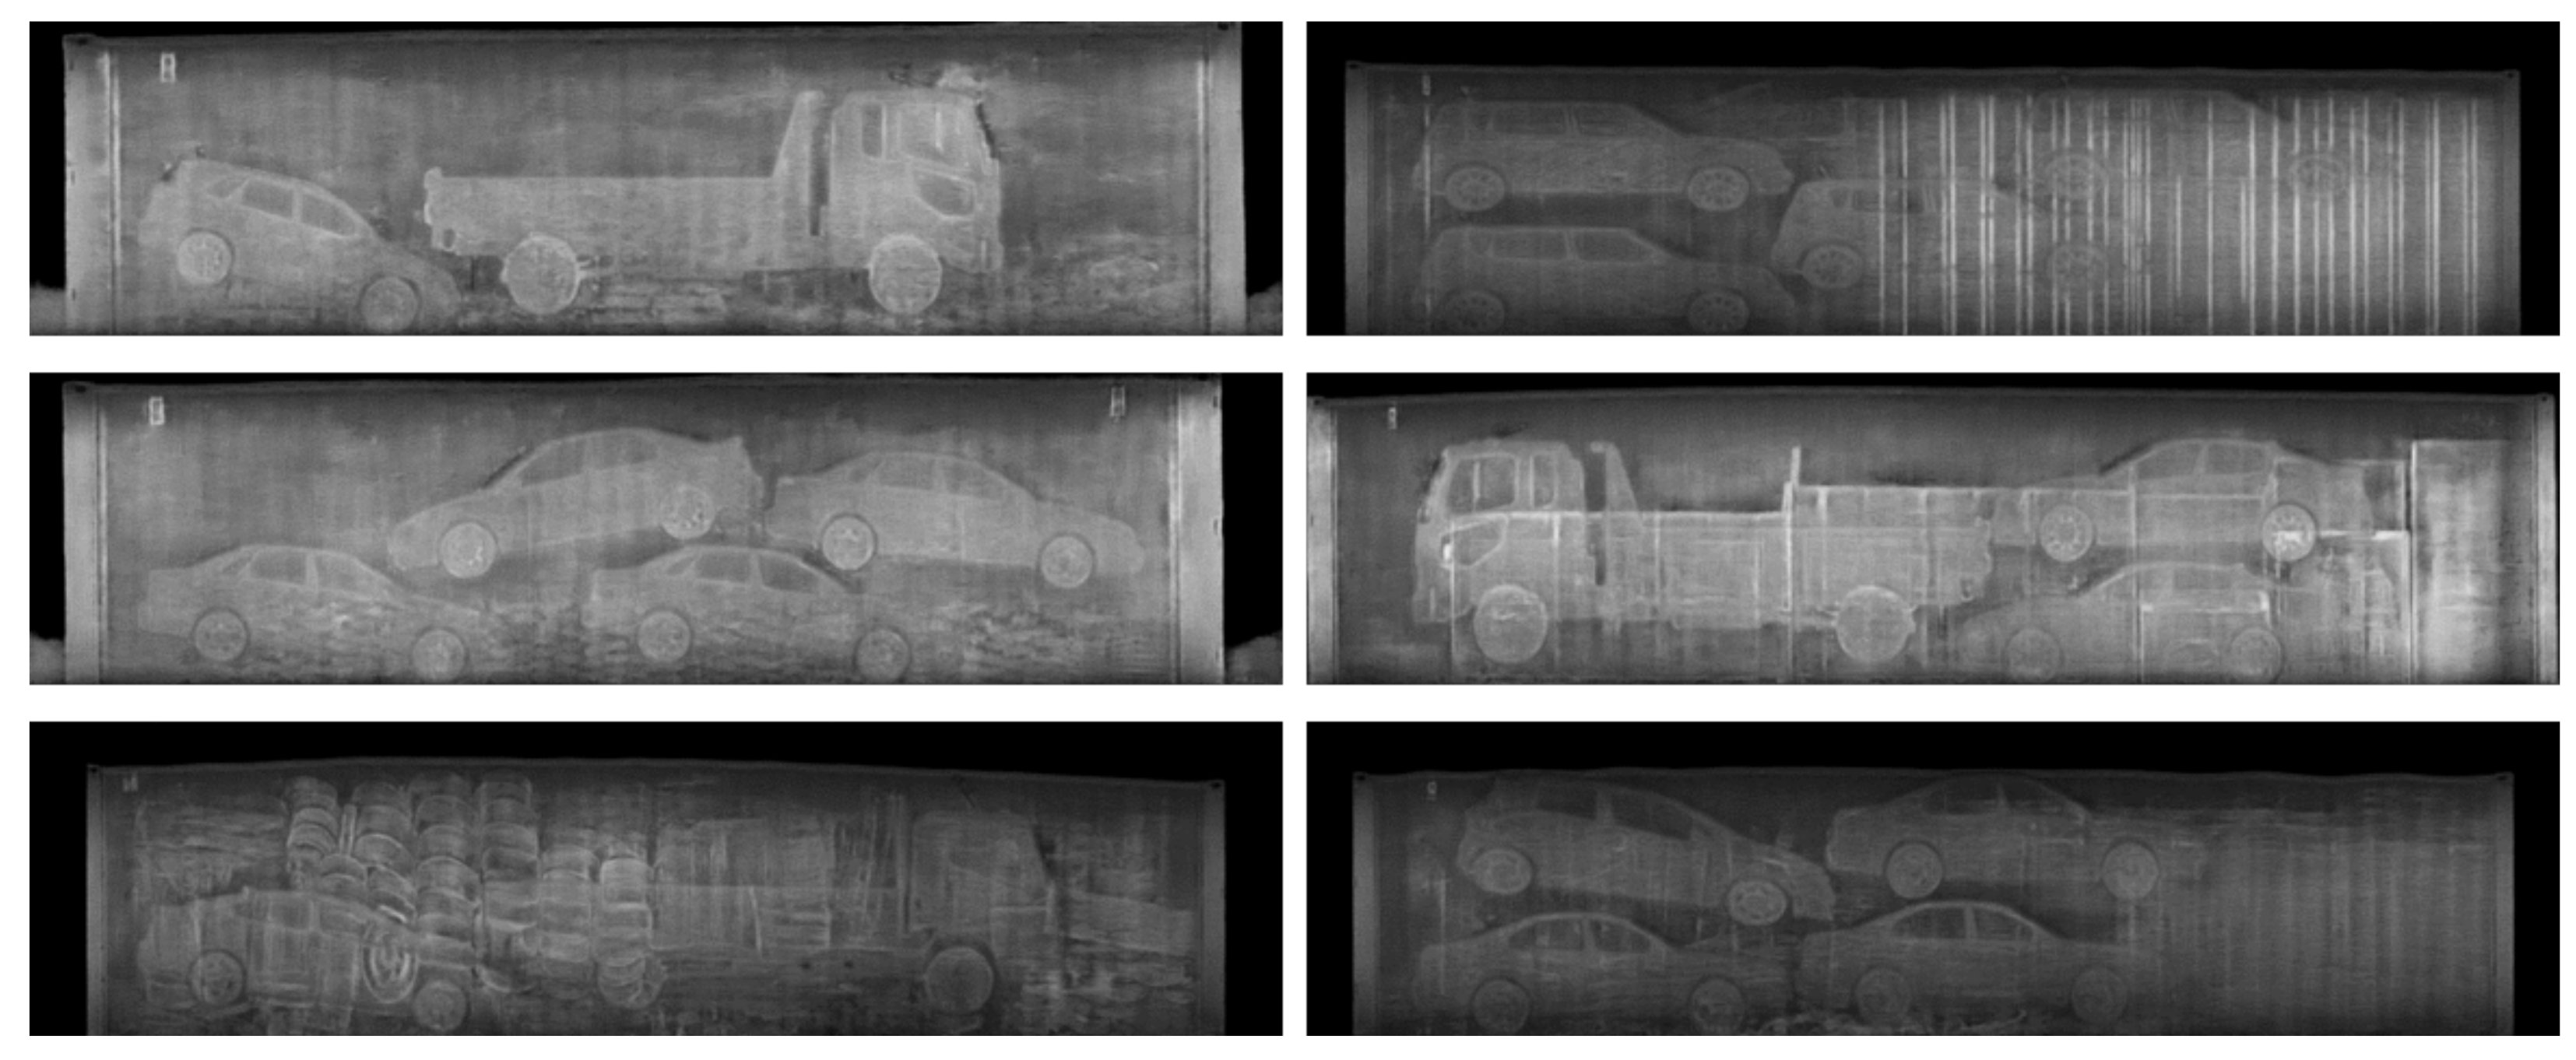
3.3. Dataset Construction
4. Experiments
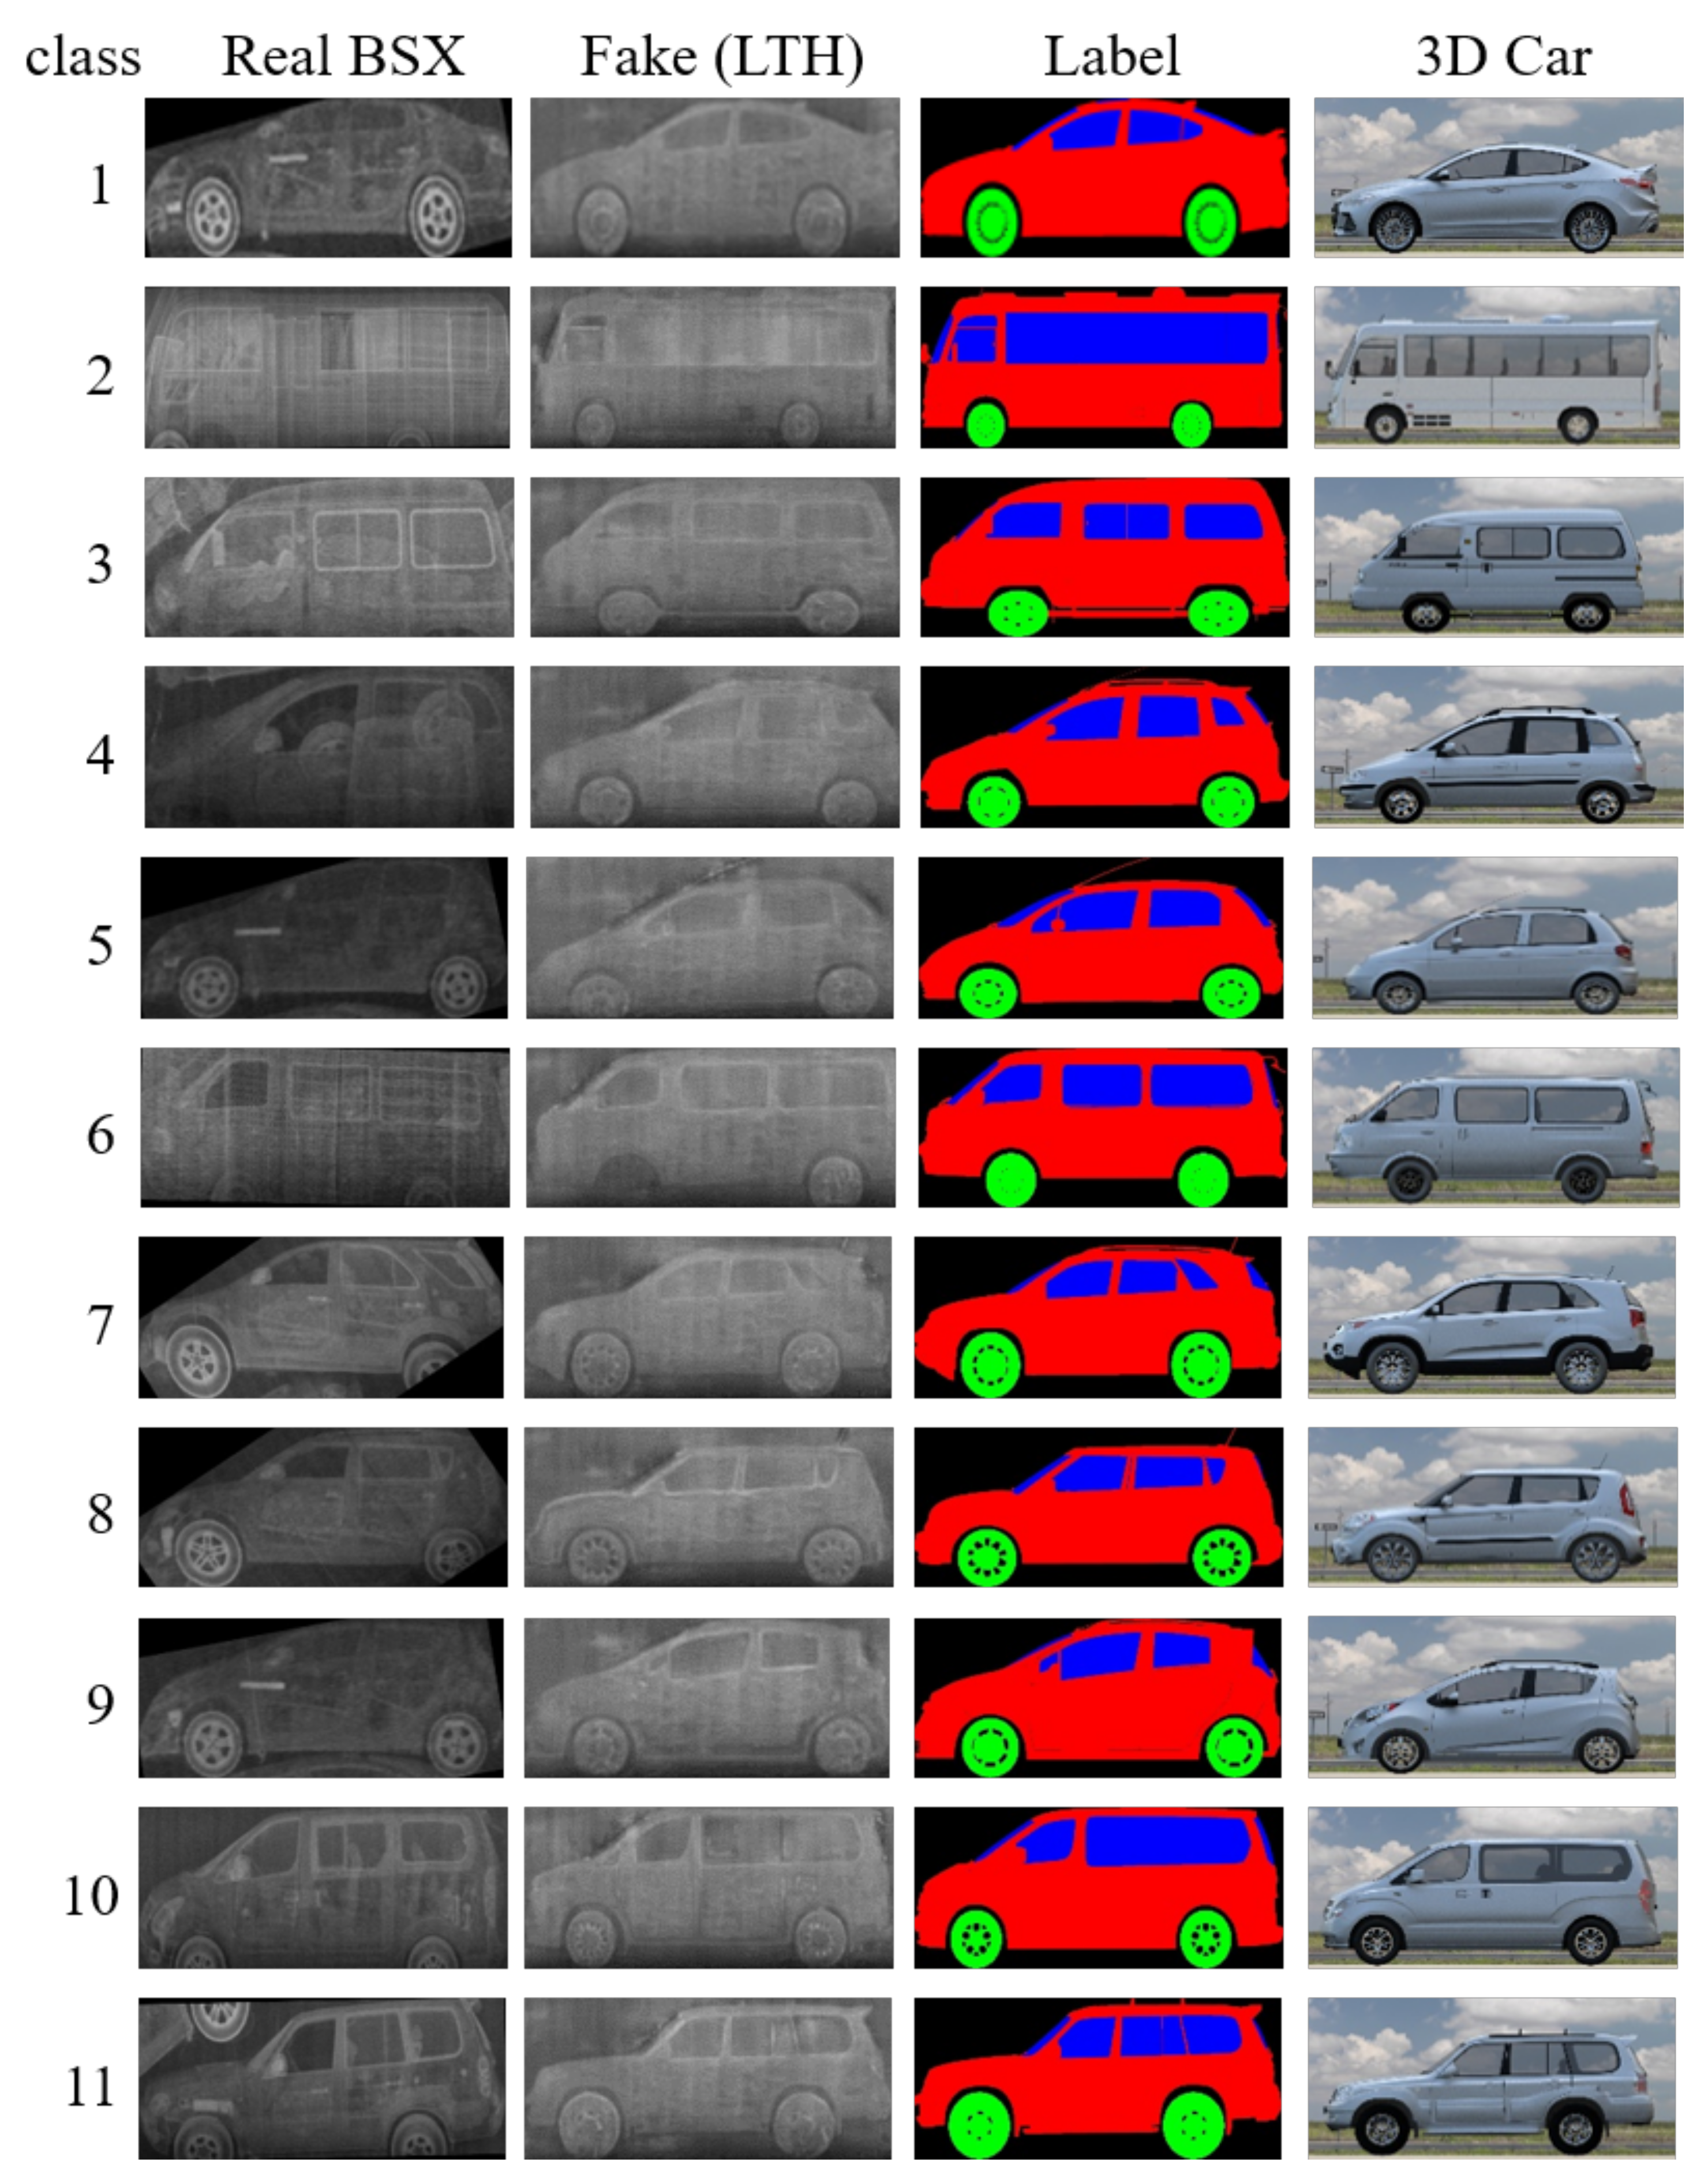
4.1. Qualitative Evaluation
4.2. Fréchet Inception Distance (FID)
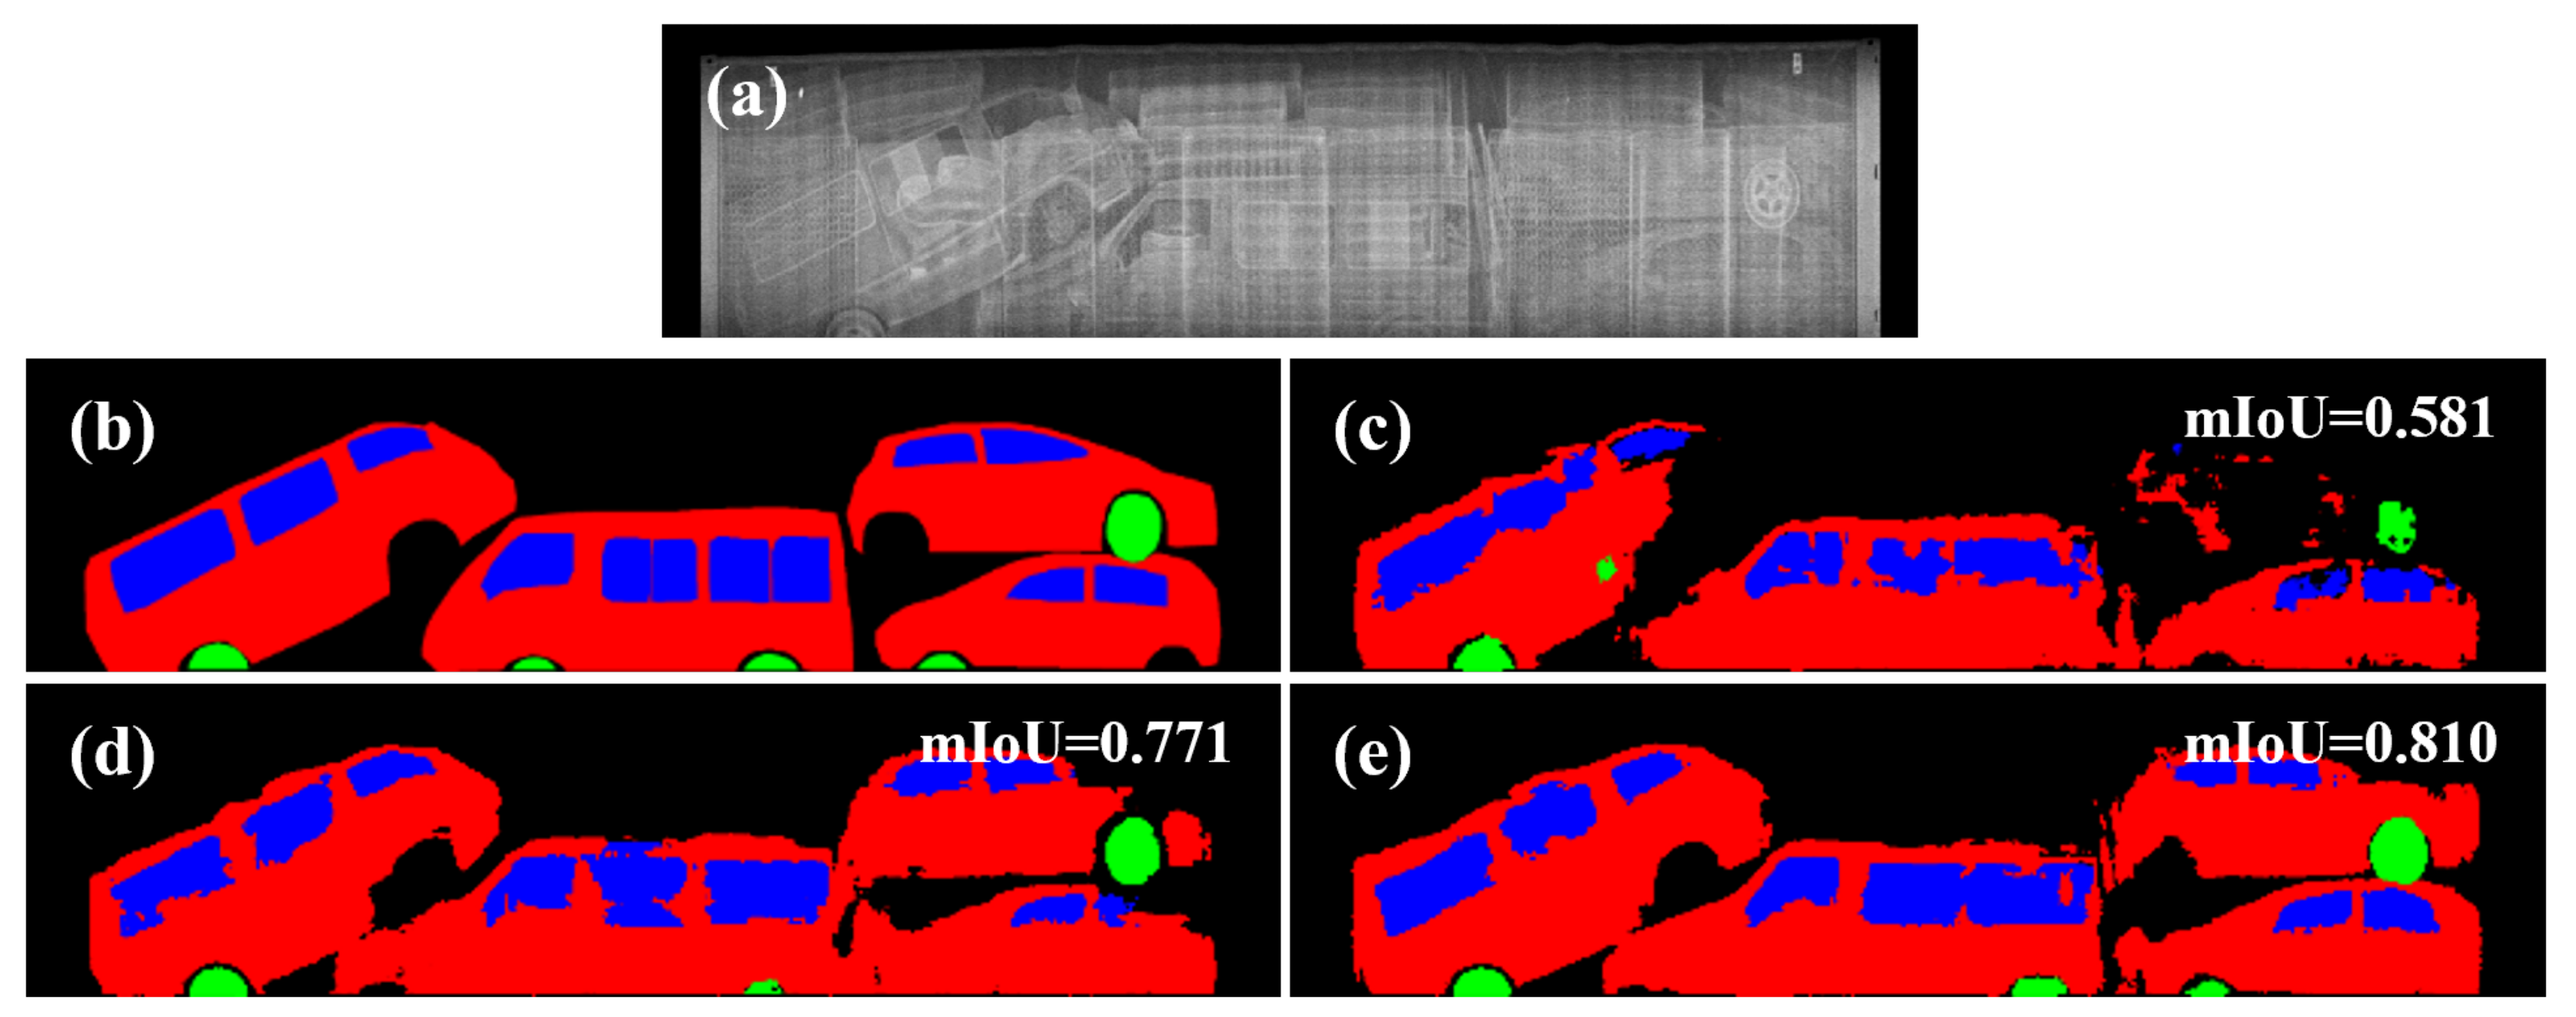
4.3. Segmentation
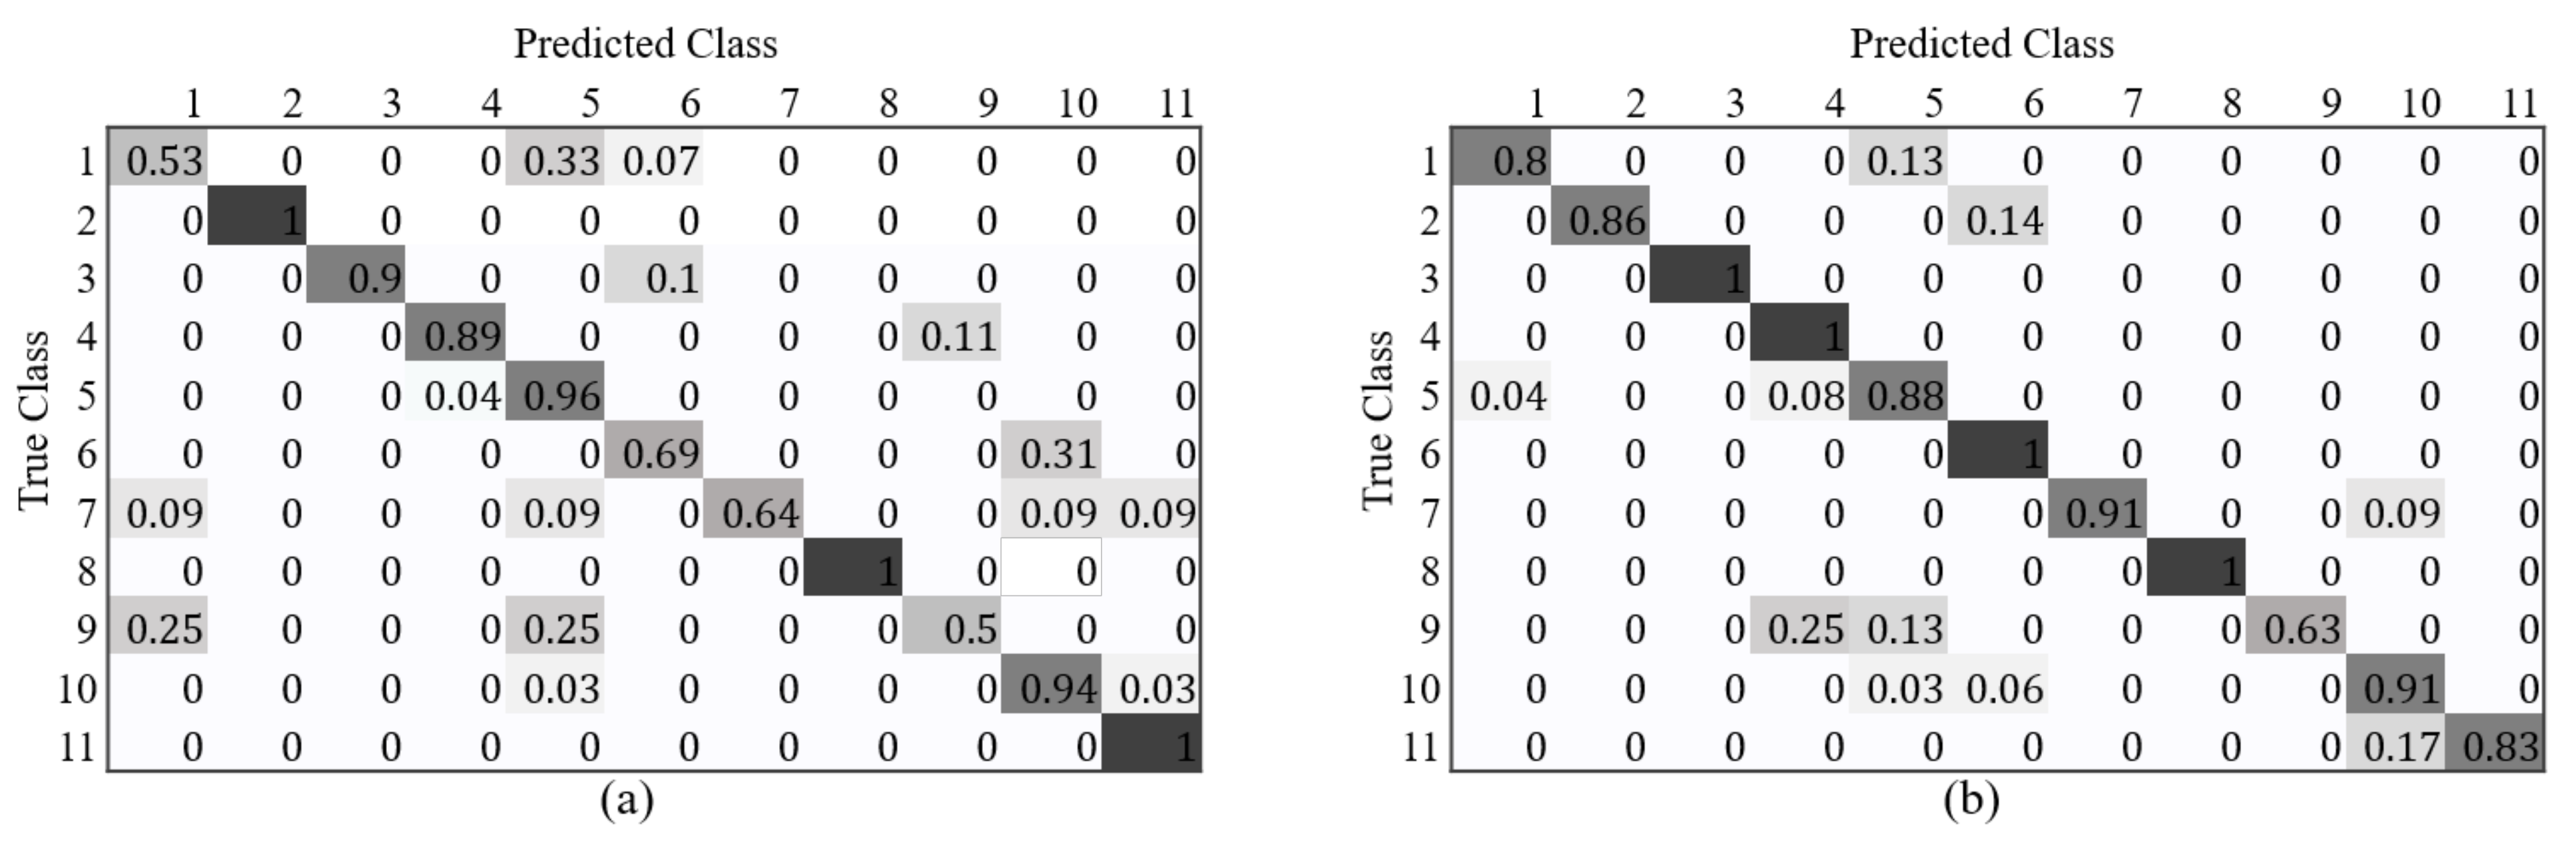
4.4. Classification
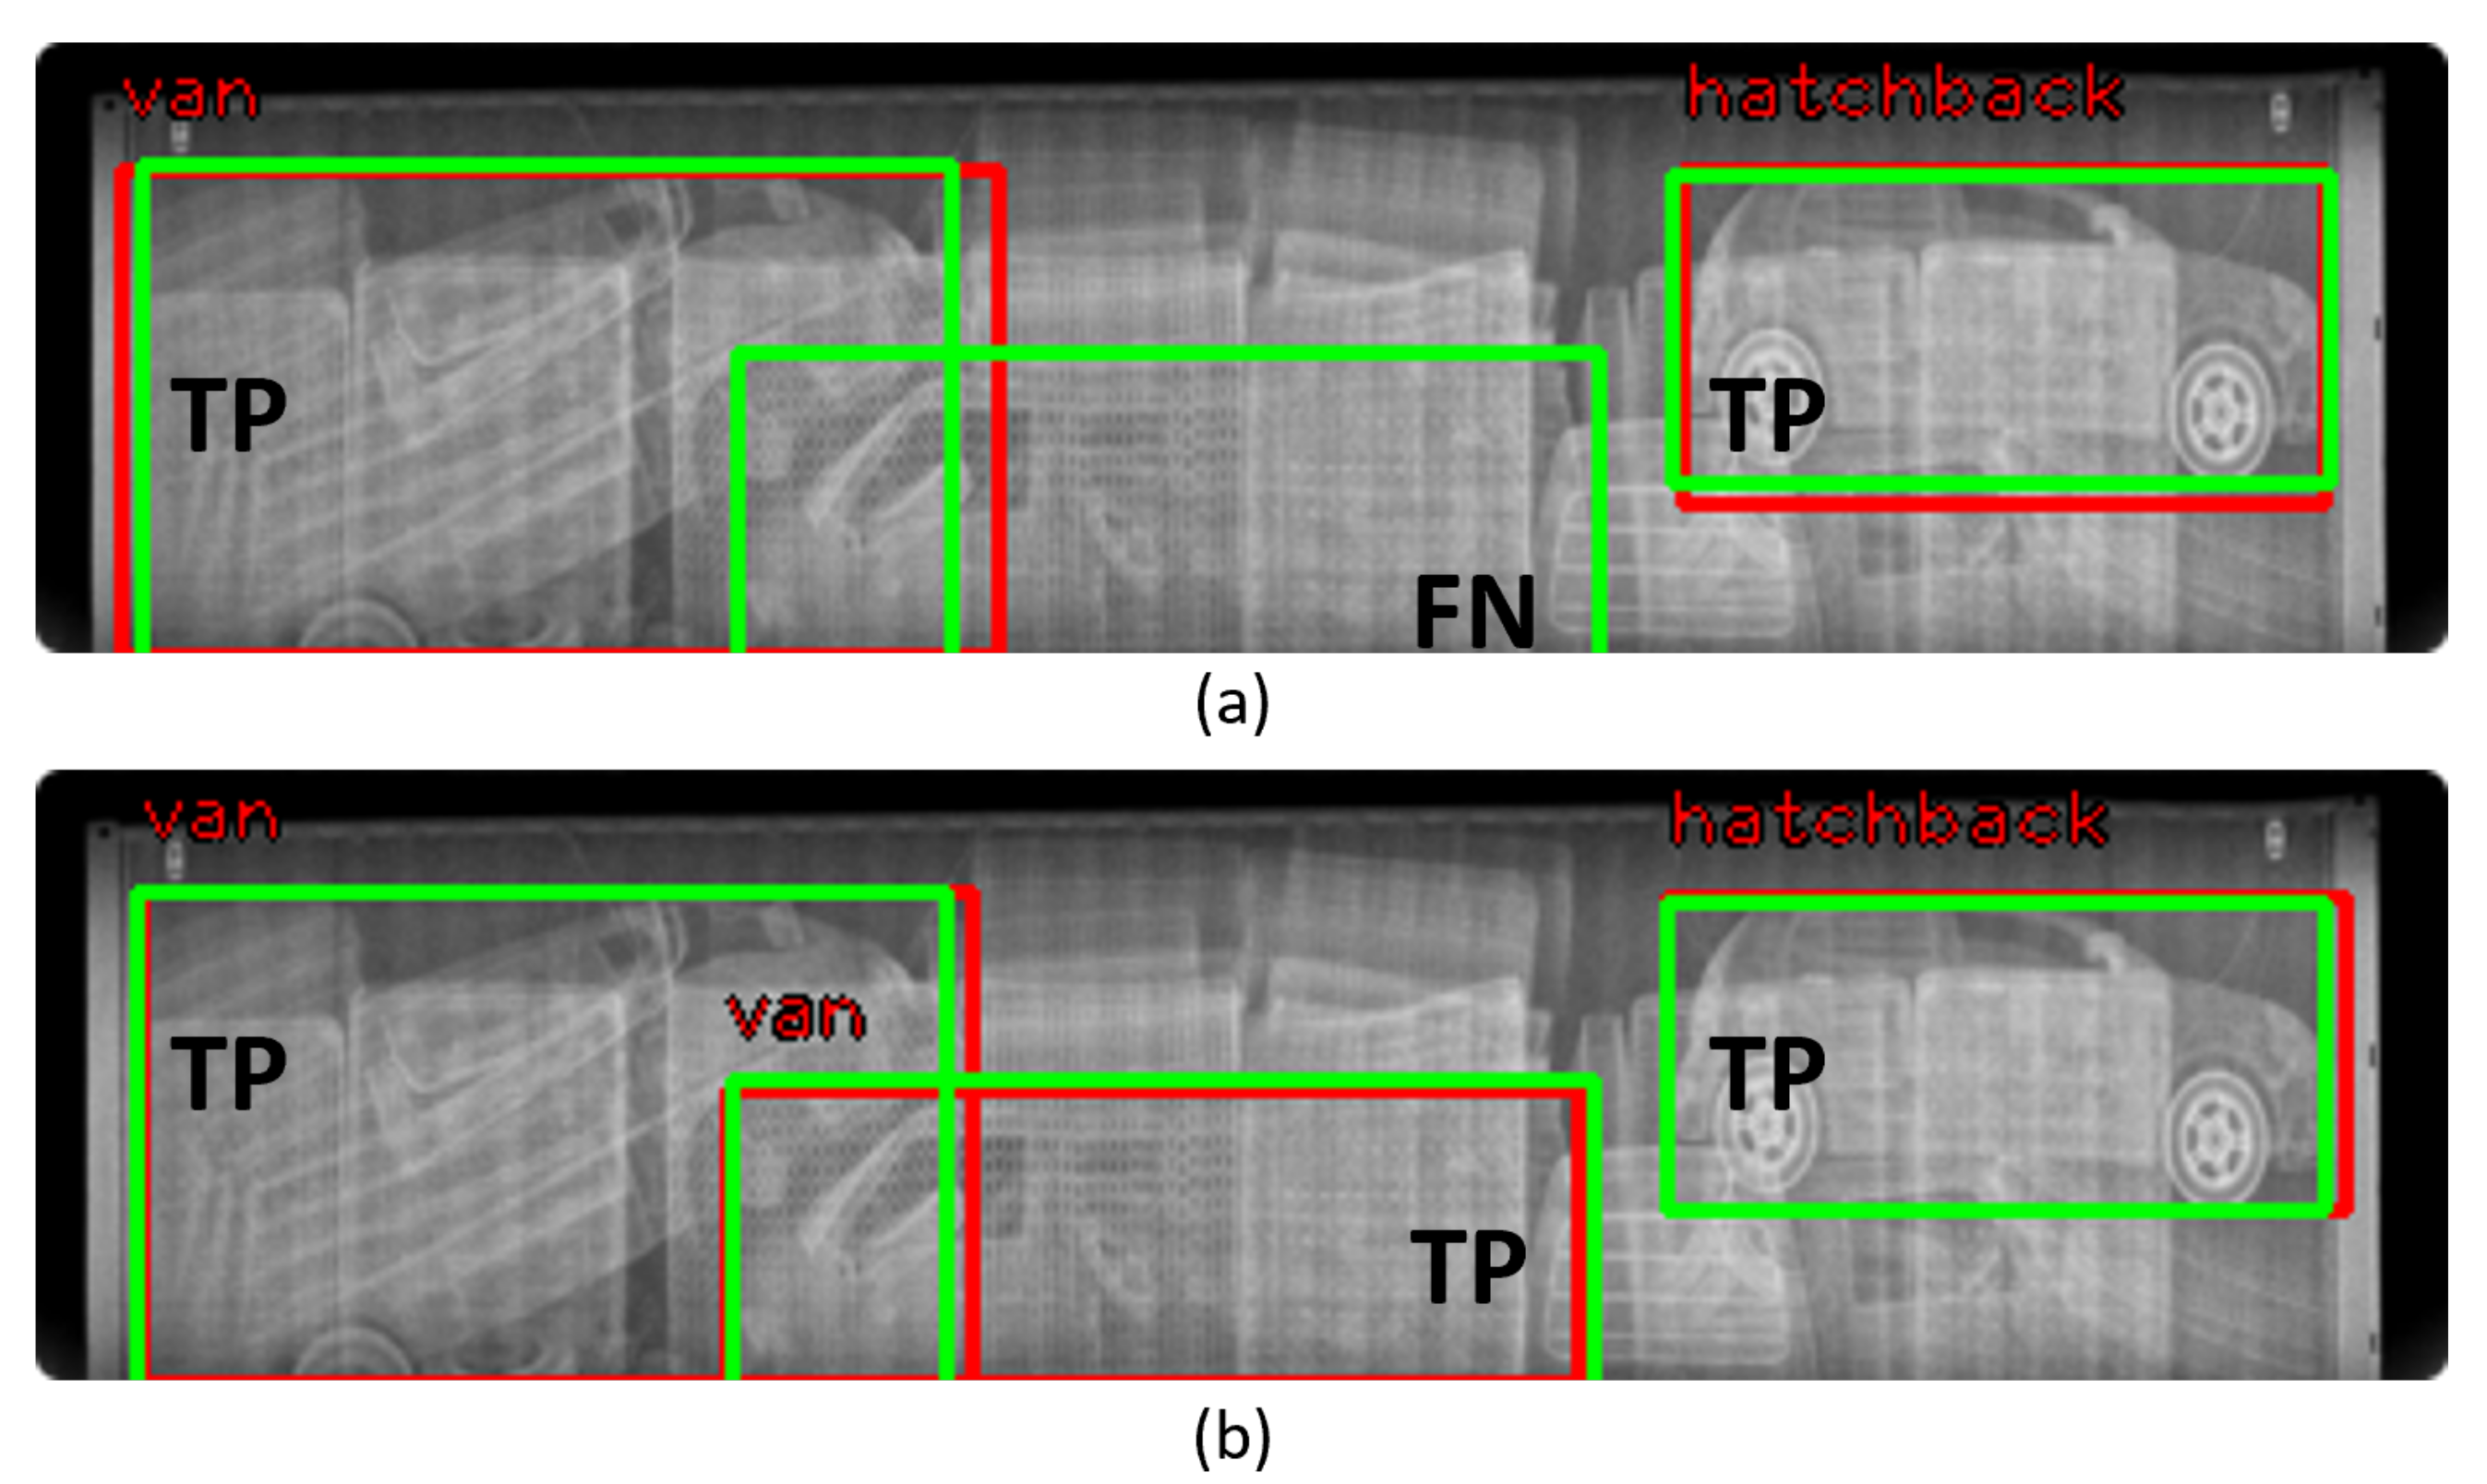
4.5. Detection
5. Conclusions
Author Contributions
Funding
Institutional Review Board Statement
Informed Consent Statement
Data Availability Statement
Acknowledgments
Conflicts of Interest
Abbreviations
| GAN | Generative adversarial network |
| BSX | Backscatter X-ray |
| ZBV | Z-backscatter van |
| FID | Fréchet inception distance |
| SEF | Sobel edge filter |
| LBP | Local binary patterns |
| LTH | Local thresholding |
Appendix A
Appendix B

| Generated Image | FID | SWD |
|---|---|---|
| SPADE | 100.4 | 1122.48 |
| SPADE + LBP | 59.3 | 1009.34 |
| pix2pix | 75.3 | 554.36 |
| pix2pix + LBP | 51.2 | 405.76 |
References
- Min, H.; Park, J.W.; Lim, Y.K.; Thus, A.; Cho, Y.K. Challenges and opportunities for implementing X-ray scanning technology at the Korean hub ports. Int. J. Logist. Syst. Manag. 2016, 25, 513–531. [Google Scholar] [CrossRef]
- Ji-hye, S. Korea to Adopt AI, Big Data, Blockchain for CUSTOMS Service. 2018. Available online: http://www.koreaherald.com/view.php?ud=20180307000694 (accessed on 14 September 2020).
- Daily Sabah. Vehicles Passing through Customs Gate to be Scanned via AI. 2020. Available online: https://www.dailysabah.com/business/2019/10/20/vehicles-passing-through-customs-gate-to-be-scanned-via-ai (accessed on 14 September 2020).
- Rogers, T.W.; Jaccard, N.; Morton, E.J.; Griffin, L.D. Automated X-ray Image Analysis for Cargo Security: Critical Review and Future Promise. J. X-ray Sci. Technol. 2017, 25, 33–56. [Google Scholar] [CrossRef] [PubMed] [Green Version]
- Cui, Y.; Oztan, B. Automated firearms detection in cargo X-ray images using RetinaNet. In Proceedings of the Anomaly Detection and Imaging with X-rays (ADIX), Baltimore, MD, USA, 14–18 April 2019. [Google Scholar]
- Rogers, T.W.; Jaccard, N.; Morton, E.J.; Griffin, L.D. Detection of cargo container loads from X-ray images. In Proceedings of the International Conference on Intelligent Signal Processing (ISP), London, UK, 1–2 December 2015. [Google Scholar]
- Jaccard, N.; Rogers, T.W.; Morton, E.J.; Griffin, L.D. Using deep learning on X-ray images to detect threats. In Proceedings of the Cranfield Defence and Security Doctoral Symposium, Cranfield, UK, 25–26 November 2015. [Google Scholar]
- Jaccard, N.; Rogers, T.W.; Morton, E.J.; Griffin, L.D. Tackling the X-ray cargo inspection challenge using machine learning. In Proceedings of the Anomaly Detection and Imaging with X-rays (ADIX), Baltimore, MD, USA, 19–20 April 2016. [Google Scholar]
- Visser, W.; Schwaninger, A.; Hardmeier, D.; Flisch, A. Automated comparison of X-ray images for cargo scanning. In Proceedings of the IEEE International Carnahan Conference on Security Technology (ICCST), Orlando, FL, USA, 24–27 October 2016. [Google Scholar]
- Rogers, T.W.; Jaccard, N.; Protonotarios, E.D.; Ollier, J.; Morton, E.J.; Griffin, L.D. Threat Image Projection (TIP) into X-ray images of cargo containers for training humans and machines. In Proceedings of the IEEE International Carnahan Conference on Security Technology (ICCST), Orlando, FL, USA, 24–27 October 2016. [Google Scholar]
- Jaccard, N.; Rogers, T.W.; Morton, E.J.; Griffin, L.D. Detection of concealed cars in complex cargo X-ray imagery using deep learning. J. X-ray Sci. Technol. 2017, 25, 323–339. [Google Scholar] [CrossRef] [PubMed] [Green Version]
- Chalmers, A. Rapid inspection of cargos at portals using drive-through transmission and backscatter X-ray imaging. In Proceedings of the SPIE 5403, Sensors, and Command, Control, Communications, and Intelligence (C3I) Technologies for Homeland Security and Homeland Defense III, Orlando, FL, USA, 12–16 April 2004; pp. 644–649. [Google Scholar]
- Isola, P.; Zhu, J.Y.; Zhou, T.; Efros, A.A. Image-to-Image Translation with Conditional Adversarial Networks. In Proceedings of the IEEE Conference on Computer Vision and Pattern Recognition, Honolulu, HI, USA, 21–26 July 2017. [Google Scholar]
- Sobel, I.; Feldman, G. A 3 × 3 Isotropic Gradient Operator for Image Processing; Stanford Artificial Intelligence Project: Stanford, CA, USA, 1968. [Google Scholar]
- Ojala, T.; Pietikainen, M.; Harwood, D. Performance evaluation of texture measures with classification based on Kullback discrimination of distributions. In Proceedings of the International Conference on Pattern Recognition, Jerusalem, Israel, 9–13 October 1994. [Google Scholar]
- Shapiro, L.; Stockman, G. Computer Vision; Prentice Hall: Hoboken, NJ, USA, 2001. [Google Scholar]
- Lantsman, L. Moveable currency: The role of seaports in export oriented vehicle theft. Crime Law Soc. Chang. 2013, 59, 157–184. [Google Scholar] [CrossRef]
- MacDonnell, M.C. Stolen Vehicles for Export: A Major Concern for Domestic and International Security; Naval Postgraduate School: Monterey, CA, USA, 2018. [Google Scholar]
- Jaccard, N.; Rogers, T.W.; Griffin, L.D. Automated detection of cars in transmission X-ray images of freight containers. In Proceedings of the 11th IEEE International Conference on Advanced Video and Signal Based Surveillance, Seoul, Korea, 26–29 August 2014. [Google Scholar]
- Tuszynski, J.; Briggs, J.T.; Kaufhold, J. A method for automatic manifest verification of container cargo using radiography images. J. Transp. Secur. 2013, 6, 339–356. [Google Scholar] [CrossRef]
- Zhang, J.; Zhang, L.; Zhao, Z.; Liu, Y.; Gu, J.; Li, Q.; Zhang, D. Joint Shape and Texture Based X-ray Cargo Image Classification. In Proceedings of the IEEE Conference on Computer Vision and Pattern Recognition Workshops, Columbus, OH, USA, 23–28 June 2014. [Google Scholar]
- Zhao, Z.; Zhang, H.; Yang, J. A GAN-Based Image Generation Method for X-ray Security Prohibited Items. In Proceedings of the 2018 IEEE/CVF Conference on Computer Vision and Pattern, Salt Lake City, UT, USA, 18–23 June 2018. [Google Scholar]
- Yang, J.; Zhao, Z.; Zhang, H.; Shi, Y. Data Augmentation for X-ray Prohibited Item Images Using Generative Adversarial Networks. IEEE Access 2019, 7, 28894–28902. [Google Scholar] [CrossRef]
- Wang, X.; Wang, K.; Lian, S. A survey on face data augmentation for the training of deep neural networks. Neural Comput. Appl. 2020, 32, 15503–15531. [Google Scholar] [CrossRef] [Green Version]
- Frid-Adar, M.; Klang, E.; Amitai, M.; Goldberger, J.; Greenspan, H. Synthetic data augmentation using GAN for improved liver lesion classification. In Proceedings of the IEEE International Symposium on Biomedical Imaging (ISBI), Washington, DC, USA, 4–7 April 2018. [Google Scholar]
- Zhu, J.Y.; Park, T.; Isola, P.; Efros, A.A. Unpaired image-to-image translation using cycle-consistent adversarial networks. In Proceedings of the IEEE International Conference on Computer Vision, Venice, Italy, 22–29 October 2017. [Google Scholar]
- Lin, J.; Xia, Y.; Qin, T.; Chen, Z.; Liu, T.Y. Conditional Image-to-Image Translation. In Proceedings of the IEEE Conference on Computer Vision and Pattern Recognition, Salt Lake City, UT, USA, 18–23 June 2018. [Google Scholar]
- Kazemi, H.; Iranmanesh, M.; Dabouei, A.; Soleymani, S.; Nasrabadi, N.M. Facial Attributes Guided Deep Sketch-to-Photo Synthesis. In Proceedings of the IEEE Winter Applications of Computer Vision Workshops (WACVW), Lake Tahoe, NV, USA, 15 March 2018. [Google Scholar]
- Xian, W.; Sangkloy, P.; Agrawal, V.; Raj, A.; Lu, J.; Fang, C.; Yu, F.; Hays, J. TextureGAN: Controlling Deep Image Synthesis with Texture Patches. In Proceedings of the IEEE Conference on Computer Vision and Pattern Recognition, Salt Lake City, UT, USA, 18–23 June 2018. [Google Scholar]
- Karras, T.; Laine, S.; Aila, T. A Style-Based Generator Architecture for Generative Adversarial Networks. In Proceedings of the IEEE Conference on Computer Vision and Pattern Recognition, Salt Lake City, UT, USA, 18–23 June 2018. [Google Scholar]
- Park, T.; Liu, M.Y.; Wang, T.C.; Zhu, J.Y. Semantic Image Synthesis with Spatially-Adaptive Normalization. In Proceedings of the IEEE/CVF Conference on Computer Vision and Pattern Recognition, Long Beach, CA, USA, 15–20 June 2019. [Google Scholar]
- Arjovsky, S.C.M.; Bottou, L. Wasserstein generative adversarial networks. In Proceedings of the 34th International Conference on Machine Learning, Sydney, NSW, Australia, 6–11 August 2017. [Google Scholar]
- Gao, J.; Tembine, H. Distributionally Robust Games: Wasserstein Metric. In Proceedings of the 2018 International Joint Conference on Neural Networks (IJCNN), Rio de Janeiro, Brazil, 8–13 July 2018; pp. 1–8. [Google Scholar] [CrossRef]
- Shrivastava, A.; Pfister, T.; Tuzel, O.; Susskind, J.; Wang, W.; Webb, R. Learning from Simulated and Unsupervised Images through Adversarial Training. In Proceedings of the IEEE Conference on Computer Vision and Pattern Recognition, Honolulu, HI, USA, 21–26 July 2017. [Google Scholar]
- Zhang, T.; Wiliem, A.; Yang, S.; Lovell, B.C. TV-GAN: Generative Adversarial Network Based Thermal to Visible Face Recognition. In Proceedings of the 2018 International Conference on Biometrics, Gold Coast, QLD, Australia, 20–23 February 2018. [Google Scholar]
- Wang, Z.; Chen, Z.; Wu, F. Thermal to Visible Facial Image Translation Using Generative Adversarial Networks. IEEE Signal Process. Lett. 2018, 25, 1161–1165. [Google Scholar] [CrossRef]
- Zhang, Y.; Miao, S.; Mansi, T.; Liao, R. Task Driven Generative Modeling for Unsupervised Domain Adaptation: Application to X-ray Image Segmentation. In Proceedings of the Medical Image Computing and Computer Assisted Intervention (MICCAI), Granada, Spain, 16–20 September 2018. [Google Scholar]
- Pérez, P.; Gangnet, M.; Blake, A. Poisson Image Editing. ACM Trans. Graph. 2003, 22, 313–318. [Google Scholar] [CrossRef]
- Tsai, Y.H.; Shen, X.; Lin, Z.; Sunkavalli, K.; Lu, X.; Yang, M.H. Deep image harmonization. In Proceedings of the IEEE Conference on Computer Vision and Pattern Recognition, Honolulu, HI, USA, 21–26 July 2017. [Google Scholar]
- Miao, C.; Xie, L.; Wan, F.; Su, C.; Liu, H.; Jiao, J.; Ye, Q. A large-scale security inspection X-ray benchmark for prohibited item discovery in overlapping images. In Proceedings of the IEEE Conference on Computer Vision and Pattern Recognition, Long Beach, CA, USA, 15–20 June 2019. [Google Scholar]
- Durall, R.; Keuper, M.; Keuper, J. Watch your Up-Convolution CNN Based Generative Deep Nueral Networks are Failling to Reproduce Spectral Distributions. In Proceedings of the IEEE/CVF Conference on Computer Vision and Pattern Recognition, Seattle, WA, USA, 13–19 June 2020. [Google Scholar]
- Chandrasegaran, K.; Tran, N.T.; Cheung, N.M. A Closer Look at Fourier Spectrum Discrepancies for CNN-generated Images Detection. In Proceedings of the IEEE/CVF Conference on Computer Vision and Pattern Recognition, New Orleans, LA, USA, 19–24 June 2021. [Google Scholar]
- Wang, T.C.; Liu, M.Y.; Zhu, J.Y.; Tao, A.; Kautz, J.; Catanzaro, B. pix2pixHD: High-Resolution Image Synthesis and Semantic Manipulation with Conditional GANs. In Proceedings of the IEEE Conference on Computer Vision and Pattern Recognition, Salt Lake City, UT, USA, 18–23 June 2018. [Google Scholar]
- Kong, D.; Ren, Y.; Hou, R.; Grimm, L.J.; Marks, J.R.; Lo, J.Y. Synthesis and texture manipulation of screening mammograms using conditional generative adversarial network. In Proceedings of the SPIE Medical Imaging, San Diego, CA, USA, 16–21 February 2019. [Google Scholar]
- Porebski, A.; Vandenbroucke, N.; Hamad, D. LBP histogram selection for supervised color texture classification. In Proceedings of the IEEE International Conference on Image Processing, Melbourne, VIC, Australia, 15–18 September 2013. [Google Scholar]
- Guo, Z.; Zhang, L.; Zhang, D. Rotation invariant texture classification using LBP variance (LBPV) with global matching. Pattern Recognit. 2010, 43, 706–719. [Google Scholar] [CrossRef]
- Zhu, J.; Balieu, R.; Lu, X.; Kringos, N. Microstructure evaluation of polymer-modified bitumen by image analysis using two-dimensional fast Fourier transform. Mater. Des. 2018, 137, 164–175. [Google Scholar] [CrossRef] [Green Version]
- Heusel, M.; Ramsauer, H.; Unterthiner, T.; Nessler, B.; Hochreiter, S. GANs trained by a two time-scale update rule converge to a local nash equilibrium. In Proceedings of the Advances in Neural Information Processing Systems, Long Beach, CA, USA, 4–9 December 2017. [Google Scholar]
- Karras, T.; Aila, T.; Laine, S.; Lehtinen, J. Progressive Growing of GANs for Improved Quality, Stability, and Variation. In Proceedings of the International Conference on Learning Representations, Vancouver, BC, Canada, 30 April–3 May 2018. [Google Scholar]
- Ronneberger, O.; Fischer, P.; Brox, T. U-net: Convolutional networks for biomedical image segmentation. In Proceedings of the International Conference on Medical Image Computing and Computer-Assisted Intervention, Munich, Germany, 5–9 October 2015. [Google Scholar]
- López-Camacho, E.; Ochoa, G.; Terashima-Marín, H.; Burke, E.K. An effective heuristic for the two-dimensional irregular bin packing problem. Ann. Oper. Res. 2013, 206, 241–264. [Google Scholar] [CrossRef] [Green Version]
- He, K.; Zhang, X.; Ren, S.; Sun, J. Deep residual learning for image recognition. In Proceedings of the IEEE Conference on Computer Vision and Pattern Recognition, Las Vegas, NV, USA, 27–30 June 2016. [Google Scholar]
- Lin, T.Y.; Goyal, P.; Girshick, R.; He, K.; Dollár, P. Focal loss for dense object detection. In Proceedings of the IEEE International Conference on Computer Vision, Venice, Italy, 22–29 October 2017. [Google Scholar]


| Generated Image | FID | SWD |
|---|---|---|
| Fake (pix2pix) | 43.9 | 1393.97 |
| Fake (SEF) | 42.1 | 1283.53 |
| Fake (LTH) | 28.1 | 1133.91 |
| Fake (LBP) | 27.6 | 892.97 |
| Accuracy | mIoU | |||
|---|---|---|---|---|
| Training Dataset | ||||
| Real | 0.909 | 0.715 | ||
| Real + Fake (pix2pix) | 0.921 | 0.915 | 0.764 | 0.726 |
| Real + Fake (SEF) | 0.914 | 0.914 | 0.748 | 0.739 |
| Real + Fake (LTH) | 0.925 | 0.921 | 0.773 | 0.754 |
| Real + Fake (LBP) | 0.920 | 0.918 | 0.746 | 0.757 |
| Fake(pix2pix) | 0.677 | 0.793 | 0.250 | 0.468 |
| Fake(SEF) | 0.708 | 0.798 | 0.293 | 0.489 |
| Fake(LTH) | 0.772 | 0.867 | 0.407 | 0.621 |
| Fake(LBP) | 0.748 | 0.839 | 0.395 | 0.563 |
| Accuracy | ||
|---|---|---|
| Training Dataset | ||
| Real | 0.838 | |
| Real+Fake(pix2pix) | 0.866 | 0.810 |
| Real+Fake(SEF) | 0.873 | 0.775 |
| Real+Fake(LTH) | 0.901 | 0.859 |
| Real+Fake(LBP) | 0.866 | 0.838 |
| Accuracy | ||
|---|---|---|
| Training Dataset | ||
| Real | 0.899 | |
| Real+Fake(pix2pix) | 0.907 | 0.911 |
| Real+Fake(SEF) | 0.897 | 0.913 |
| Real+Fake(LTH) | 0.912 | 0.910 |
| Real+Fake(LBP) | 0.913 | 0.916 |
| Fake(pix2pix) | 0.174 | 0.804 |
| Fake(SEF) | 0.247 | 0.825 |
| Fake(LTH) | 0.248 | 0.889 |
| Fake(LBP) | 0.298 | 0.897 |
Publisher’s Note: MDPI stays neutral with regard to jurisdictional claims in published maps and institutional affiliations. |
© 2021 by the authors. Licensee MDPI, Basel, Switzerland. This article is an open access article distributed under the terms and conditions of the Creative Commons Attribution (CC BY) license (https://creativecommons.org/licenses/by/4.0/).
Share and Cite
Cho, H.; Park, H.; Kim, I.-J.; Cho, J. Data Augmentation of Backscatter X-ray Images for Deep Learning-Based Automatic Cargo Inspection. Sensors 2021, 21, 7294. https://doi.org/10.3390/s21217294
Cho H, Park H, Kim I-J, Cho J. Data Augmentation of Backscatter X-ray Images for Deep Learning-Based Automatic Cargo Inspection. Sensors. 2021; 21(21):7294. https://doi.org/10.3390/s21217294
Chicago/Turabian StyleCho, Hyunwoo, Haesol Park, Ig-Jae Kim, and Junghyun Cho. 2021. "Data Augmentation of Backscatter X-ray Images for Deep Learning-Based Automatic Cargo Inspection" Sensors 21, no. 21: 7294. https://doi.org/10.3390/s21217294
APA StyleCho, H., Park, H., Kim, I.-J., & Cho, J. (2021). Data Augmentation of Backscatter X-ray Images for Deep Learning-Based Automatic Cargo Inspection. Sensors, 21(21), 7294. https://doi.org/10.3390/s21217294