1. Introduction
Cable-supported systems are widely used in large span space structures, such as air-supported roofs, cable-stayed bridges, suspension bridges, cable domes, and so on [
1]. As main load bearing components, cables play important roles in these structures and their failure may result in the structure’s accidental collapse. Furthermore, the condition of cable-stayed structures can be assessed through their cable tension during operation [
2,
3]. There are many methods to measure cable tension force, such as using load cells, hydraulic jacks [
4], FBG sensors [
5] or electromagnetic sensors. However, those conventional sensors become unfeasible and impracticable when applied in long-term monitoring. For example, the method using load cell is uneconomical since the service life of a load cell is generally much shorter than that of a structure. FBG sensors are sensitive to environment or operating technology, thus have lower accuracy. Some of these sensors must be installed during construction and are difficult to maintain, something that is not amenable to existing structures [
6,
7].
The vibration-based method is commonly employed to estimate cable tension as it is fast, economical and easy to operate compared with the above mentioned methods [
8]. This dynamical method is capable of calculating cable tension force directly using only the cable’s acceleration responses through the relationship between the cable’s natural frequencies and the cable’s tension [
9,
10,
11]. Zui et al. proposed a simple formula to estimate cable tension by using measured natural frequencies in low-order modes and calibrating the results with finite element analytical results [
12]. Ren et al. developed an empirical formula to obtain cable tension based only on the cable fundamental frequency and verified it with experimental results [
13].
With the rapid development of internet of things (IoT)-enabled wireless sensor networks (WSN) [
14,
15], smart wireless sensors, with the capability to process data locally and transmit information through wireless communication, have become increasingly attractive and widely utilized in many fields [
16,
17,
18], including structure health monitoring, mechanism control and big data analytics. IoT-WSN technology is particularly applicable for cable tension monitoring [
19,
20,
21,
22], especially for those large scale cable-supported structures, with a large number of cables, which are a great challenge to wired sensor monitoring systems or traditional centralized process technologies [
23]. Cable tension estimation via wireless sensor technology has been the subject of major research in recent years. For example, considering the effects of the sag-to-span ratio and bending stiffness, Cho et al. [
24] proposed an automated and low-cost wireless sensor system for the continuous monitoring of cable tension based on Zui’s approach. The peak-picking method has been used with a Fourier spectrum to identify modal frequencies, which were then utilized in cable tension estimation. Sim et al. [
25] proposed a hybrid wireless sensor network based on the Imote2 platform to detect cable tension by using simple string theory for full scale cable-stayed bridges. To extract highly reliable frequencies from the power spectrum, a threshold value was set to search the highest points by comparing local data near natural frequencies. This method had been implemented on Jindo Bridge, located in Korea, and its effectiveness had been verified successfully. A smartphone-based portable cable tension testing method has been proposed by Zhao in which the cable force can be calculated by the estimated model frequency of cables through a software named Orion CC [
26,
27].
In order to make full use of wireless sensor networks in cable tension estimation (CTE) systems and ensure the system satisfies the requirements of many different types of cable-supported structures, it is essential to develop a fully automated and robust cable tension estimation system. Previous research has achieved successful results in cable tension force monitoring, however, there are still some problems to be solved, which mainly include: (1) Preprocessing or manual interventions required during testing, such as pre-calculated reference modal parameters or picking peaks manually, are usually inescapable [
25,
26,
27]. This is a big challenge for large-scale cable structures with a dense array of sensors. (2) The peak-picking method is commonly and conveniently used in extracting frequencies, especially for clearly separated power spectra, but in practice the power spectra of acceleration responses from ambient excitation usually have undesirable peaks or miss the inner peaks. Threshold values are helpful in picking reliable peaks, but fail to eliminate false frequencies. Meanwhile, the peak-picking method is particularly related to the vibration mode, and so may fail to identify the modal parameters for weak vibrations. (3) The current systems are mainly used for special structures or applications, which are not universal, so the properties and vibration characteristics differ widely. This limits the development and applications of an estimation system.
In this study, a robust and fully automated cable tension estimation system is proposed. Firstly, the main factors affecting the accuracy of cable tension estimation are discussed with regard to instances where the peak-picking method and simple string cable model are used in cable tension estimation via wireless sensor networks. Furthermore, a CTE strategy is developed to solve the potential problems resulting from incorrectly identified frequencies and corresponding mode orders. Finally, this method is implemented with the Xnode wireless sensor system, and the data collected from Jindo Bridge employed to verify the feasibility of the system.
2. Theoretical Background of Cable Tension Estimation via Cable Vibration
The vibration-based method is one of the most convenient and widely accepted cable tension estimation methods, because it requires only an accelerometer to measure the cable vibration subjected to environmental loading. For cable-stayed structures, the cable can be simulated as an inclined string with two fixed ends. In this paper, the flat taut string theory is utilized to estimate cable tension via the vibration frequencies of the cable. Based on the assumption that the cable’s bending stiffness is considered and the sag-extensibility is neglected, the dynamic differential equation of the stayed-cable is given as follows:
where
is the cable’s mass per unit length,
is the cable’s deflection,
is the flexural stiffness of the cable, and
is the cable tension. Based on the tightening string model, the relation of the cable’s natural frequencies and the cable tension can be expressed by:
where
is the natural frequency,
is the order of the natural frequency,
is the length of cable, and
and
are the linear regression results of
and
. Using Equation (2), the cable tension force can be estimated as:
3. Key Influence Factors of Cable Tension Estimation Accuracy
According to the principle mentioned above, it is obvious that the accuracy of cable tension is particularly related with the modal parameters, mass (m) and length of the cable (L). The inaccuracy of those parameters may result in a large error in the estimation of cable tension, something that will be discussed as follows.
In practice, it is a big challenge for a wireless sensor to extract the cable’s natural frequencies autonomously and accurately from the power spectrum of the cable’s vibration through the peak-picking method. The commonly encountered problems are listed as follows:
- (1)
Identifying useful vibration data.
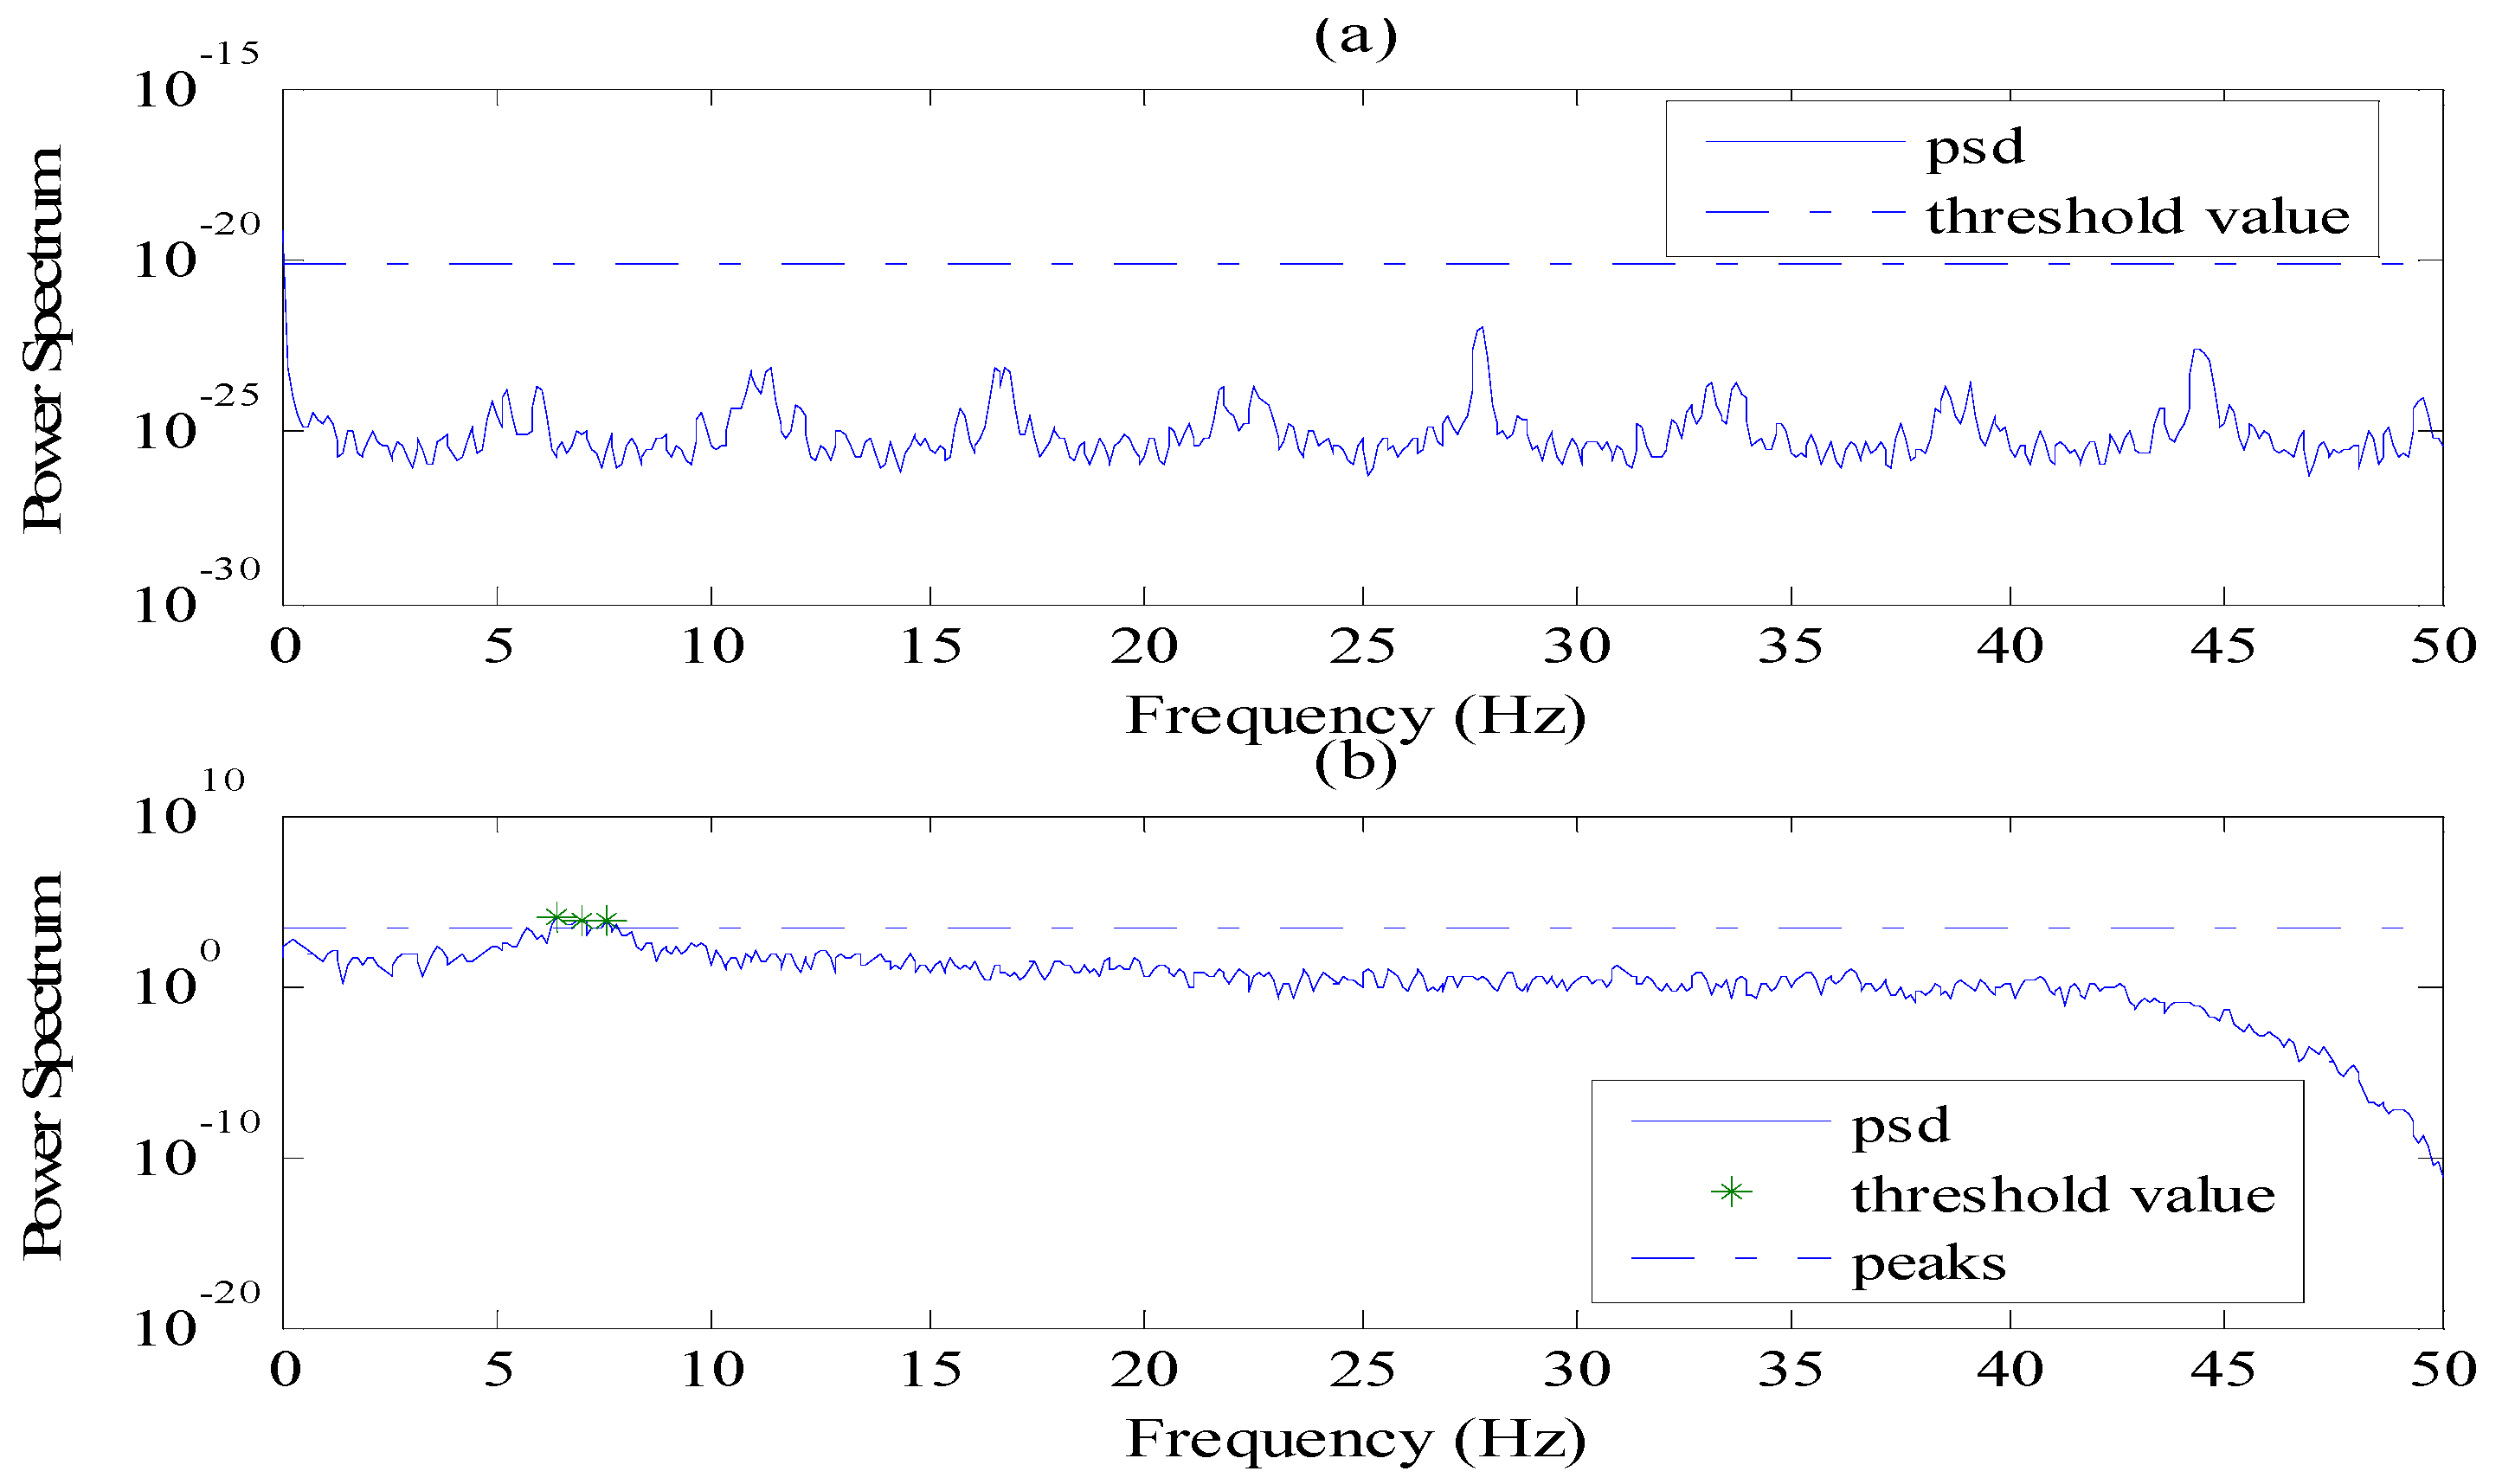
In real testing, the cable vibration may not be strong enough to show obvious frequency poles in power spectrum. In this case, there may be no frequency peaks to be found or undesirable peaks may be eventually picked through the regular peak-picking method [
25], as shown in
Figure 1. Consequently, the obtained cable tension would not be correct.
Figure 1a shows a cable vibration that is too weak to exhibit the obvious peaks.
Figure 1b shows a power spectral density (PSD) with many false peaks found through the regular peak-picking method. In this instance, the wireless sensor should have the capability to identify whether the power spectrum of acceleration response would be useful and recognizable.
- (2)
Extracting a cable’s natural frequency from vibration data automatically and robustly.
For each cable, the auto-power spectrum density is generally adopted to extract structural natural frequencies by using its own vibration response. However, the acceleration signal may be influenced by many uncertain environmental factors [
28,
29], which may lead to some false peaks in the auto-power spectrum. The aforementioned theory indicates that the frequencies used in Equation (2) are all with correct mode orders. If the identified frequencies or the mode orders are inaccurate, then the cable tension force would not be correct. Thus, the automatic extraction of the true frequencies of the cable is also a problem to be solved for wireless sensor networks.
- (3)
Identify the frequency order automatically.
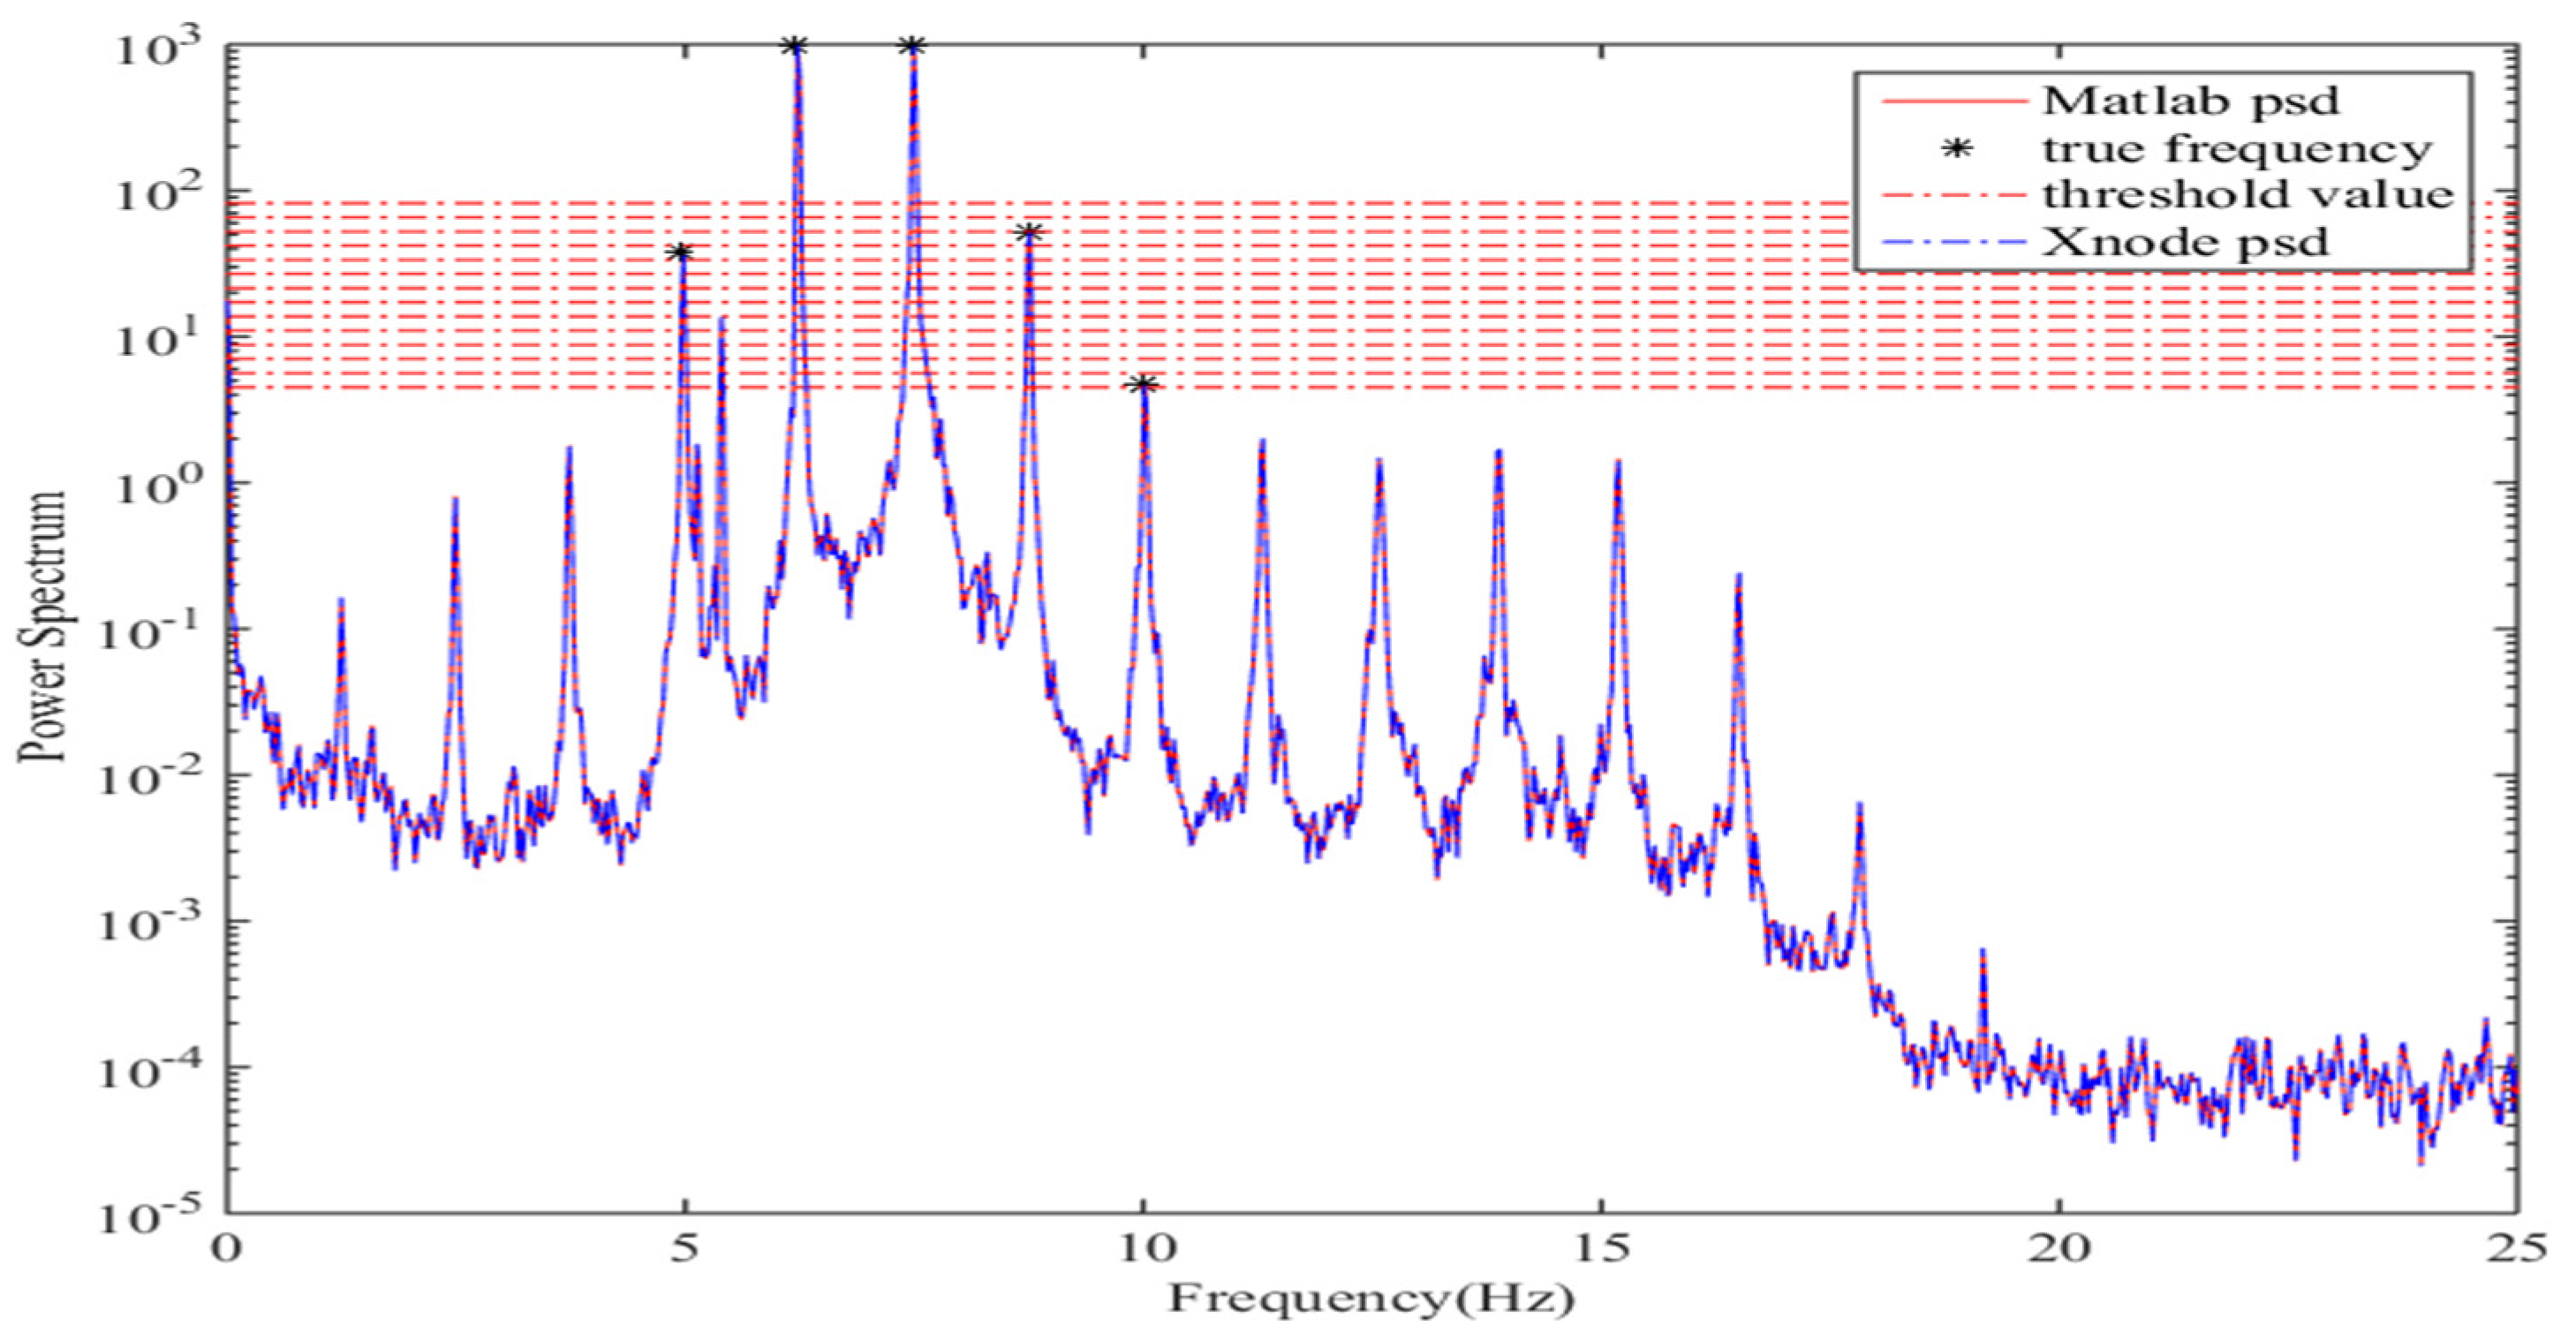
Generally, the prominent peaks of the power spectrum density may not start from the first mode [
25] or may exist in a discontinuous order. The example in
Figure 2 shows that one modal frequency (marked with a black spot) is missed, meaning that the order of obtained potential frequencies will be distorted. In such a case, automatically identifying the mode order is also challenging for a smart sensor.
4. Automated and Robust Cable Tension Estimation Method
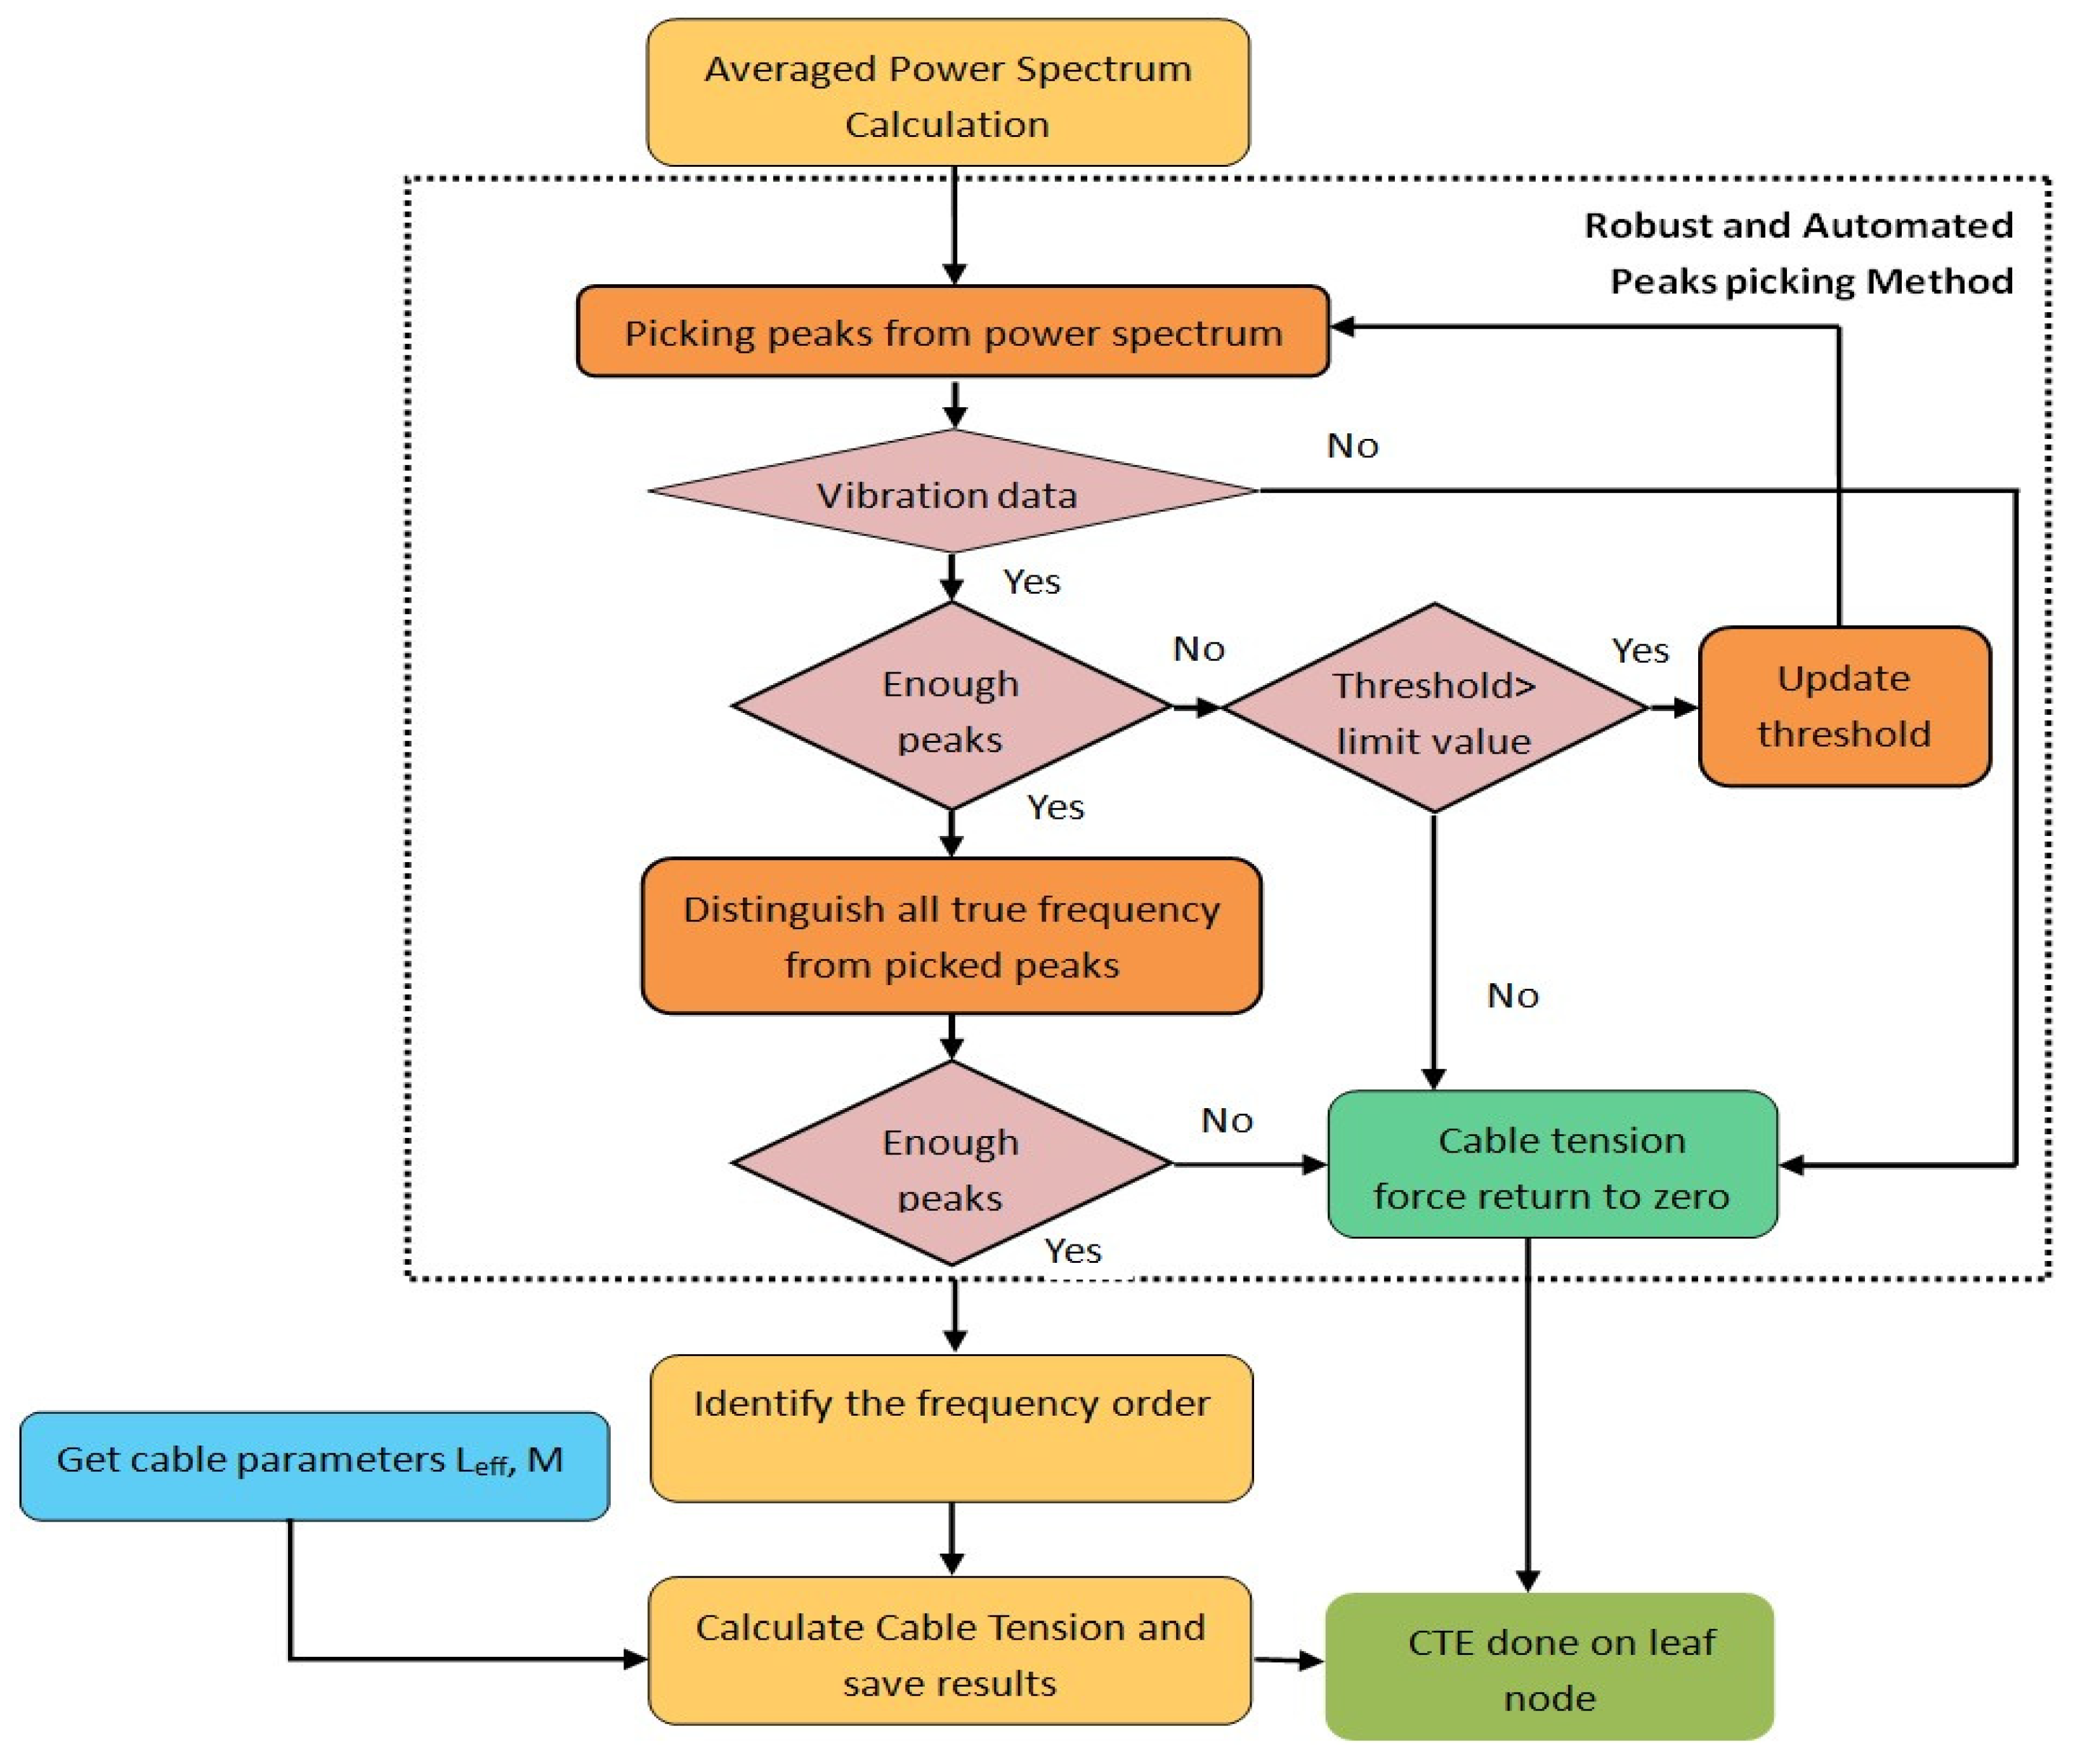
According to the theory mentioned in part two, assuming that unit mass and effective length of cable are constants, the cable tension estimation is focused on identifying frequencies and their orders automatically in WSN. Considering the aforementioned problems, an improved strategy based on vibration method is developed for a wireless sensor to realize fully automated and robust cable tension estimation. As shown in
Figure 3, the whole method includes three steps: (1) automatically calculating PSD from acceleration data; (2) fully automated and robust peak-picking analysis to obtain true frequencies; (3) identification of the mode order and computation of cable tension force according to the linear regression result.
The details of each step will be discussed as follows.
4.1. Power Spectral Density Estimation
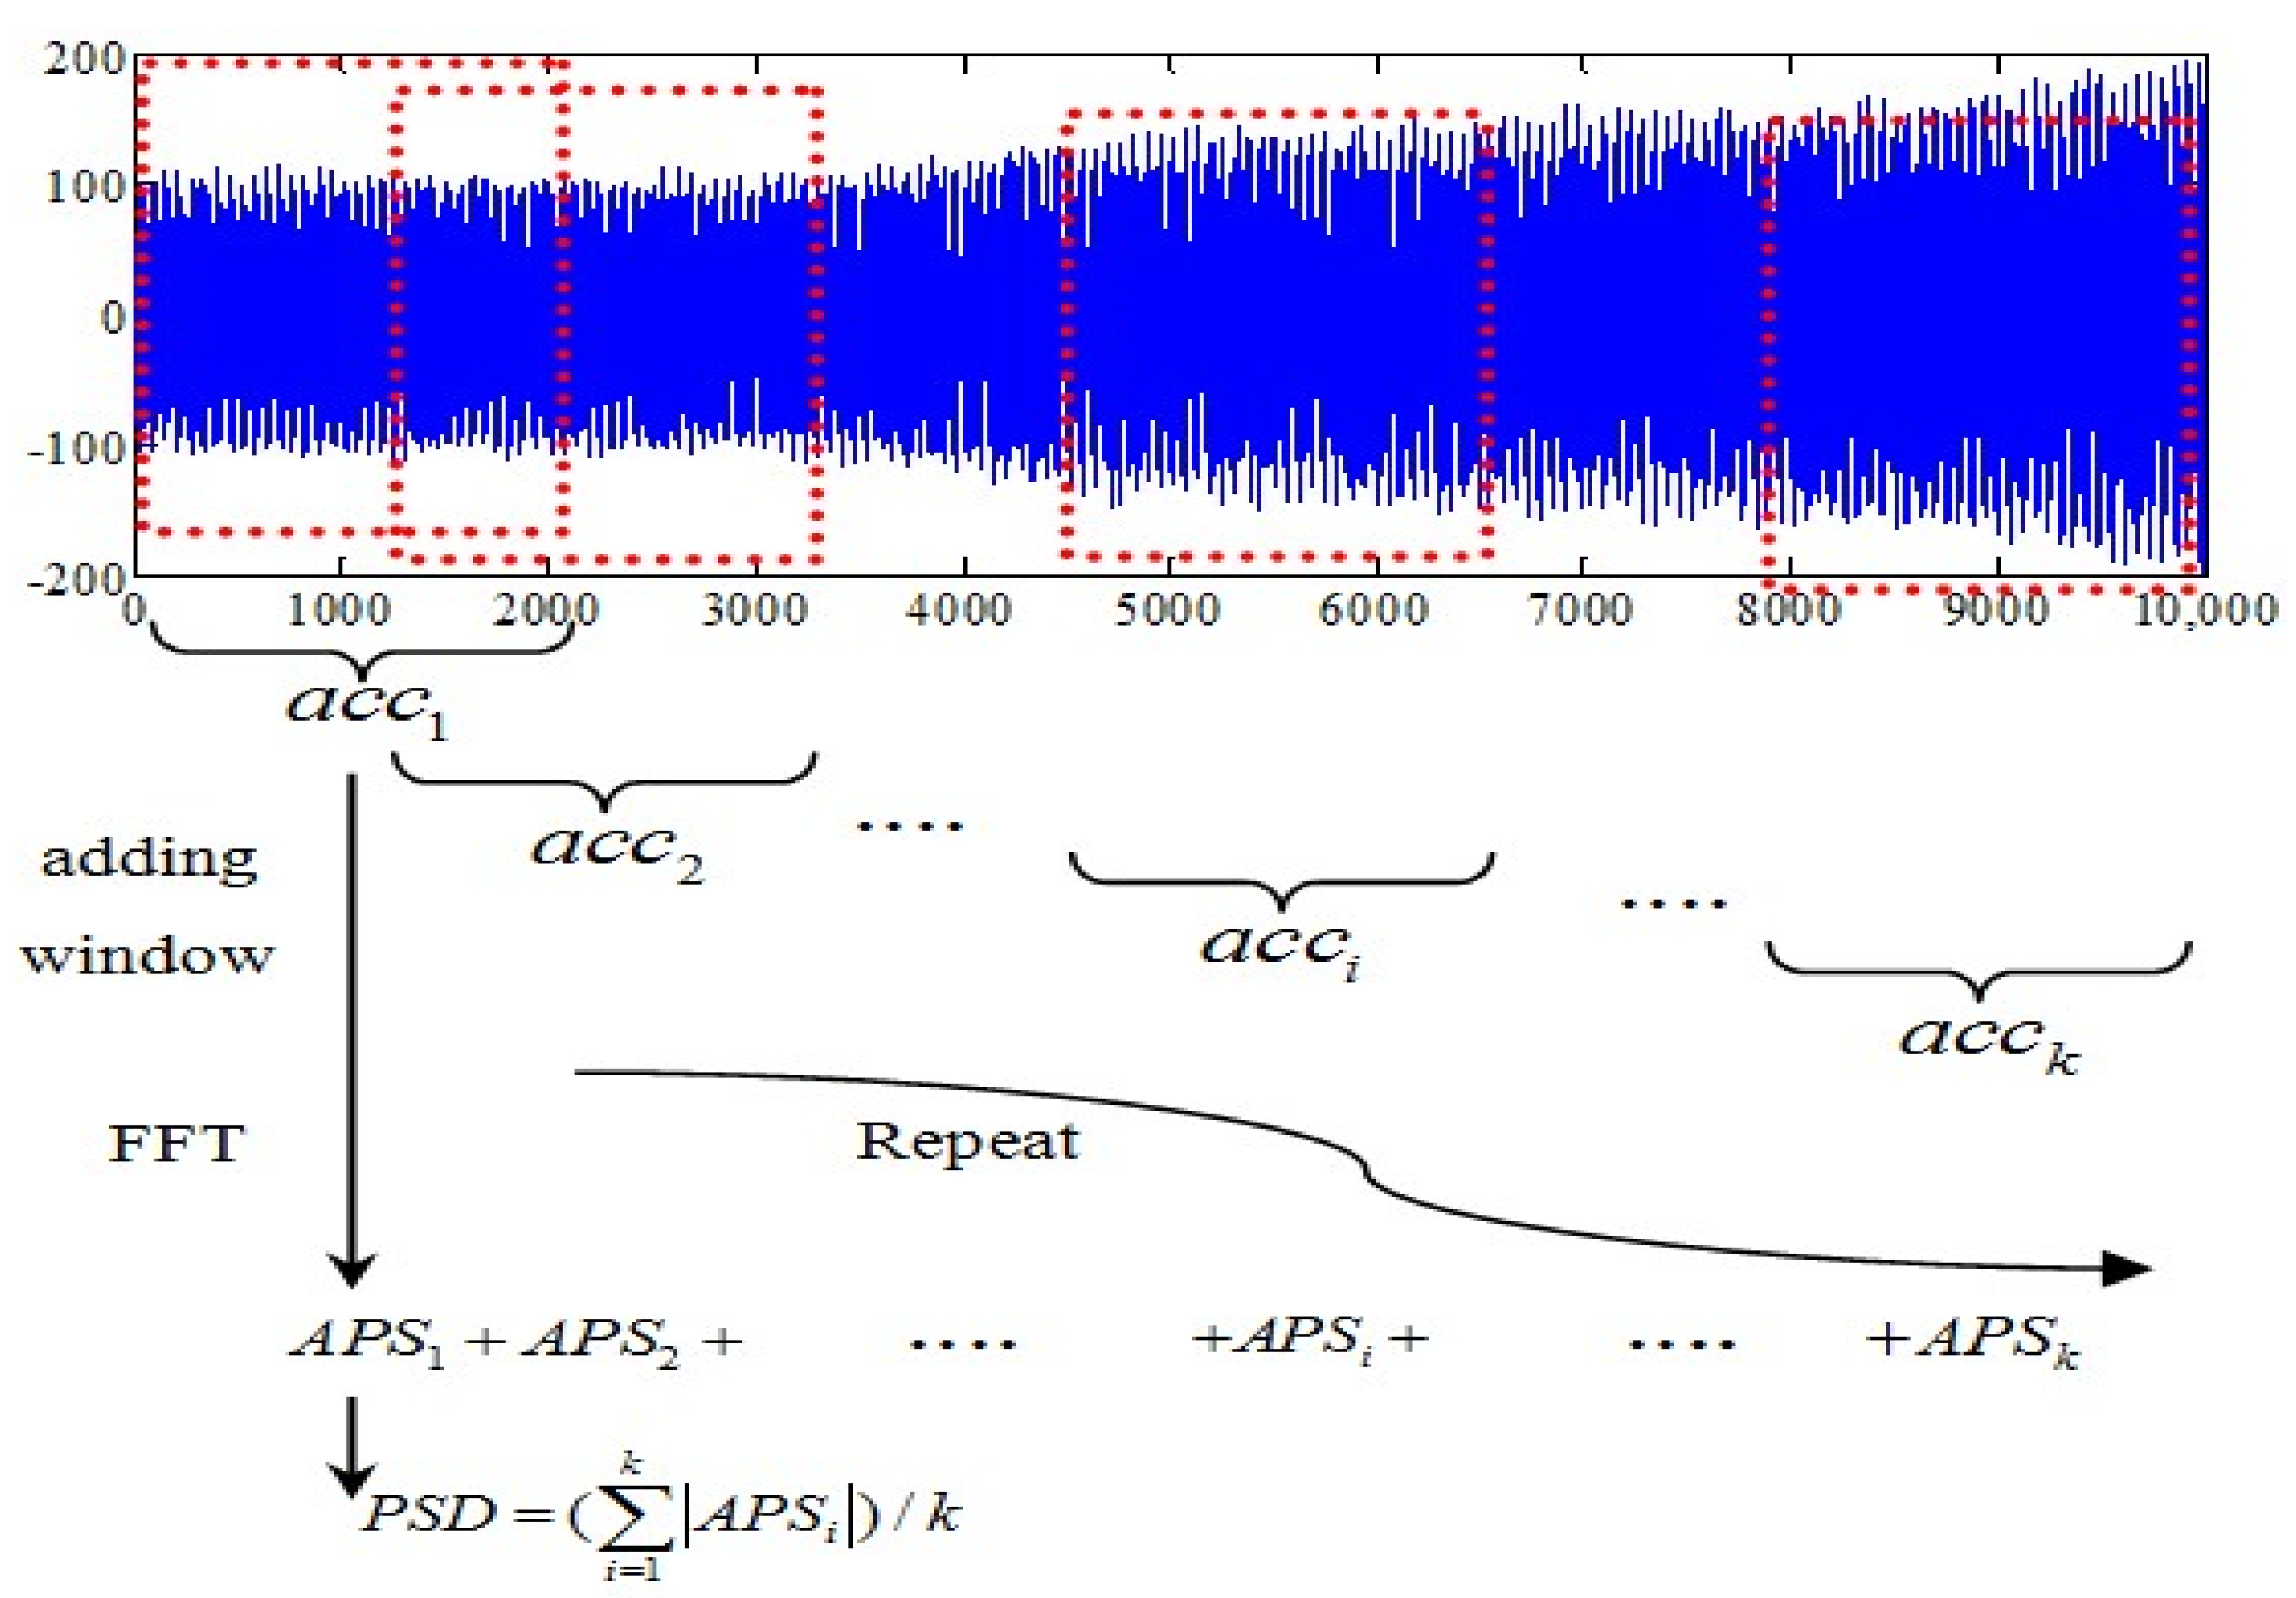
The PSD of cable acceleration vibrations is estimated using the Welch periodogram method, the algorithm was implemented in the Xnode wireless sensor platform and illustrated in
Figure 4.
Firstly, the number of the segment (k) utilized to allocate memory for all acceleration data is automatically calculated based on their overlap and data length. Then the acceleration data are divided into k segments and saved temporarily as acc1, acc2, acck respectively.
Secondly, a fast Fourier transformation (FFT) is conducted on each segmented response with a Hanning window to obtain auto-power spectrum () estimation of the acceleration response. Only half of the complex value results are saved because of symmetry of data so that a long-term history record segment can be processed by using a modest amount of memory.
Subsequently, the averaged power spectral density can be obtained by dividing absolute value of summary of by , with the results saved locally for the next process of the peak-picking algorithm.
Finally, the memory of whole time domain segments is released to save memory.
4.2. Automatic and Robust Peak-Picking Method
Basically, the power spectrum of vibration data contains many peak responses which correspond to a cable’s natural frequencies, so that a simple peak-picking method with threshold value is used to extract the frequencies [
25].
- (1)
Updating threshold value automatically for weak vibration.
The threshold value (
) is initially set to be the sum of
for peak picking with 95% confidence [
25]. However, in practice, even though the power spectrum is clearly separate and cognizable, it is difficult to capture enough peaks with the initial
all the time, especially for some weak vibration, (e.g., 70% of the data from Jindo Bridge are in this situation).
In this case, the threshold value will be reduced automatically during the searching process until enough peaks are obtained or until the threshold value reaches the lower limit
. If there are still not enough peaks, the cable tension task will be returned as zero.
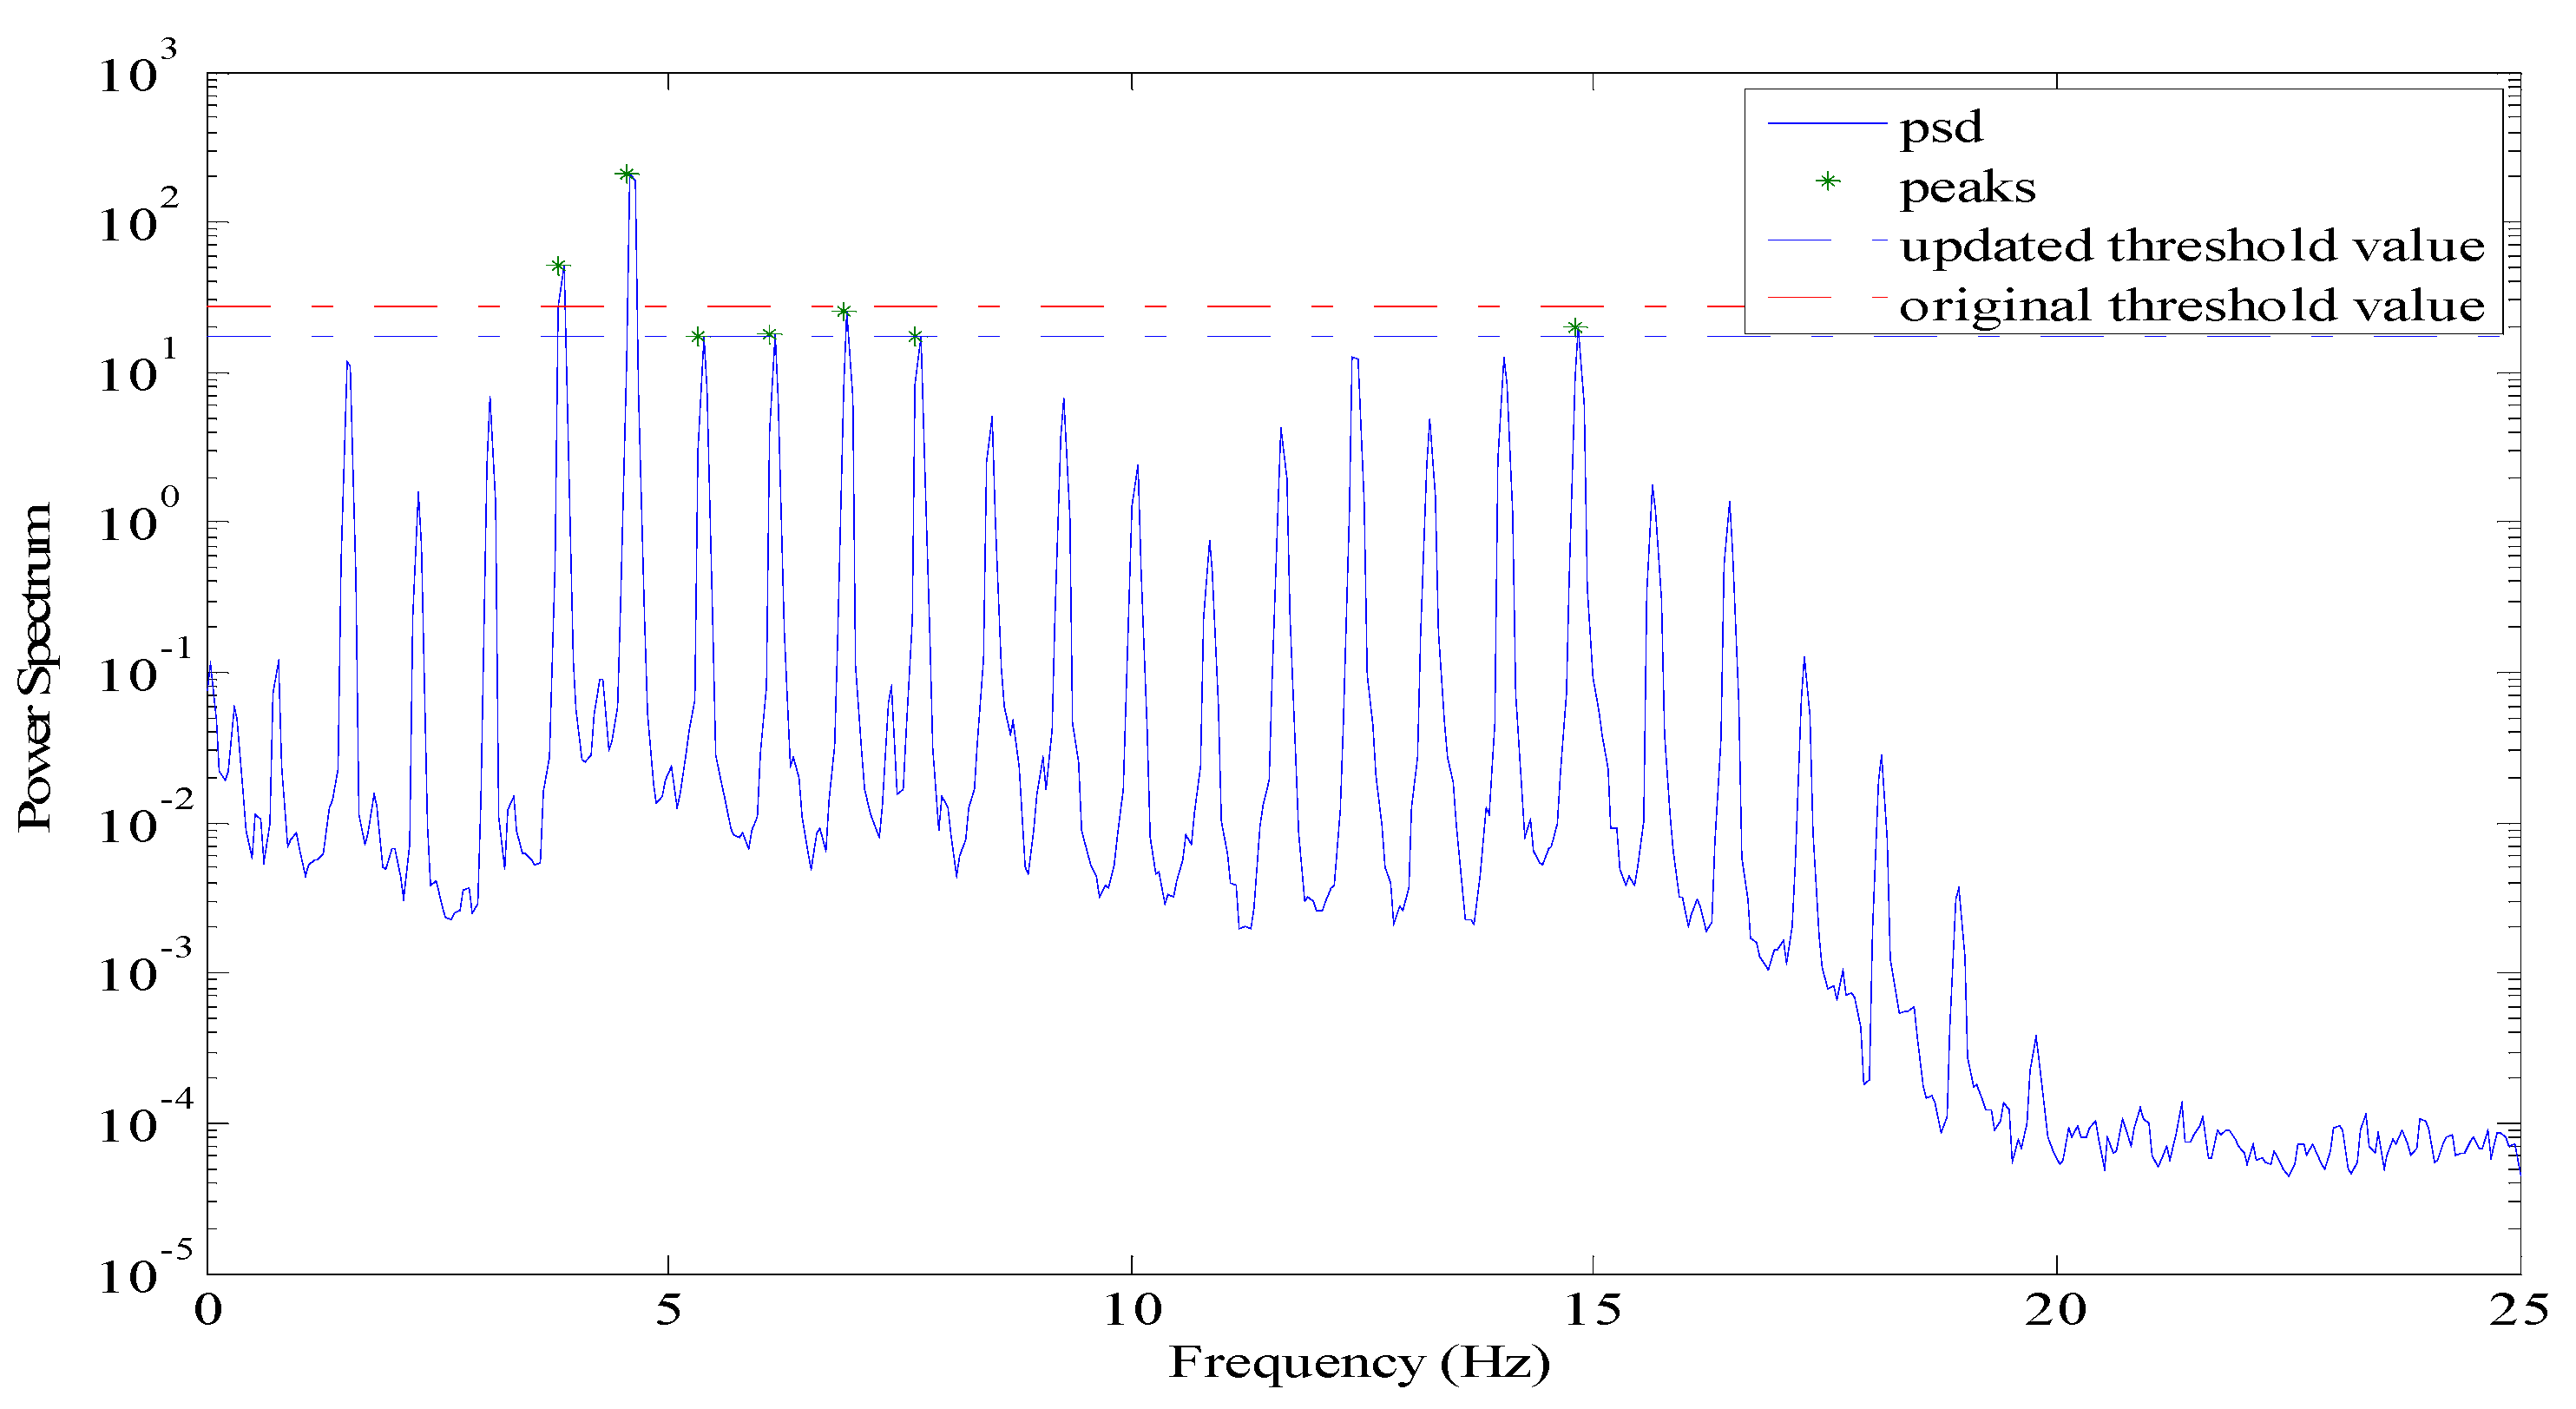
Figure 5 shows the procedure of picking peaks by adjusting threshold value. The number of identified peaks was increased from two to seven by updating the threshold value and, thus, the estimated cable tension became much more reliable.
- (2)
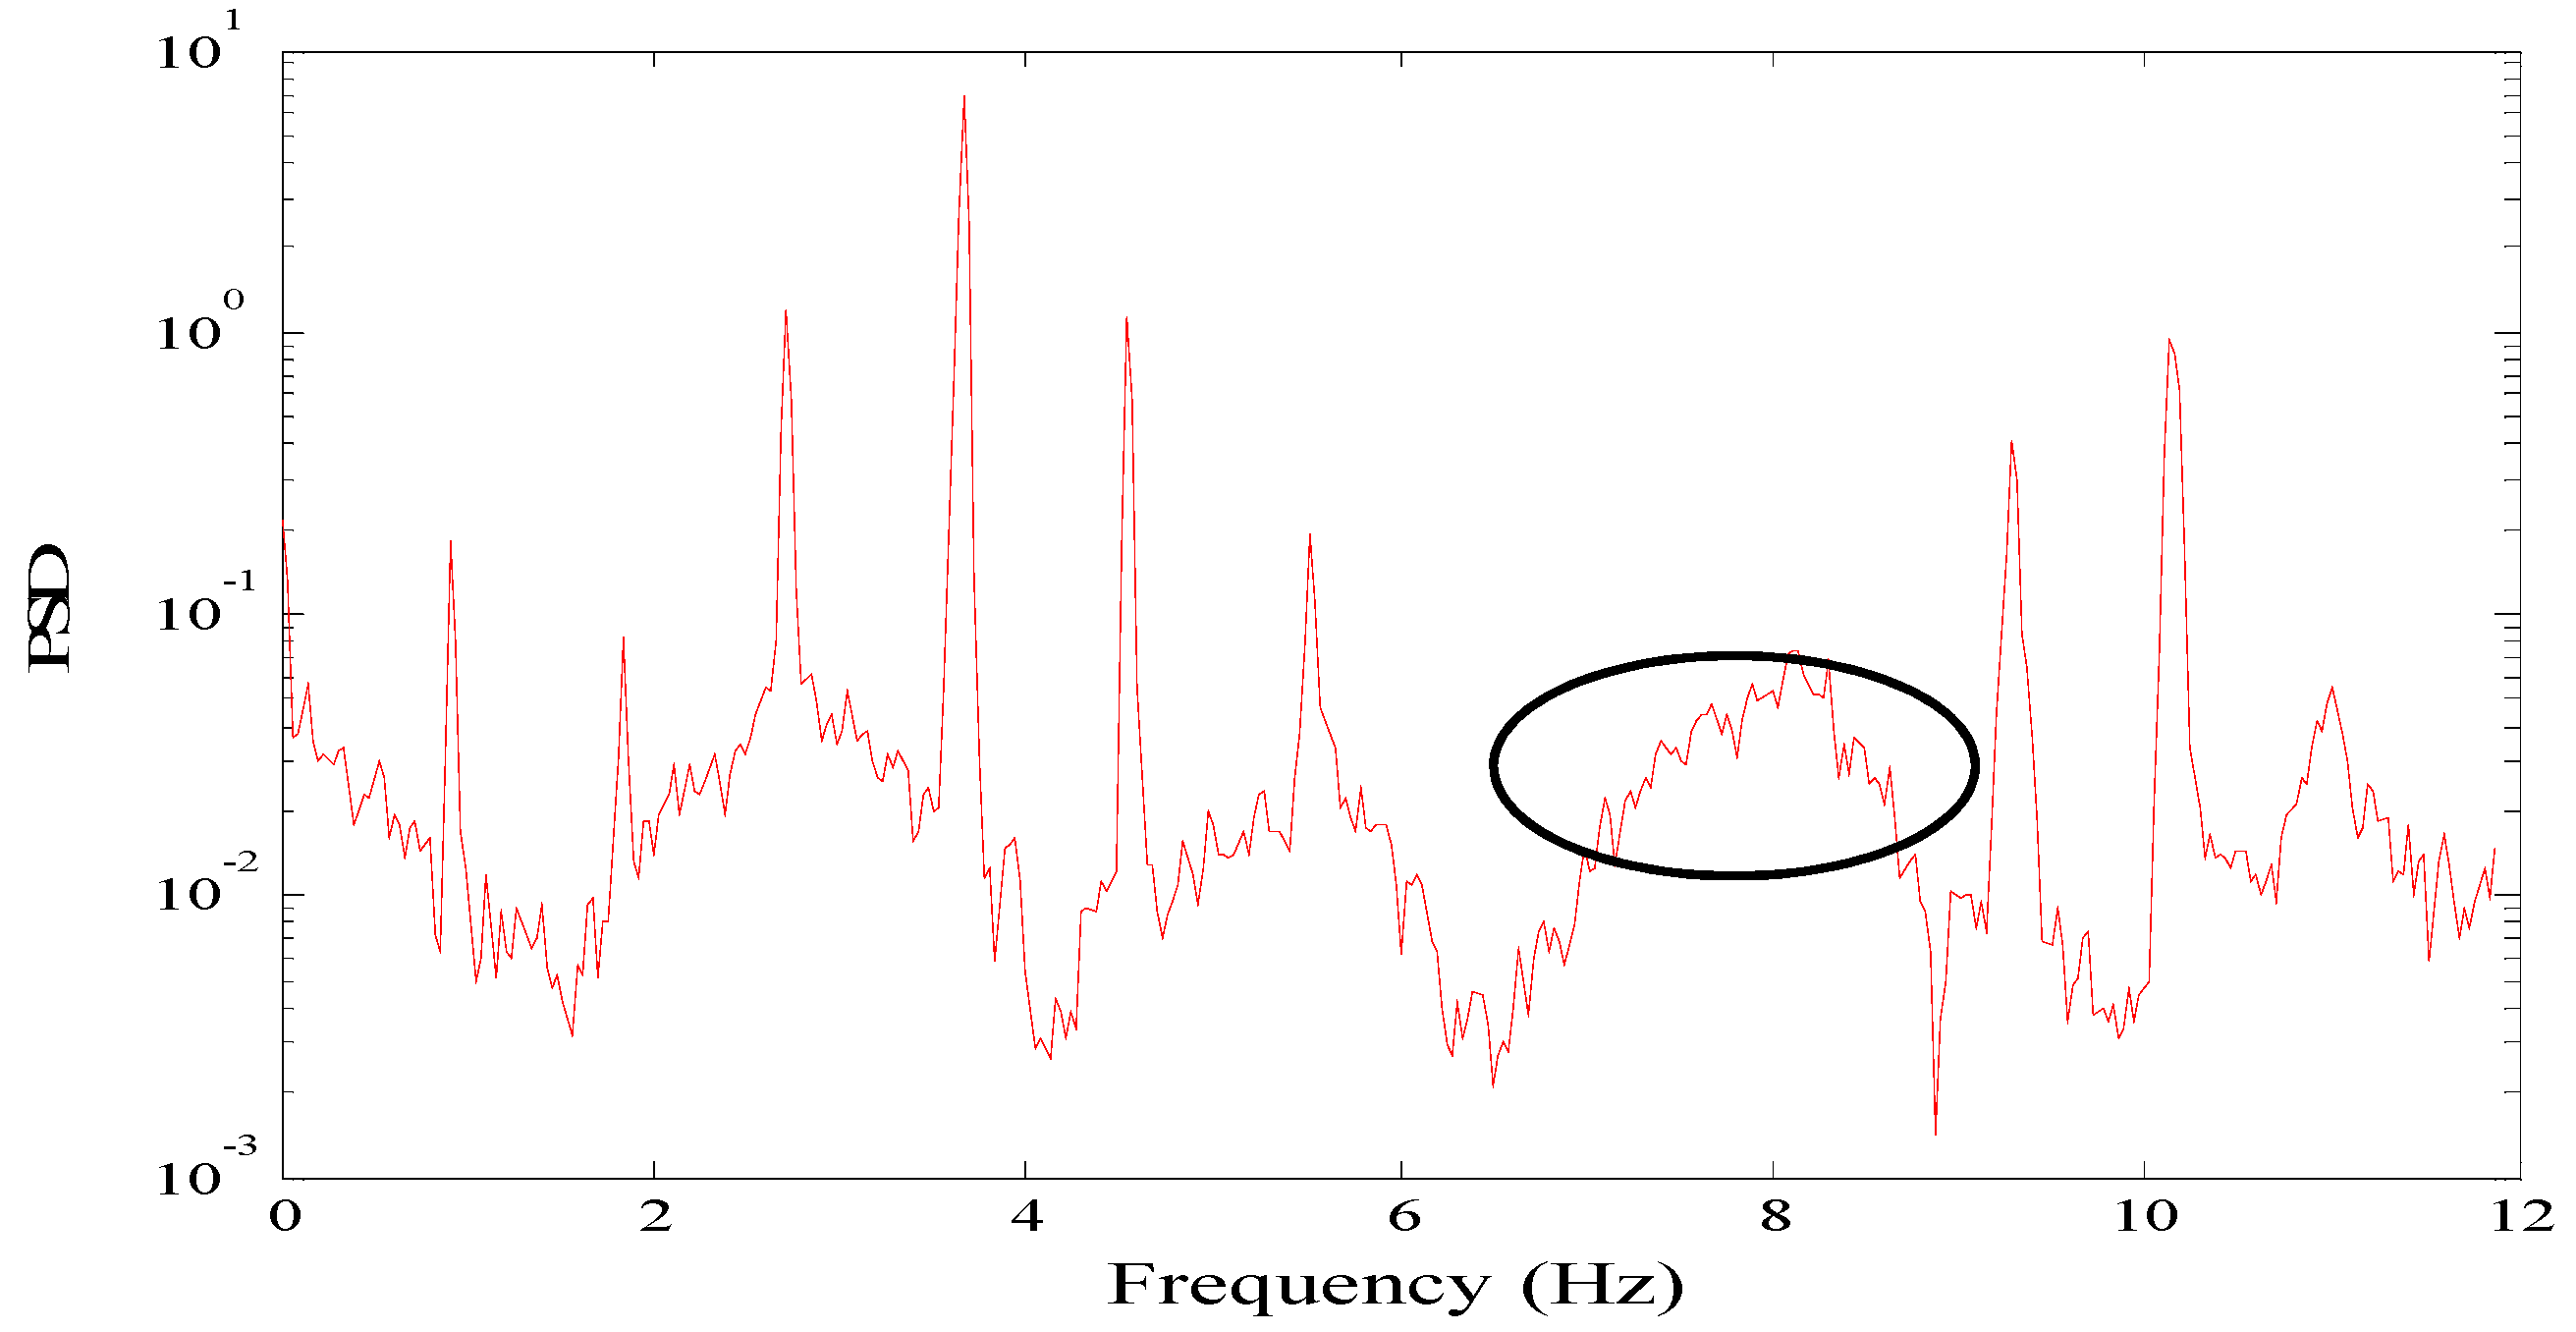
Exclude the false frequencies.
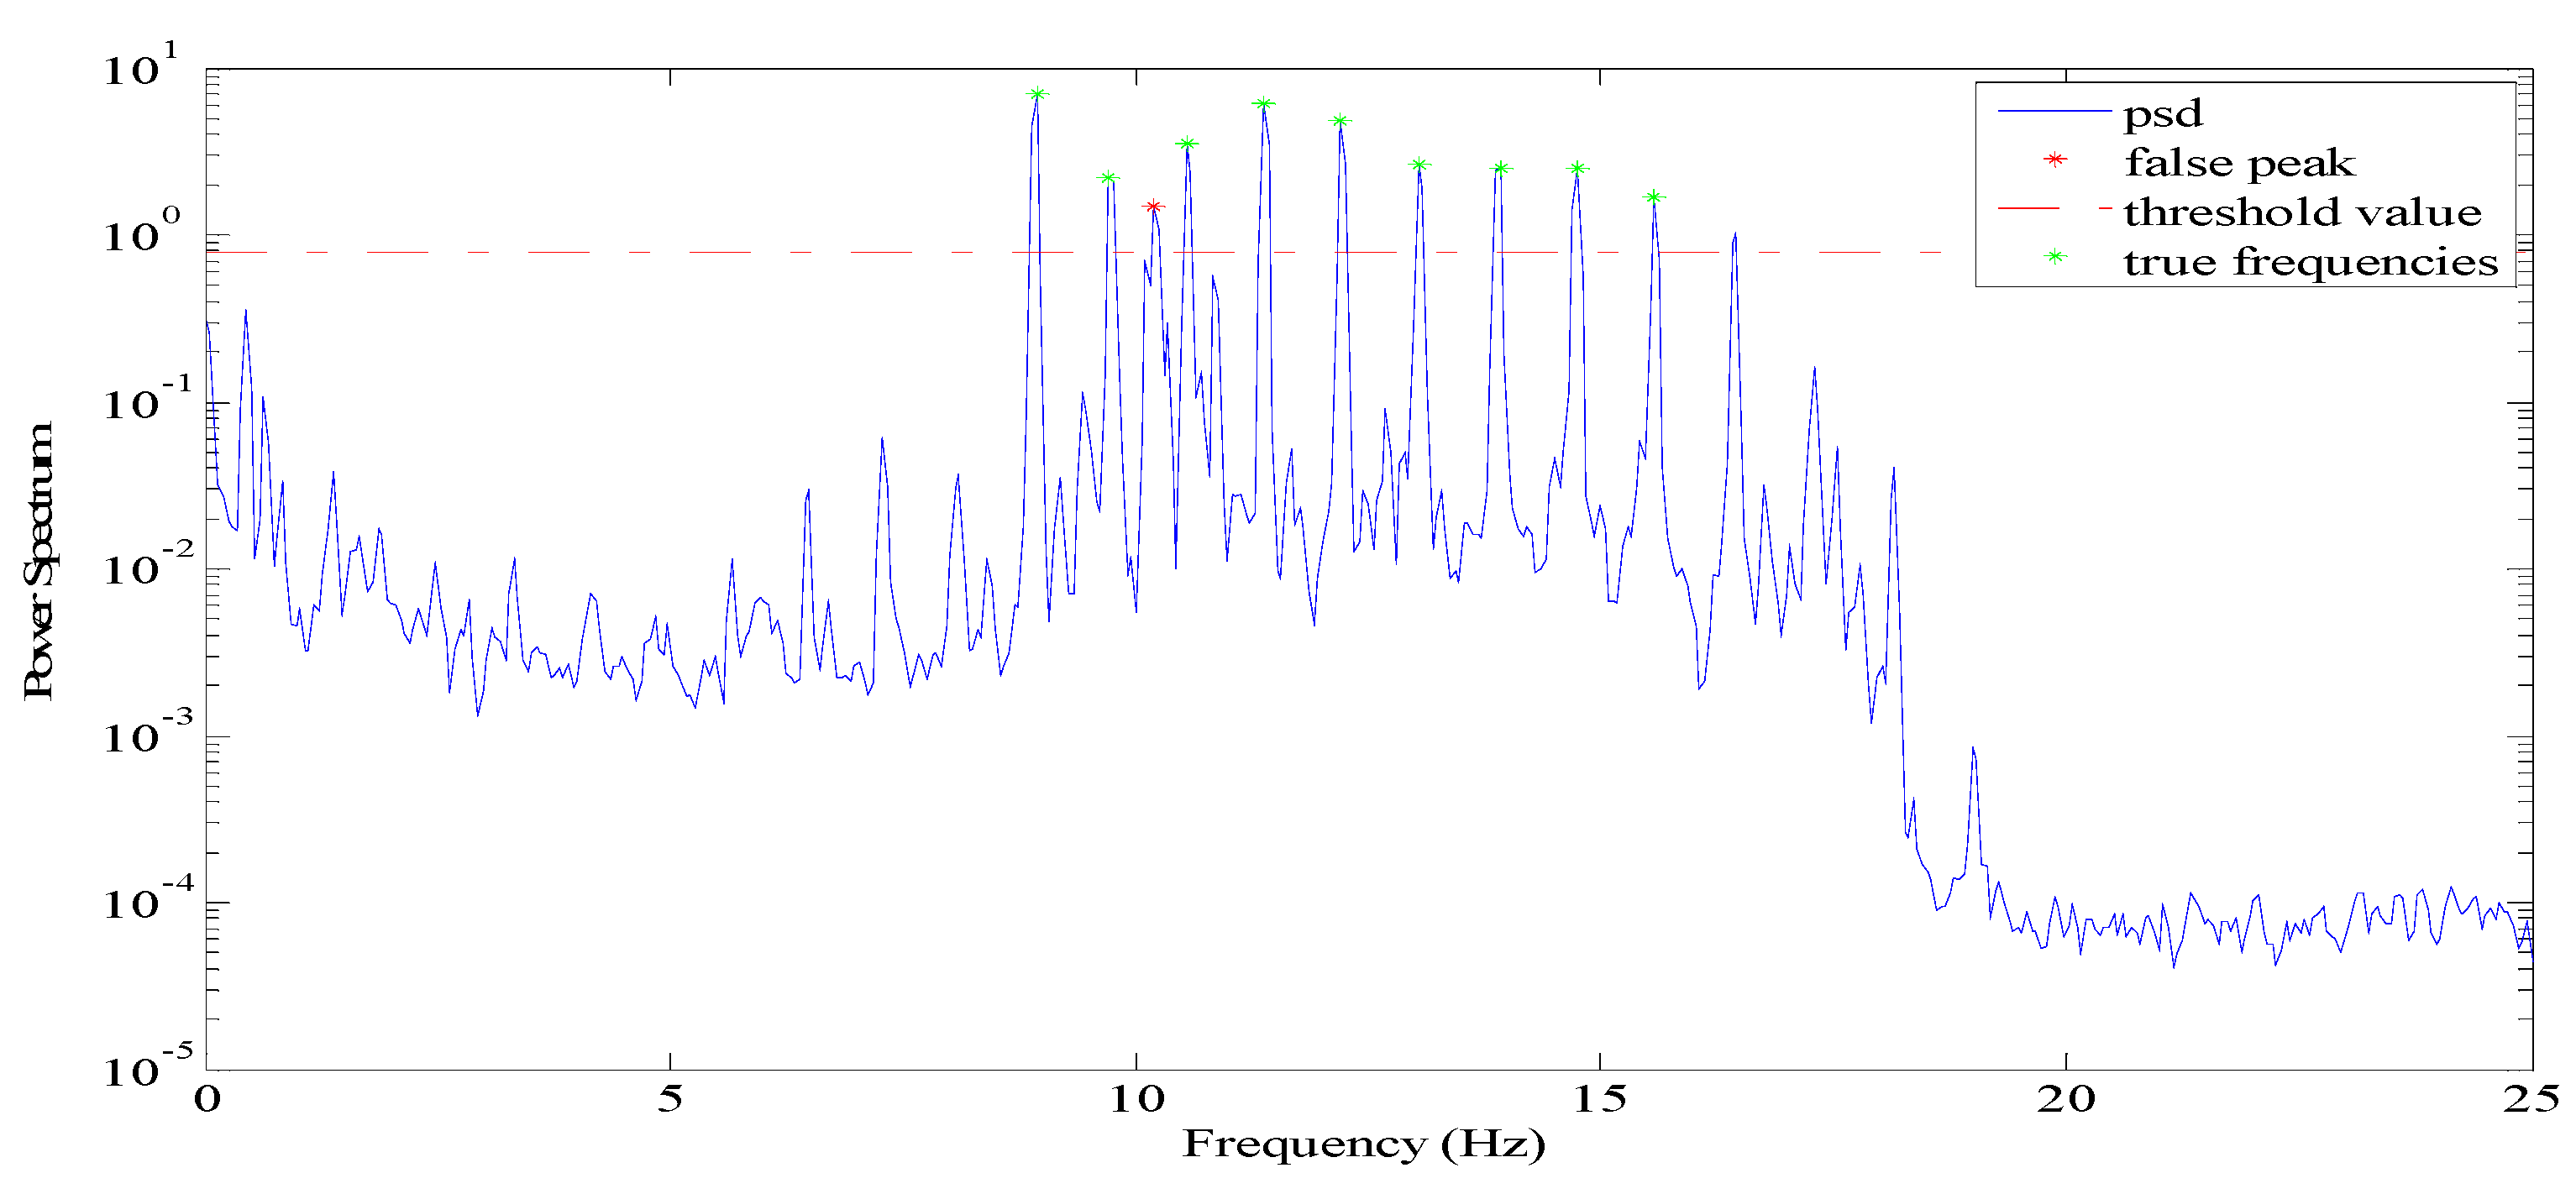
Figure 6 shows the power spectral density of one cable in Jindo Bridge. It exhibits several peaks above 8 Hz including the third peak marked by a red spot, which is a false frequency. Therefore, in practical vibration testing, it is quite possible to get undesirable peaks that are bigger than the threshold value. Meanwhile, for some useless vibration data, there may still be many peaks by using initial threshold value, such as in the example shown in
Figure 1b.
In WSN system, the true mode frequencies should be distinguished automatically for cable tension estimation. The detailed procedure is described as follows, with a flow chart in
Figure 7.
During the implementation of the peak-picking process, the position number (order in frequency region) of each qualified peak is temporarily saved as . In principle, the difference value () between any two adjacent mode frequencies should be almost the same, which can be adopted to eliminate false frequencies. The most frequent value in array of is at first acquired automatically.
For the non-vibration data that still has many disordered peaks (in
Figure 1b), the differences values (
) are generally randomly distributed, therefore the number of
which approximates to
(in this paper
) would be less than half, through which the data could be determined as invalid data. Hence, the found peak is set as empty and cable tension returned as zero, CTE application is finished temporarily.
Any two adjacent
and
would be interpreted as true frequencies as long as the quotient of
and
are much close to an integer. The
(
in the paper) are two threshold values to judge this quotient. In this way, the third data with the high value in
Figure 6 is consequently eliminated. The other corresponding frequency will be saved locally as a true mode.
4.3. Identify the Frequency Order
According to the simple string theory, the cable tension is highly related with the linear regression results of
and
. Therefore, the order of all obtained frequencies should be determined correctly. Generally, the continuous true mode frequencies are separated equidistantly in power spectrum density, the frequencies order can be determined through Equation (4).
where
is the frequency resolution,
is the function to take the nearest integer value.
With these model frequencies and their physical parameters of the cable, the CTE application can be implemented successfully on an independent sensor node after getting the linear regression results of and .
5. CTE Implementation in the Xnode Wireless Sensor Platform
5.1. Xnode Wireless Sensor Platform
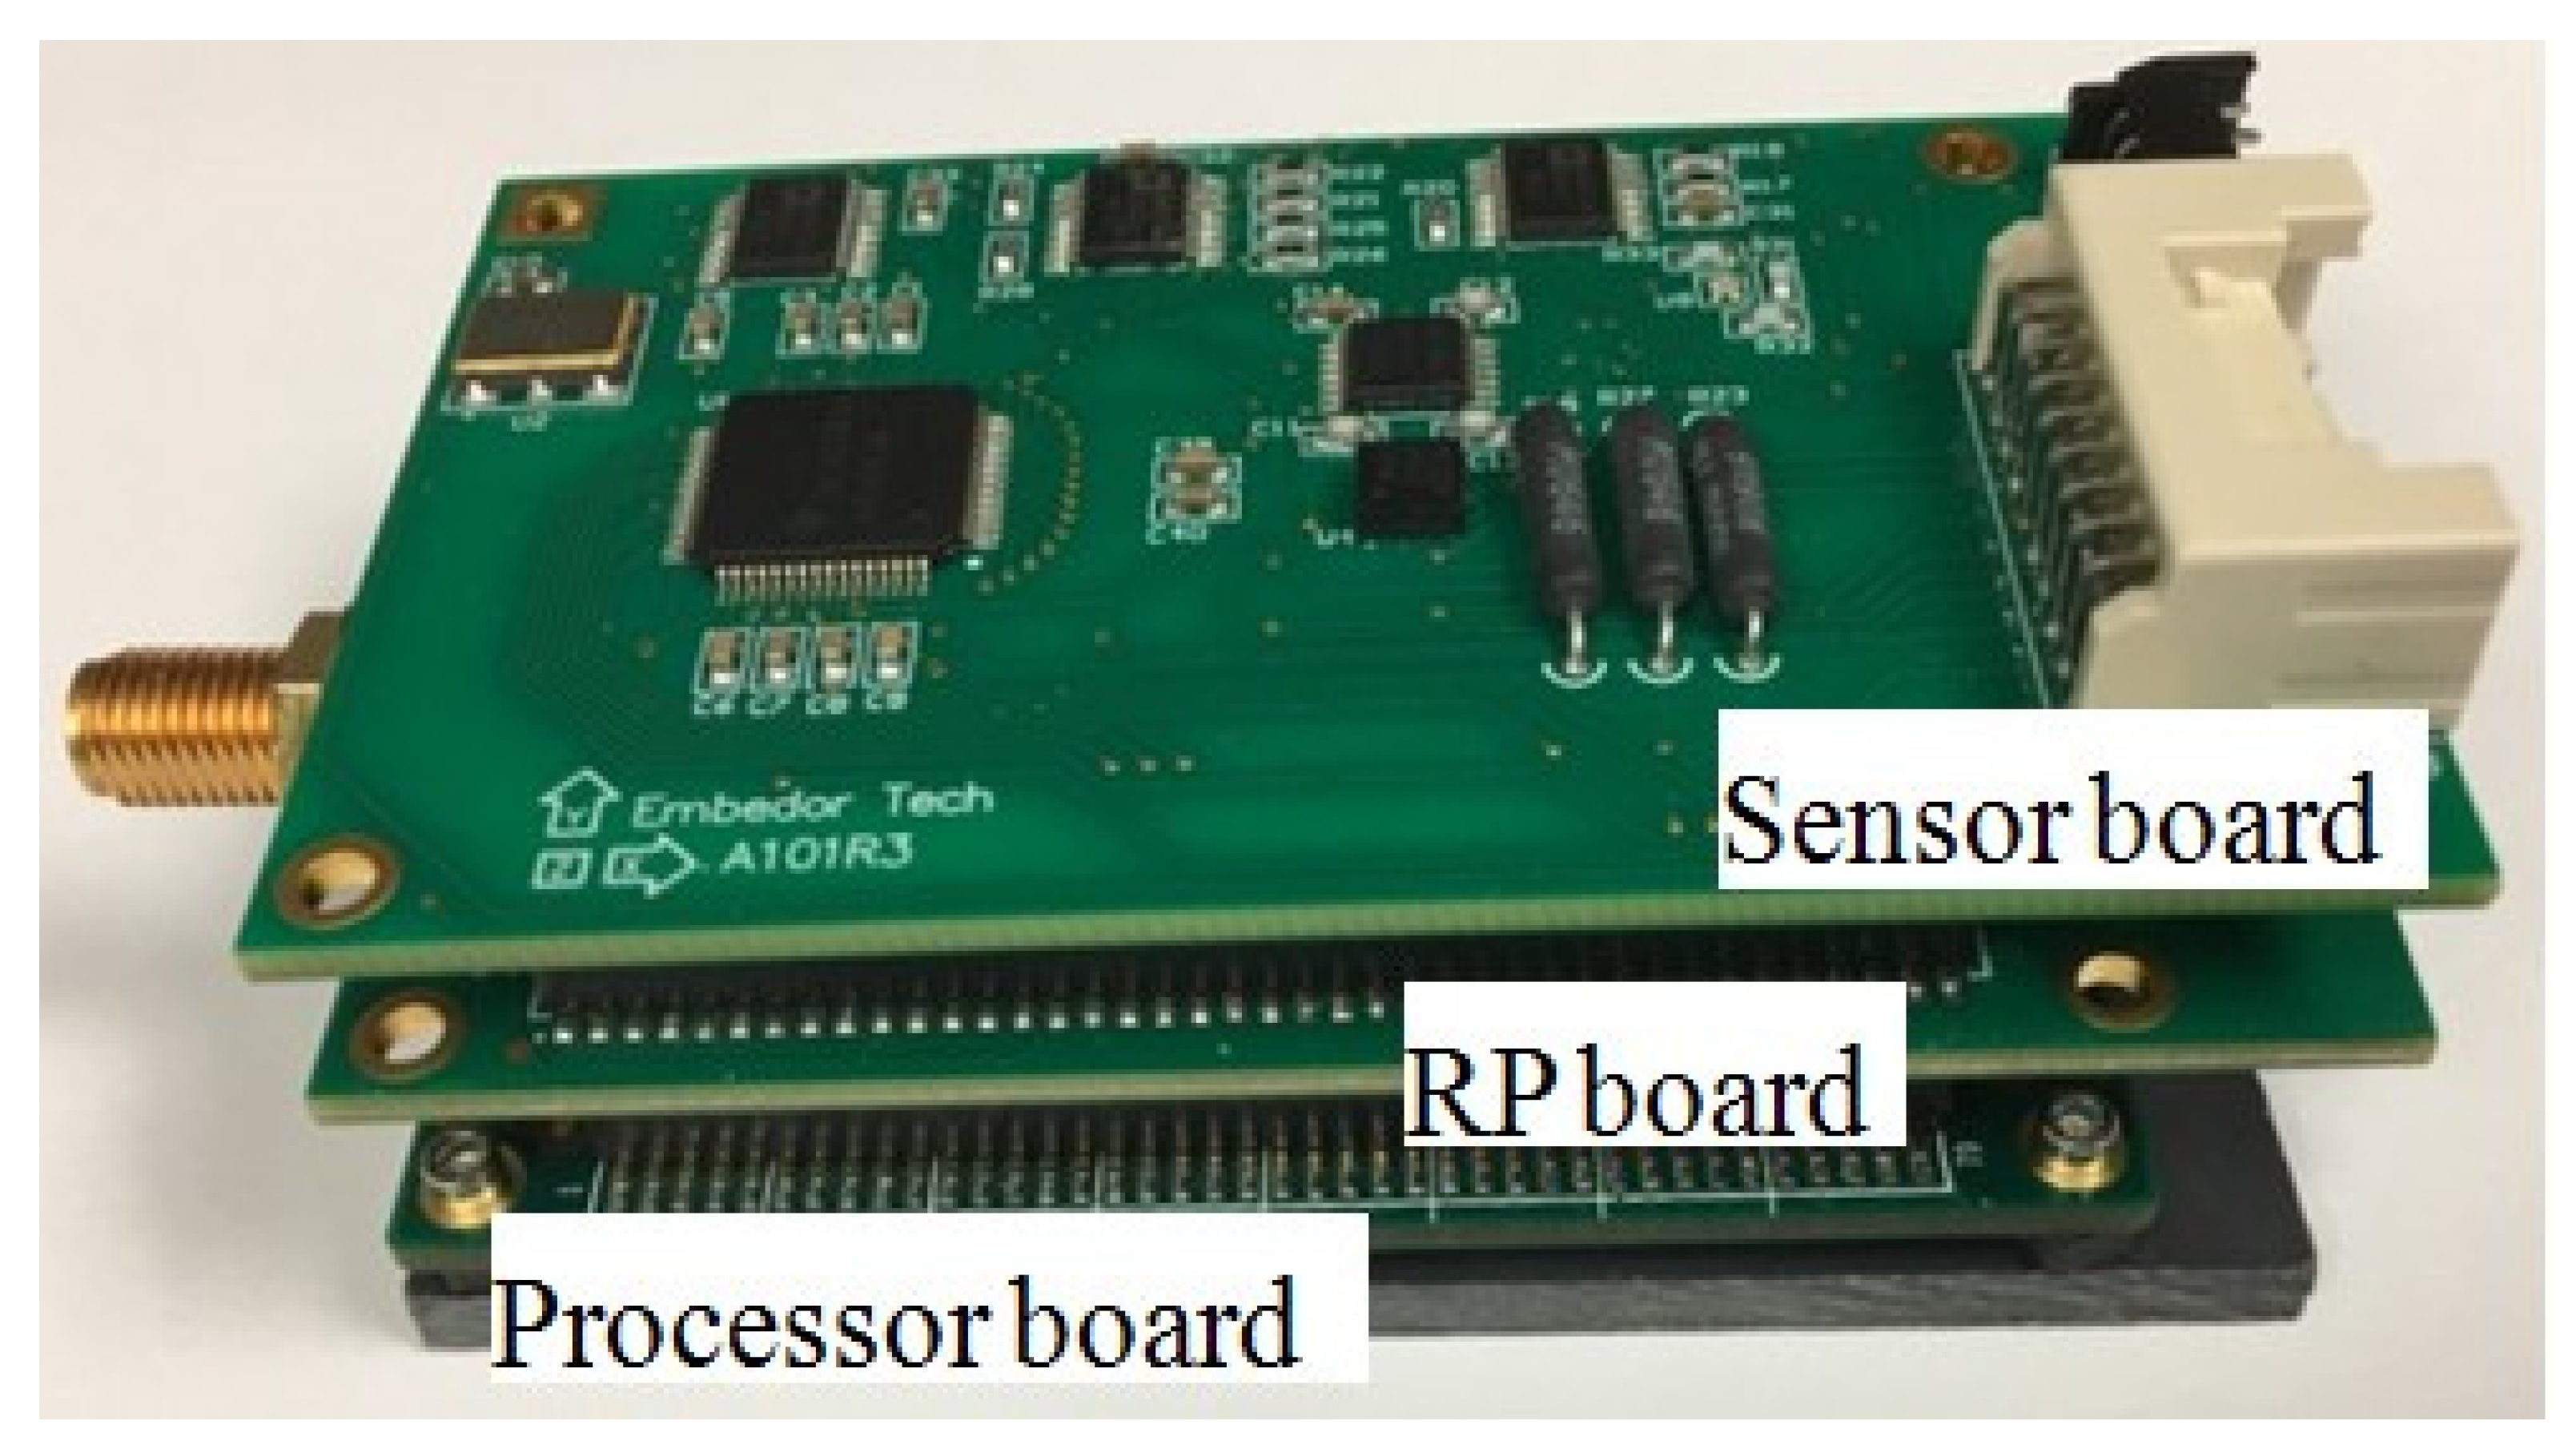
The fully automated cable tension estimation algorithm is implemented on a high fidelity smart sensor platform named Xnode as shown in
Figure 8, which was developed by Smart Structures and Technology Laboratory at the University of Illinois at Urbana-Champaign [
30,
31].
A wireless sensor has the advantages of wireless communication, autonomous computation, and of being locally powered with a low cost. Meanwhile, compared with other wireless sensor platforms, Xnode has a higher ADC resolution (24 bits) and a higher sampling rate (16 kHz) which can provide high fidelity measurements for the monitoring research of engineering structures.
The strategy of wireless cable tension monitoring based on Xnode is shown in
Figure 8. The entire system consists of one gateway node and several leaf nodes, which communicate with each other via remote command middleware services. The gateway connected to a PC through a USB cable is responsible for managing all leaf nodes by sending task commands and receiving information from leaf nodes. The leaf nodes are mounted on cables to measure their vibration data and process them locally based on applications.
For a long-span cable-stayed bridge with a large amount of cables, their own properties should be saved in an SD card on the leaf nodes. Furthermore, the wireless sensor can obtain cable parameters from local SD card automatically by executing the task of reading the relevant configuration file. Meanwhile, only the auto power spectrum is used to capture the natural frequencies of the cable through a peaks-picking method and the cable tension then calculated based on the string theory method. During the process, the leaf nodes do not need to share any information between each other.
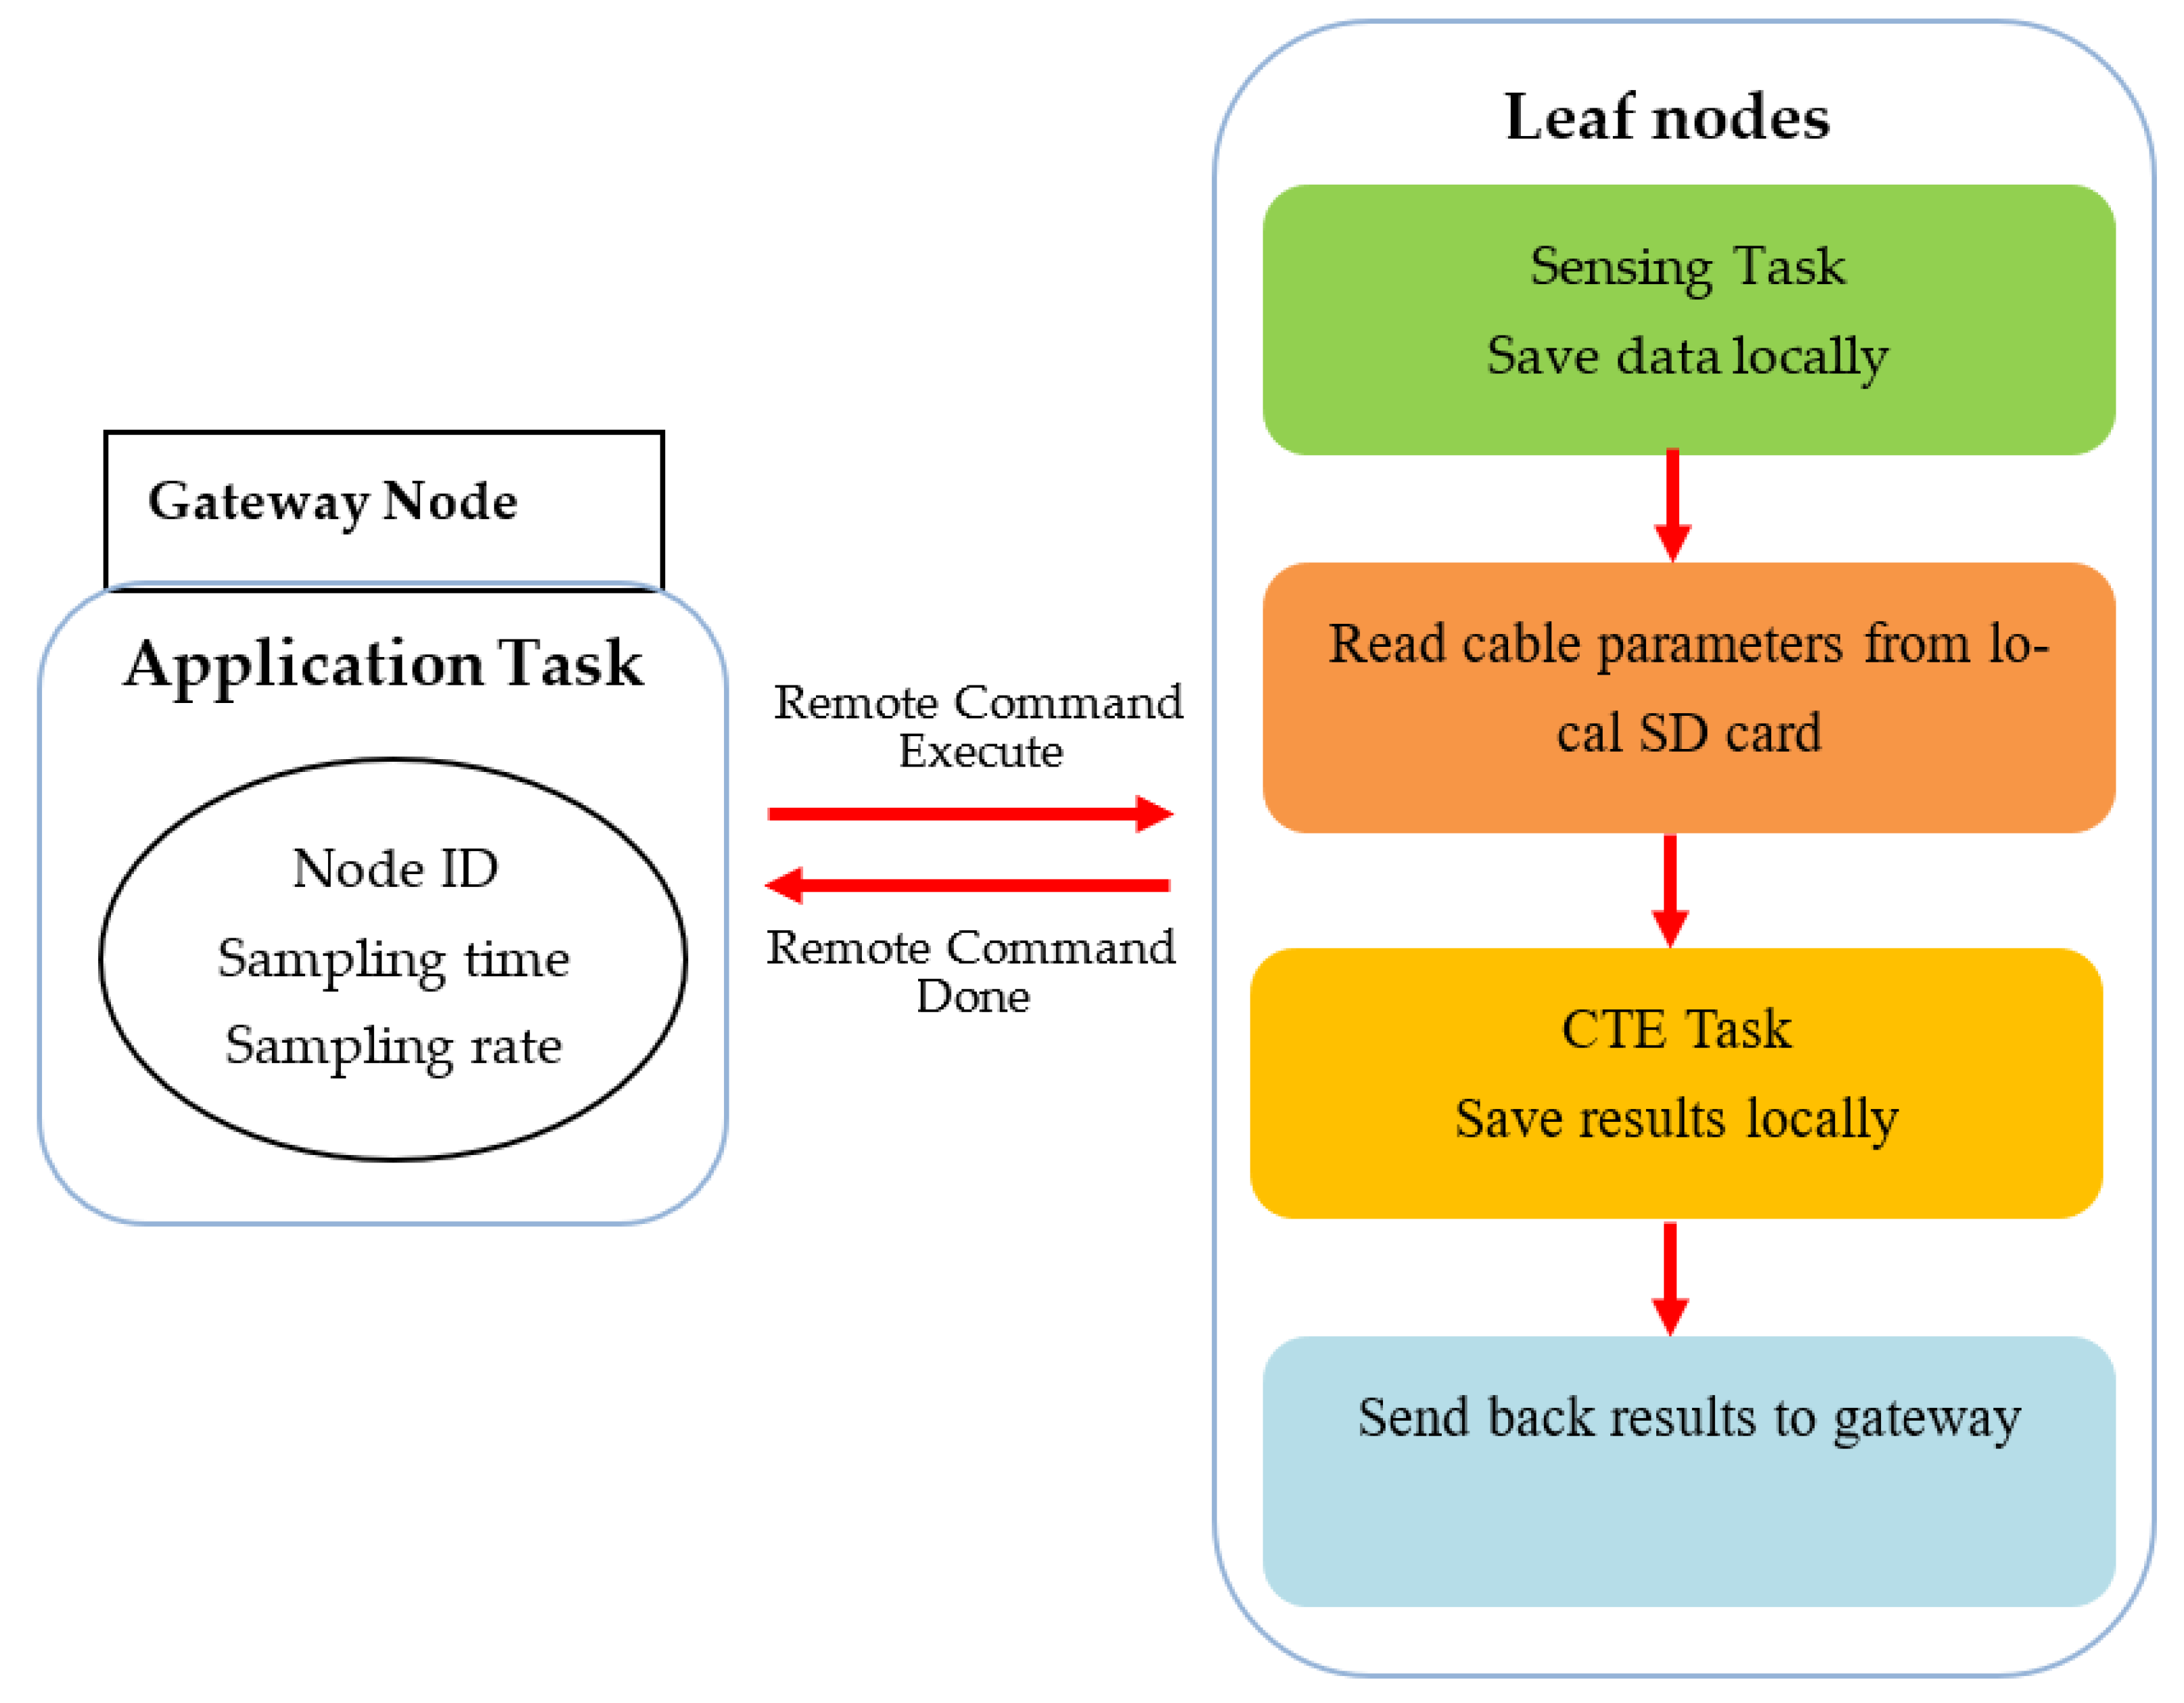
To promote the application of CTE in practice, as shown in
Figure 9, the sensor nodes should sample acceleration data based initially on sampling parameters which are received from the gateway through the remote command. Once the vibration data are acquired, the Xnode processor of leaf nodes will autonomously process acceleration data locally based on the CTE task. Finally, only the required results will be sent back to the gateway node and shown on PC screen terminal.
5.2. Practical Validation
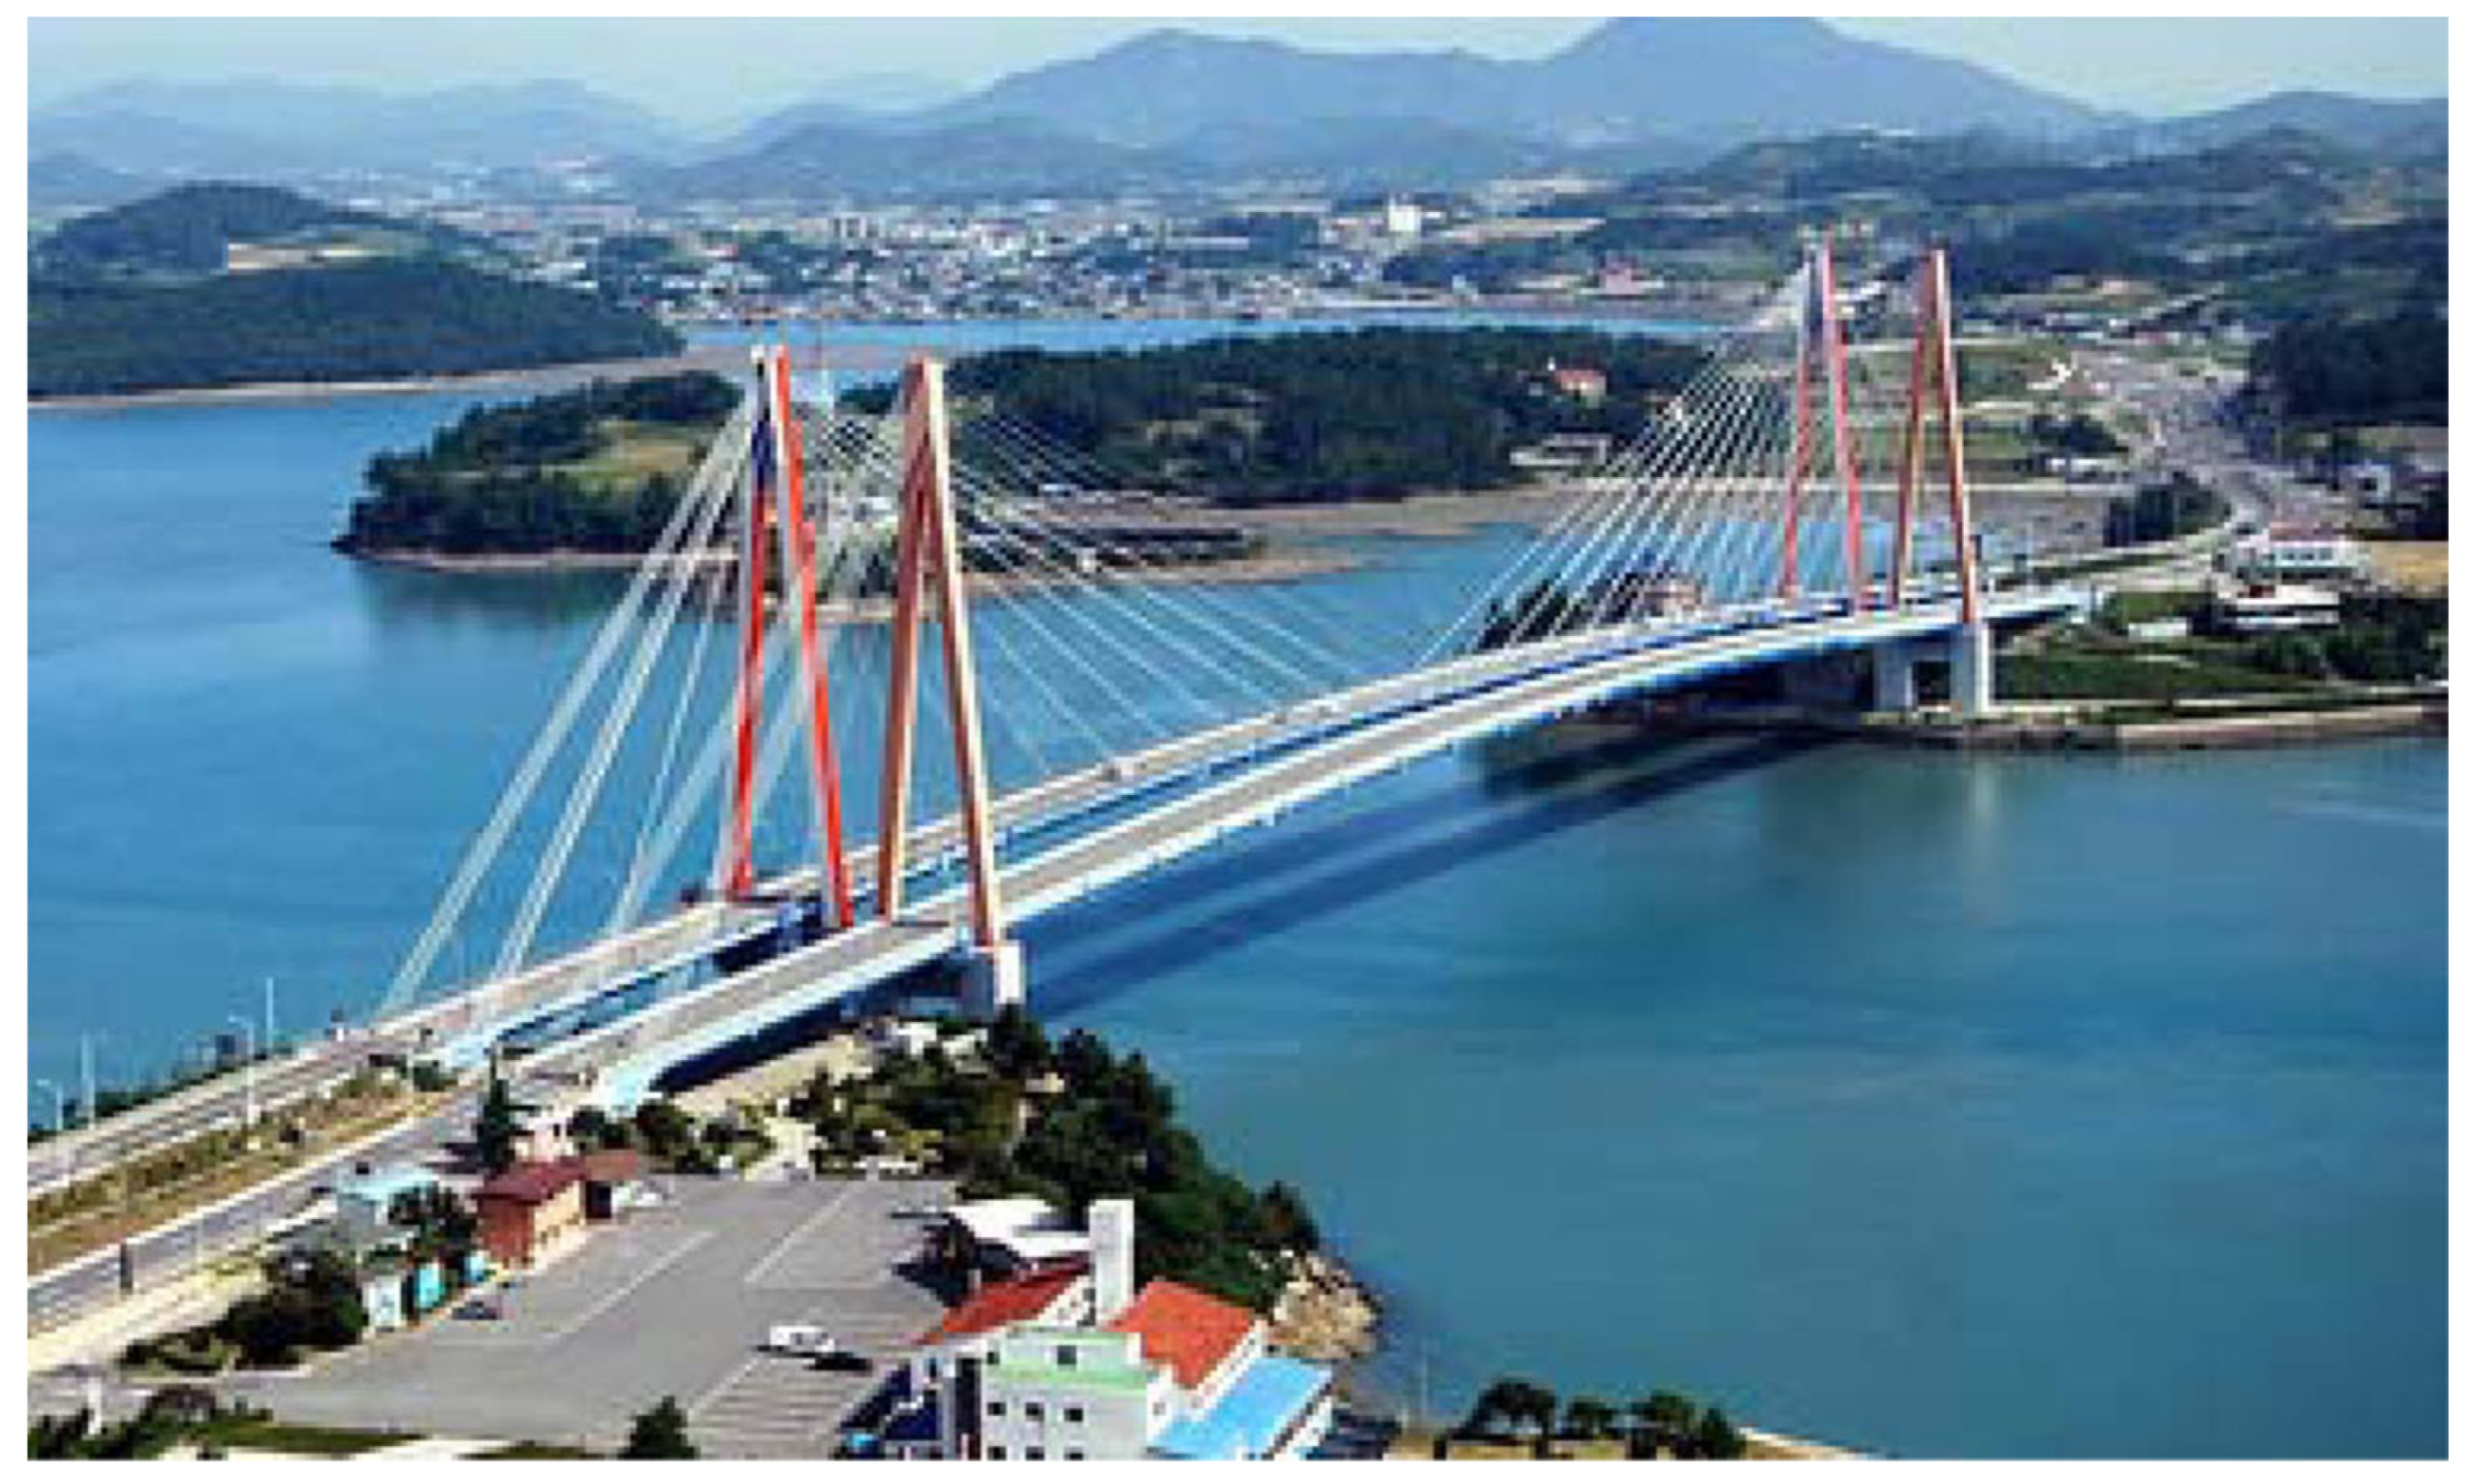
To verify the wireless cable tension estimation algorithm on Xnode, the data of Jindo Bridge (shown in
Figure 10) has been used in this paper. The data of Jindo Bridge were acquired in 2010 in collaboration with the University of Illinois at Urbana-Champaign, KAIST University and the University of Tokyo [
32]. The details of the test can be found in S H Sim et al. [
25].
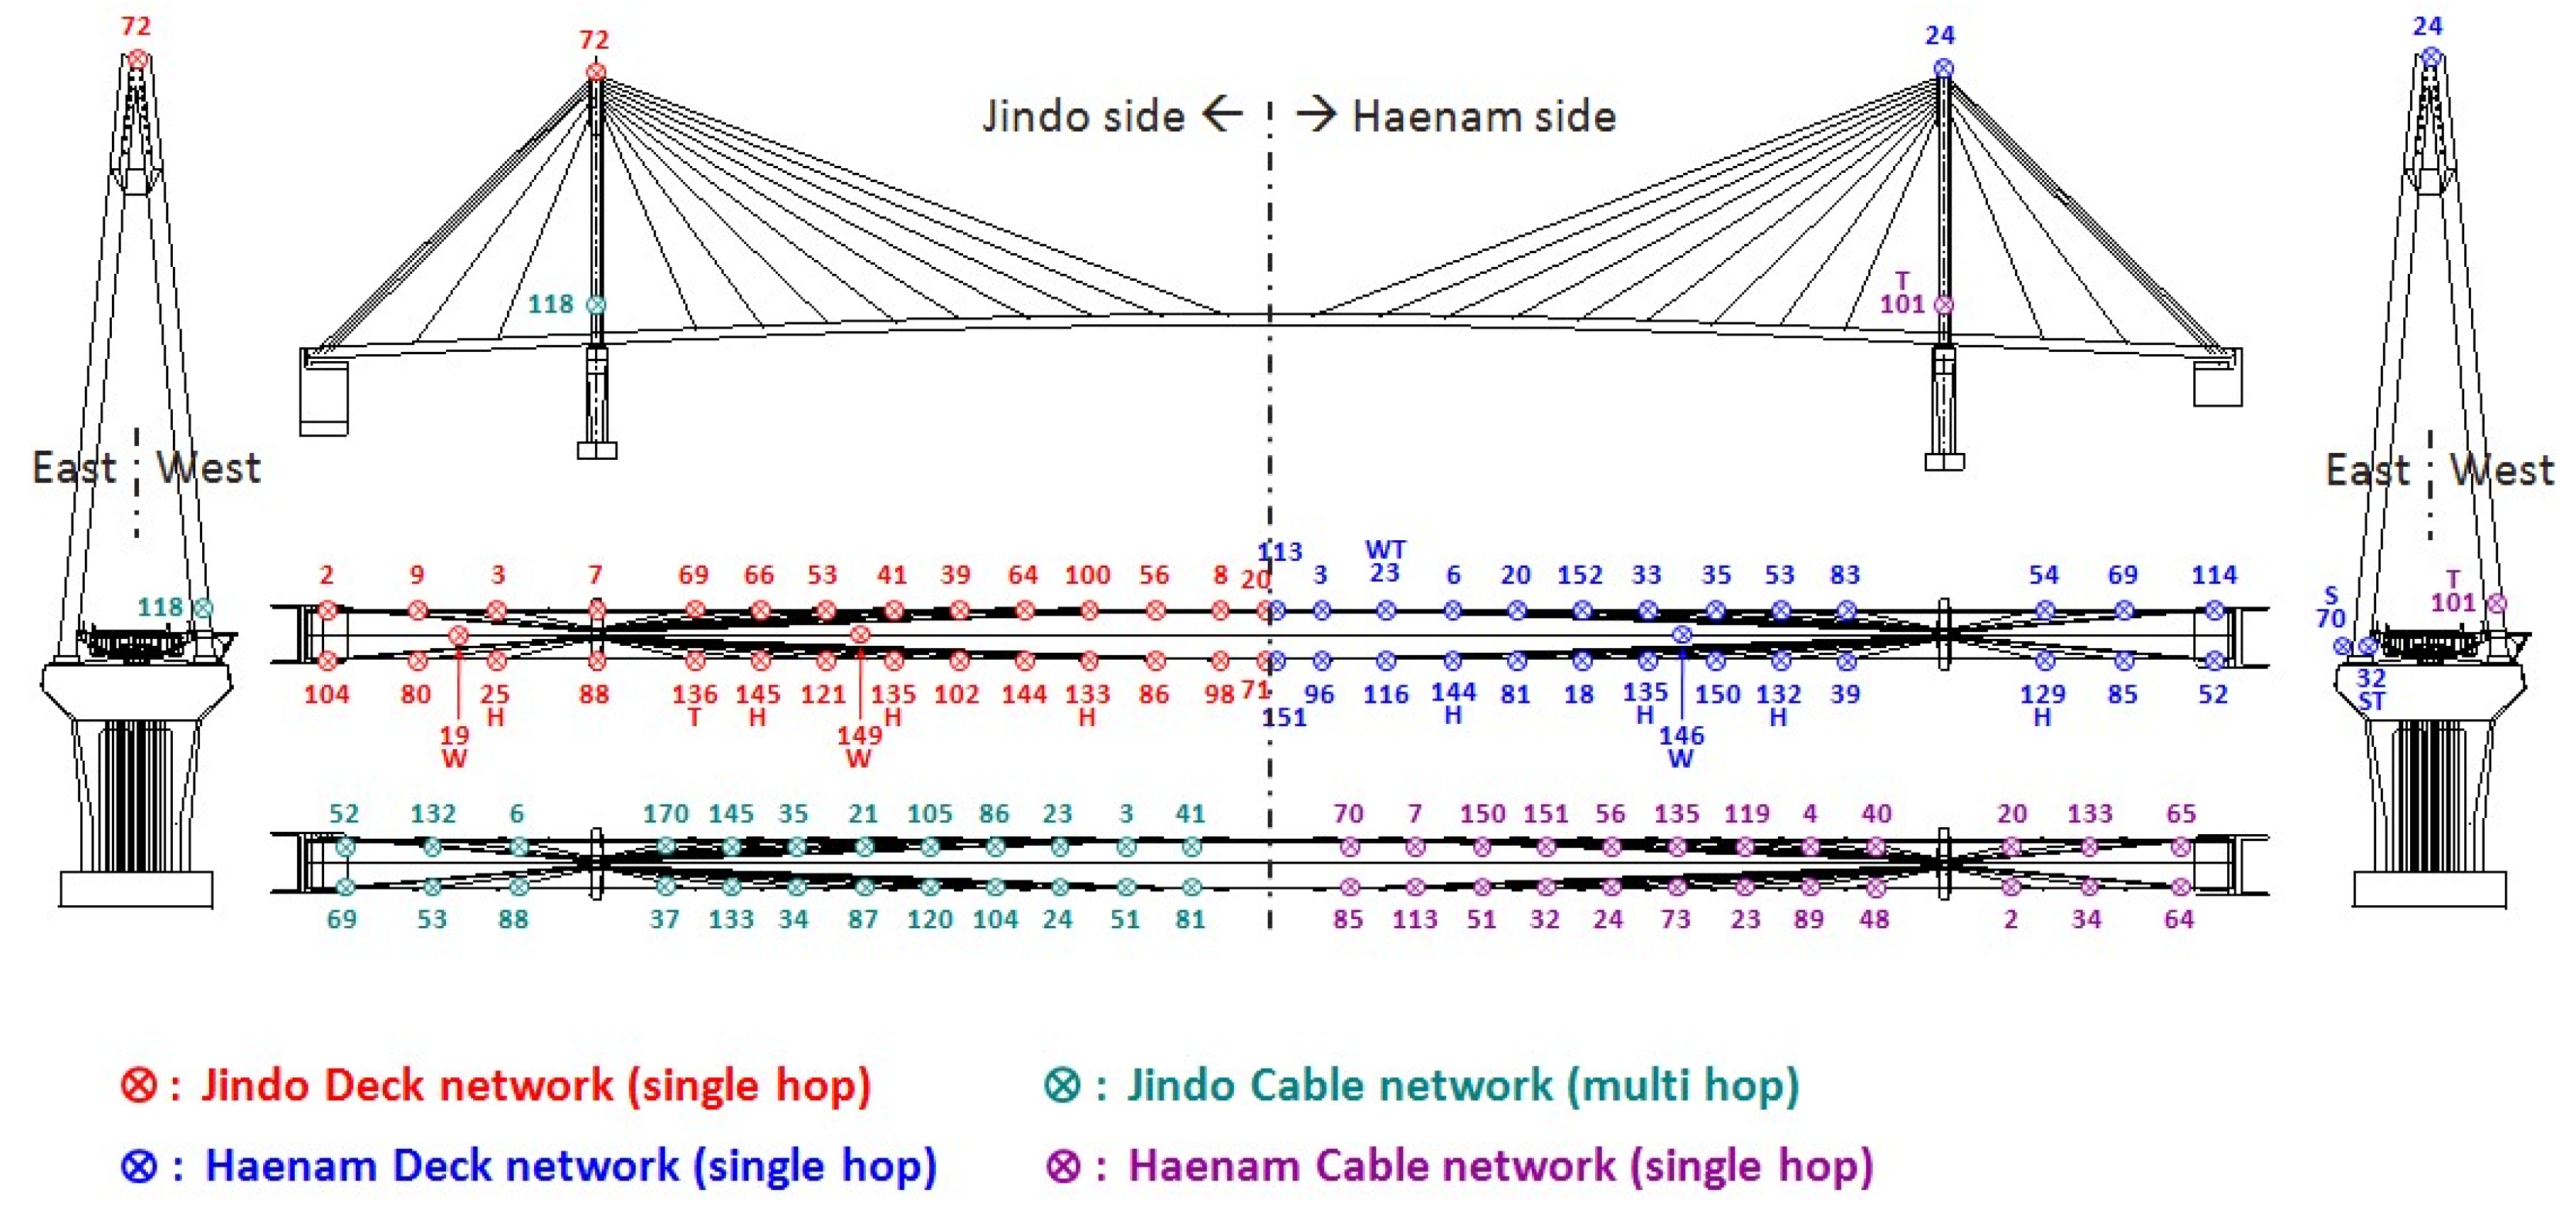
The data from sensor node 64# (see
Figure 11) on the Haenam side were used in Xnode to show the implementation of the cable tension estimation application and demonstrate the effect of cable effective length on the estimation results of cable tension. The sensor node is mounted on cable HC04 which is the shortest one among all monitored cables. The properties of cable HC04 are summarized in
Table 1.
The cable tension estimation application is loaded on Xnode to analyze the acceleration data, which is saved in the SD card in advance according to the method mentioned above. The CTE application results are saved in an SD card and also shown on computer screens through the TeraTerm terminal emulator.
As shown in
Figure 12, the power spectral density calculated by Xnode is matched with the results of the Matlab program. Obviously, there are only two peaks picked by using the initial threshold value, which are not enough to estimate cable force correctly. After updating the threshold value several times, the number of found peaks has then been increased to five, and so the correct results are obtained. Meanwhile, the second found peak (a false frequency) is successfully excluded through the method mentioned above. Note that the effective length used to estimate cable tension force is set to be equal to 95.38 m here [
33].
The results of Xnode displayed on TeraTerm are shown in
Figure 13. True frequencies and cable tension force values from Xnode and Matlab are summarized in
Table 2. All the frequencies and corresponding orders show excellent agreements.
As previously mentioned, the peak-picking method result is in accordance with the vibration. Ten arrays of measured data from cable #64 of Jindo Bridge are used to better describe the changes of extracted frequencies and tension force with varied vibrations, and the cable tension force values are listed in
Table 3 using the effective length estimated by Park et al. (2008). The RMS value is used to represent vibration magnitude.
5.3. Discussion about Automated Cable Tension Estimation in WSN
The WSN has been widely used in cable-stayed structures to realize long-term health monitoring or reliability assessments. The peak-picking method is the most convenient and efficient way to obtain modal frequencies to estimate cable tension force based on the vibration method. However, it may be difficult to determine the peaks due to noise, sensor sensitivity and some other factors. As for the problems mentioned in
Section 3, the automated updating of the threshold value is helpful to capture the potential modal frequencies, especially of weak vibrations with recognizable power spectra. This is despite the way in which the updated threshold value may reduce the reliability of extracted frequencies as the system has corresponding strategies to distinguish undesirable frequencies and determine modal order automatically to ensure its robustness. Compared with previous works in cable tension estimation systems, there are some improvements shown in
Table 4.
The practical validation of the Xnode sensor shows that this system is capable of estimating cable tension with full automation and high robustness. The modal parameters and cable tension greatly agree with the results of Matlab and previous research [
25,
32].
From the results of ten arrays of data, it is found that the peak-picking method failed to acquire frequencies from very weak vibration data, which are instead judged as unrecognizable signals through the method described in
Figure 7. Normally as the magnitude of a cable vibration increases, the higher modal frequencies are more easily excited, showing a slight relation with the bigger cable tension force value in
Table 3. The small tension force results mainly belong to those data with lower modal frequencies.
6. Conclusions
This paper firstly discussed the existing problems of cable tension estimation using wireless smart sensor networks. To take full advantage of a smart sensor system, a robust and fully automated cable tension estimation method based on ambient vibration was proposed in this study. The reliable estimated frequencies and corresponding mode orders are crucial for cable tension estimation when the simple string theory is adopted. The method in this study is capable of distinguishing the cognizable vibration signal and automatically extract potential frequencies using a peak-picking method. Meanwhile, false frequencies were eliminated successfully and the frequency’s orders were determined correctly to estimate cable tension force. Through this strategy, the fully automated cable tension estimation could be realized for cable-supported structures in long-term health monitoring.
A cable tension estimation application was implemented successfully on the Xnode platform based on the following autonomous processing: calculating and averaging power spectral density, picking peaks from power spectrum, eliminating false peaks, determining mode order and calculating cable tension force. As shown in this case, modal properties were correctly determined without any preprocessing or manual intervention. The natural frequencies and corresponding orders of a Jindo Bridge cable obtained from Xnode system were found to be in excellent agreement with those obtained from Matlab. The estimated tension force results matched very well with about 0.53% difference, it is also close to the results presented by previous studies [
25,
32] with a difference of less than 0.53%.
The system constructed in this study is effective in automated cable tension estimation. It is sensitive to strong vibration data having obvious peaks in power spectral density. For weak vibration, this system is capable of capturing peaks for accurate tension force by setting an updated threshold value. For invalid vibration data, the results of the cable tension estimation task were set as zero and sent back to the terminal to call for retesting later.
The Xnode sensor has more memory and an improved processor compared with the previous wireless sensor, which greatly helps to realize cable tension estimation independently, autonomously, and locally. Based on the method proposed in this paper, each cable of a structure would achieve self-identification in long-term monitoring as long as it received the command of a base station node, with only the final results sent back to terminal for early warning.
The method presented in this paper may fail to calculate correct tension force when the power spectrum has continuous and multiple skipped frequencies. Therefore, in real testing, it is better to compare the tension force results of several inspections to obtain a reliable value for structure assessment. Meanwhile, the accuracy of the cable tension force may be affected by the number of obtained frequencies. Generally, the more true frequencies are acquired, the better the accuracy will be. In addition, a recognizable power spectrum which has less obvious peaks may be misjudged as a useless signal; therefore, several tests may be needed to obtain enough peaks in practical experiment.
The cable tension force of an in-service bridge usually varies in practical monitoring because of vehicle load and environmental effects. Therefore, further research will be focused on improving the algorithm and identification technology, which may also be able to automatically analyze the cause of force changes, especially for sudden changes in long-term monitoring, and send alarms to avoid potential risks for the structures.
Author Contributions
M.Z. worked on conceptualization, methodology, programming and writing-original draft. H.H. analyzed the data and edited the format of draft. G.L. provided the funding acquisition and writing-review and editing. H.W. provided investigation and suggestions on the discussion. All authors have read and agreed to the published version of the manuscript.
Funding
This research received no external funding.
Institutional Review Board Statement
Not applicable.
Informed Consent Statement
Not applicable.
Acknowledgments
This study was financially supported by the key projects of universities of Guangdong Province (2019KZDZX2001), the Natural Science Foundation of China (52178209, 51878299 and 51378303), and the Science and Technology Plan of Guangdong Province (2015A010105029), whose support is gratefully acknowledged. Sincere appreciation goes to Spencer, Sung Han Sim and Yu Guang Fu for their all-out support and their contributions to relevant research.
Conflicts of Interest
The authors declare no conflict of interest.
References
- Jinping, O.; Hui, L. Structural Health Monitoring in mainland China: Review and Future Trends. Struct. Health Monit. 2010, 9, 219–231. [Google Scholar] [CrossRef]
- Yun, C.-B.; Lee, J.-J.; Koo, K.-Y. Smart structure technologies for civil infrastructures in Korea: Recent research and applications. Struct. Infrastruct. Eng. 2011, 7, 673–688. [Google Scholar]
- Li, H.; Zhang, F.; Jin, Y. Real-time identification of time-varying tension in stay cables by monitoring cable transversal acceleration. Struct. Control Health Monit. 2014, 21, 1100–1117. [Google Scholar] [CrossRef]
- Kim, S.-W.; Jeon, B.-G.; Cheung, J.-H.; Kim, S.-D.; Park, J.-B. Stay cable tension estimation using a vision-based monitoring system under various weather conditions. J. Civ. Struct. Health Monit. 2017, 7, 343–357. [Google Scholar]
- Tomizuka, M.; Jia, Z.-G.; Ren, L.; Li, D.-S.; Li, H.-N. Cable stretching construction monitoring based on FBG sensor. In Proceedings of the Sensors and Smart Structures Technologies for Civil, Mechanical, and Aerospace Systems 2011, San Diego, CA, USA, 7–10 March 2011. [Google Scholar]
- Ko, J.; Ni, Y.Q. Technology developments in structural health monitoring of large-scale bridges. Eng. Struct. 2005, 27, 1715–1725. [Google Scholar] [CrossRef]
- Sofi, A.; Jane Regita, J.; Rane, B.; Lau, H.H. Structural health monitoring using wireless smart sensor network—An overview. Mech. Syst. Signal Process. 2022, 163, 108113. [Google Scholar]
- Chen, S.-E.; Petro, S. Nondestructive bridge cable tension assessment using laser vibrometry. Exp. Tech. 2005, 29, 29–32. [Google Scholar] [CrossRef]
- Shimada, T. Estimating method of cable tension from natural frequency of high mode. Doboku Gakkai Ronbunshu 1994, 1994, 163–171. [Google Scholar] [CrossRef] [Green Version]
- Casas, J.R. A Combined Method for Measuring Cable Forces: The Cable-Stayed Alamillo Bridge, Spain. Struct. Eng. Int. 1994, 4, 235–240. [Google Scholar] [CrossRef]
- Kim, B.H.; Park, T. Estimation of cable tension force using the frequency-based system identification method. J. Sound Vib. 2007, 304, 660–676. [Google Scholar] [CrossRef]
- Zui, H.; Shinke, T.; Namita, Y. Practical formulas for estimation of cable tension by vibration method. J. Struct. Eng. 1996, 122, 651–656. [Google Scholar] [CrossRef]
- Ren, W.-X.; Chen, G.; Hu, W.-H. Empirical formulas to estimate cable tension by cable fundamental frequency. Struct. Eng. Mech. 2005, 20, 363–380. [Google Scholar] [CrossRef]
- Fortino, G.; Savaglio, C.; Spezzano, G.; Zhou, M. Internet of Things as System of Systems: A Review of Methodologies, Frameworks, Platforms, and Tools. IEEE Trans. Syst. Man Cybern. Syst. 2020, 51, 223–236. [Google Scholar] [CrossRef]
- Wazid, M.; Das, A.K.; Khan, M.K.; Al-Ghaiheb, A.A.-D.; Kumar, N.; Vasilakos, A.V. Secure authentication scheme for medicine anti-counterfeiting system in IoT environment. IEEE Internet Things J. 2017, 4, 1634–1646. [Google Scholar] [CrossRef]
- Sidorov, M.; Nhut, P.V.; Matsumoto, Y.; Ohmura, R. Lora-based precision wireless structural health monitoring system for bolted joints in a smart city environment. IEEE Access 2019, 7, 179235–179251. [Google Scholar] [CrossRef]
- Tokognon, C.A.; Gao, B.; Tian, G.Y.; Yan, Y. Structural health monitoring framework based on Internet of Things: A survey. IEEE Internet Things J. 2017, 4, 619–635. [Google Scholar] [CrossRef]
- Ferreira Dias, C.; de Oliveira, J.R.; de Mendonça, L.D.; de Almeida, L.M.; de Lima, E.R.; Wanner, L. An IoT-Based System for Monitoring the Health of Guyed Towers in Overhead Power Lines. Sensors 2021, 21, 6173. [Google Scholar] [CrossRef] [PubMed]
- Spencer, B.F.; Park, J.W.; Mechitov, K.A.; Jo, H.; Agha, G. Next Generation Wireless Smart Sensors toward Sustainable Civil Infrastructure. Procedia Eng. 2017, 171, 5–13. [Google Scholar] [CrossRef]
- Feng, D.; Scarangello, T.; Feng, M.Q.; Ye, Q. Cable tension force estimate using novel noncontact vision-based sensor. Measurement 2017, 99, 44–52. [Google Scholar]
- Yu, Y.; Zhang, C.; Zhu, X.; Kang, W.H.; Mao, X.; Uy, B. Design and Experimental Investigations of a Vibration Based Wireless Measurement System for Bridge Cable Tension Monitoring. Adv. Struct. Eng. 2014, 17, 1657–1668. [Google Scholar] [CrossRef]
- Fu, Y.; Hoang, T.; Mechitov, K.; Kim, J.R.; Zhang, D.; Spencer, B.F. Sudden Event Monitoring of Civil Infrastructure Using Demand-Based Wireless Smart Sensors. Sensors 2018, 18, 4480. [Google Scholar] [CrossRef] [PubMed] [Green Version]
- Nagayama, T.; Sim, S.-H.; Miyamori, Y.; Spencer, B. Issues in structural health monitoring employing smart sensors. Smart Struct. Syst. 2007, 3, 299–320. [Google Scholar] [CrossRef] [Green Version]
- Cho, S.; Lynch, J.P.; Lee, J.-J.; Yun, C.-B. Development of an Automated Wireless Tension Force Estimation System for Cable-stayed Bridges. J. Intell. Mater. Syst. Struct. 2009, 21, 361–376. [Google Scholar] [CrossRef]
- Sim, S.-H.; Li, J.; Jo, H.; Park, J.-W.; Cho, S.; Spencer, B.F., Jr.; Jung, H.-J. A wireless smart sensor network for automated monitoring of cable tension. Smart Mater. Struct. 2013, 23, 025006. [Google Scholar]
- Zhao, X.; Han, R.; Ding, Y.; Yu, Y.; Guan, Q.; Hu, W.; Li, M.; Ou, J. Portable and convenient cable force measurement using smartphone. J. Civ. Struct. Health Monit. 2015, 5, 481–491. [Google Scholar]
- Zhao, X.; Yu, Y.; Hu, W.; Jiao, D.; Han, R.; Mao, X.; Li, M.; Ou, J. Cable force monitoring system of cable stayed bridges using accelerometers inside mobile smart phone. In Sensors and Smart Structures Technologies for Civil, Mechanical, and Aerospace Systems 2015; International Society for Optics and Photonics: Washington, DC, USA, 2015; p. 94351H. [Google Scholar]
- Li, H.; Liu, M.; Li, J.; Guan, X.; Ou, J. Vibration control of stay cables of the shandong binzhou yellow river highway bridge using magnetorheological fluid dampers. J. Bridge Eng. 2007, 12, 401–409. [Google Scholar]
- Jeong, S.; Lee, Y.-J.; Sim, S.-H. Serviceability Assessment Method of Stay Cables with Vibration Control Using First-Passage Probability. Math. Probl. Eng. 2019, 2019, 4138279. [Google Scholar]
- Fu, Y.; Mechitov, K.; Hoang, T.; Kim, J.R.; Lee, D.H.; Spencer, B.F., Jr. Development and full-scale validation of high-fidelity data acquisition on a next-generation wireless smart sensor platform. Adv. Struct. Eng. 2019, 22, 3512–3533. [Google Scholar]
- Veluthedath Shajihan, S.A.; Chow, R.; Mechitov, K.; Fu, Y.; Hoang, T.; Spencer, B.F. Development of synchronized high-sensitivity wireless accelerometer for structural health monitoring. Sensors 2020, 20, 4169. [Google Scholar] [CrossRef]
- Cho, S.; Jang, S.; Jo, H.; Mechitov, K.; Bridge, J.; Jung, H.-J.; Yun, C.-B.; Spencer, B.; Nagayama, T.; Seo, J. Structural health monitoring system of a cable-stayed bridge using a dense array of scalable smart sensor network. Proc. SPIE Int. Soc. Opt. Eng. 2010, 7647. [Google Scholar] [CrossRef]
- Park, Y.S.; Choi, S.M.; Yang, W.Y.; Hong, H.J.; Kim, W.H. A study on tension for cables of a cable-stayed bridge damper is attached. J. Korean Soc. Steel Constr. 2008, 20, 609–616. [Google Scholar]
| Publisher’s Note: MDPI stays neutral with regard to jurisdictional claims in published maps and institutional affiliations. |
© 2021 by the authors. Licensee MDPI, Basel, Switzerland. This article is an open access article distributed under the terms and conditions of the Creative Commons Attribution (CC BY) license (https://creativecommons.org/licenses/by/4.0/).


