
Real-Time Fault Detection and Diagnosis of CaCO3 Reactive Crystallization Process by Electrical Resistance Tomography Measurements

 , , ,
, , ,  ,
,  and
and 
Abstract
:1. Introduction
2. Materials and Methods
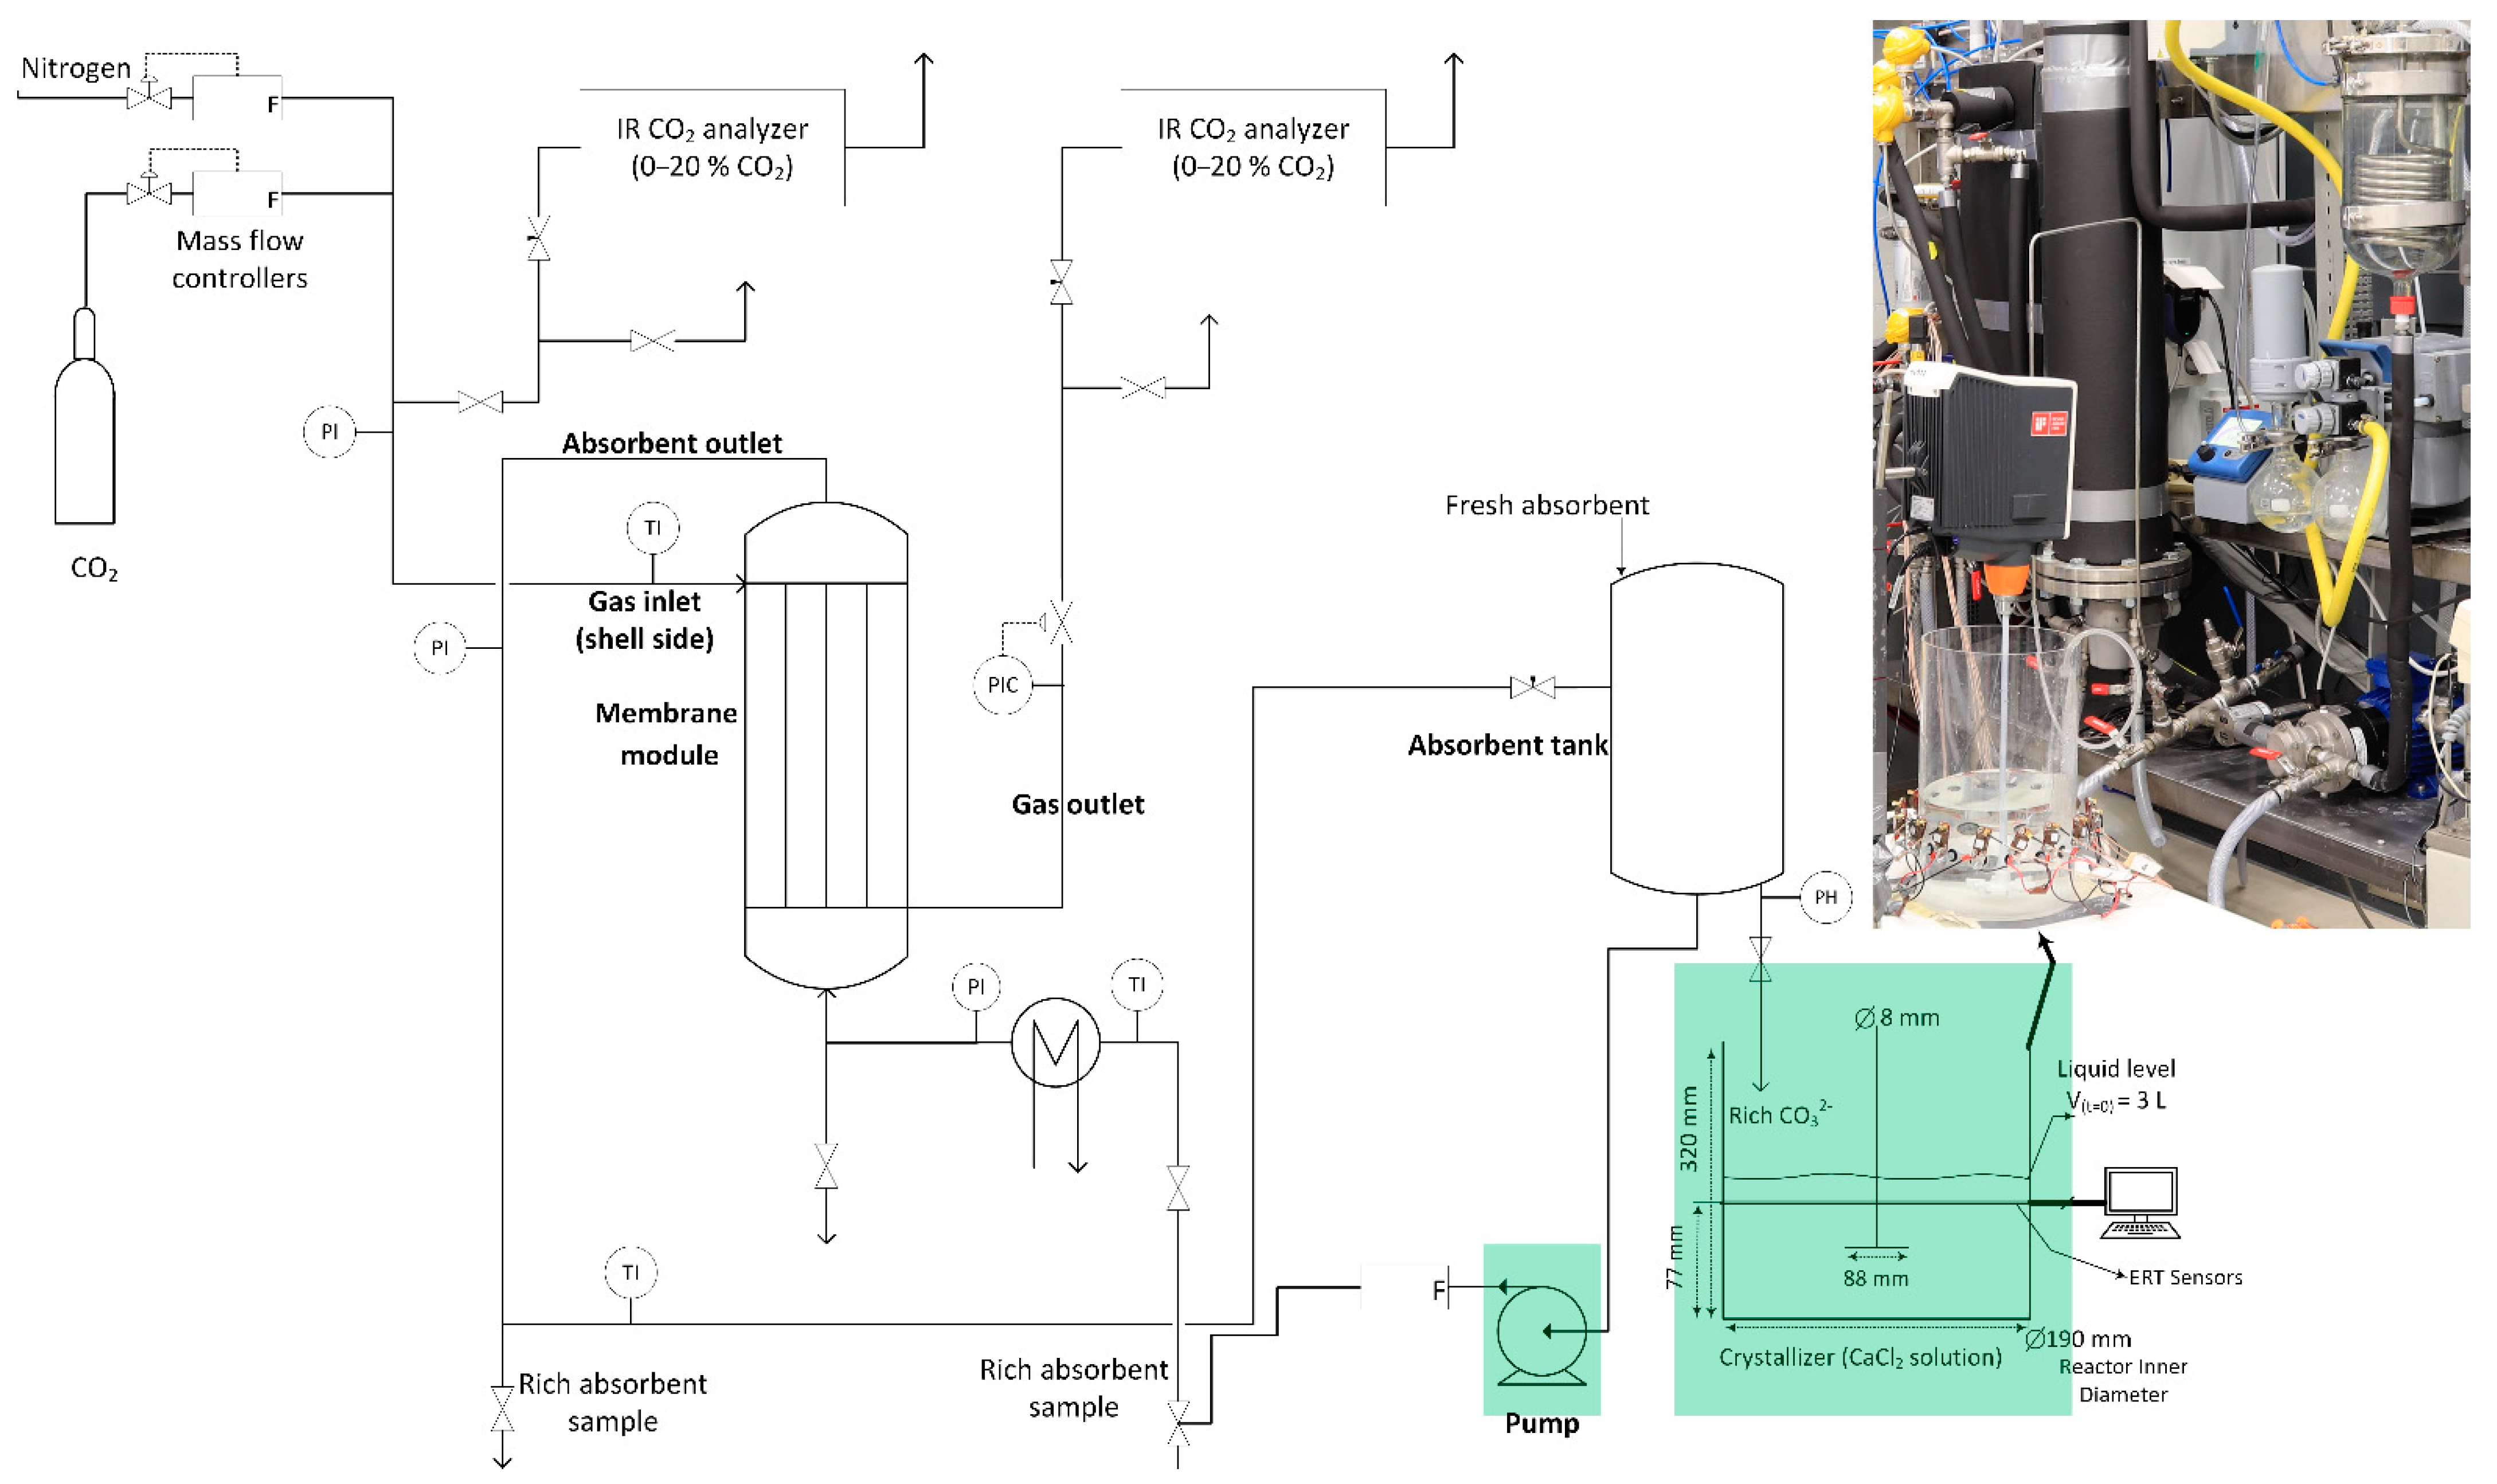
2.1. The Integrated Capture and Crystallization Setup
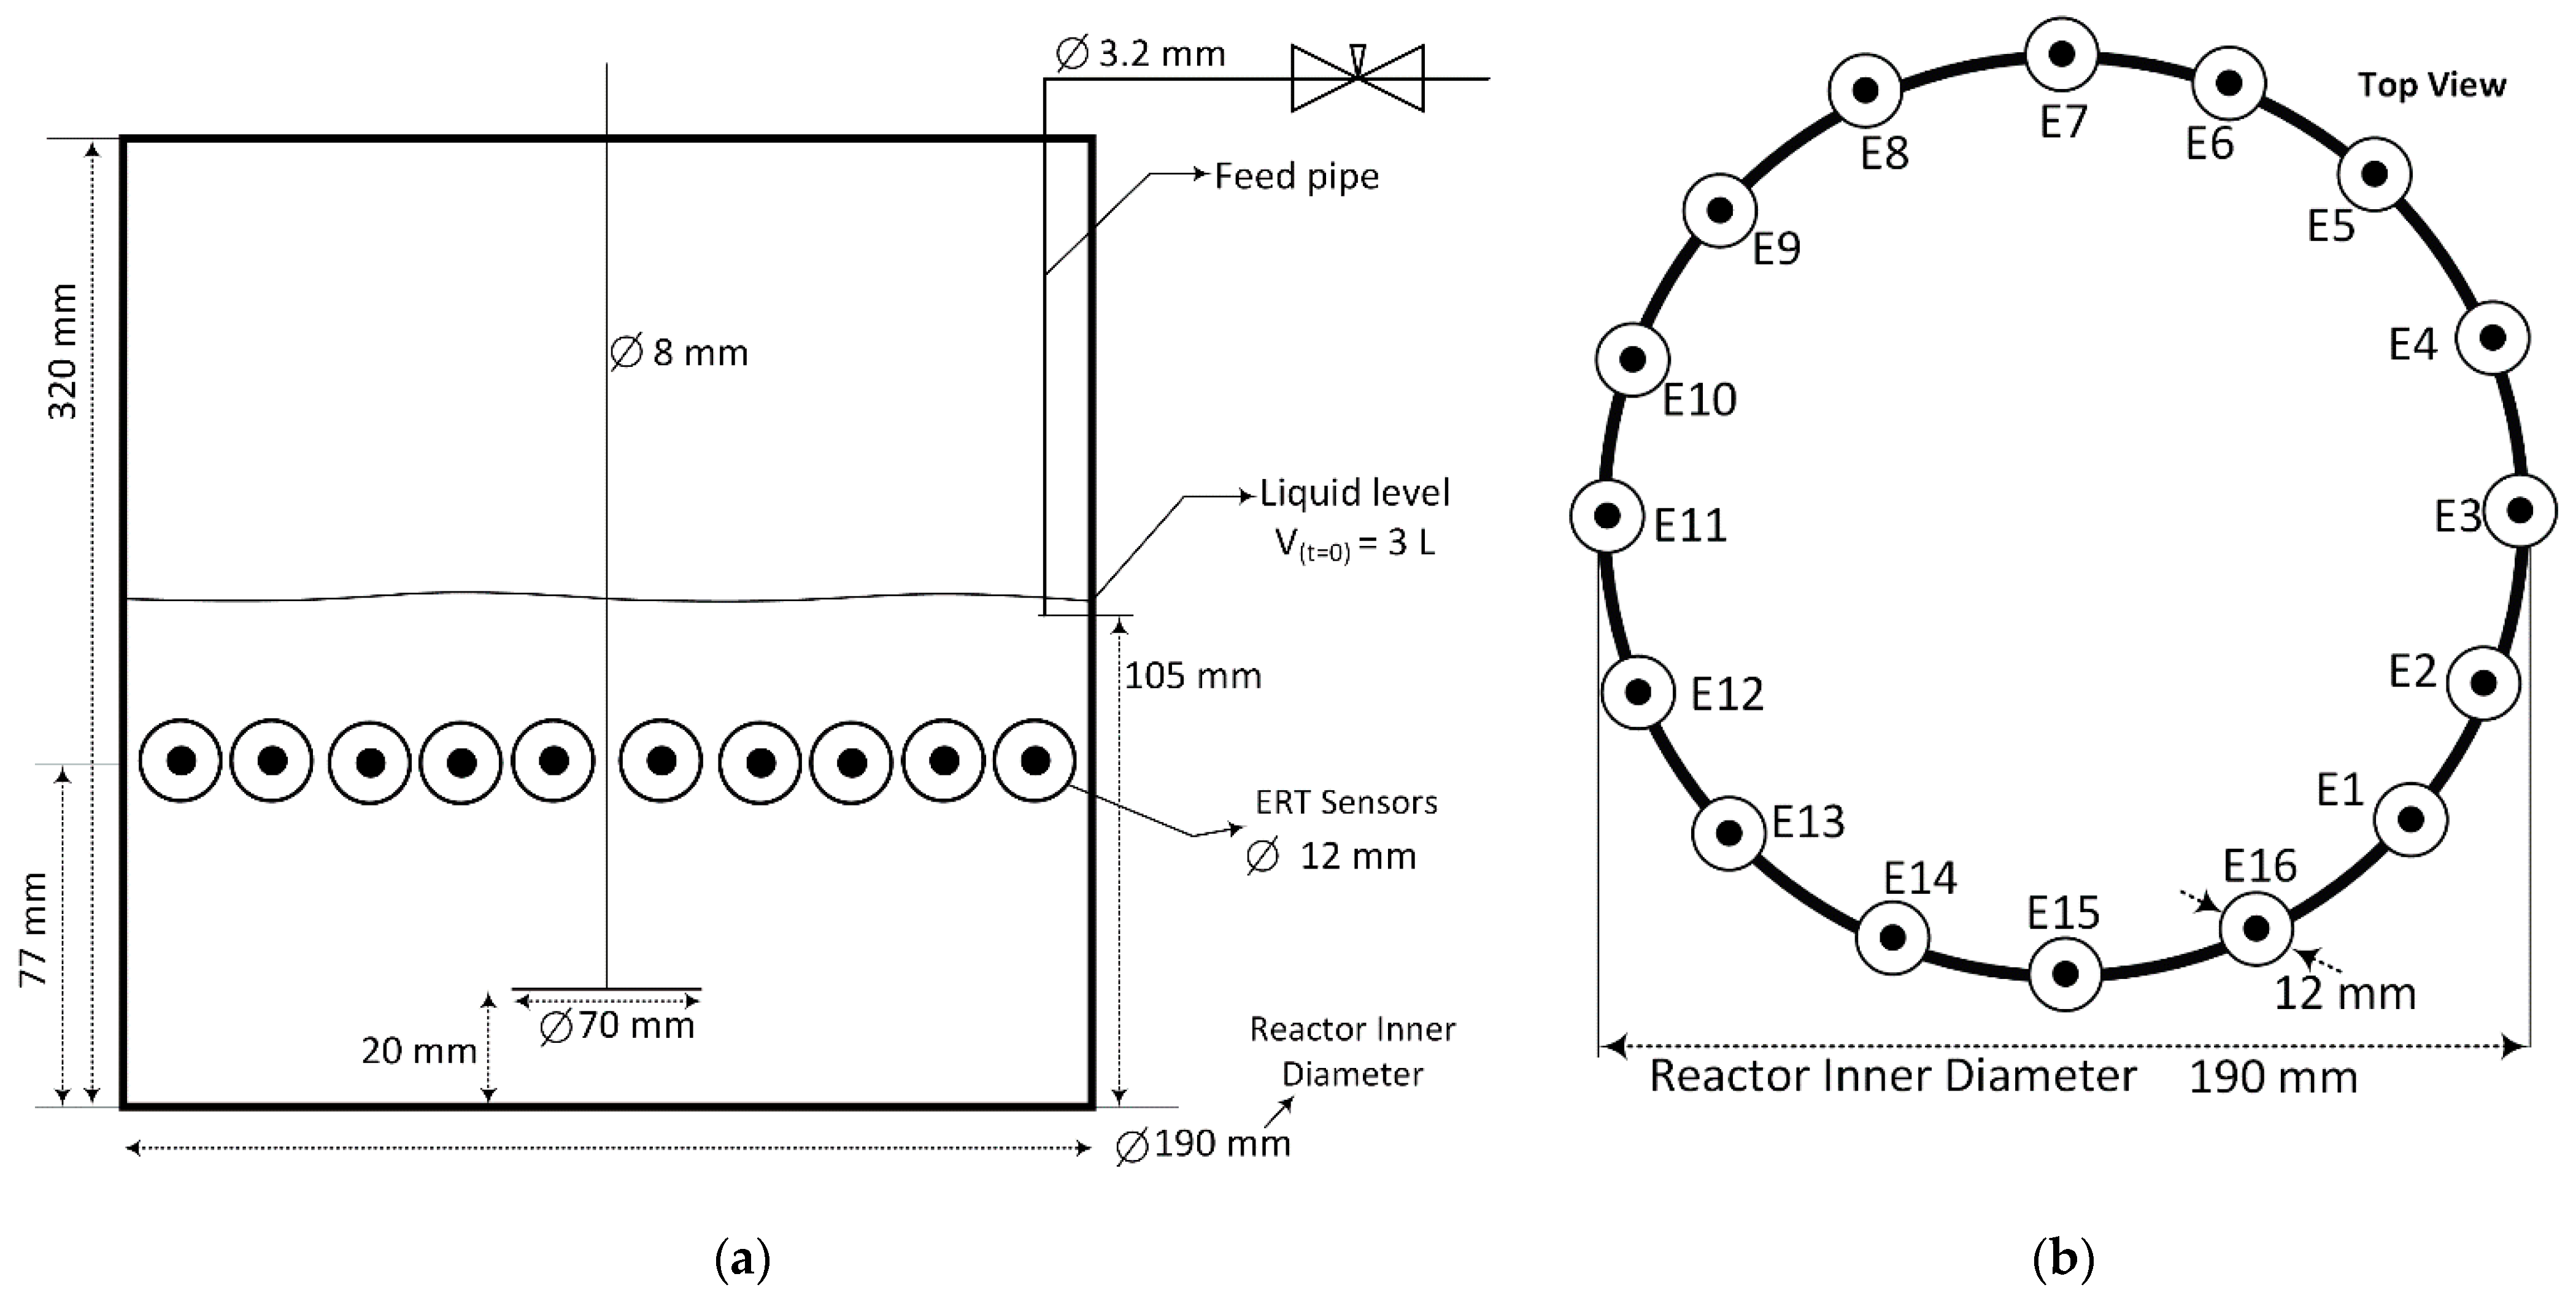
2.2. The Electrical Resistance Tomography System
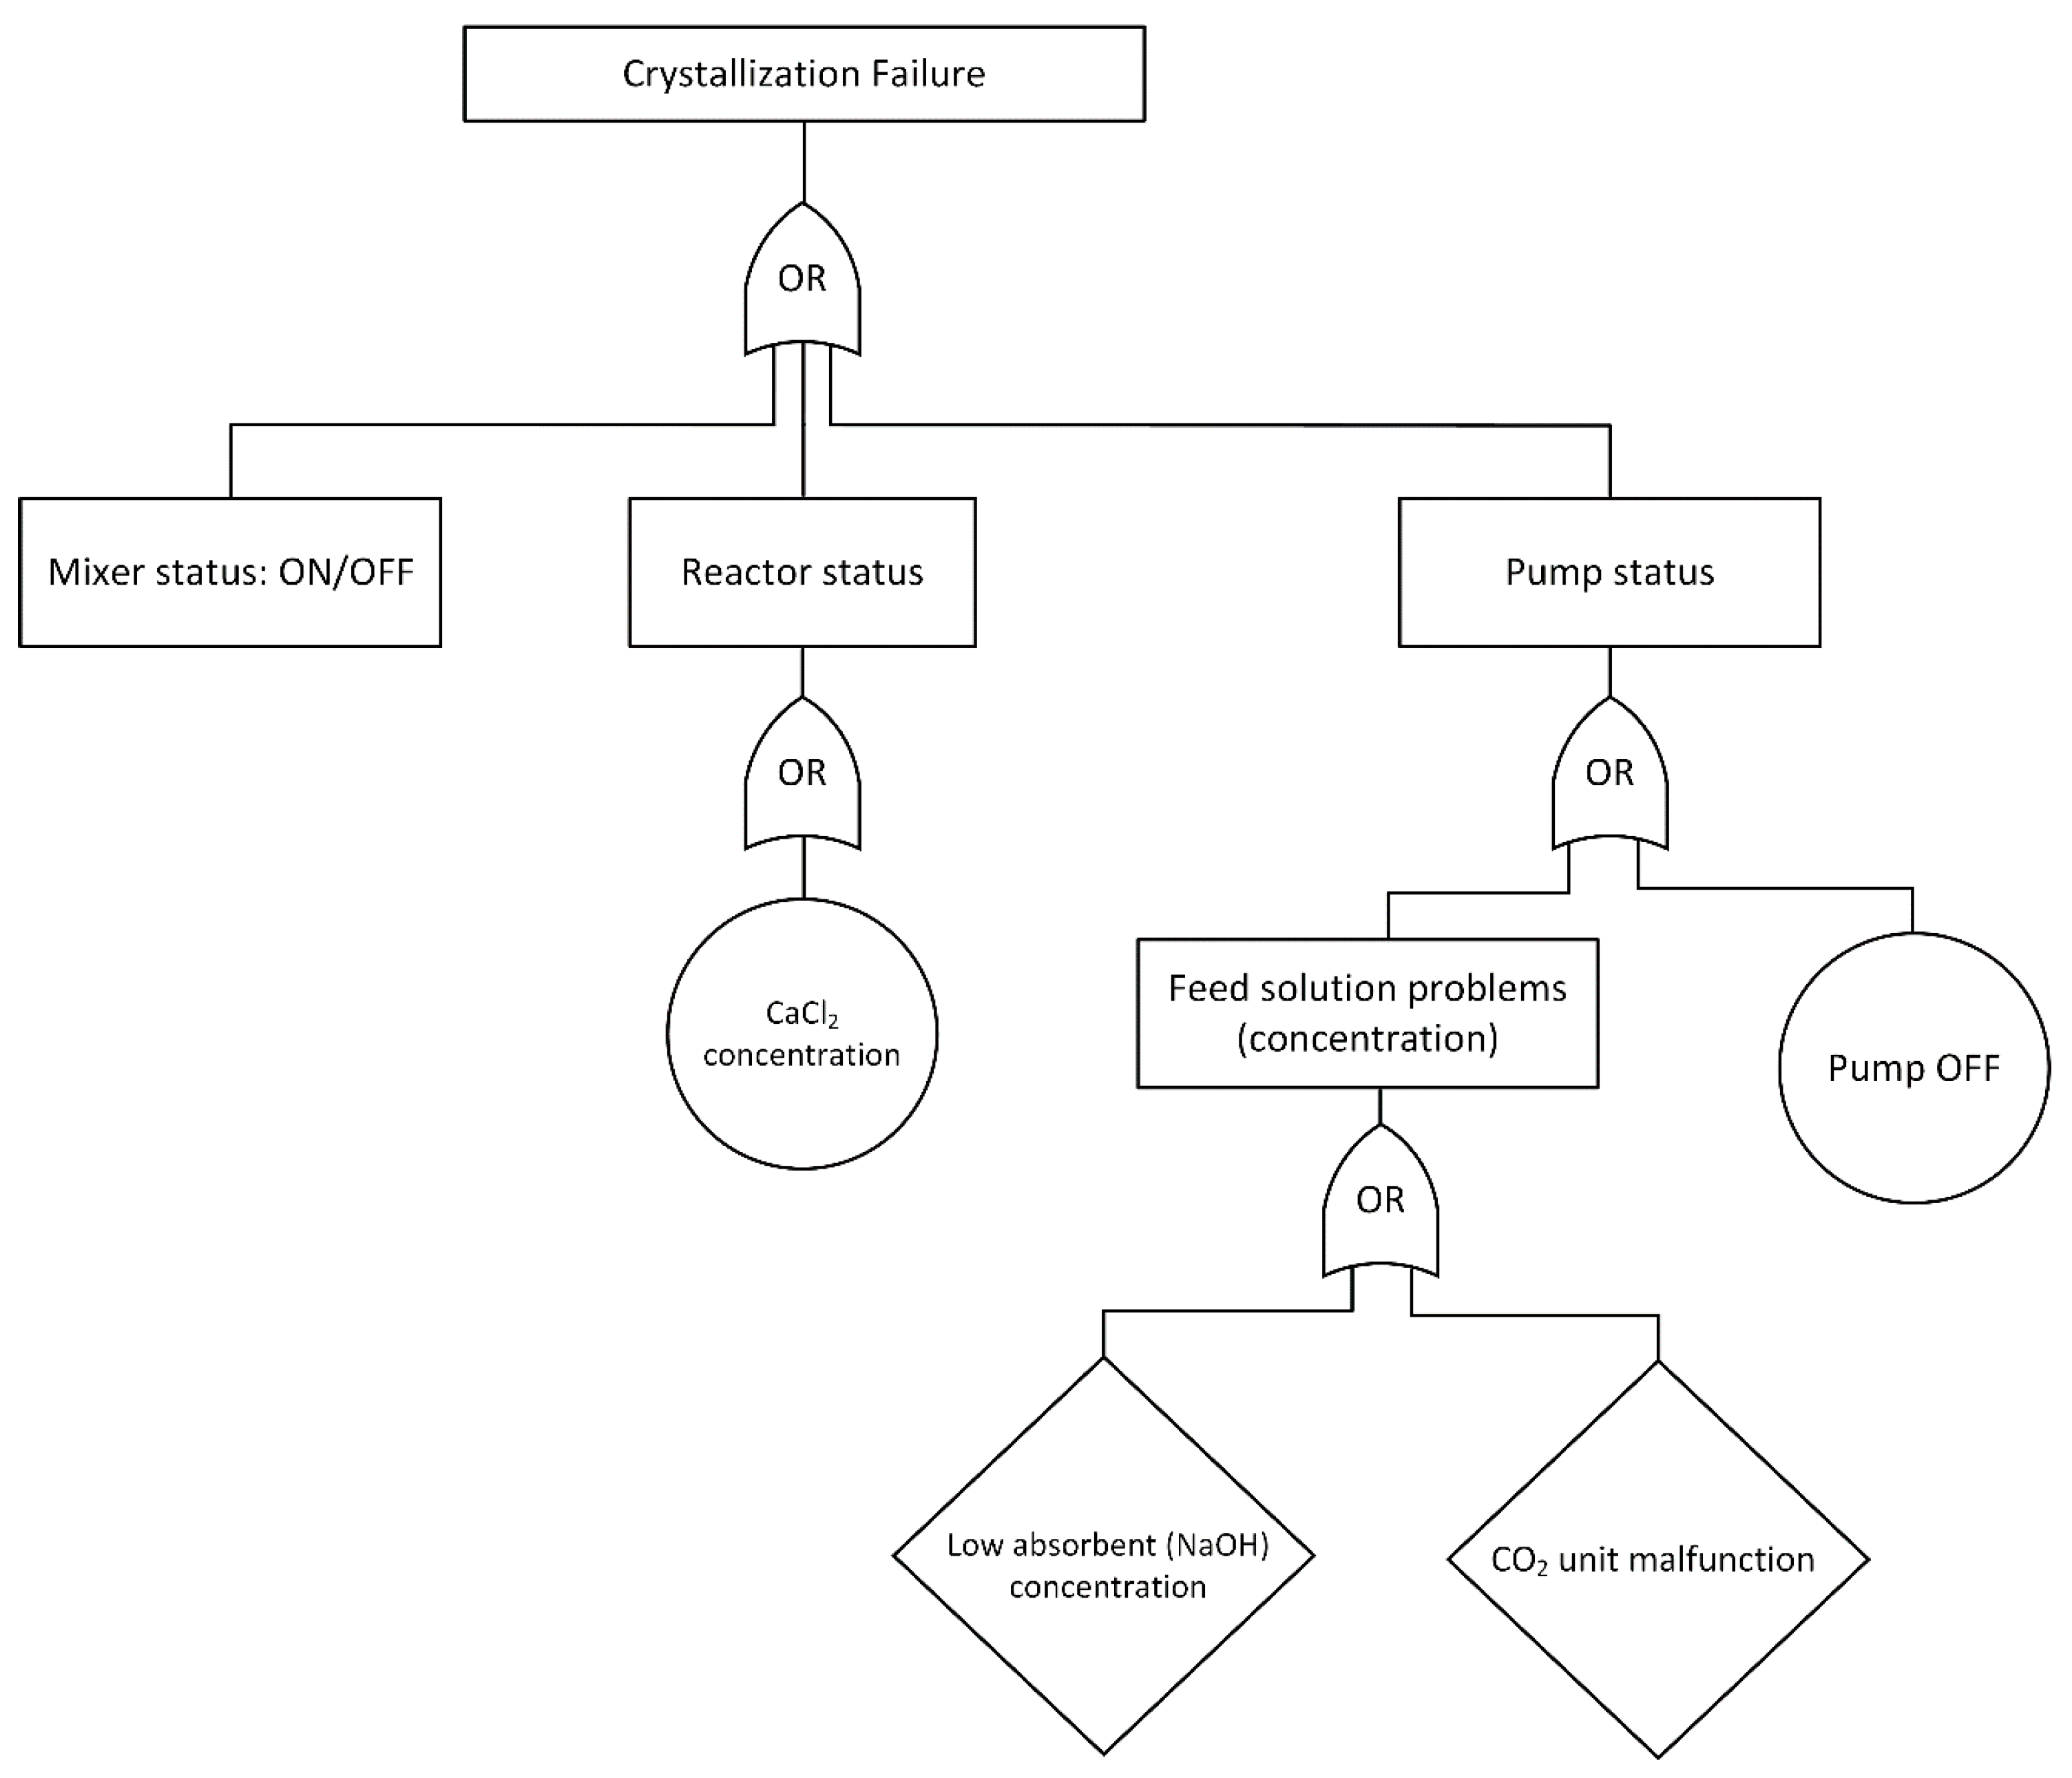
2.3. Failure Identification and Fault Tree Analysis Development
2.4. Malfunction Diagnostics Implementation
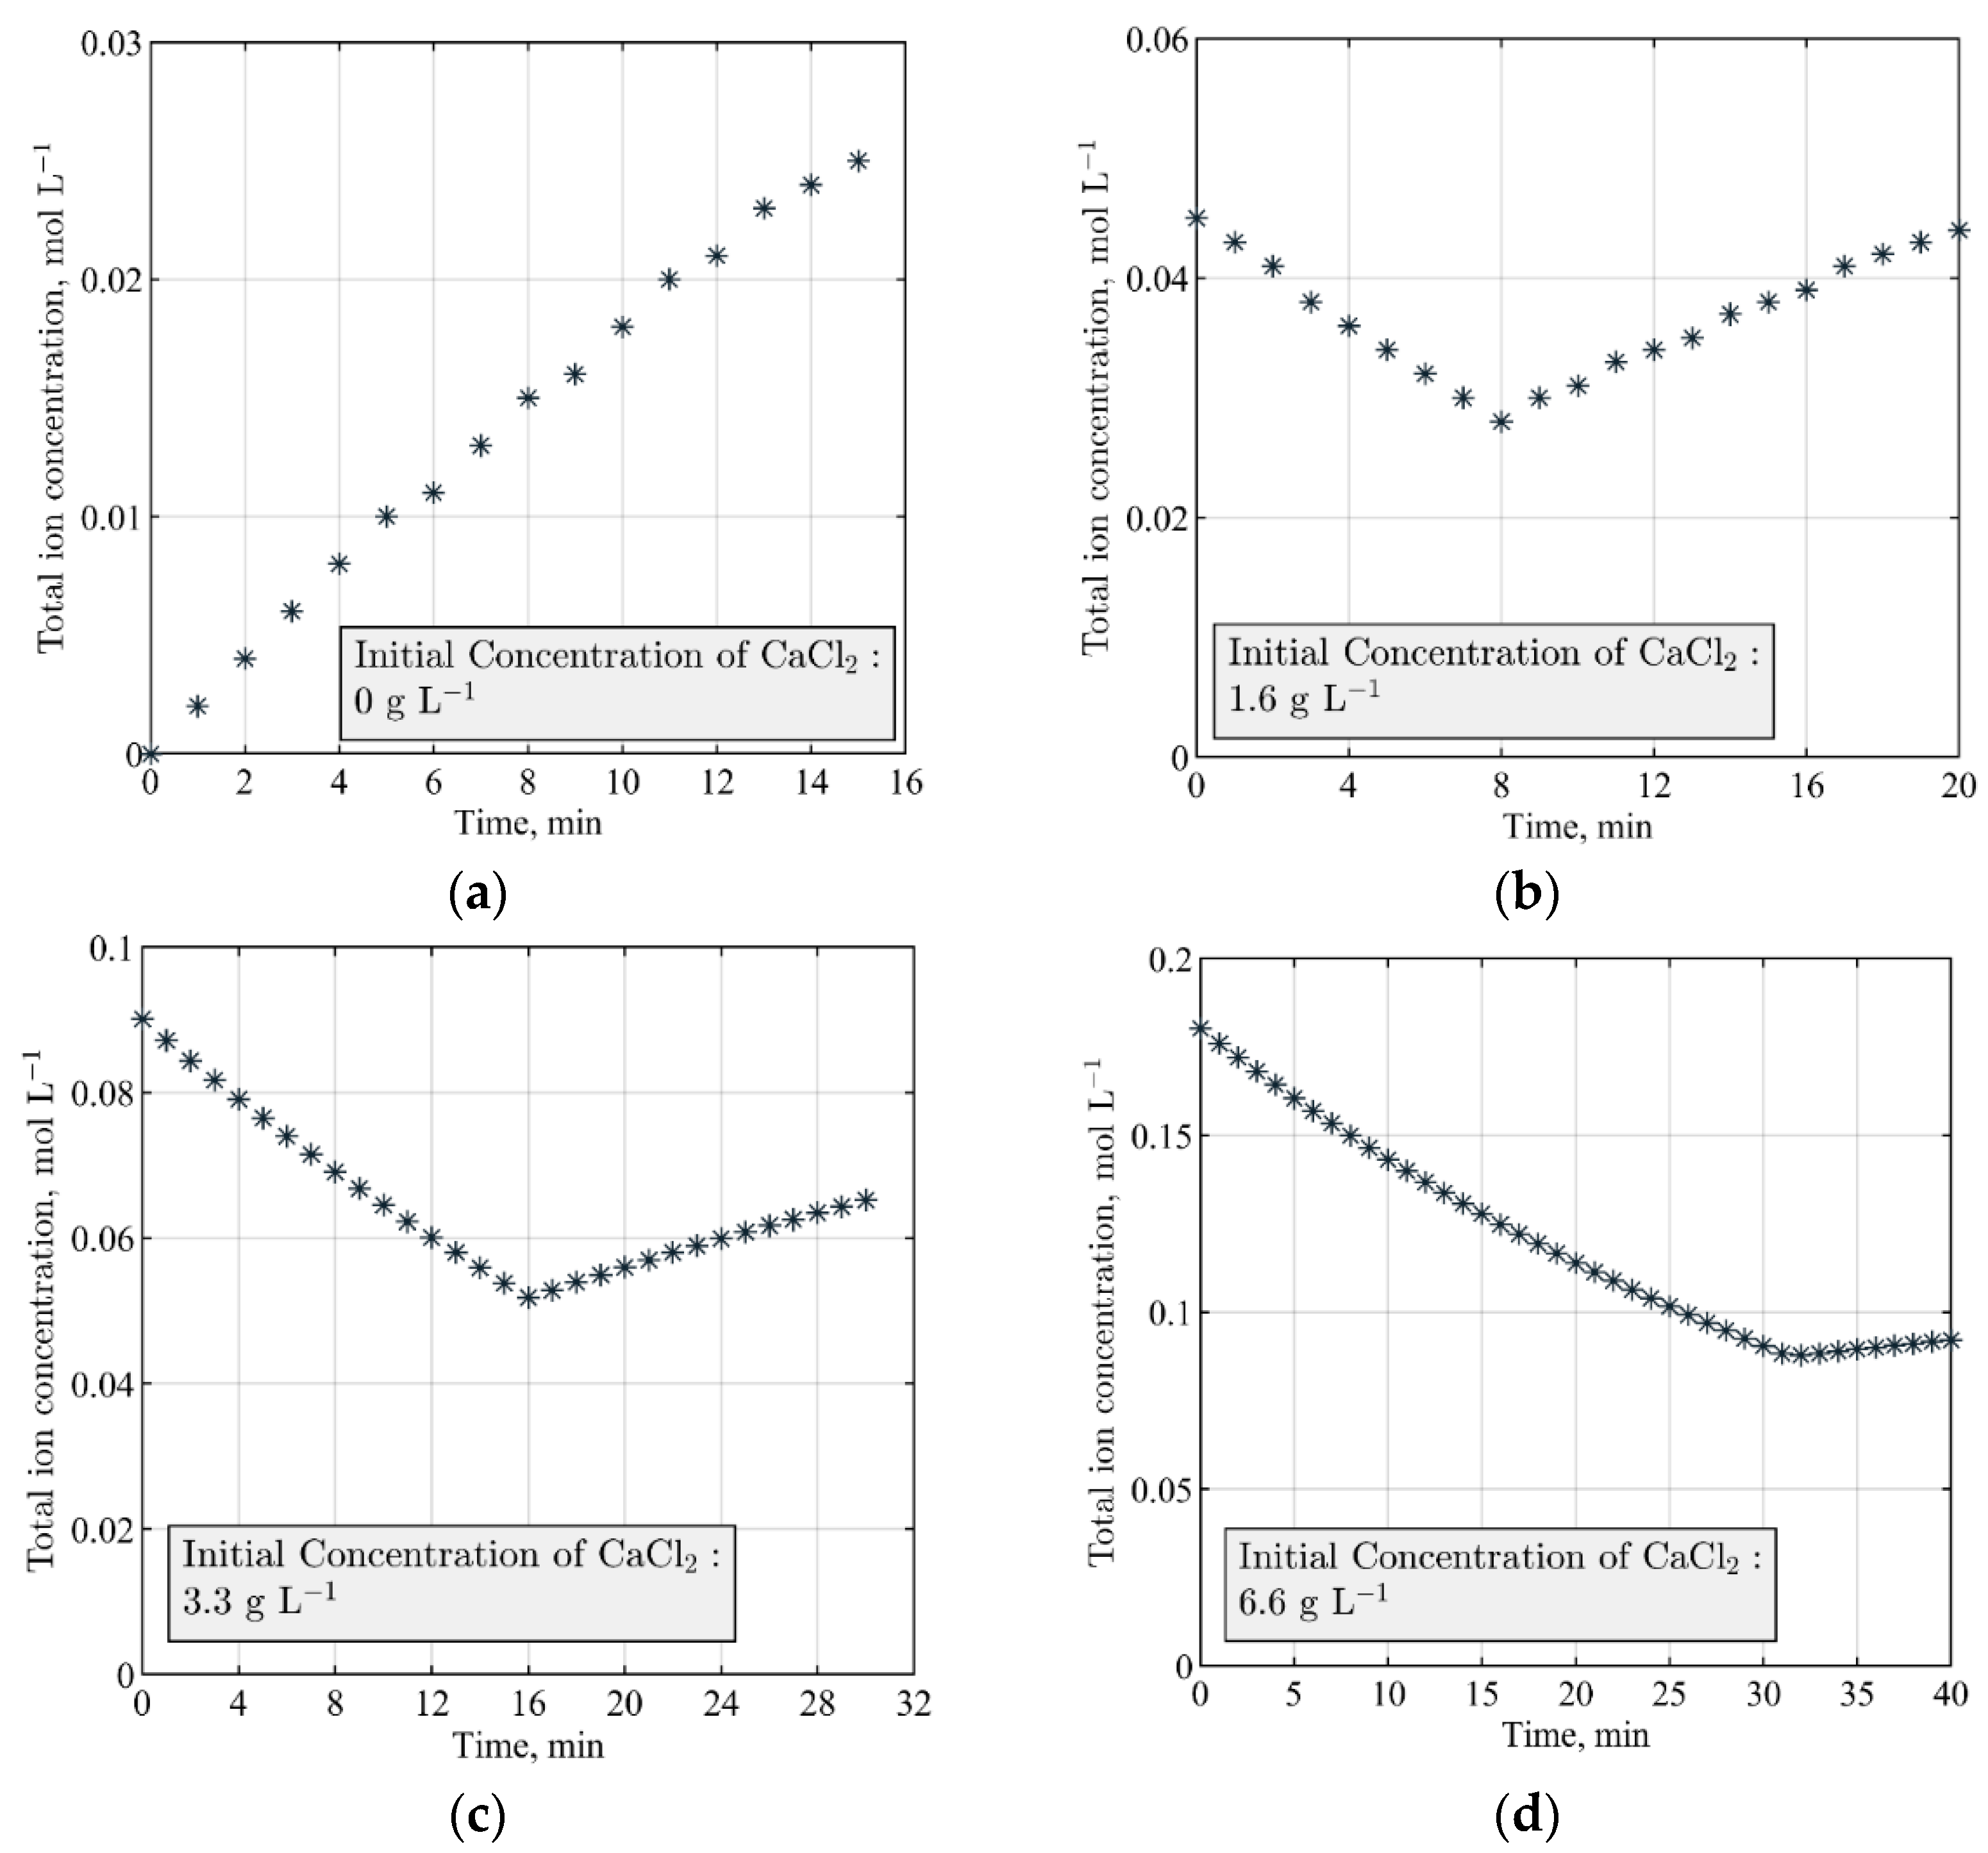
2.5. Total Ion Balance Modeling and the Minimum Runtime
3. Results and Discussion
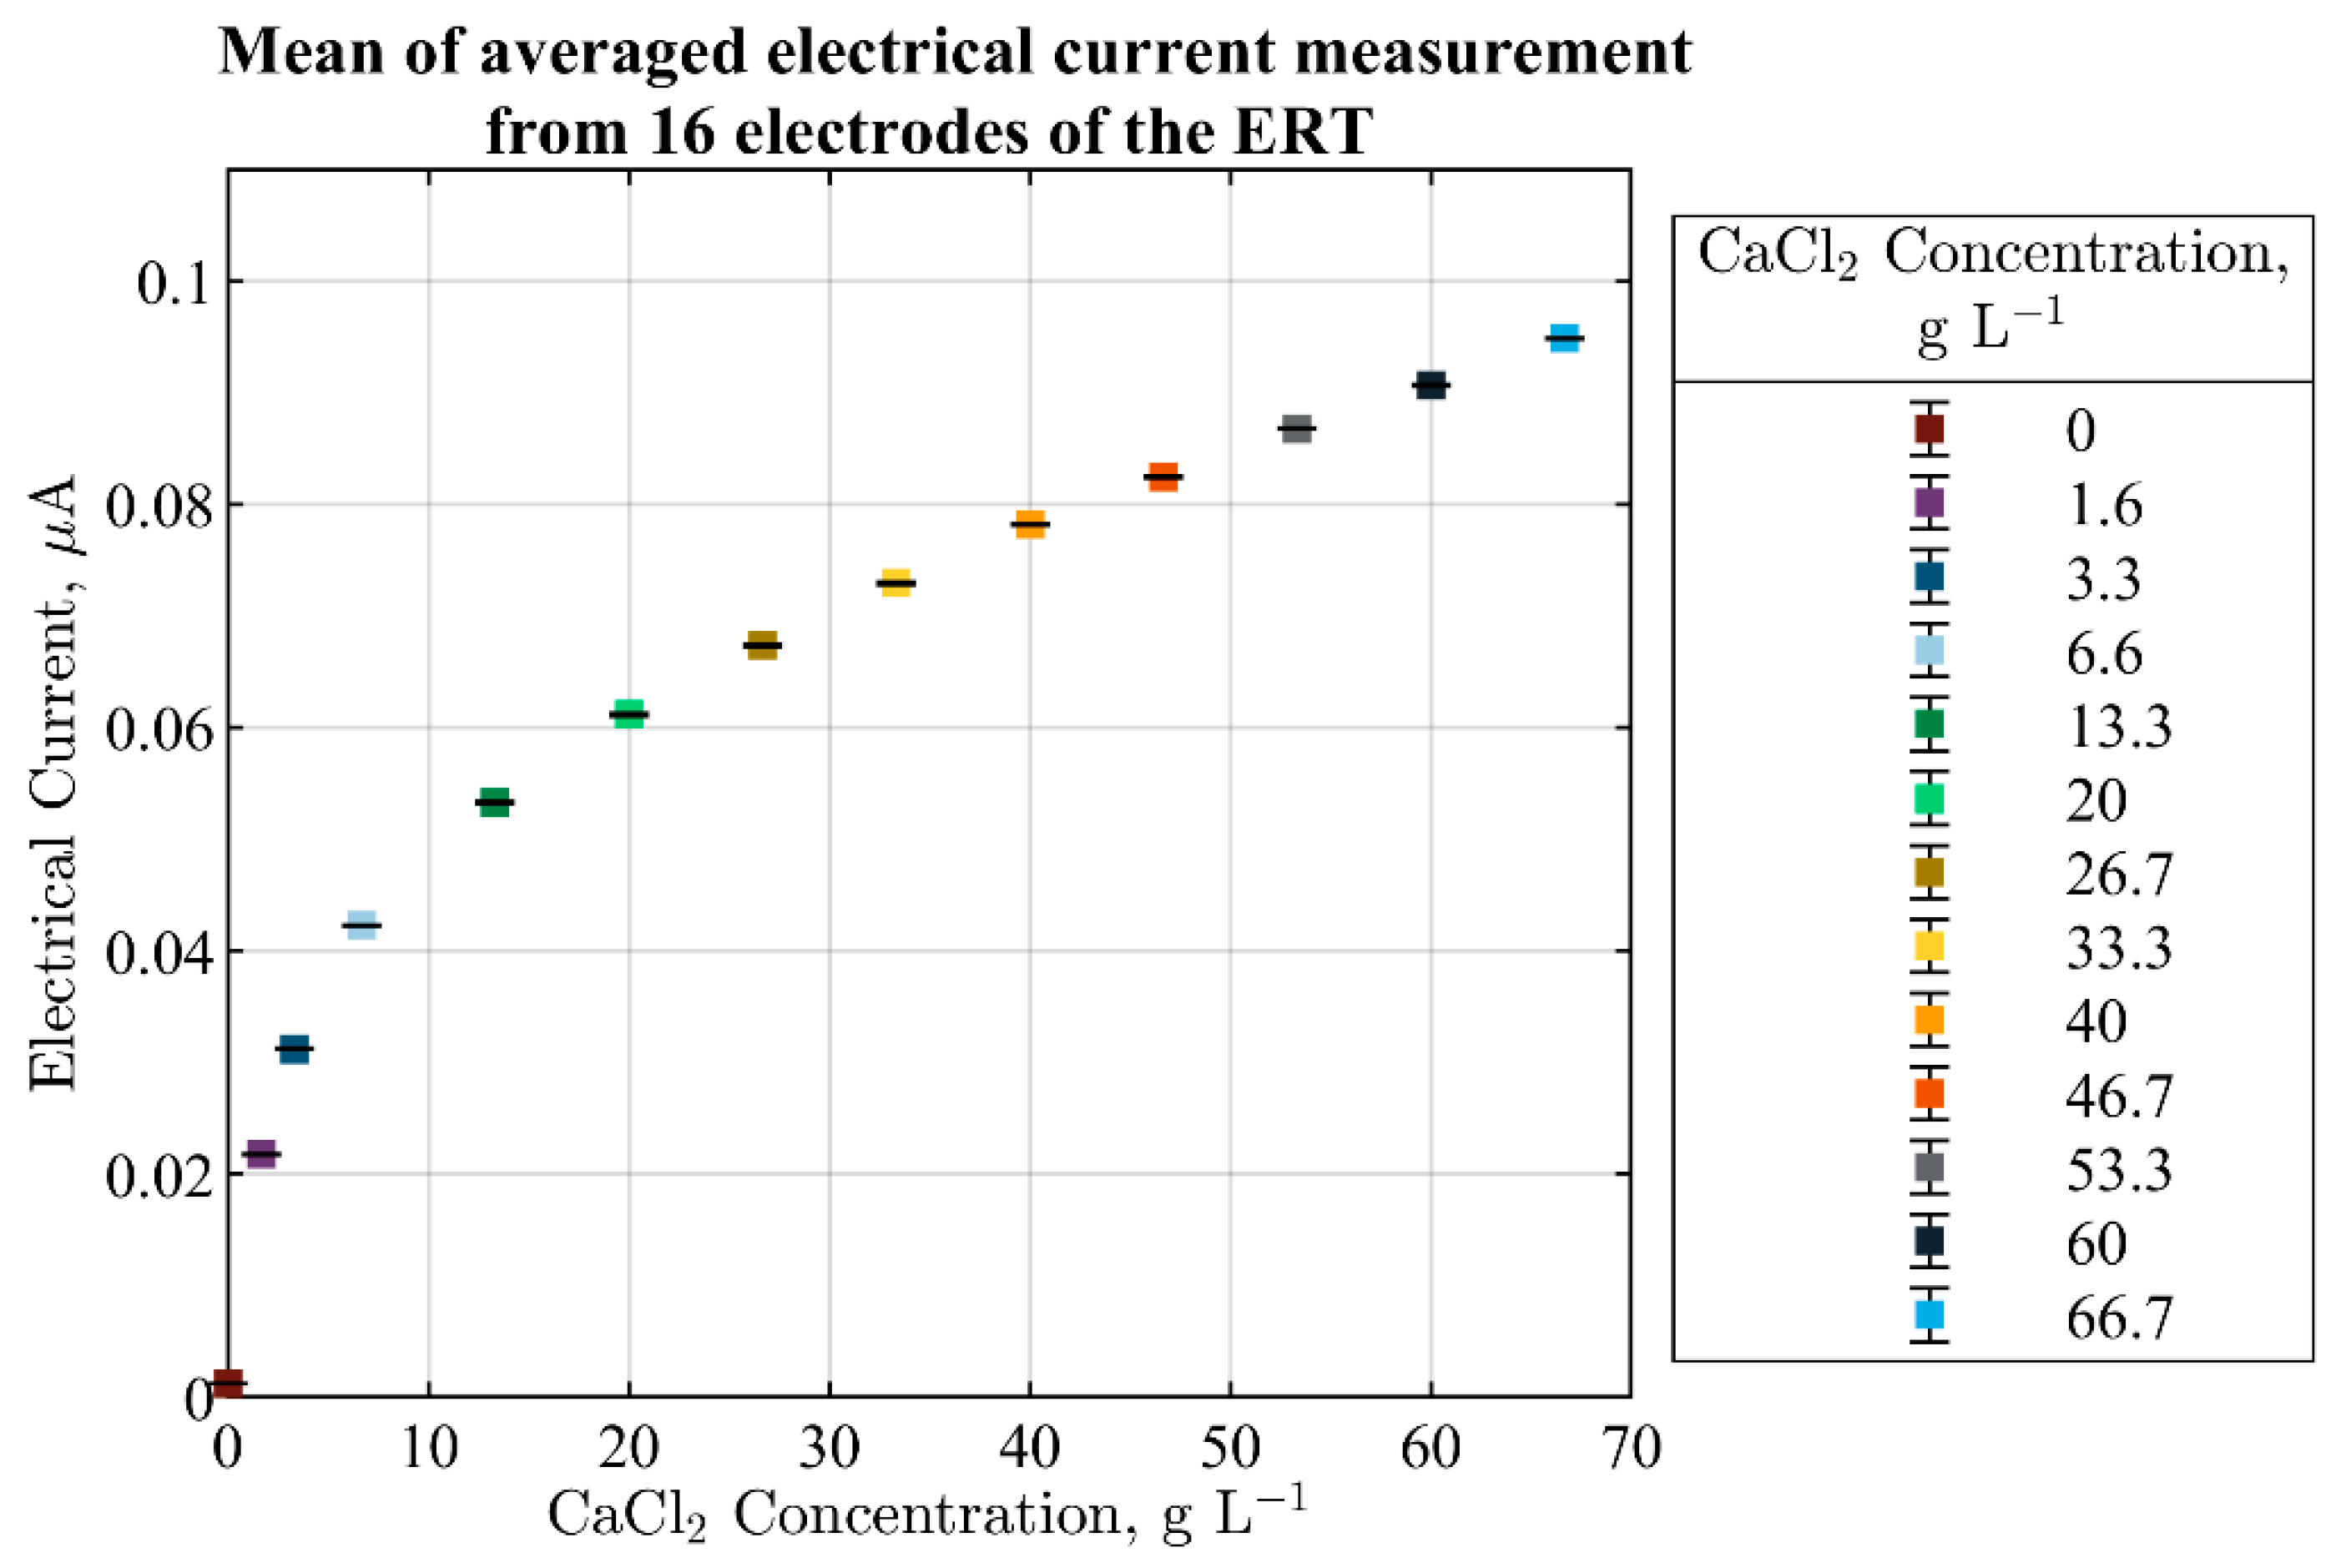
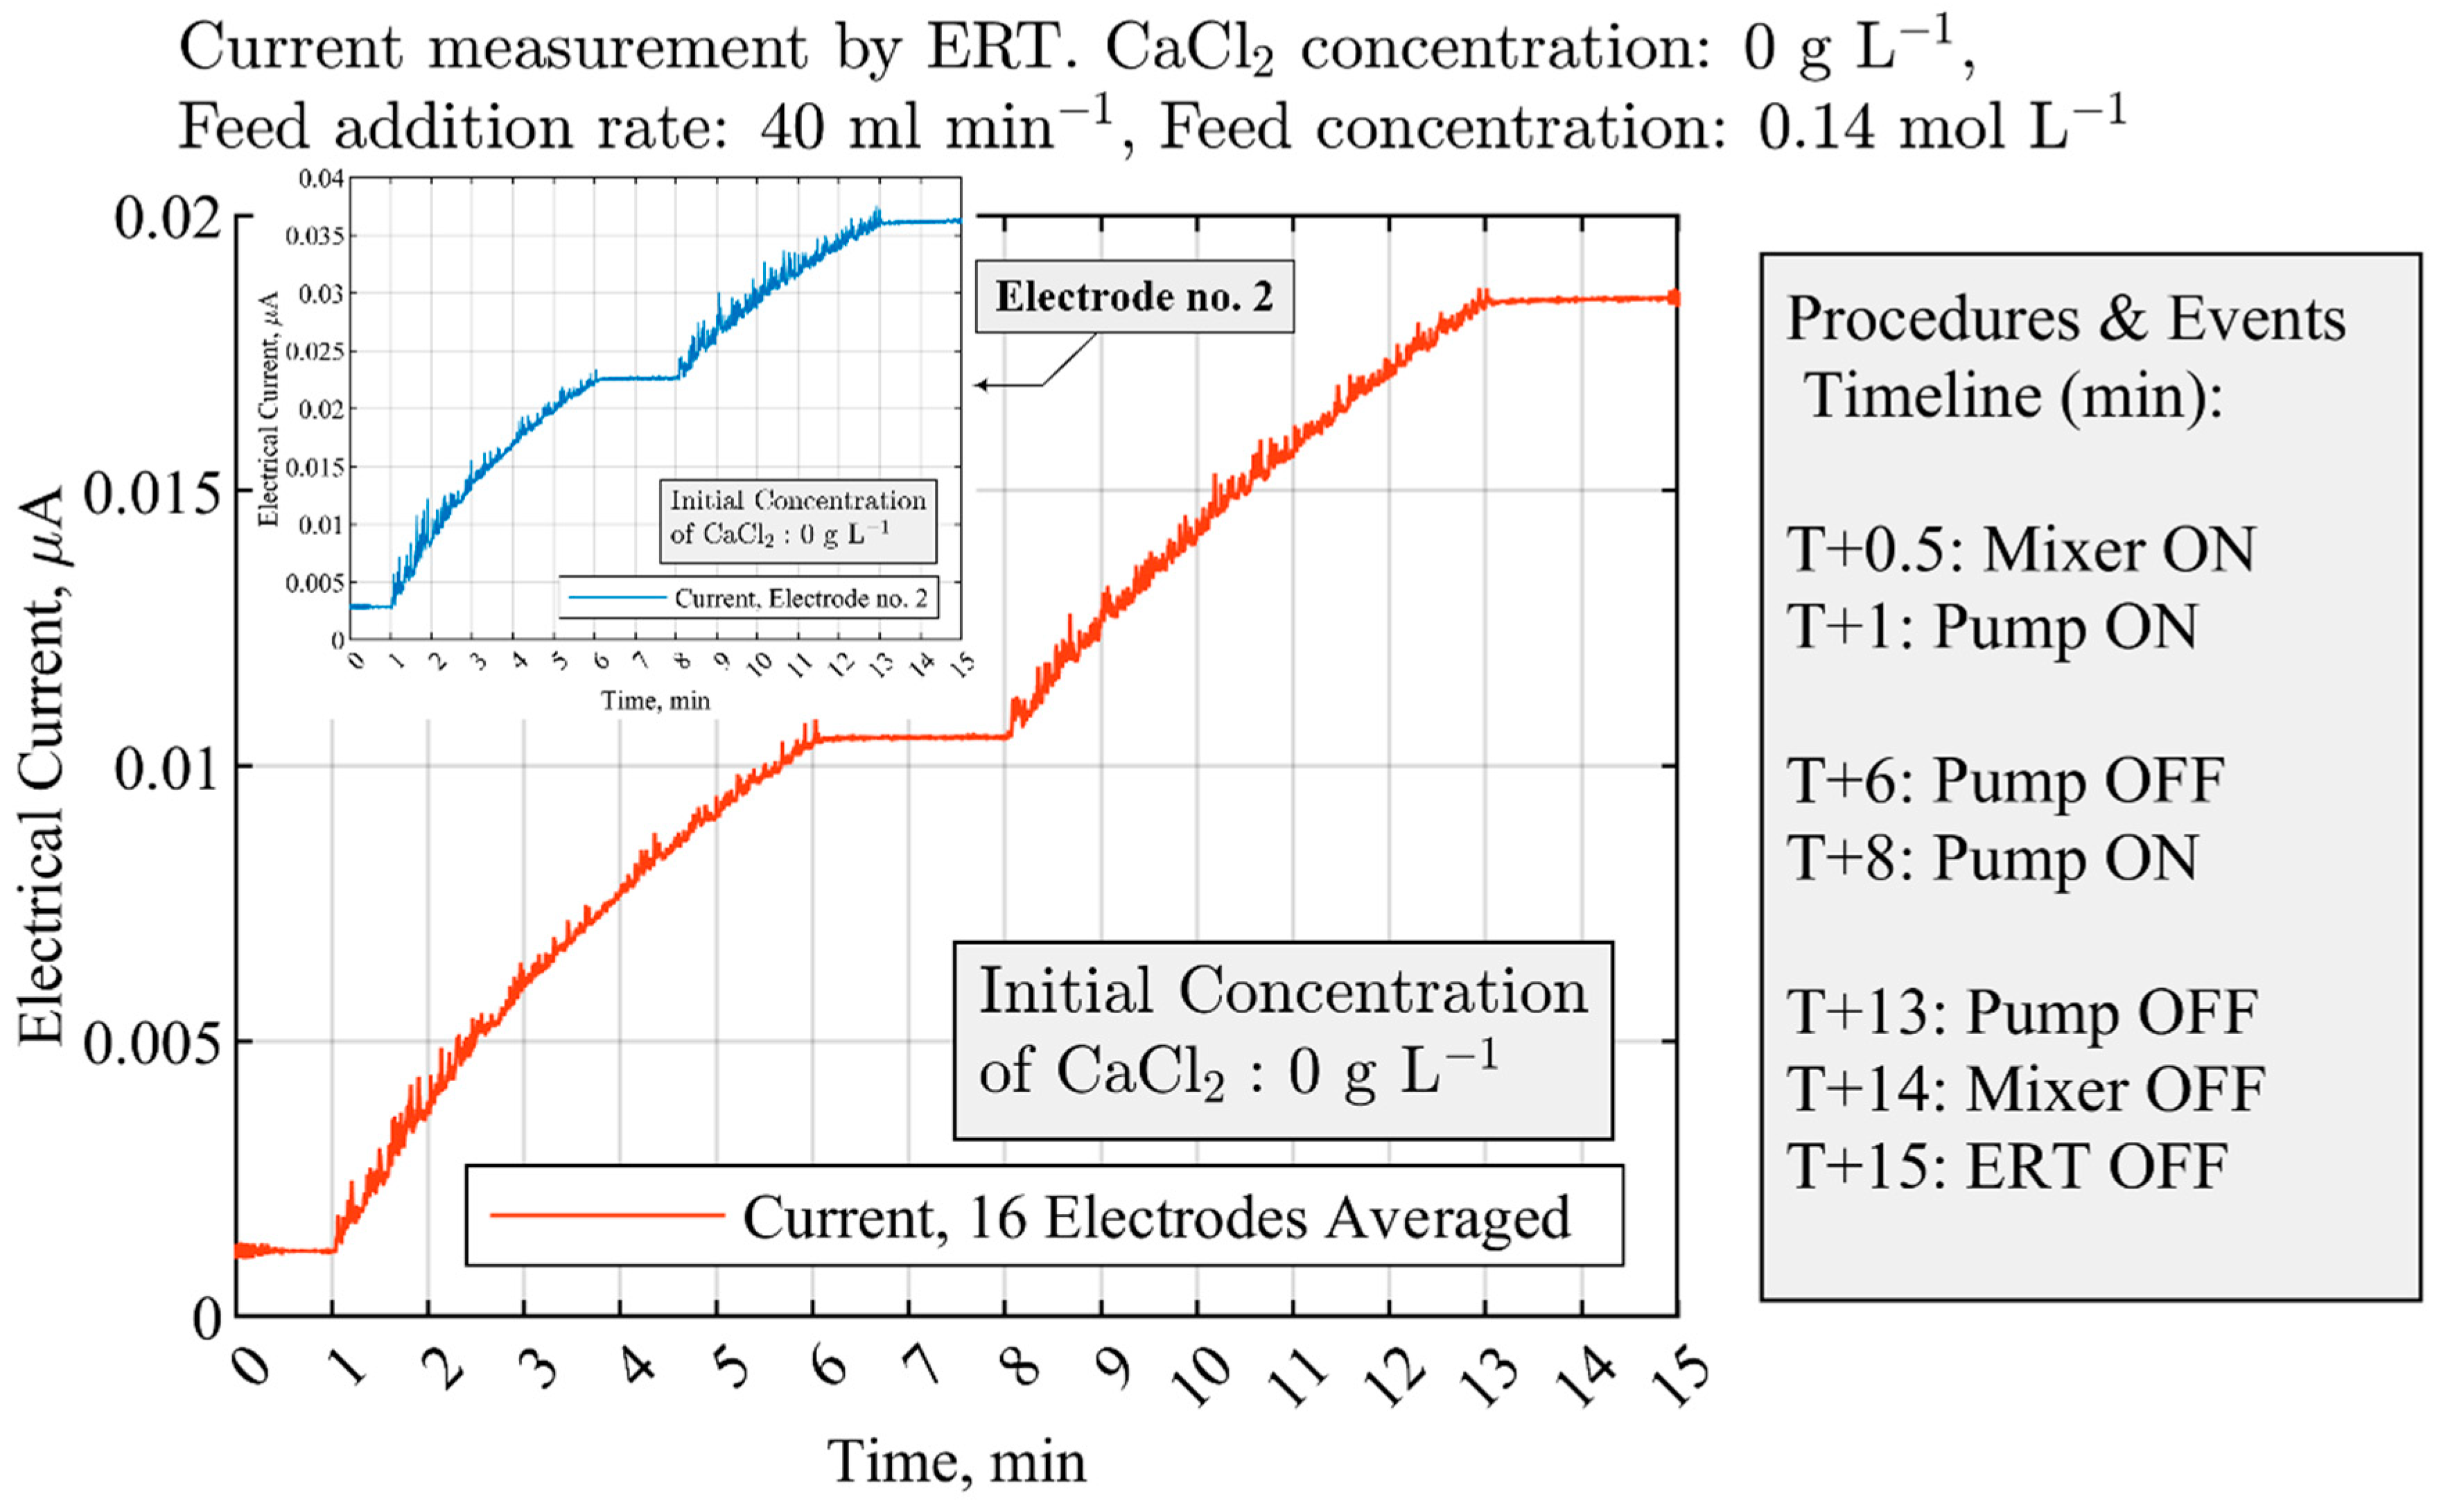
3.1. ERT Sensitivity Analysis and Sensor Selection
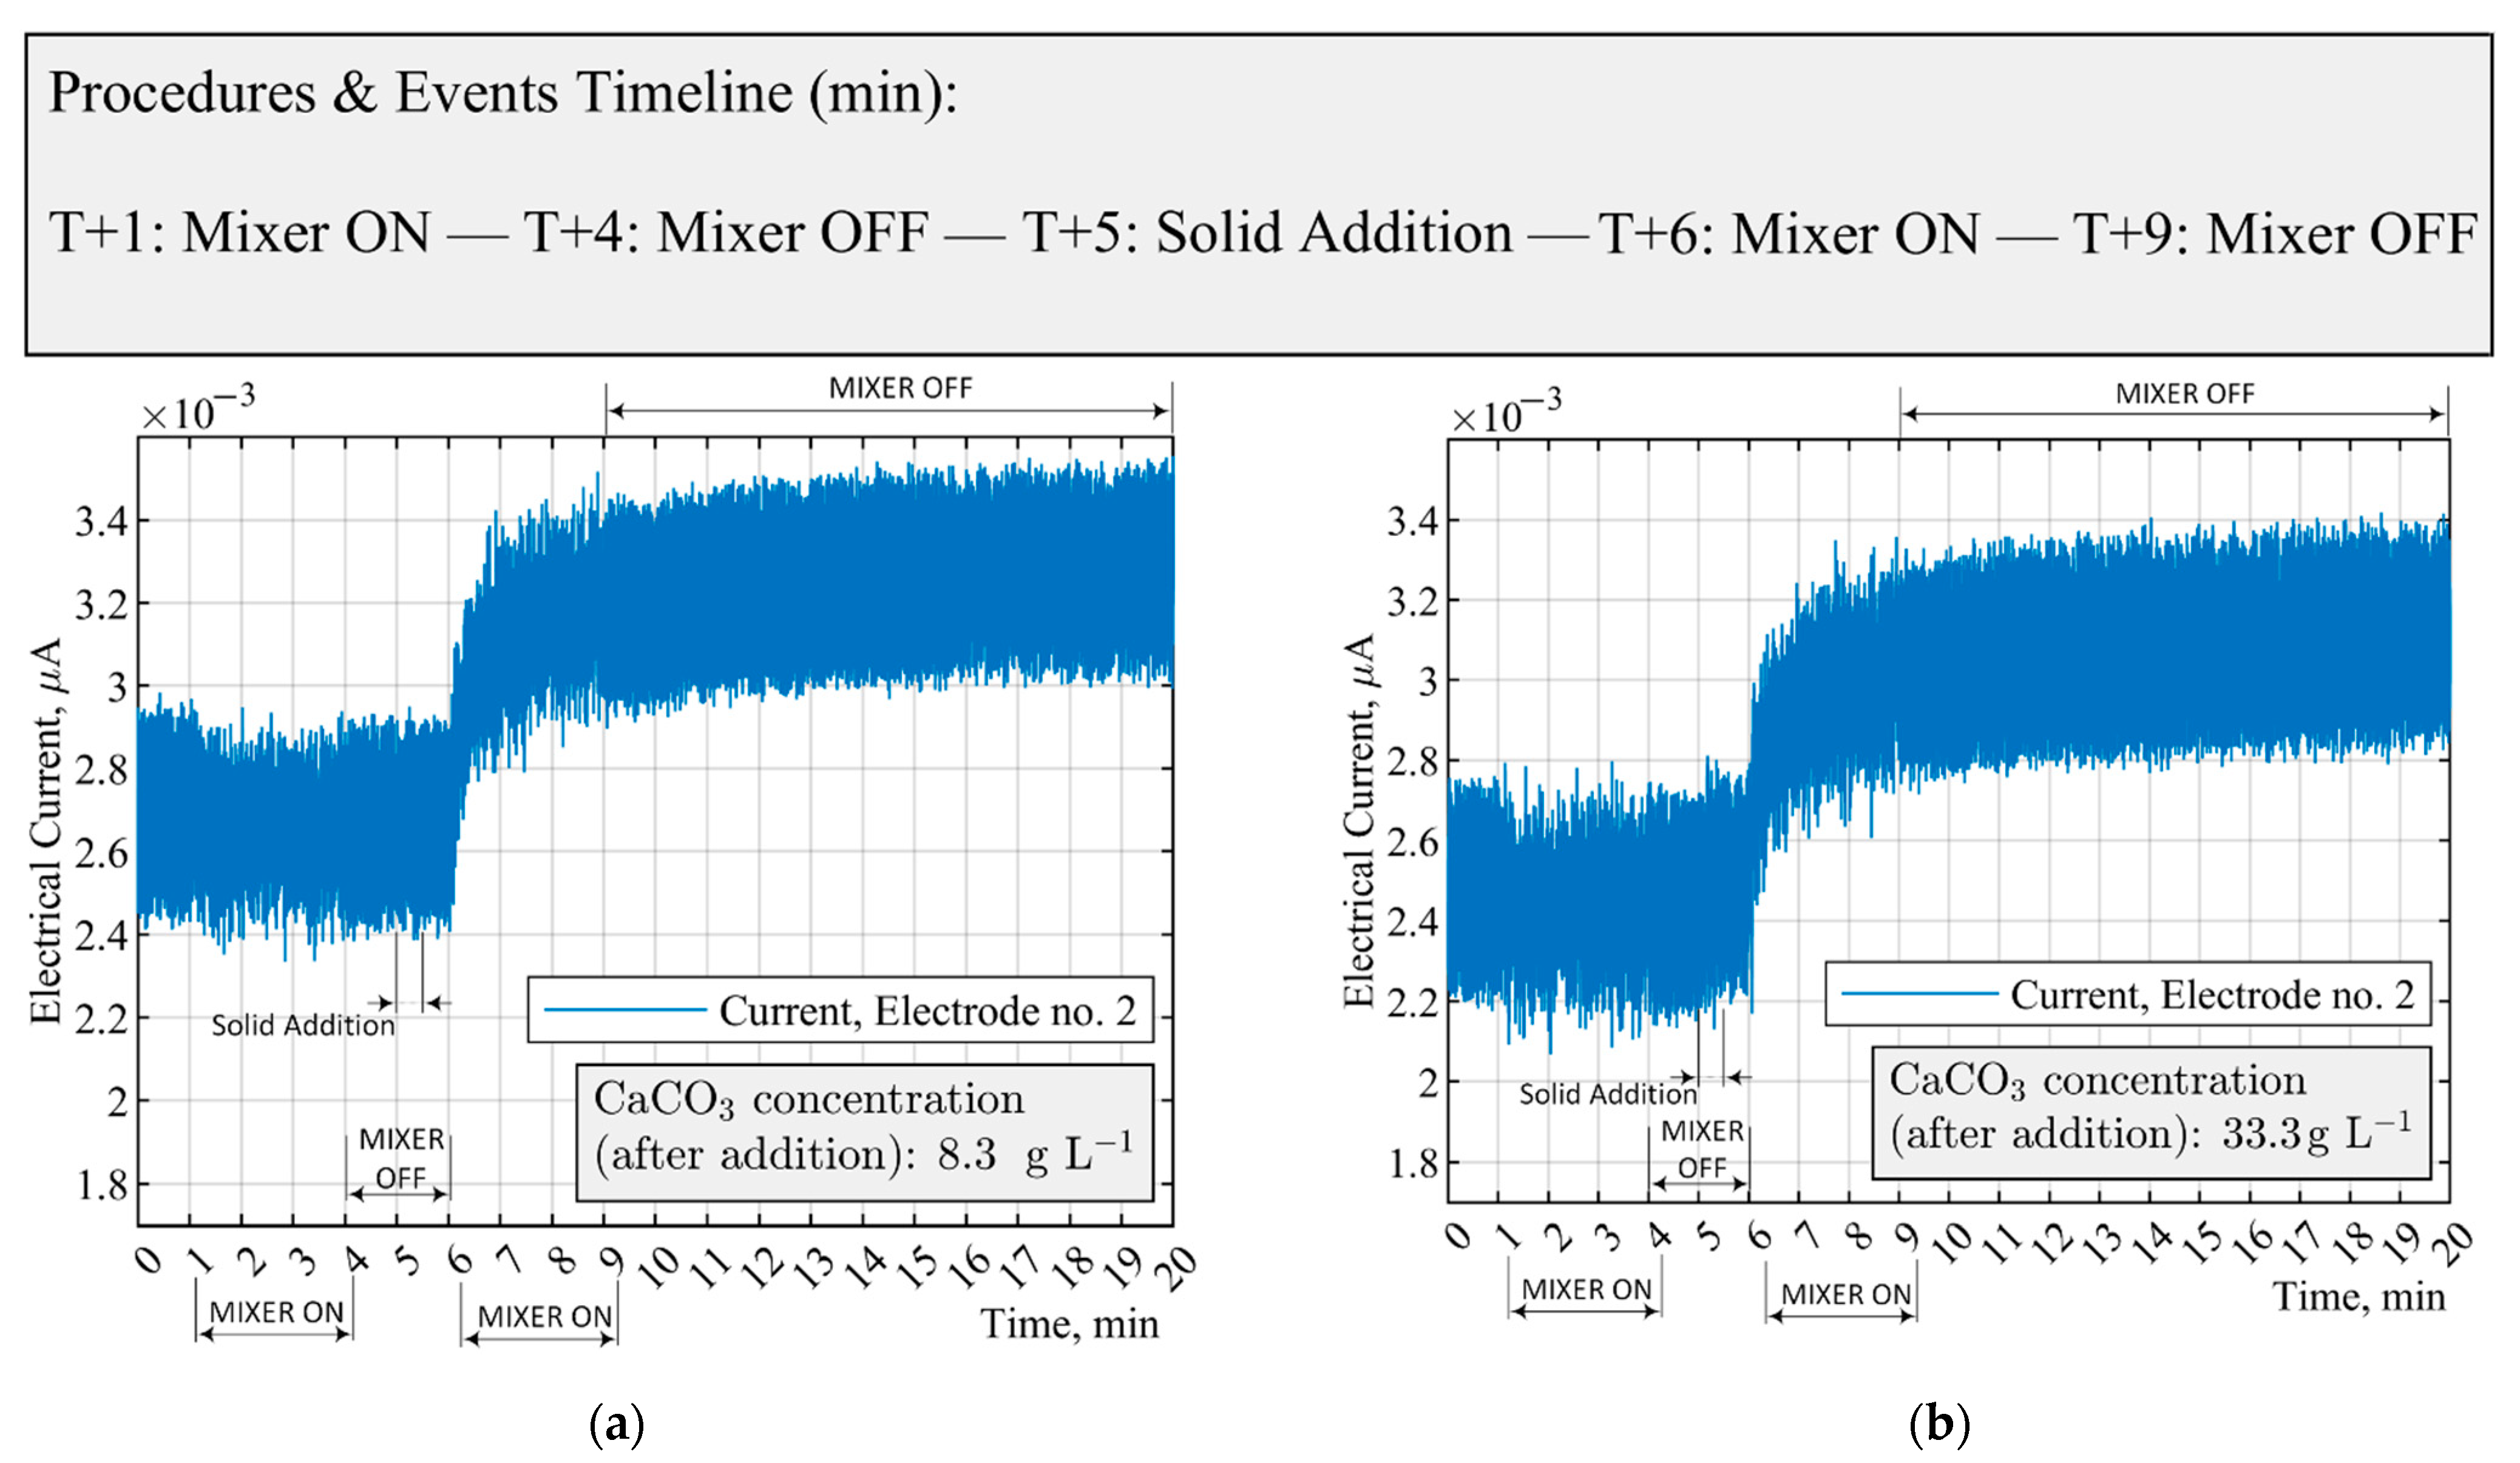
3.2. Measurements of CaCO3 Solid Particles Addition by ERT Electrodes
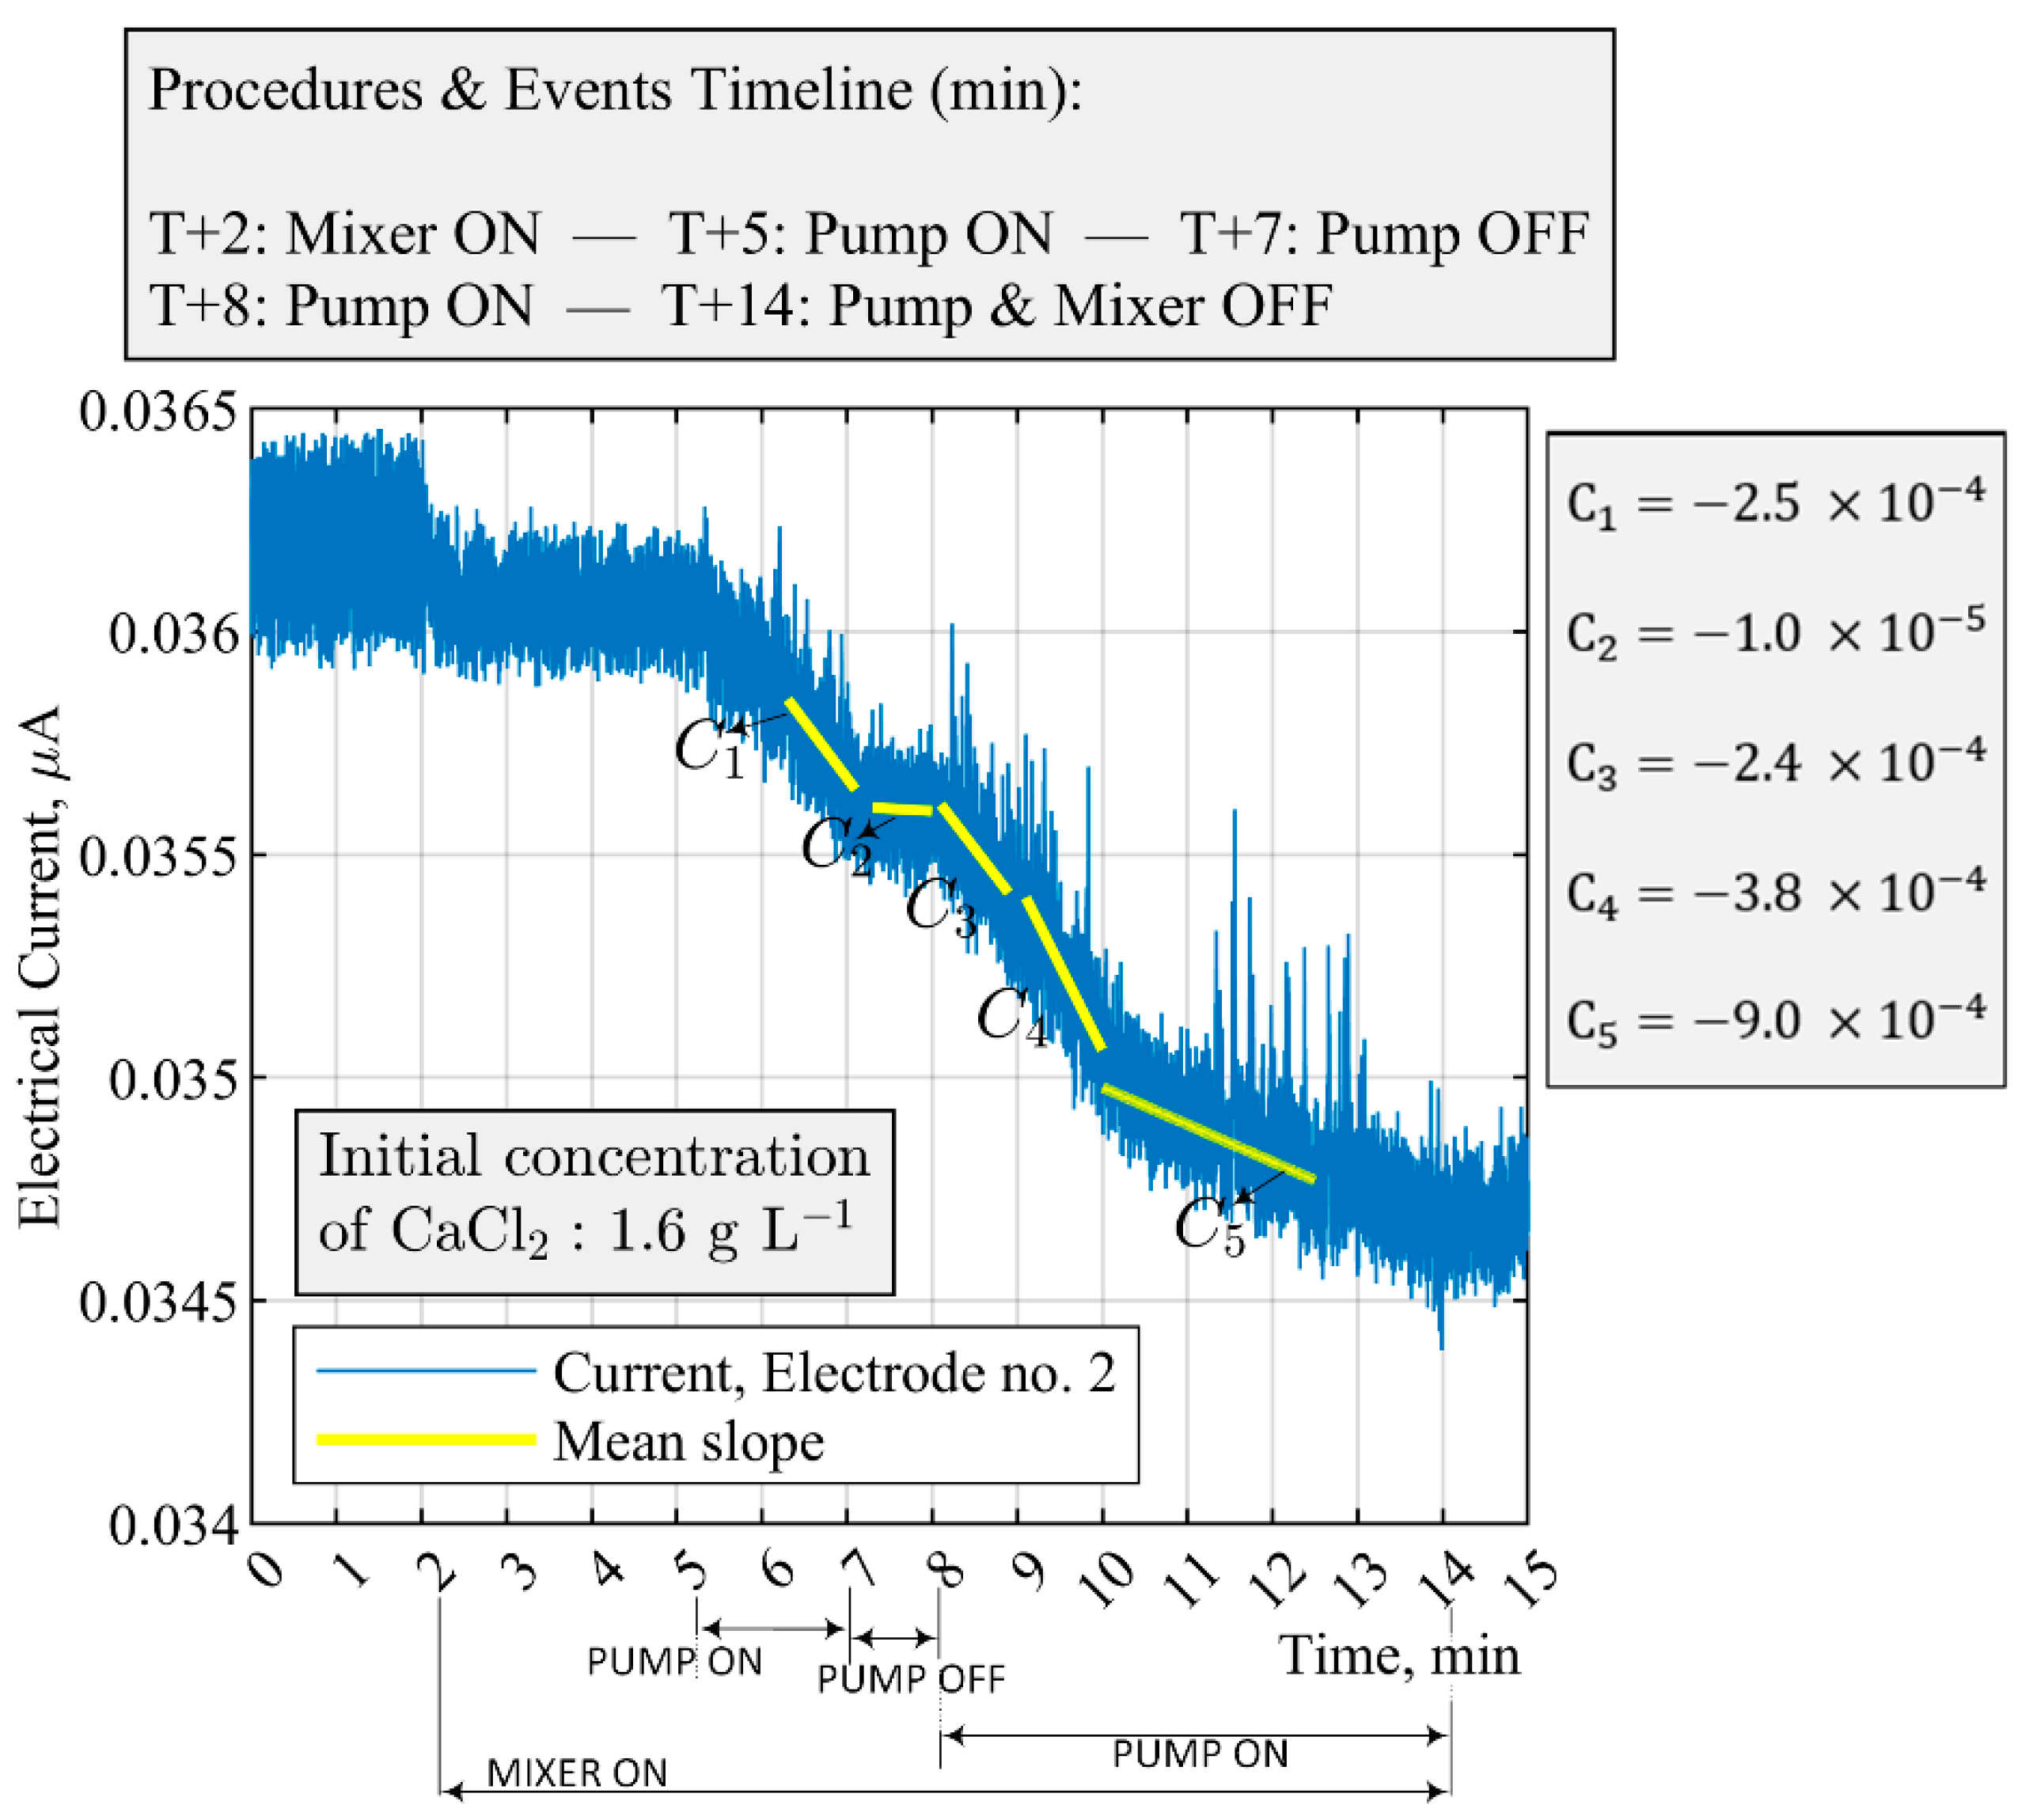
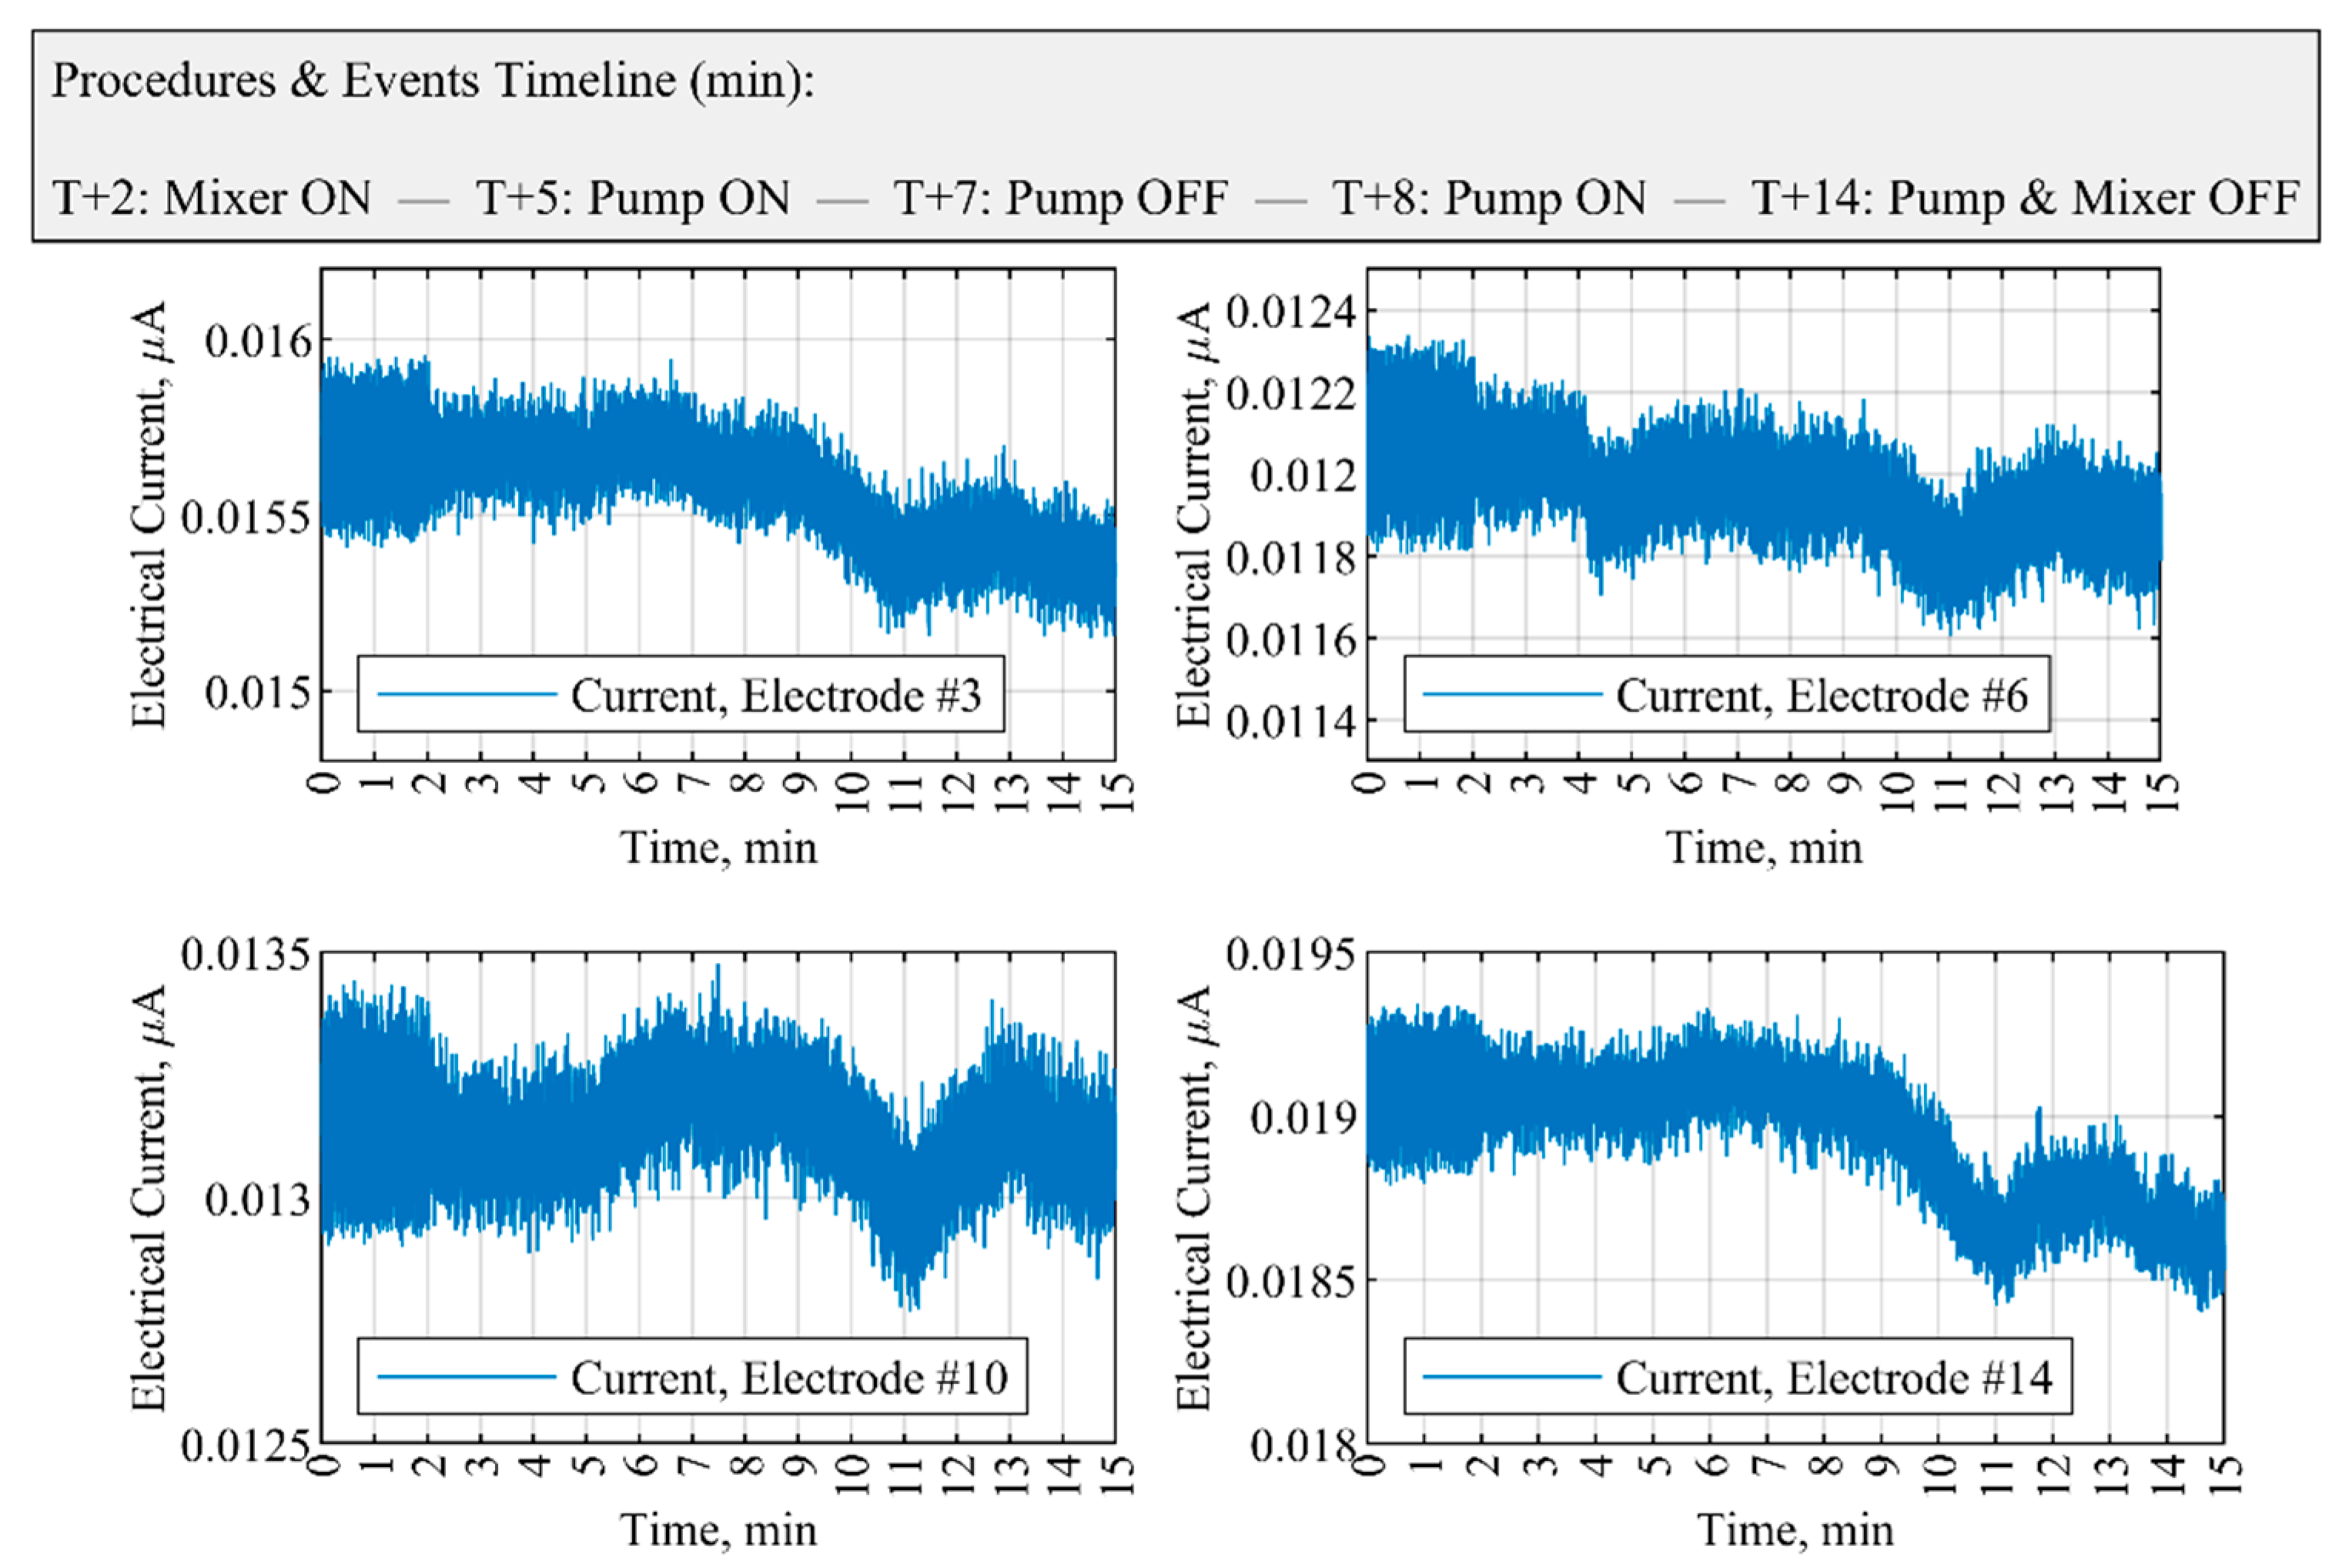
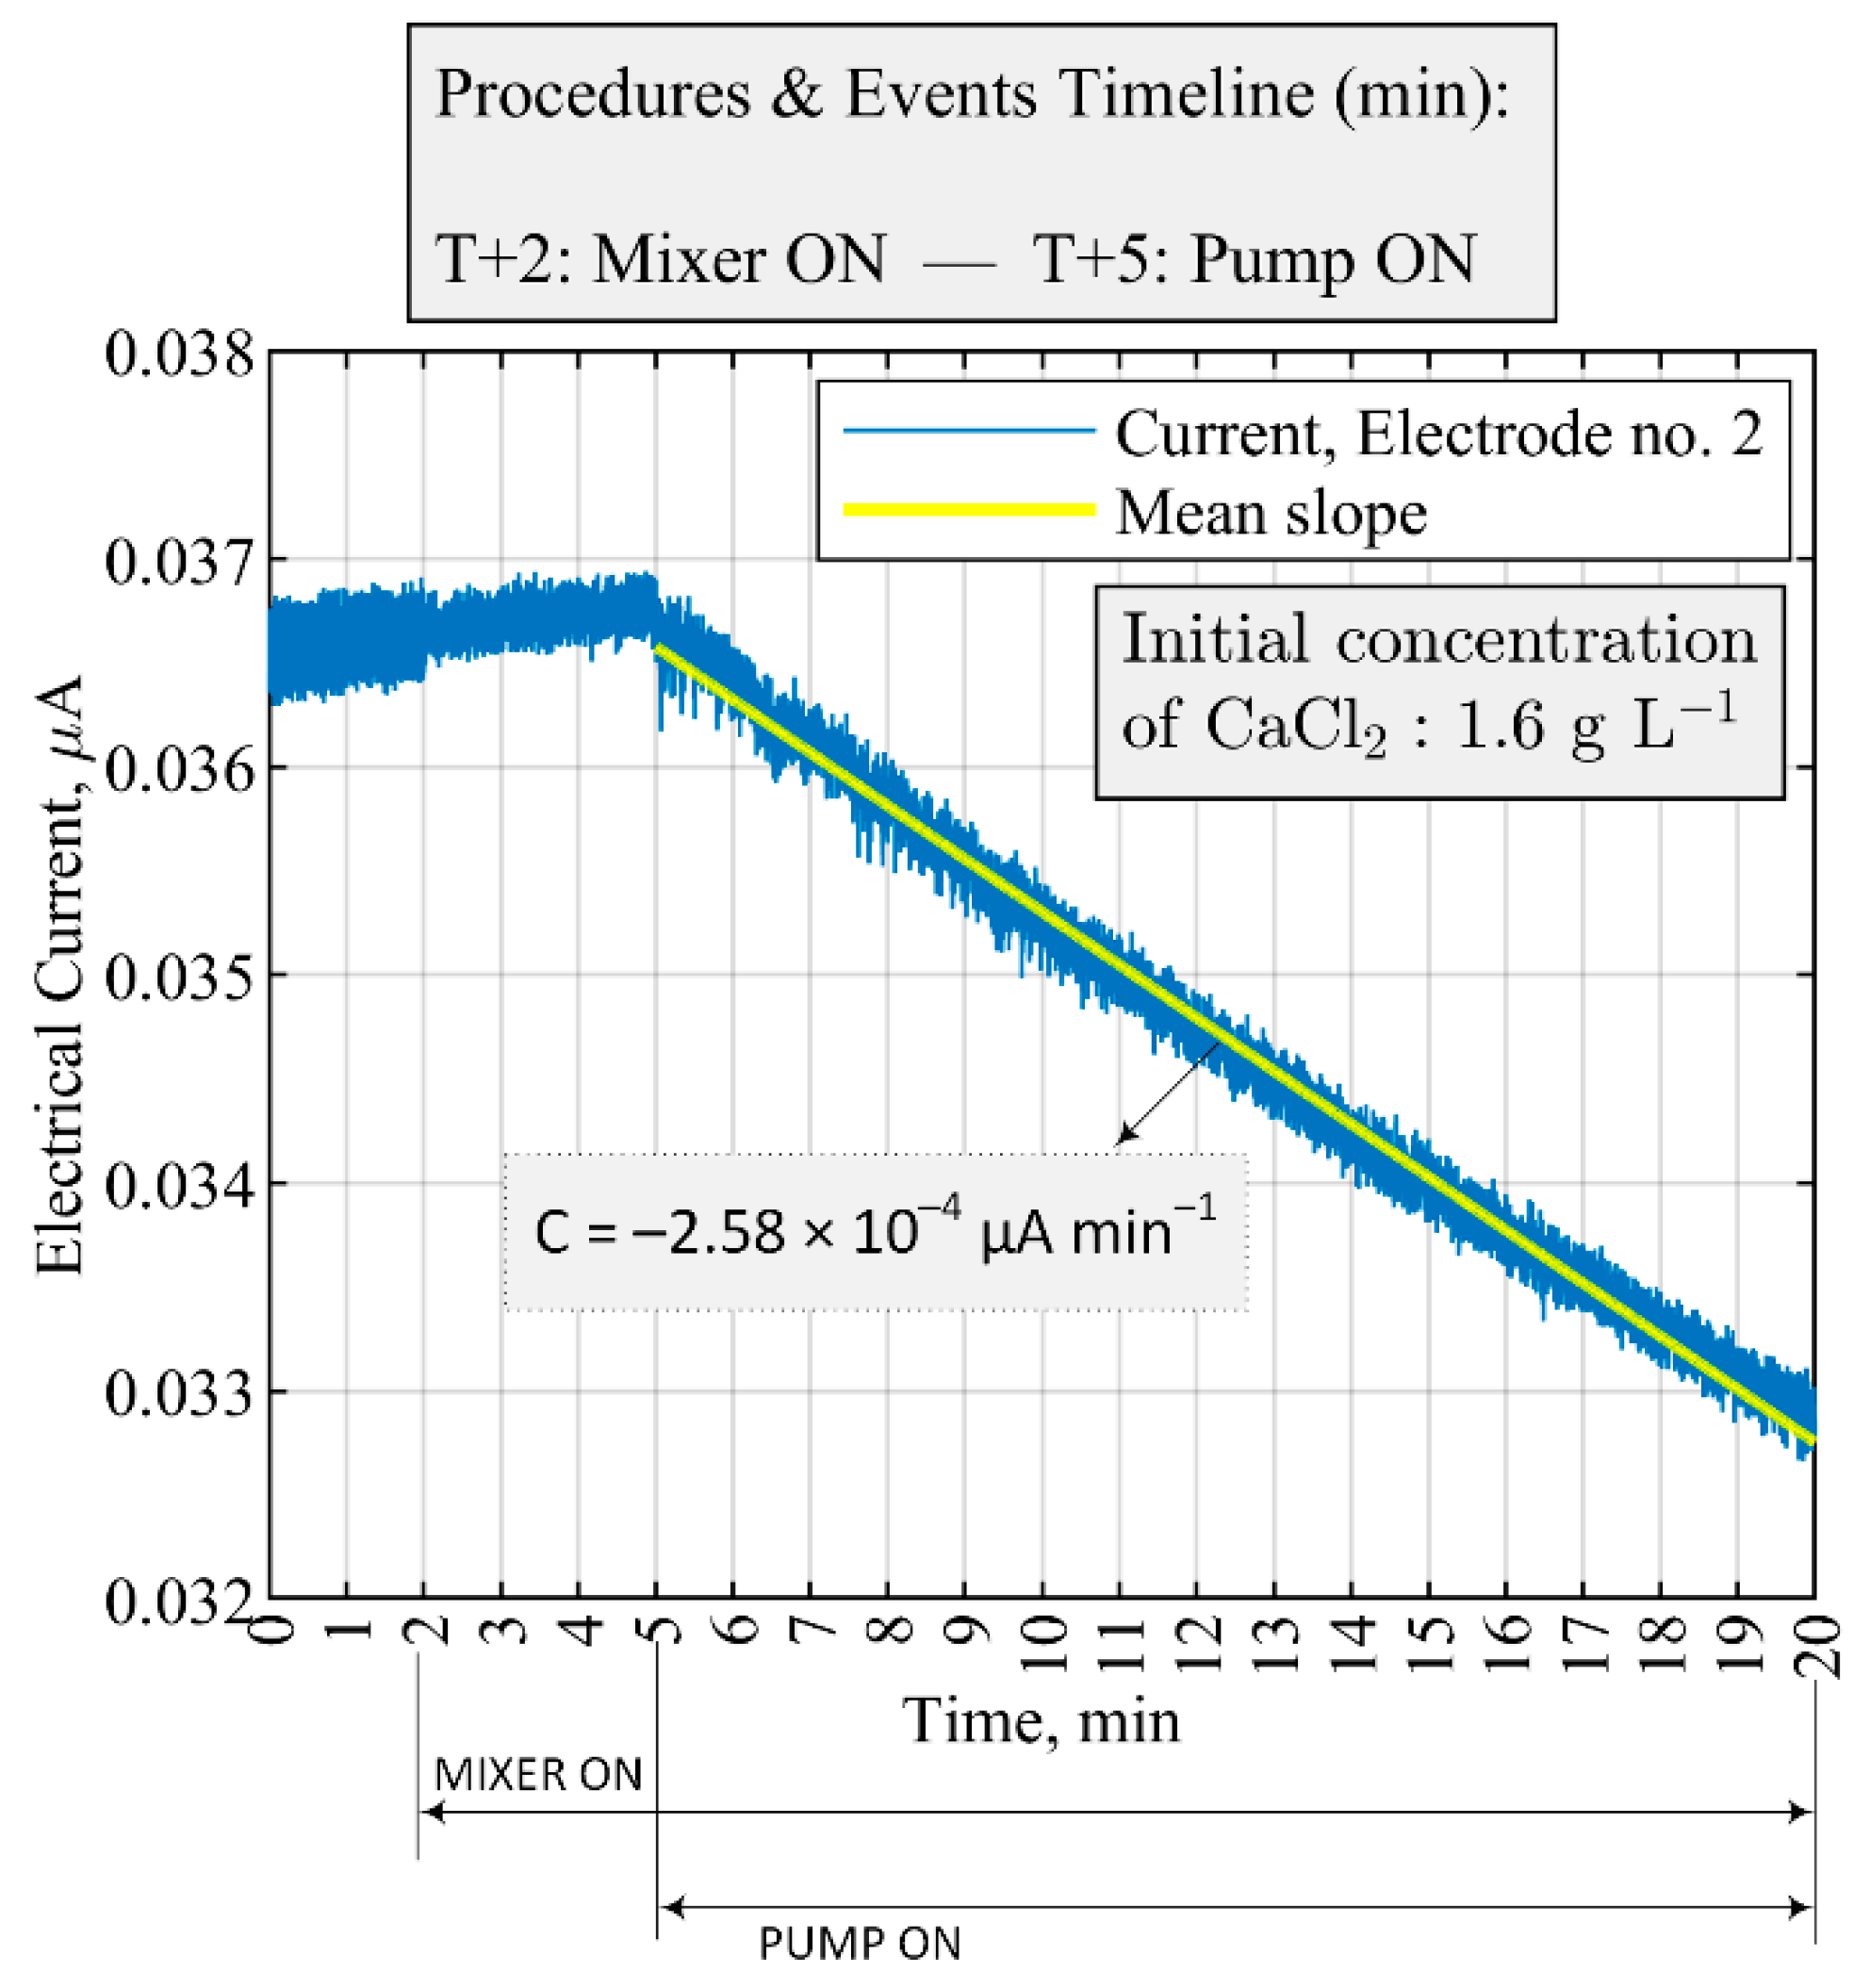
3.3. ERT-Based Fault Detection and Malfunction Scenarios
4. Conclusions
Author Contributions
Funding
Institutional Review Board Statement
Informed Consent Statement
Data Availability Statement
Conflicts of Interest
Appendix A

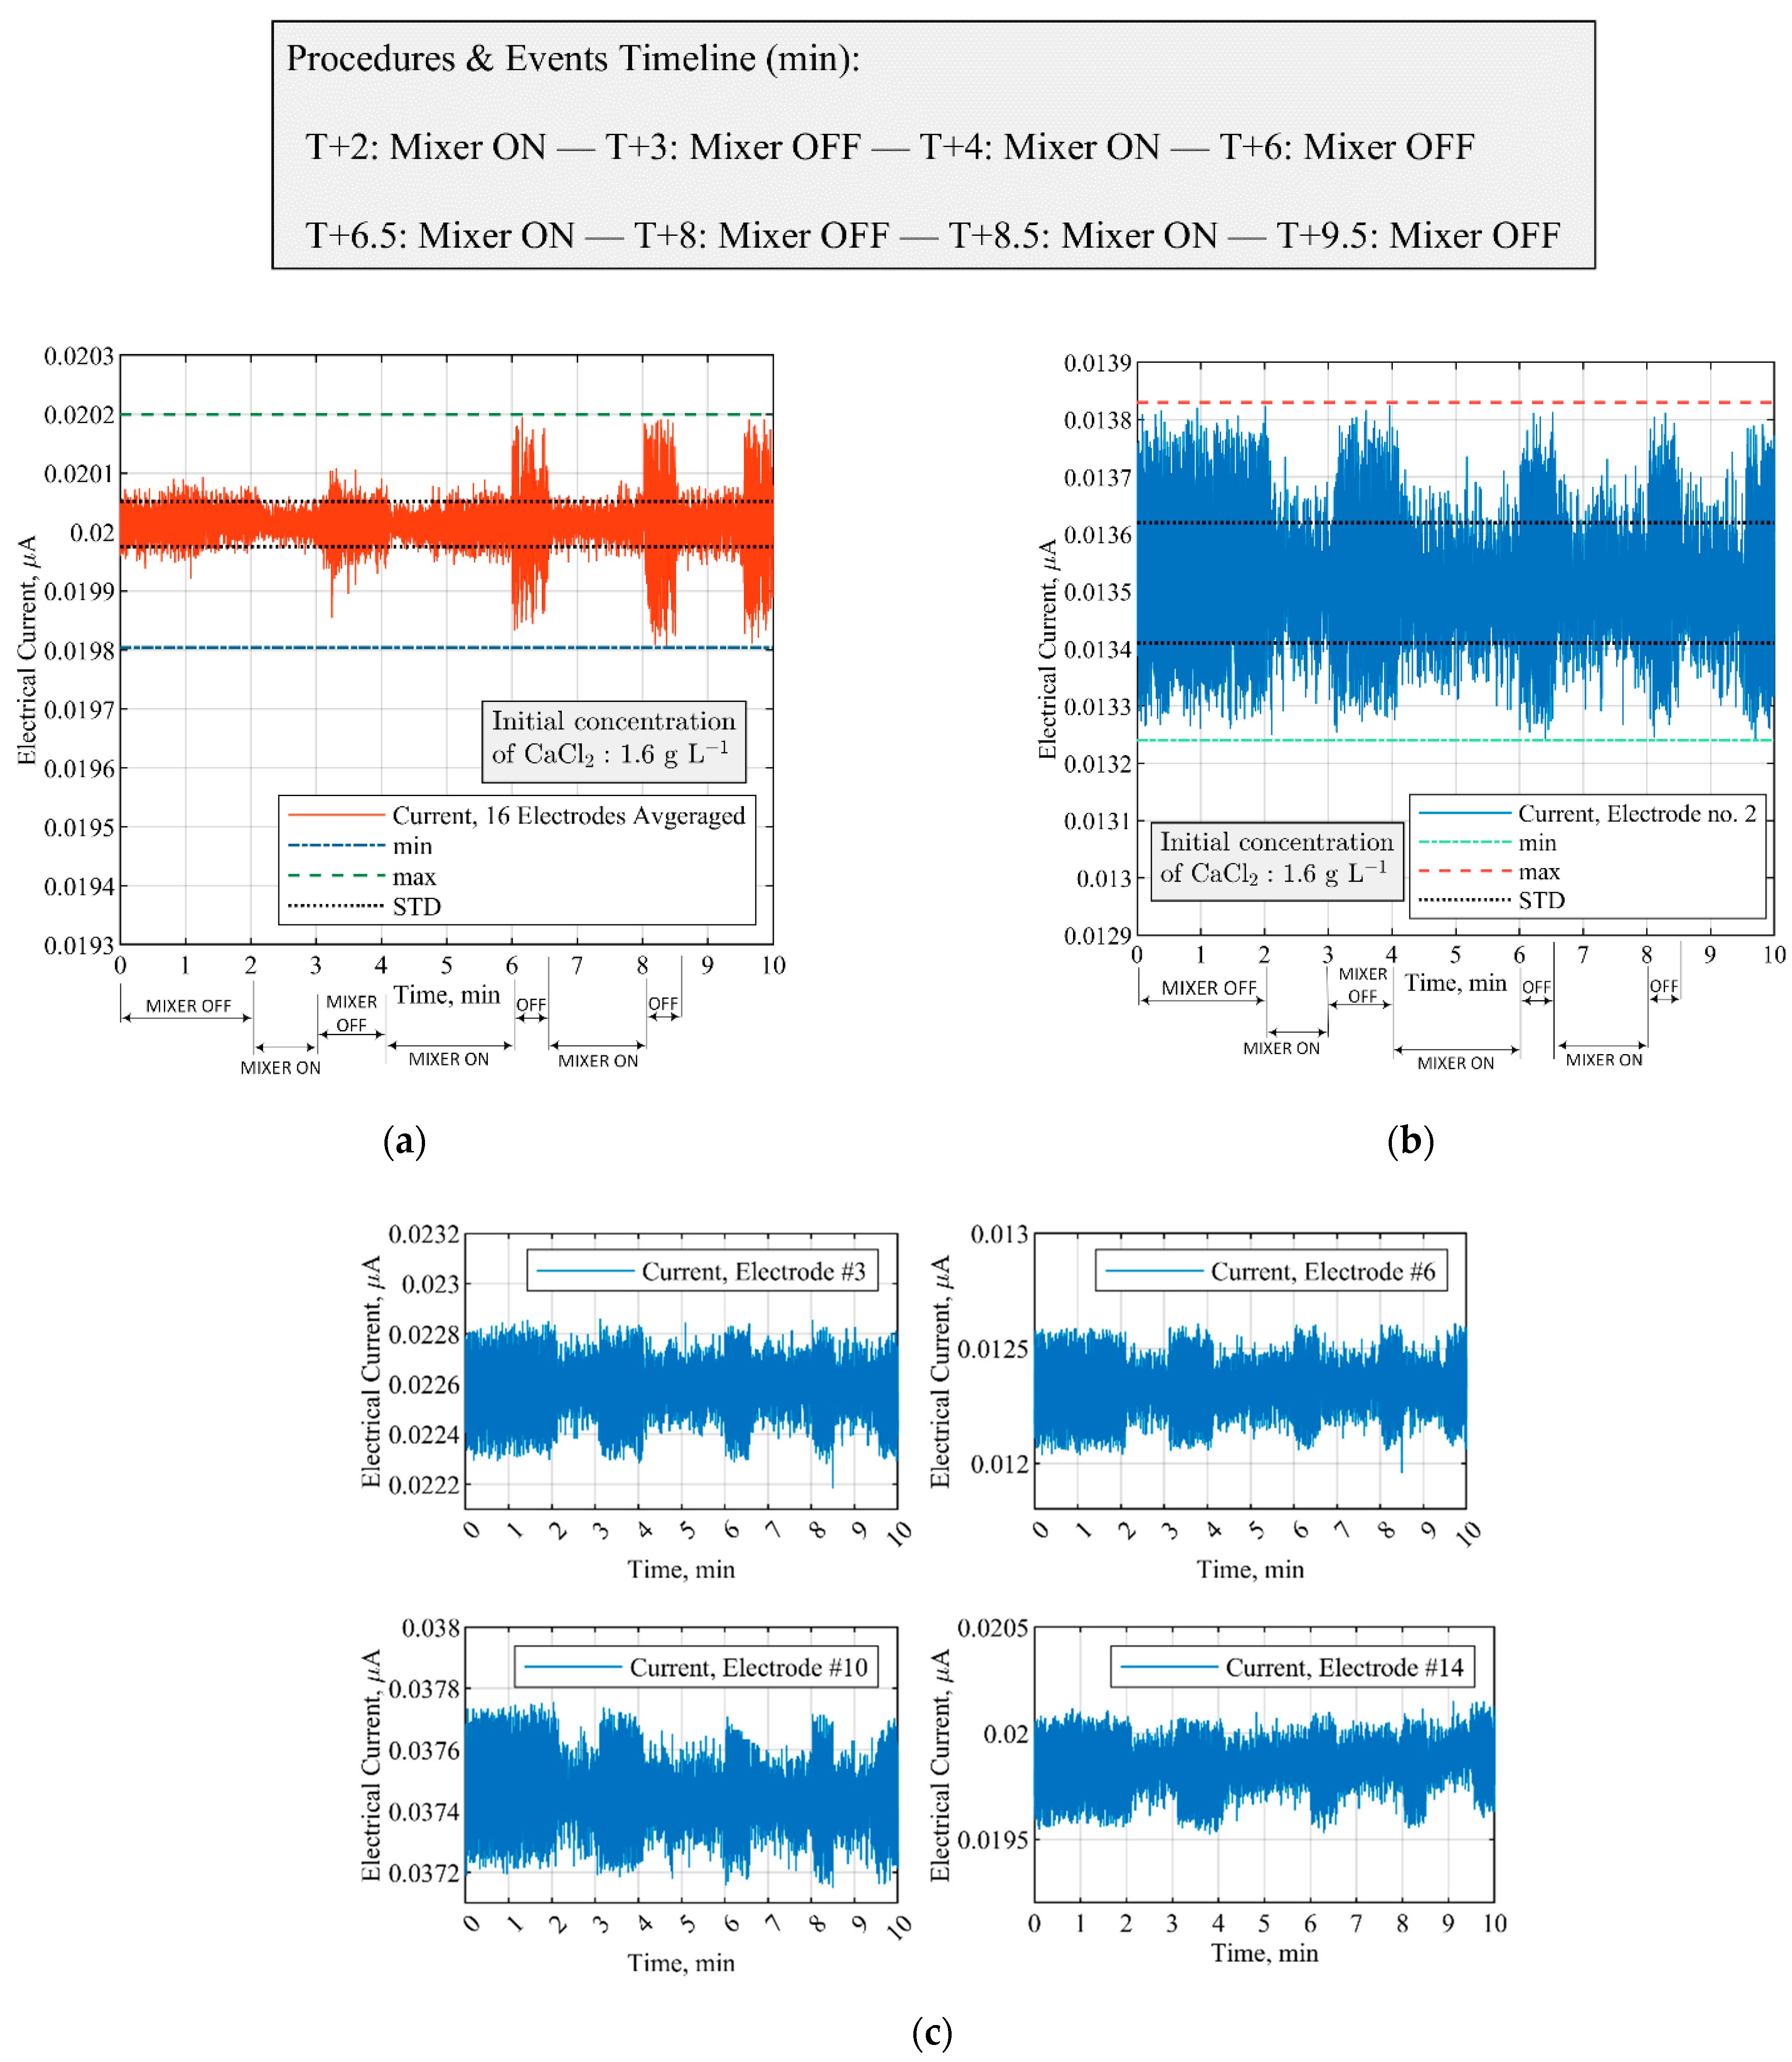
| 3–3.5 Min, (Mixer Off) | 5.5–6 Min | 6–6.5 Min, (Mixer Off) | 7.5–8 Min | 8–8.5 Min, (Mixer Off) | |
|---|---|---|---|---|---|
| Electrode Index | |||||
| 1 | 1.86 | 0.71 | 1.53 | 0.59 | 1.62 |
| 2 | 2.14 | 0.55 | 2.30 | 0.42 | 2.12 |
| 3 | 1.40 | 0.69 | 1.44 | 0.68 | 1.86 |
| 4 | 1.57 | 0.57 | 1.60 | 0.67 | 1.36 |
| 5 | 1.28 | 0.97 | 1.40 | 0.48 | 2.01 |
| 6 | 1.84 | 0.59 | 1.45 | 0.65 | 1.48 |
| 7 | 1.51 | 0.57 | 1.04 | 1.99 | 1.00 |
| 8 | 1.80 | 0.55 | 1.59 | 0.89 | 1.08 |
| 9 | 0.56 | 2.26 | 1.61 | 0.75 | 1.32 |
| 10 | 1.62 | 0.52 | 1.58 | 0.68 | 1.87 |
| 11 | 1.39 | 0.64 | 1.25 | 0.67 | 1.86 |
| 12 | 1.66 | 0.66 | 1.56 | 0.61 | 1.73 |
| 13 | 1.55 | 0.79 | 1.61 | 0.64 | 1.56 |
| 14 | 1.13 | 0.84 | 1.43 | 0.55 | 1.56 |
| 15 | 1.52 | 0.73 | 1.54 | 0.73 | 1.45 |
| 16 | 1.60 | 0.61 | 1.79 | 0.54 | 1.58 |
References
- Sholl, D.S.; Lively, R.P. Seven chemical separations to change the world. Nat. Cell Biol. 2016, 532, 435–437. [Google Scholar] [CrossRef]
- McDonald, M.A.; Salami, H.; Harris, P.R.; Lagerman, C.E.; Yang, X.; Bommarius, A.S.; Grover, M.A.; Rousseau, R.W. Reactive Crystallization: A Review. React. Chem. Eng. 2021, 6, 364–400. [Google Scholar] [CrossRef]
- Nagy, Z.K.; Fujiwara, M.; Braatz, R.D. Monitoring and advanced control of crystallization processes. In Handbook of Industrial Crystallization; Cambridge University Press: Cambridge, UK, 2019; pp. 313–345. [Google Scholar]
- Karpiński, P.H.; Bałdyga, J. Precipitation processes. In Handbook of Industrial Crystallization; Cambridge University Press: Cambridge, UK, 2019; pp. 216–265. ISBN 9781139026949. [Google Scholar]
- Simone, E.; Zhang, W.; Nagy, Z.K. Application of Process Analytical Technology-Based Feedback Control Strategies To Improve Purity and Size Distribution in Biopharmaceutical Crystallization. Cryst. Growth Des. 2015, 15, 2908–2919. [Google Scholar] [CrossRef]
- Zhang, T.; Nagy, B.; Szilágyi, B.; Gong, J.; Nagy, Z.K. Simulation and experimental investigation of a novel supersaturation feedback control strategy for cooling crystallization in semi-batch implementation. Chem. Eng. Sci. 2020, 225, 115807. [Google Scholar] [CrossRef]
- Simon, L.L.; Simone, E.; Oucherif, K.A. Crystallization process monitoring and control using process analytical technology. In Computer Aided Chemical Engineering; Elsevier: Cham, Switzerland, 2018; pp. 215–242. [Google Scholar]
- Rao, G.; Aghajanian, S.; Koiranen, T.; Wajman, R.; Jackowska-Strumiłło, L. Process Monitoring of Antisolvent Based Crystallization in Low Conductivity Solutions Using Electrical Impedance Spectroscopy and 2-D Electrical Resistance Tomography. Appl. Sci. 2020, 10, 3903. [Google Scholar] [CrossRef]
- Koulountzios, P.; Rymarczyk, T.; Soleimani, M. Ultrasonic Time-of-Flight Computed Tomography for Investigation of Batch Crystallisation Processes. Sensors 2021, 21, 639. [Google Scholar] [CrossRef] [PubMed]
- Hampel, U. Editorial for special issue on process tomography in flow measurement and instrumentation. Flow Meas. Instrum. 2017, 53, 1–3. [Google Scholar] [CrossRef]
- Diez-Olivan, A.; Del Ser, J.; Galar, D.; Sierra, B. Data fusion and machine learning for industrial prognosis: Trends and perspectives towards Industry 4.0. Inf. Fusion 2019, 50, 92–111. [Google Scholar] [CrossRef]
- Zhang, Y.; Omrani, A.; Yadav, R.; Fjeld, M. Supporting Visualization Analysis in Industrial Process Tomography by Using Augmented Reality—A Case Study of an Industrial Microwave Drying System. Sensors 2021, 21, 6515. [Google Scholar] [CrossRef] [PubMed]
- Bowler, A.; Bakalis, S.; Watson, N.J. A review of in-line and on-line measurement techniques to monitor industrial mixing processes. Chem. Eng. Res. Des. 2020, 153, 463–495. [Google Scholar] [CrossRef]
- Qin, S.J.; Chiang, L.H. Advances and opportunities in machine learning for process data analytics. Comput. Chem. Eng. 2019, 126, 465–473. [Google Scholar] [CrossRef]
- Wang, M. Imaging fluid mixing. In Pharmaceutical Blending and Mixing; John Wiley & Sons, Ltd.: Chichester, UK, 2015; pp. 431–457. [Google Scholar]
- Rao, G.; Sattar, M.; Wajman, R.; Jackowska-Strumiłło, L. Quantitative Evaluations with 2d Electrical Resistance Tomography in the Low-Conductivity Solutions Using 3d-Printed Phantoms and Sucrose Crystal Agglomerate Assessments. Sensors 2021, 21, 564. [Google Scholar] [CrossRef]
- Maluta, F.; Montante, G.; Paglianti, A. Analysis of immiscible liquid-liquid mixing in stirred tanks by Electrical Resistance Tomography. Chem. Eng. Sci. 2020, 227, 115898. [Google Scholar] [CrossRef]
- Harrison, S.; Kotsiopoulos, A.; Stevenson, R.; Cilliers, J. Mixing indices allow scale-up of stirred tank slurry reactor conditions for equivalent homogeneity. Chem. Eng. Res. Des. 2019, 153, 865–874. [Google Scholar] [CrossRef]
- Kazemzadeh, A.; Ein-Mozaffari, F.; Lohi, A.; Pakzad, L. A New Perspective in the Evaluation of the Mixing of Biopolymer Solutions with Different Coaxial Mixers Comprising of Two Dispersing Impellers and a Wall Scraping Anchor. Chem. Eng. Res. Des. 2016, 114, 202–219. [Google Scholar] [CrossRef]
- Hashemi, N.; Ein-Mozaffari, F.; Upreti, S.R.; Hwang, D.K. Analysis of mixing in an aerated reactor equipped with the coaxial mixer through electrical resistance tomography and response surface method. Chem. Eng. Res. Des. 2016, 109, 734–752. [Google Scholar] [CrossRef]
- Forte, G.; Alberini, F.; Simmons, M.J.H.; Stitt, E.H. Measuring Gas Hold-up in Gas–Liquid/Gas–Solid–Liquid Stirred Tanks with an Electrical Resistance Tomography Linear Probe. AIChE J. 2019, 65, e16586. [Google Scholar] [CrossRef] [Green Version]
- Han, M.; González, G.; Vauhkonen, M.; Laari, A.; Koiranen, T. Local gas distribution and mass transfer characteristics in an annulus-rising airlift reactor with non-Newtonian fluid. Chem. Eng. J. 2017, 308, 929–939. [Google Scholar] [CrossRef]
- Kagoshima, M.; Mann, R. Interactions of Precipitation and Fluid Mixing with Model Validation by Electrical Tomography. Chem. Eng. Res. Des. 2005, 83, 806–810. [Google Scholar] [CrossRef]
- Gradov, D.V.; González, G.; Vauhkonen, M.; Laari, A.; Koiranen, T. Experimental investigation of reagent feeding point location in a semi-batch precipitation process. Chem. Eng. Sci. 2018, 190, 361–369. [Google Scholar] [CrossRef]
- Alberini, F.; Bezchi, D.; Mannino, I.; Paglianti, A.; Montante, G. Towards real time monitoring of reacting species and pH coupling electrical resistance tomography and machine learning methodologies. Chem. Eng. Res. Des. 2021, 168, 369–382. [Google Scholar] [CrossRef]
- Zhang, J.; Luo, W.; Dai, Y. Integrated Diagnostic Framework for Process and Sensor Faults in Chemical Industry. Sensors 2021, 21, 822. [Google Scholar] [CrossRef]
- Khakzad, N.; Khan, F.; Amyotte, P. Safety analysis in process facilities: Comparison of fault tree and Bayesian network approaches. Reliab. Eng. Syst. Saf. 2011, 96, 925–932. [Google Scholar] [CrossRef]
- Adedigba, S.A.; Khan, F.; Yang, M. Dynamic Failure Analysis of Process Systems Using Principal Component Analysis and Bayesian Network. Ind. Eng. Chem. Res. 2017, 56, 2094–2106. [Google Scholar] [CrossRef]
- Bobbio, A.; Portinale, L.; Minichino, M.; Ciancamerla, E. Improving the analysis of dependable systems by mapping fault trees into Bayesian networks. Reliab. Eng. Syst. Saf. 2001, 71, 249–260. [Google Scholar] [CrossRef]
- Darmana, D.; Henket, R.L.B.; Deen, N.G.; Kuipers, J.A.M. Detailed Modelling of Hydrodynamics, Mass Transfer and Chemical Reactions in a Bubble Column Using a Discrete Bubble Model: Chemisorption of CO2 into NaOH Solution, Numerical and Experimental Study. Chem. Eng. Sci. 2007, 62, 2556–2575. [Google Scholar] [CrossRef]
- Yoo, M.; Han, S.-J.; Wee, J.-H. Carbon dioxide capture capacity of sodium hydroxide aqueous solution. J. Environ. Manag. 2013, 114, 512–519. [Google Scholar] [CrossRef] [PubMed]
- Kipping, R.; Kryk, H.; Schleicher, E.; Gustke, M.; Hampel, U. Application of a Wire-Mesh Sensor for the Study of Chemical Species Conversion in a Bubble Column. Chem. Eng. Technol. 2017, 40, 1425–1433. [Google Scholar] [CrossRef]
- Nieminen, H.; Järvinen, L.; Ruuskanen, V.; Laari, A.; Koiranen, T.; Ahola, J. Insights into a membrane contactor based demonstration unit for CO2 capture. Sep. Purif. Technol. 2020, 231, 115951. [Google Scholar] [CrossRef]
- Aghajanian, S.; Nieminen, H.; Laari, A.; Koiranen, T. Integration of a calcium carbonate crystallization process and membrane contactor–based CO2 capture. Sep. Purif. Technol. 2021, 274, 119043. [Google Scholar] [CrossRef]
- Jakobsen, H.A. Agitation and fluid mixing technology. In Chemical Reactor Modeling; Springer International Publishing: Cham, Switzerland, 2014. [Google Scholar]
- Sutudehnezhad, N.; Zadghaffari, R. CFD Analysis and Design Optimization in a Curved Blade Impeller. Int. J. Chem. React. Eng. 2017, 15. [Google Scholar] [CrossRef]


| Equipment | Parameter | Threshold Value | The Time Difference for Moving Average, s |
|---|---|---|---|
| Mixer | 20 | ||
| Pump | 30 |
| Parameter | Unit | Value |
|---|---|---|
| concentrations | 0, 1.6, 3.3, and 6.6 | |
| NaOH concentration at the feed | 12.1 ± 0.05 | |
| concentration at the feed | 0.14 ± 0.2 | |
| Impeller pumping capacity | 0.004 | |
| Impeller pumping number | – | 0.70 |
| Impeller diameter | m | 0.07 |
| Stirring rate | rps | 1.67 |
| Impeller tip speed | 0.37 |
| Experiment Index | Constantly Operational | Malfunction(s) during the Process |
|---|---|---|
| Case no. 1 | Pump ON | Mixer ON and OFF |
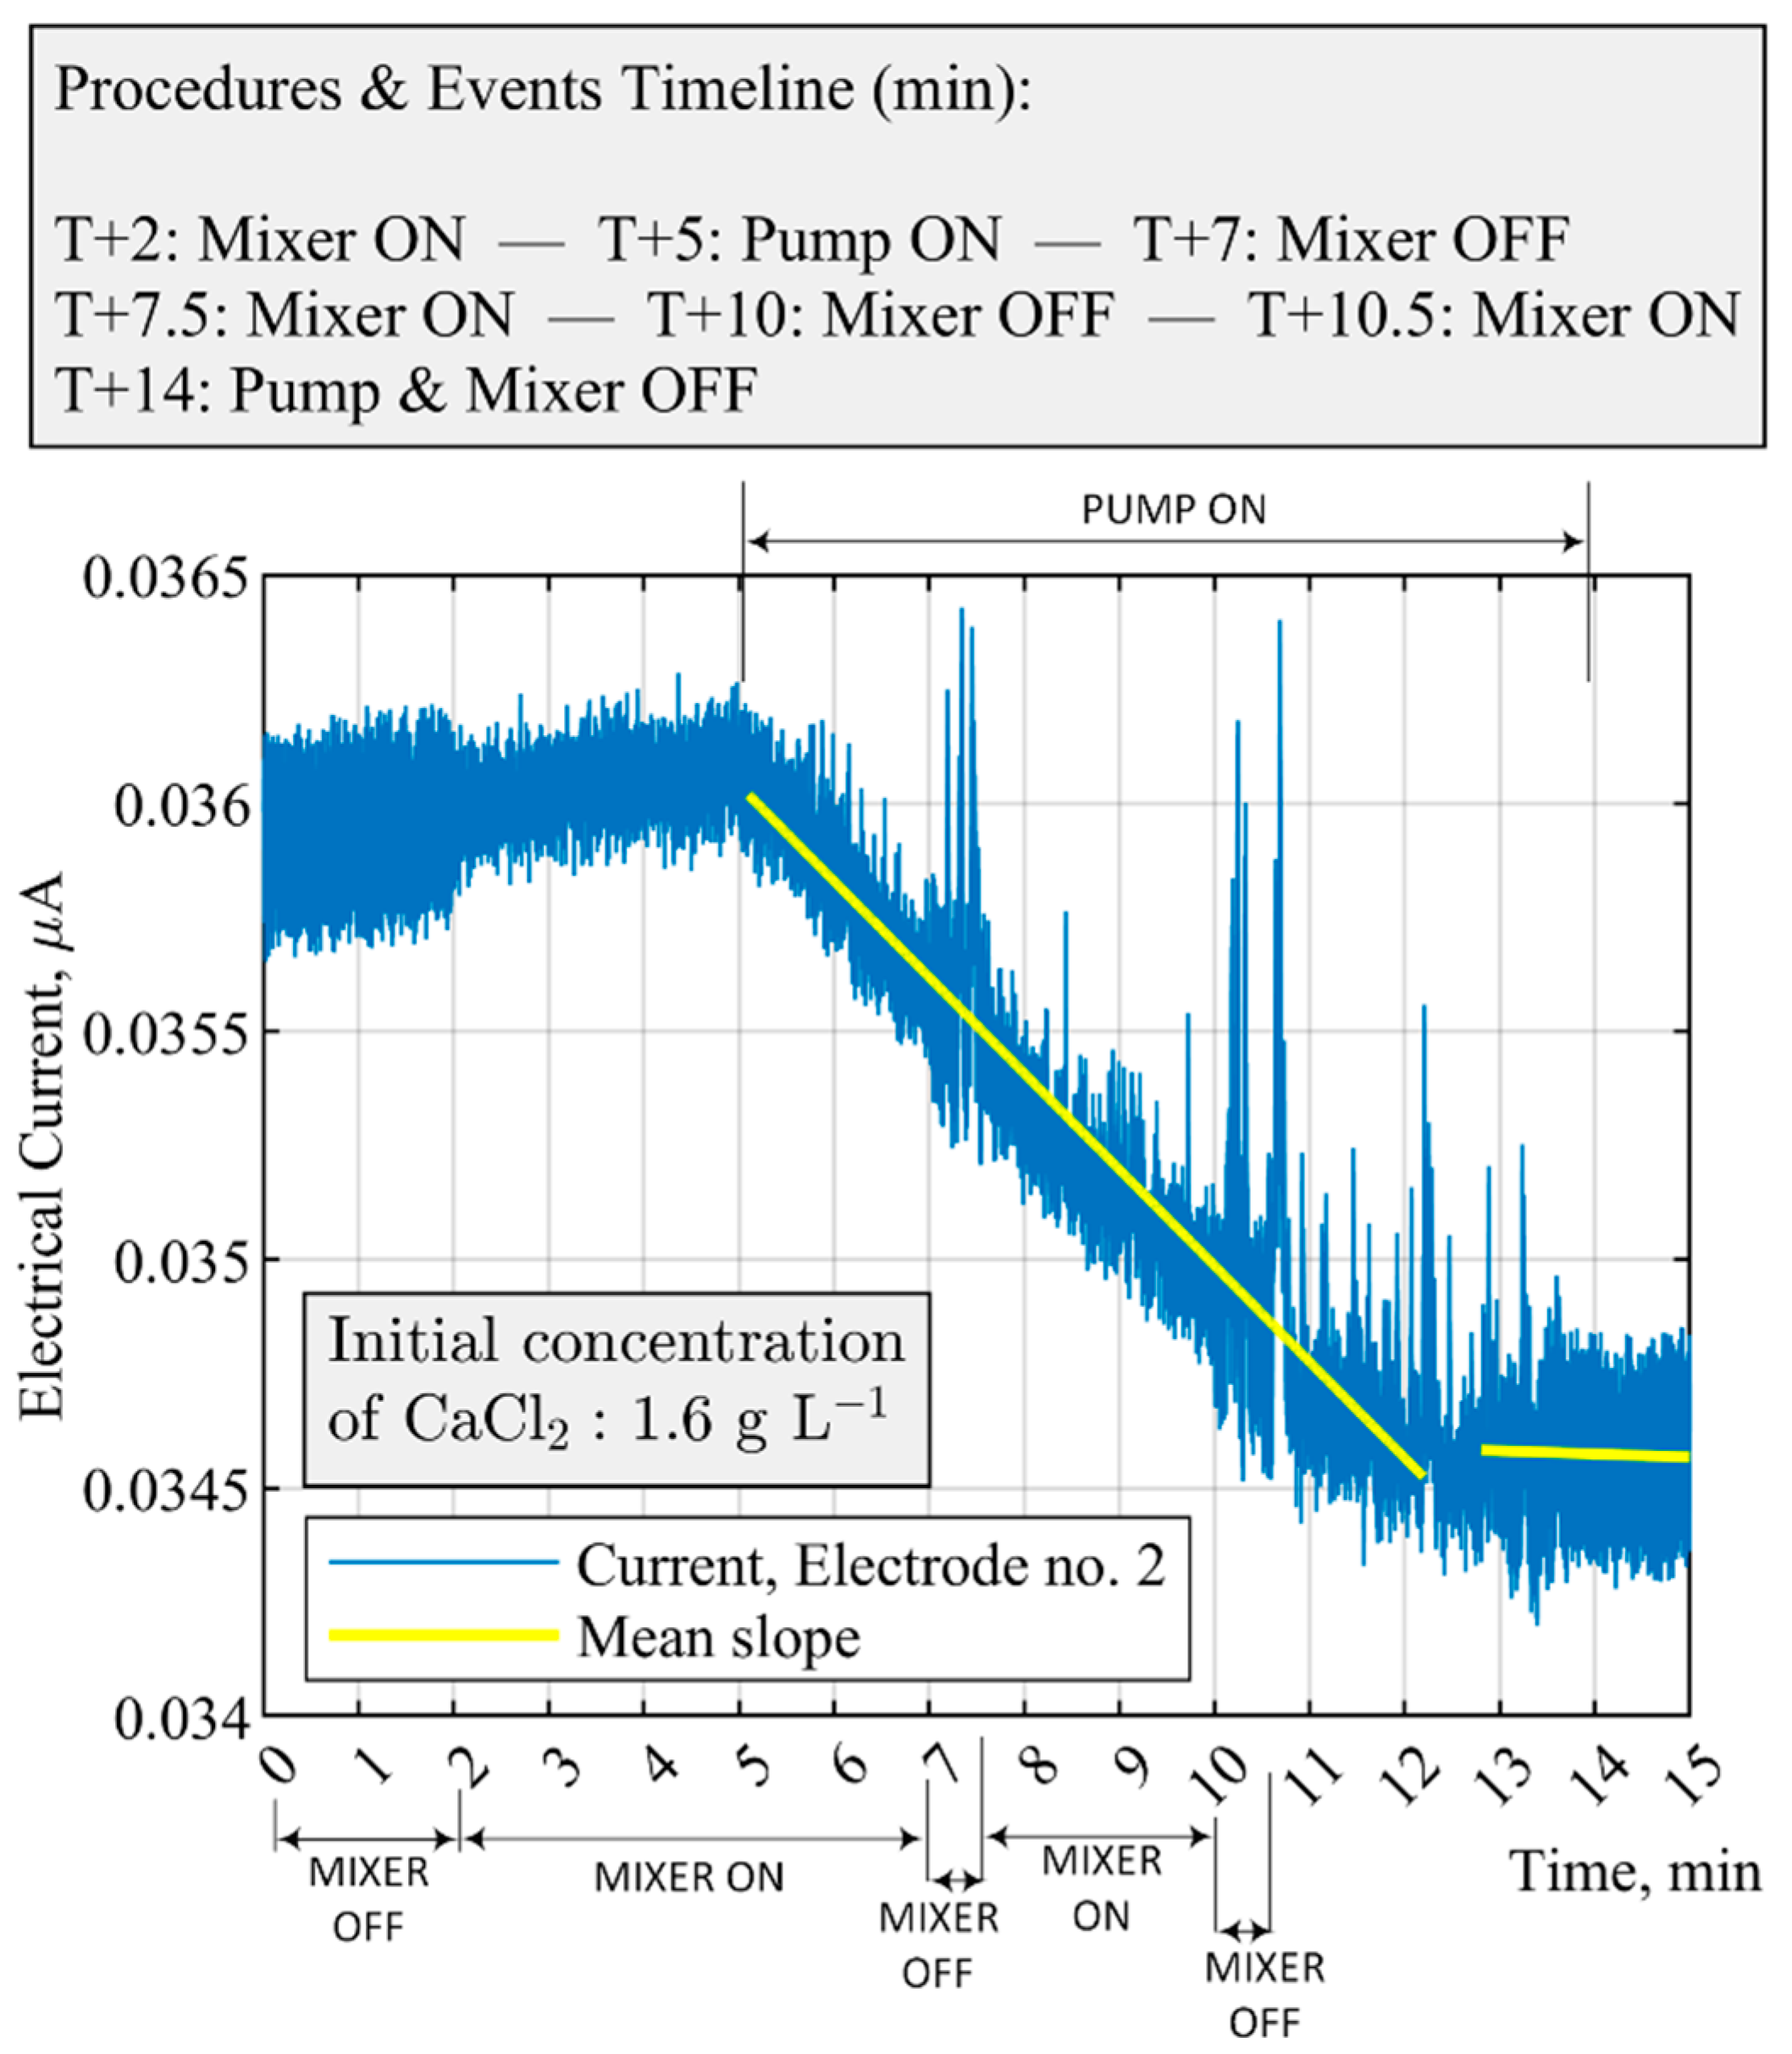
| Case no. 2 | Mixer ON | Pump ON and OFF |
| Case no. 3 | Pump ON and Mixer ON | Feed is water (not carbonate ions) |
| The Slope of the Electrical Current from All the Electrodes of the ERT System during the Time between 5 and 12 Min | ||||||||||||||||
|---|---|---|---|---|---|---|---|---|---|---|---|---|---|---|---|---|
| Electrode | 1 | 2 | 3 | 4 | 5 | 6 | 7 | 8 | 9 | 10 | 11 | 12 | 13 | 14 | 15 | 16 |
| Current (), () | 1.93 | 2.12 | 1.04 | 0.47 | 0.96 | 0.14 | 0.18 | 0.26 | 0.19 | 0.14 | 0.03 | 0.11 | 0.21 | 0.79 | 1.51 | 1.54 |
(Pump On) | (Pump Off) | Slope Factor, K | (Pump On) | |
|---|---|---|---|---|
| Electrode Index | ||||
| 1 | −23.38 | −3.16 | 7.39 | −22.98 |
| 2 | −25.35 | −1.01 | 25.09 | −24.87 |
| 3 | −11.00 | −4.71 | 2.33 | −3.15 |
| 4 | −6.19 | −2.98 | 2.07 | −9.55 |
| 5 | 19.12 | −10.14 | −1.88 | −5.62 |
| 6 | −0.50 | −4.04 | 0.12 | 0.50 |
| 7 | 1.43 | −3.4 | −0.42 | 0.659 |
| 8 | 1.38 | −5.46 | −0.25 | −1.06 |
| 9 | 2.35 | −4.6 | −0.51 | −1.61 |
| 10 | 1.40 | −3.10 | −0.45 | −2.20 |
| 11 | 3.08 | −2.10 | −1.4 | 0.78 |
| 12 | 1.86 | −2.76 | −0.67 | −0.48 |
| 13 | 0.16 | −1.57 | −0.03 | −0.18 |
| 14 | −2.50 | −5.00 | 0.5 | −5.61 |
| 15 | −14.04 | −4.58 | 3.06 | −13.39 |
| 16 | −19.9 | −2.36 | 8.43 | −21.29 |
Publisher’s Note: MDPI stays neutral with regard to jurisdictional claims in published maps and institutional affiliations. |
© 2021 by the authors. Licensee MDPI, Basel, Switzerland. This article is an open access article distributed under the terms and conditions of the Creative Commons Attribution (CC BY) license (https://creativecommons.org/licenses/by/4.0/).
Share and Cite
Aghajanian, S.; Rao, G.; Ruuskanen, V.; Wajman, R.; Jackowska-Strumillo, L.; Koiranen, T. Real-Time Fault Detection and Diagnosis of CaCO3 Reactive Crystallization Process by Electrical Resistance Tomography Measurements. Sensors 2021, 21, 6958. https://doi.org/10.3390/s21216958
Aghajanian S, Rao G, Ruuskanen V, Wajman R, Jackowska-Strumillo L, Koiranen T. Real-Time Fault Detection and Diagnosis of CaCO3 Reactive Crystallization Process by Electrical Resistance Tomography Measurements. Sensors. 2021; 21(21):6958. https://doi.org/10.3390/s21216958
Chicago/Turabian StyleAghajanian, Soheil, Guruprasad Rao, Vesa Ruuskanen, Radosław Wajman, Lidia Jackowska-Strumillo, and Tuomas Koiranen. 2021. "Real-Time Fault Detection and Diagnosis of CaCO3 Reactive Crystallization Process by Electrical Resistance Tomography Measurements" Sensors 21, no. 21: 6958. https://doi.org/10.3390/s21216958
APA StyleAghajanian, S., Rao, G., Ruuskanen, V., Wajman, R., Jackowska-Strumillo, L., & Koiranen, T. (2021). Real-Time Fault Detection and Diagnosis of CaCO3 Reactive Crystallization Process by Electrical Resistance Tomography Measurements. Sensors, 21(21), 6958. https://doi.org/10.3390/s21216958