
An Automatic Detection and Classification System of Five Stages for Hypertensive Retinopathy Using Semantic and Instance Segmentation in DenseNet Architecture


Abstract
:1. Introduction
Research Highlights
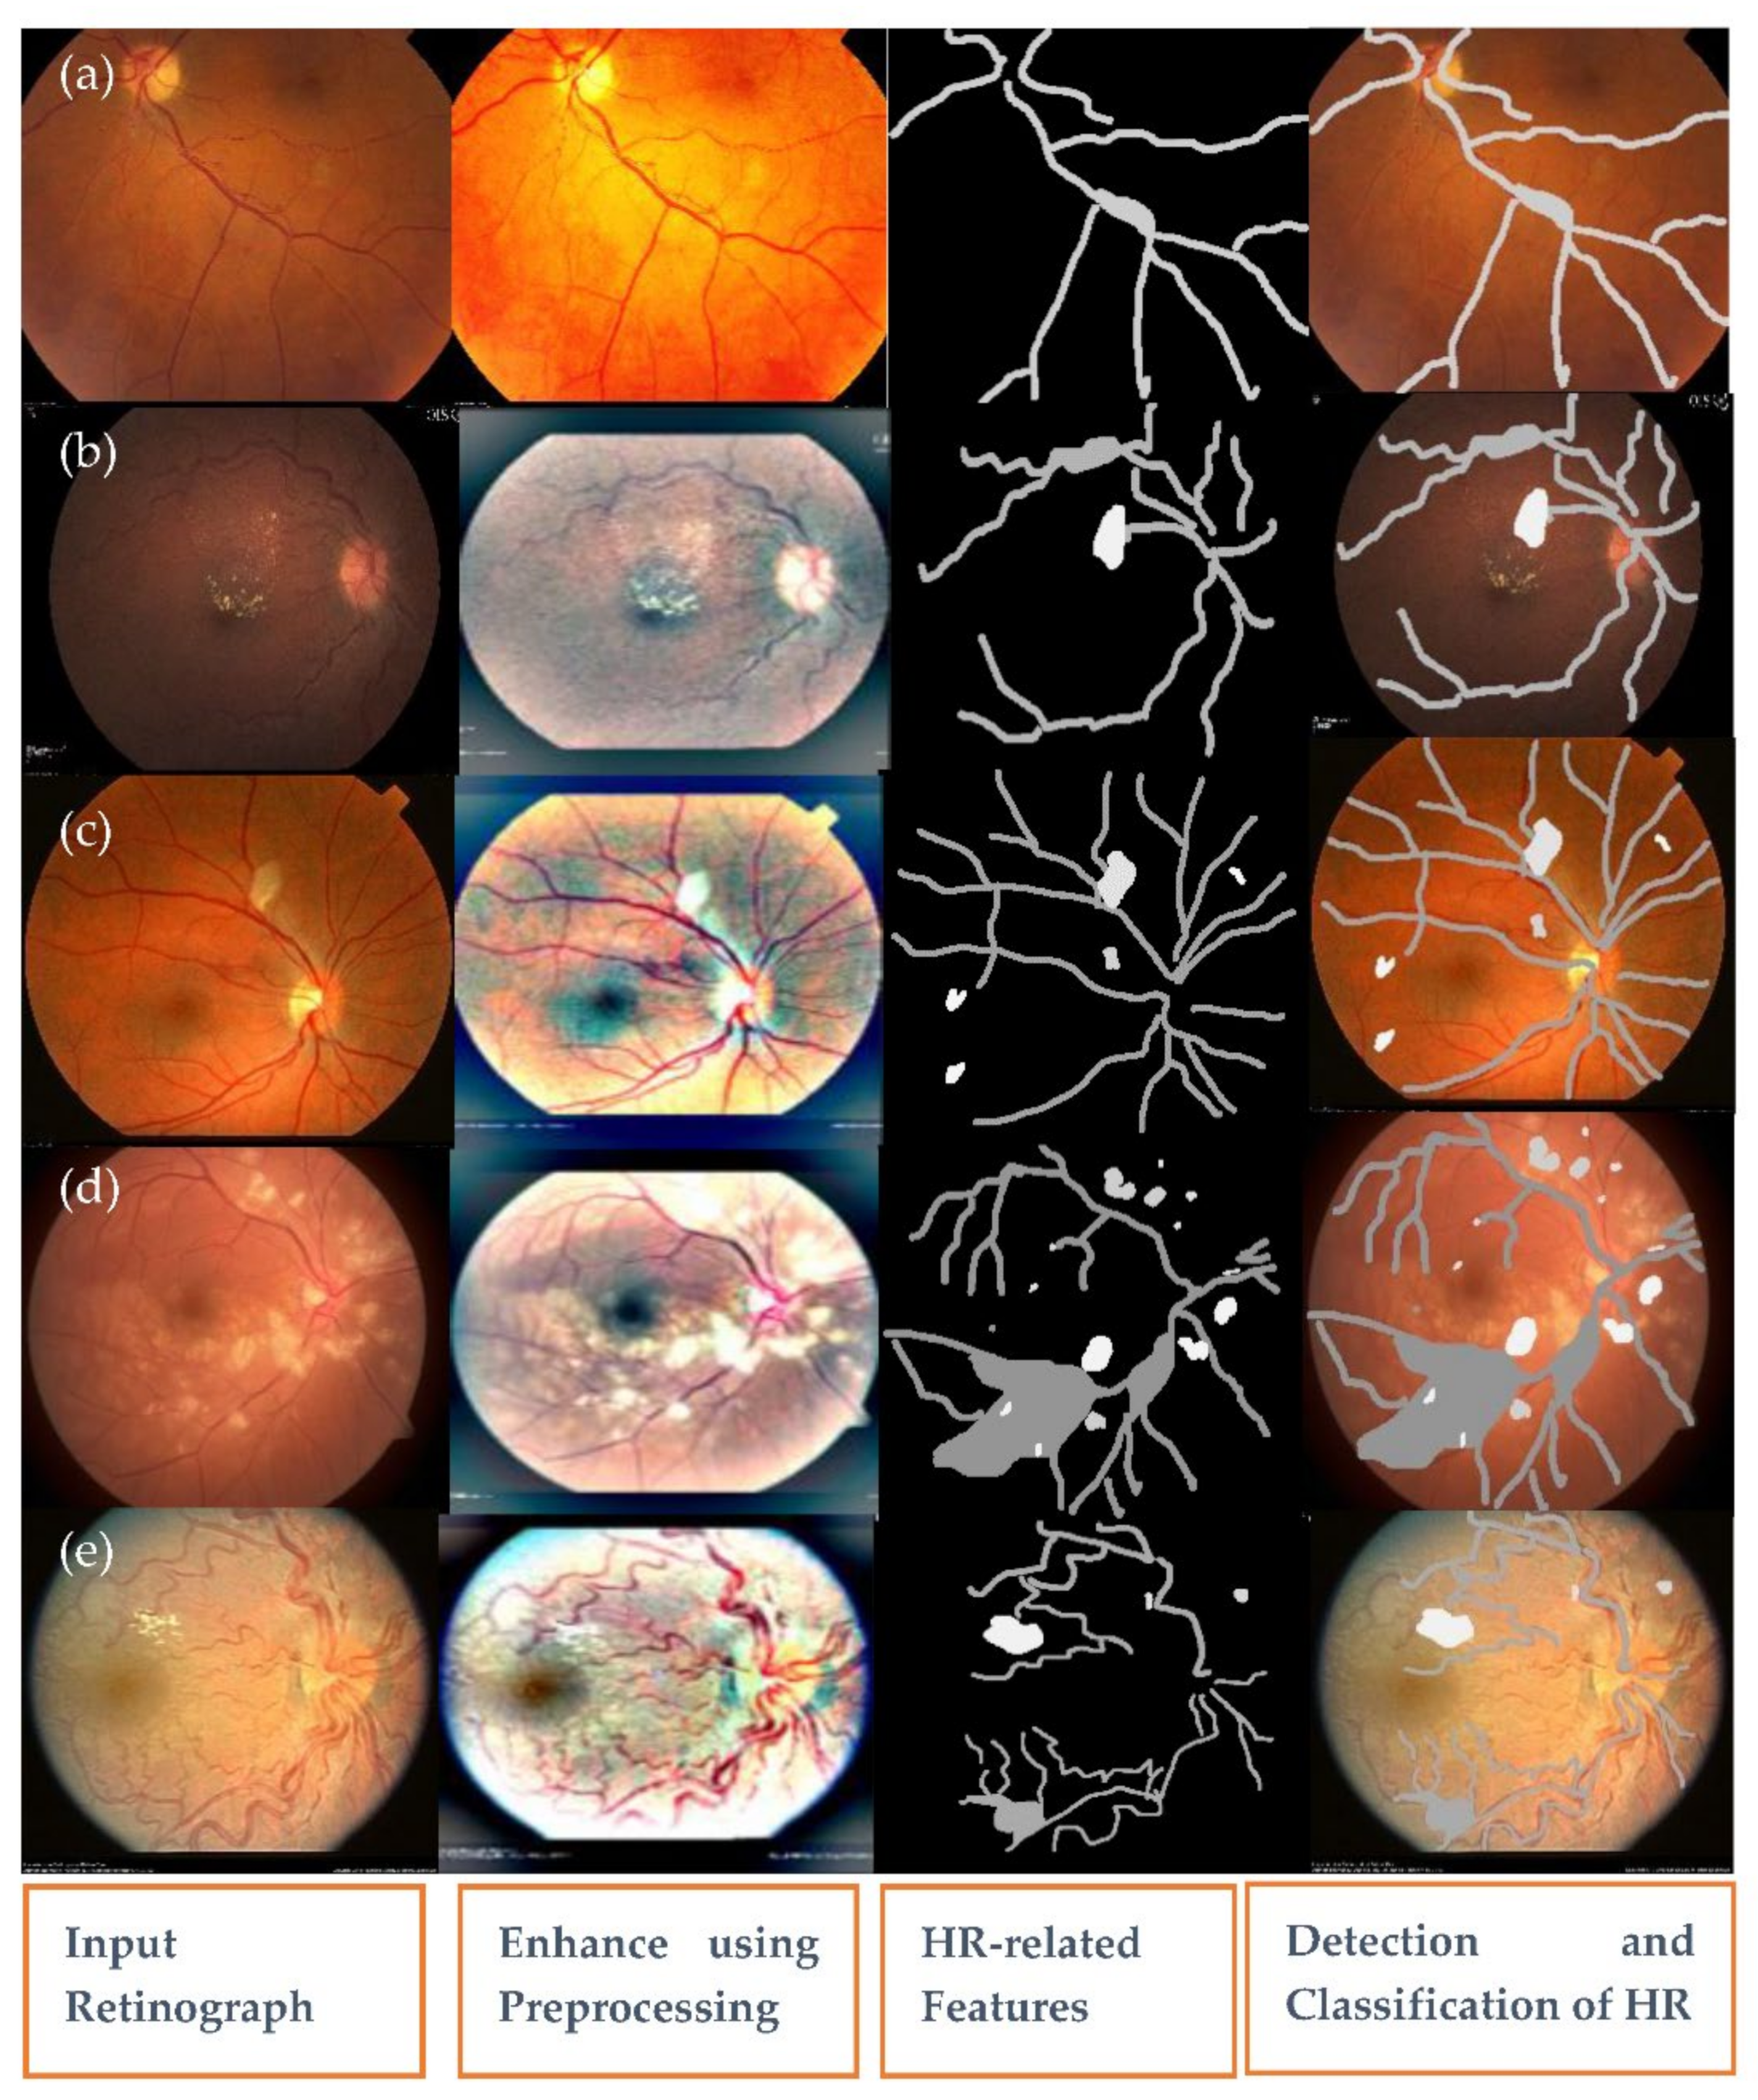
- A preprocessing step is integrated to build this HYPER-RETINO system to adjust light illumination and enhance the contrast in a perceptual-oriented color space.
- A novel semantic and instance-based segmentation mechanism is introduced to classify and identify the HR-related lesion’s pixels and regions.
- This deep-learning network has been trained with a wide set of HR fundus images to improve the HYPER-RETINO system to ensure the better applicability of this model.
2. Literature Review
2.1. Anatomical Structures-Based Techniques
2.2. Traditional-Machine and Deep-Learning Based Techniques
3. Materials and Methods
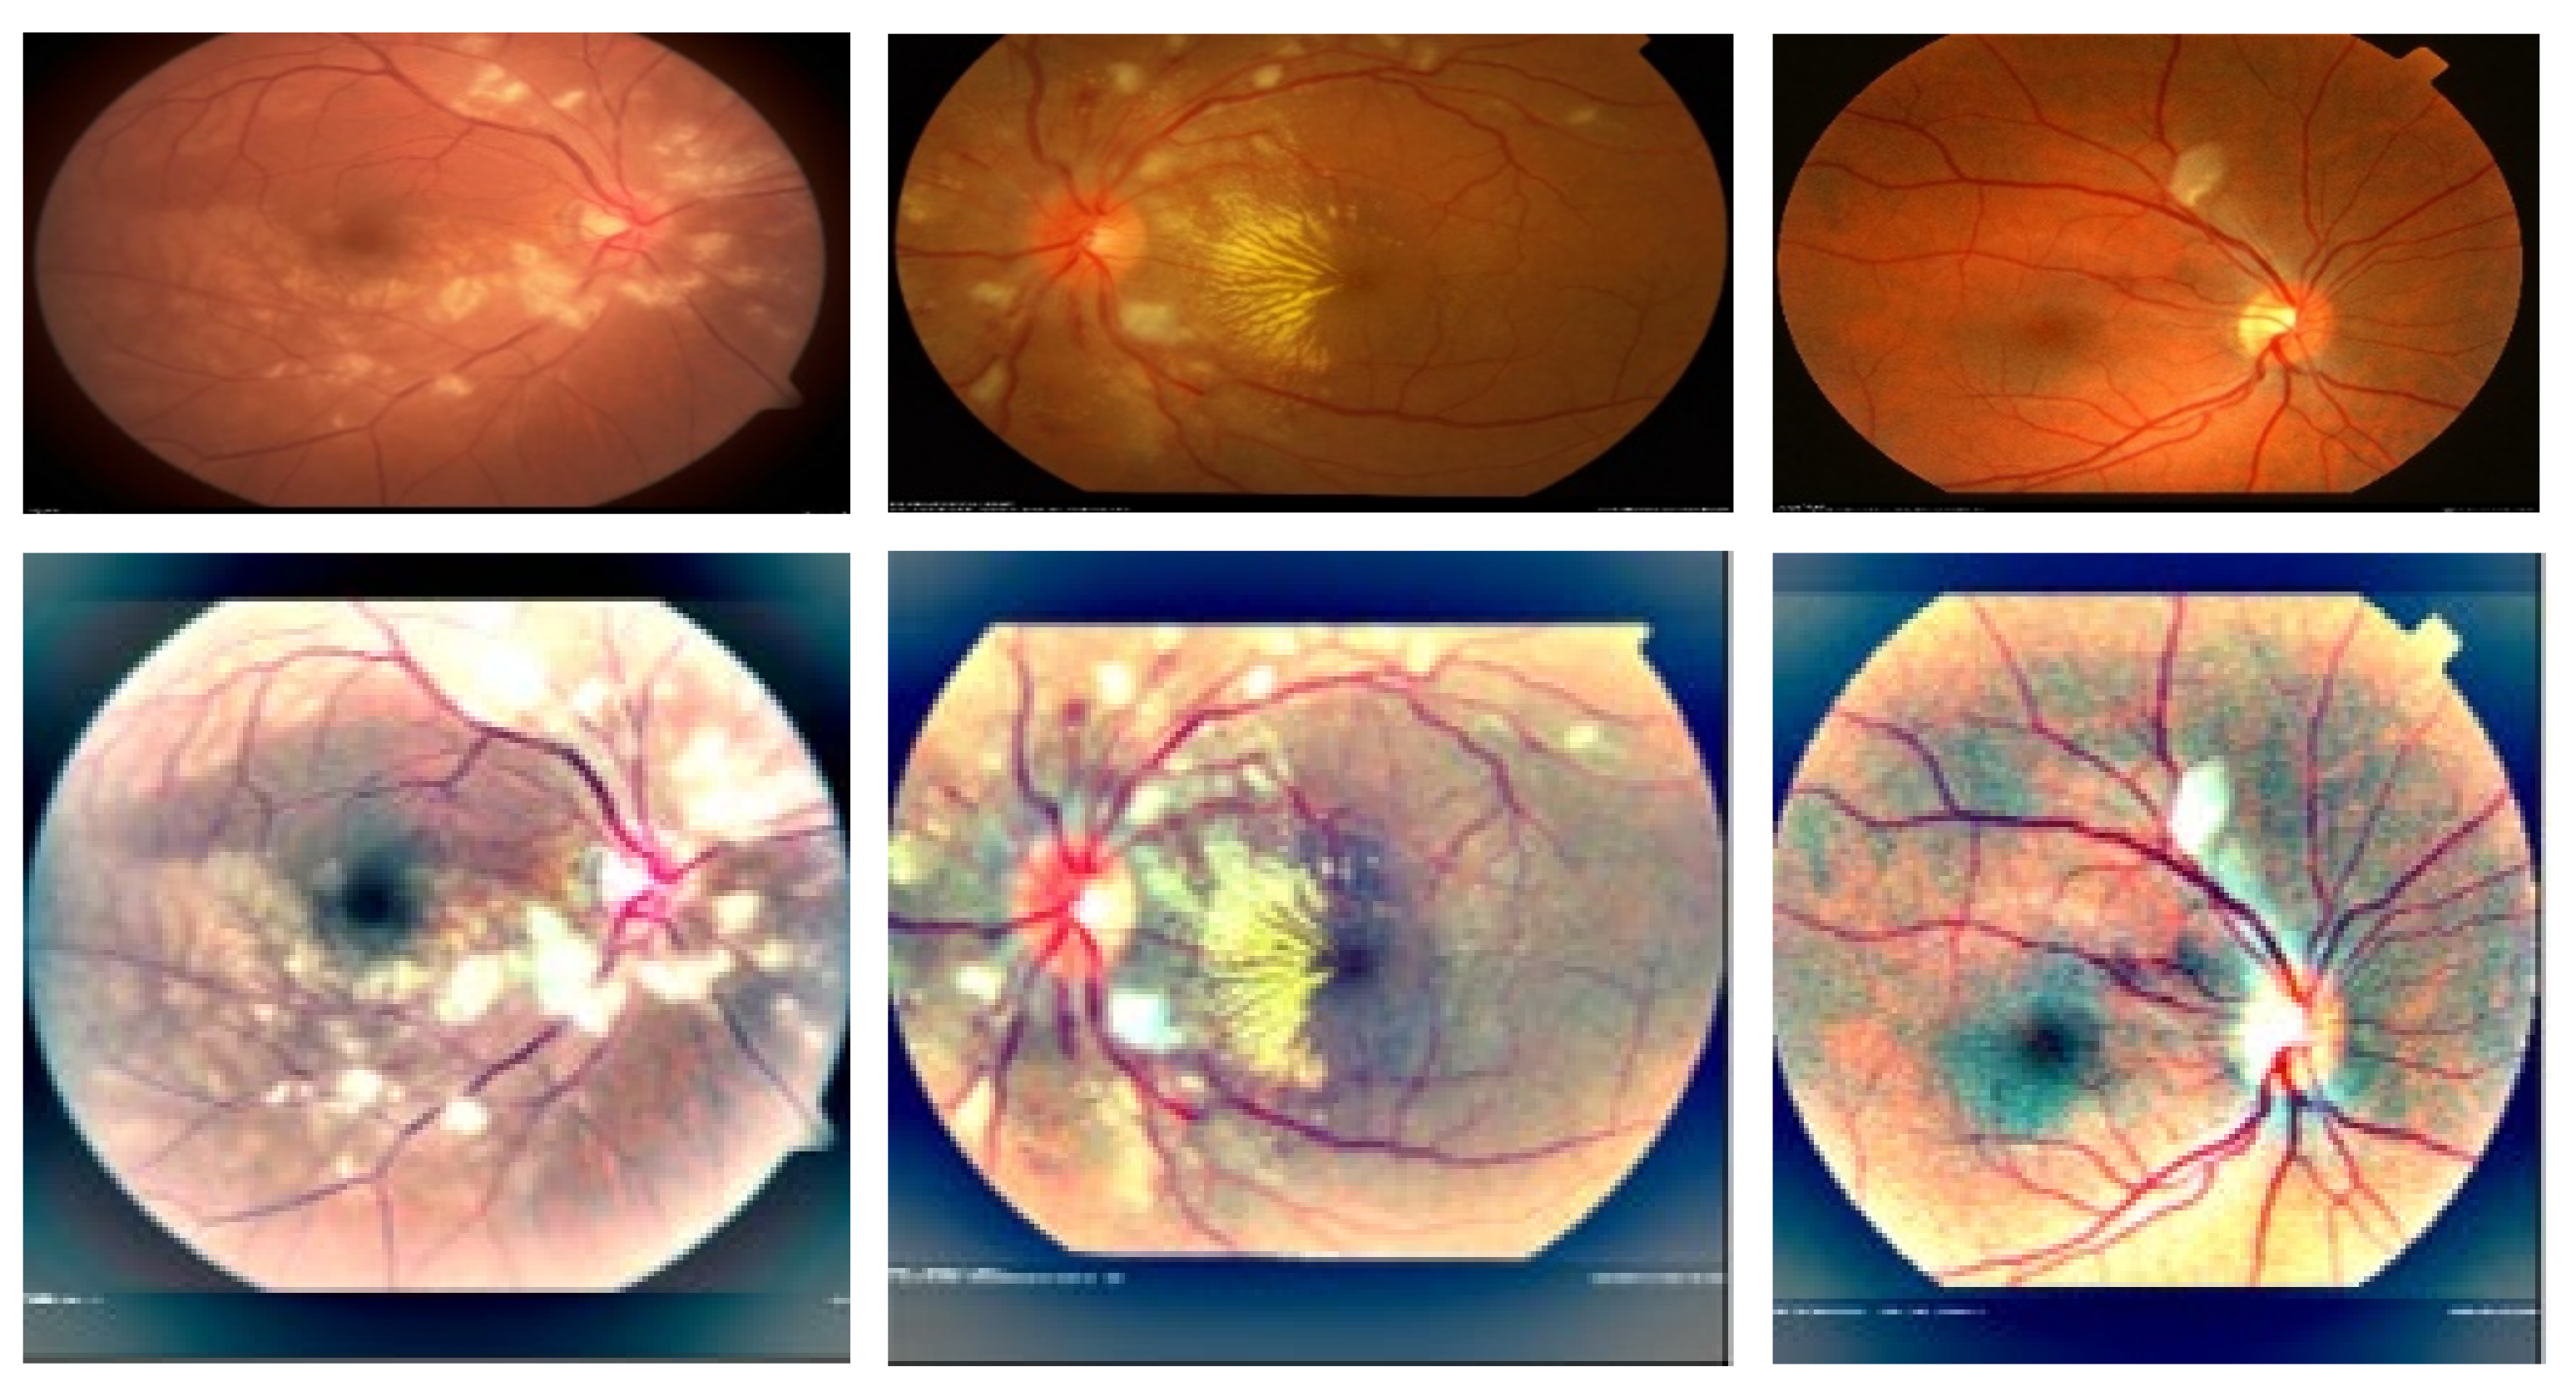
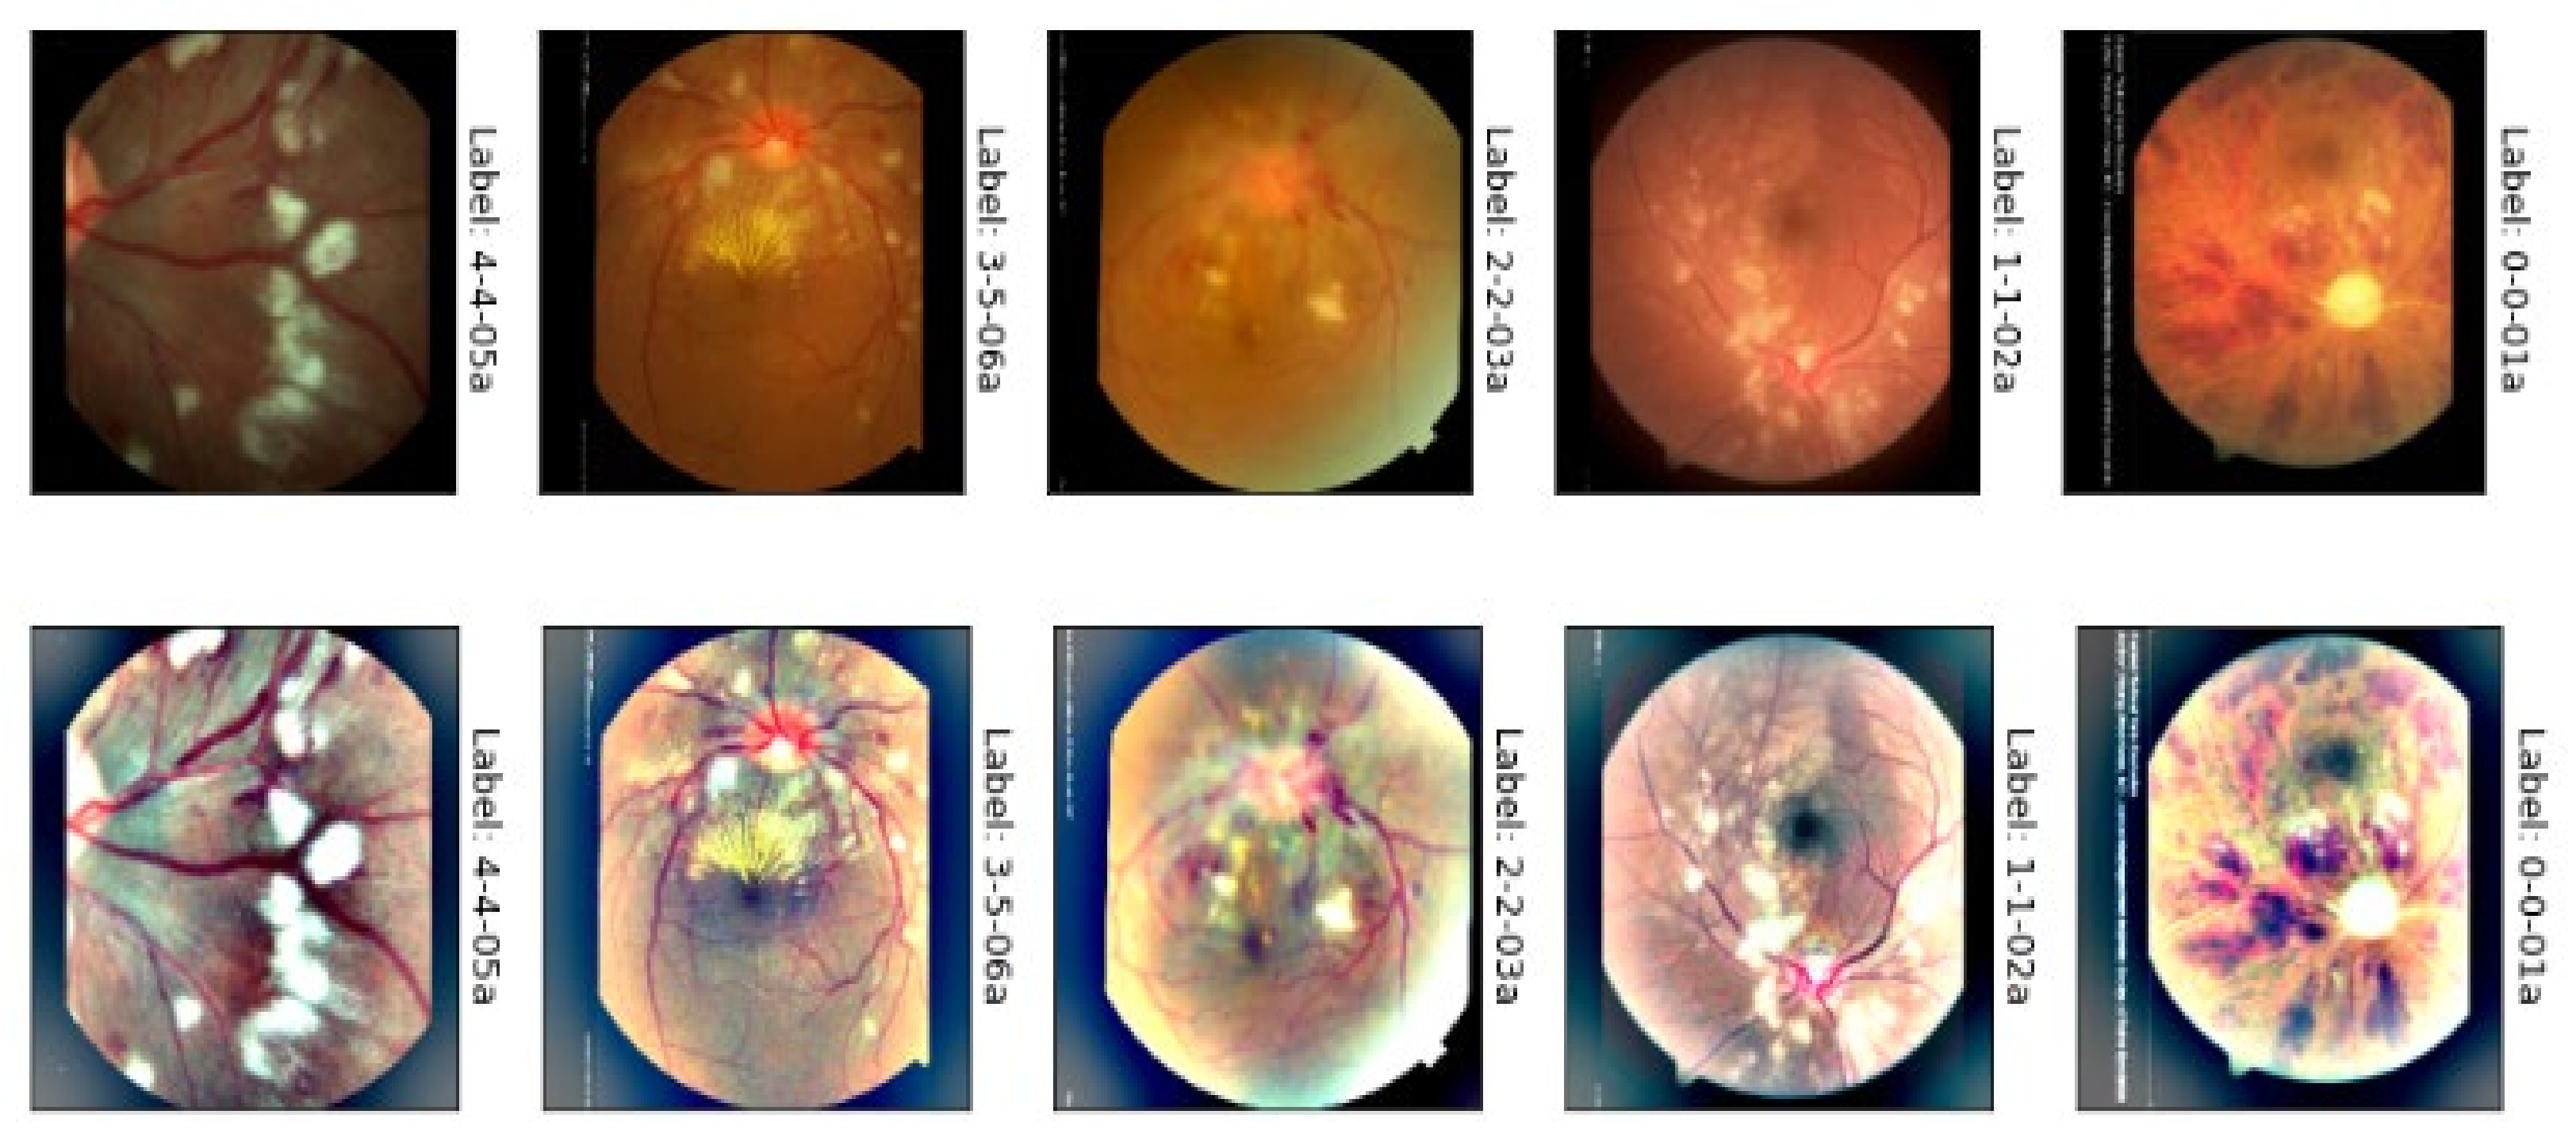
3.1. Acquistions of Datasets
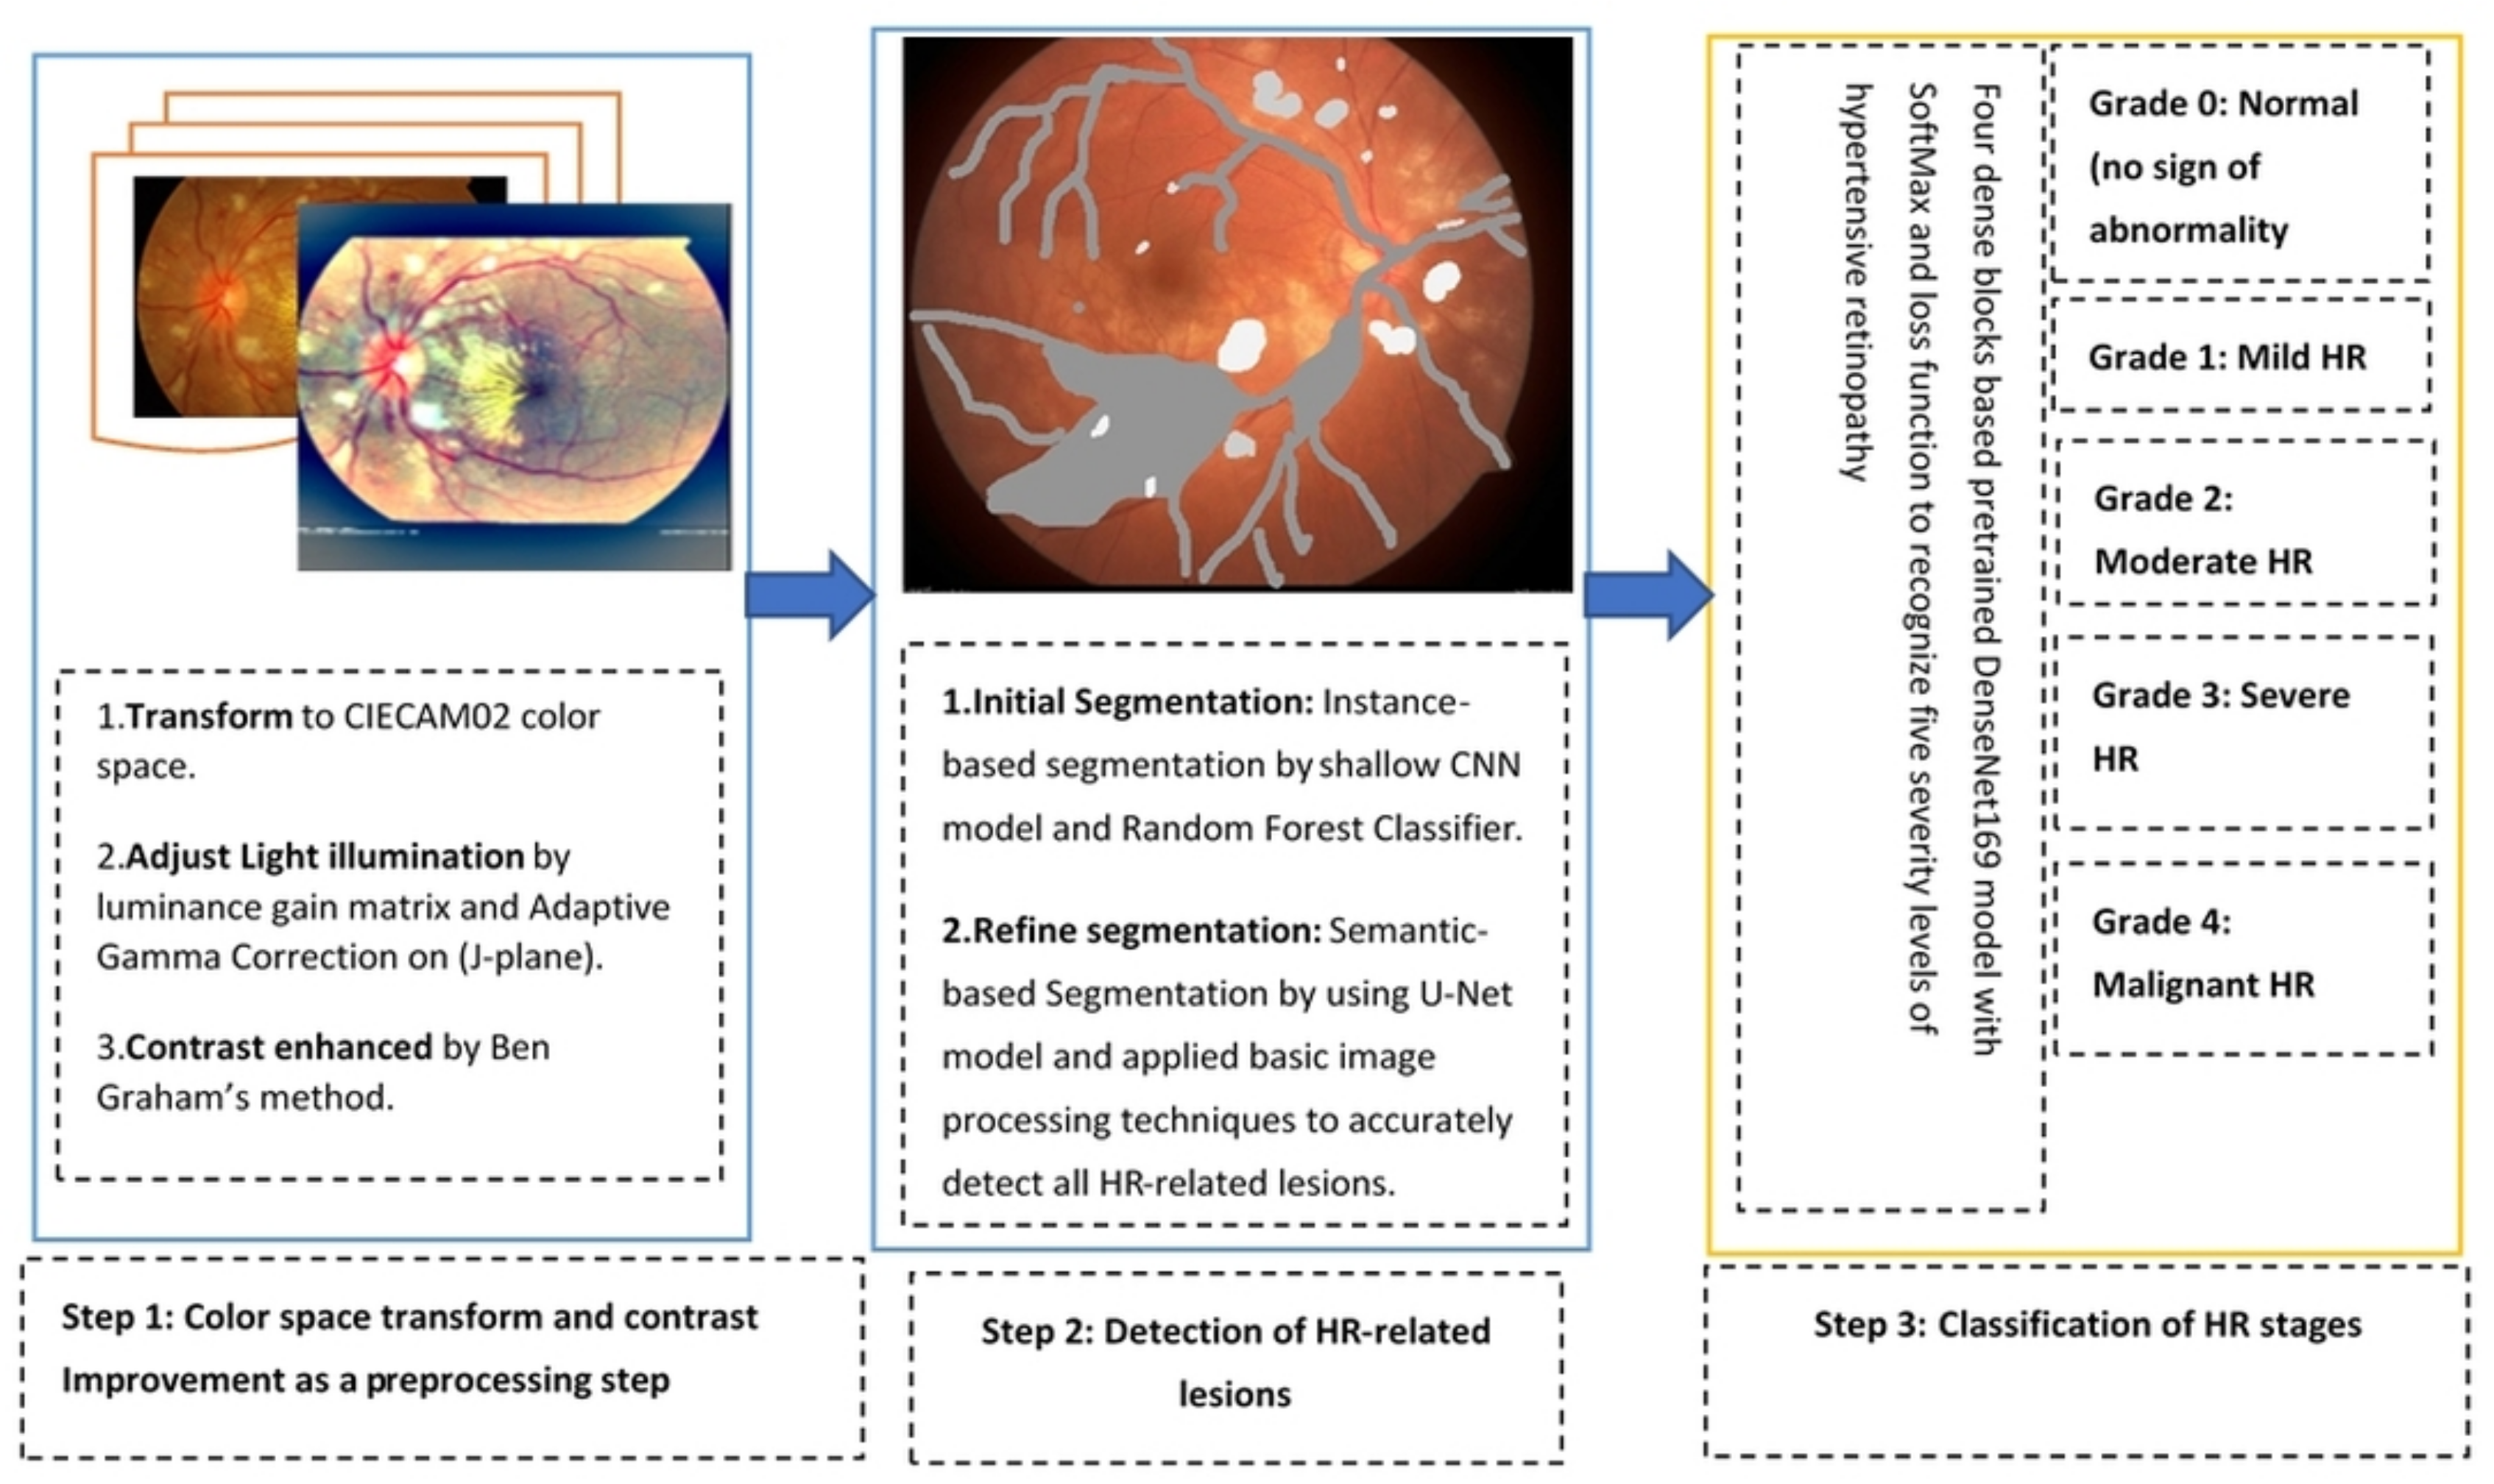
3.2. Proposed Methodology
3.2.1. Preprocessing in Perceptual-Oriented Color Space
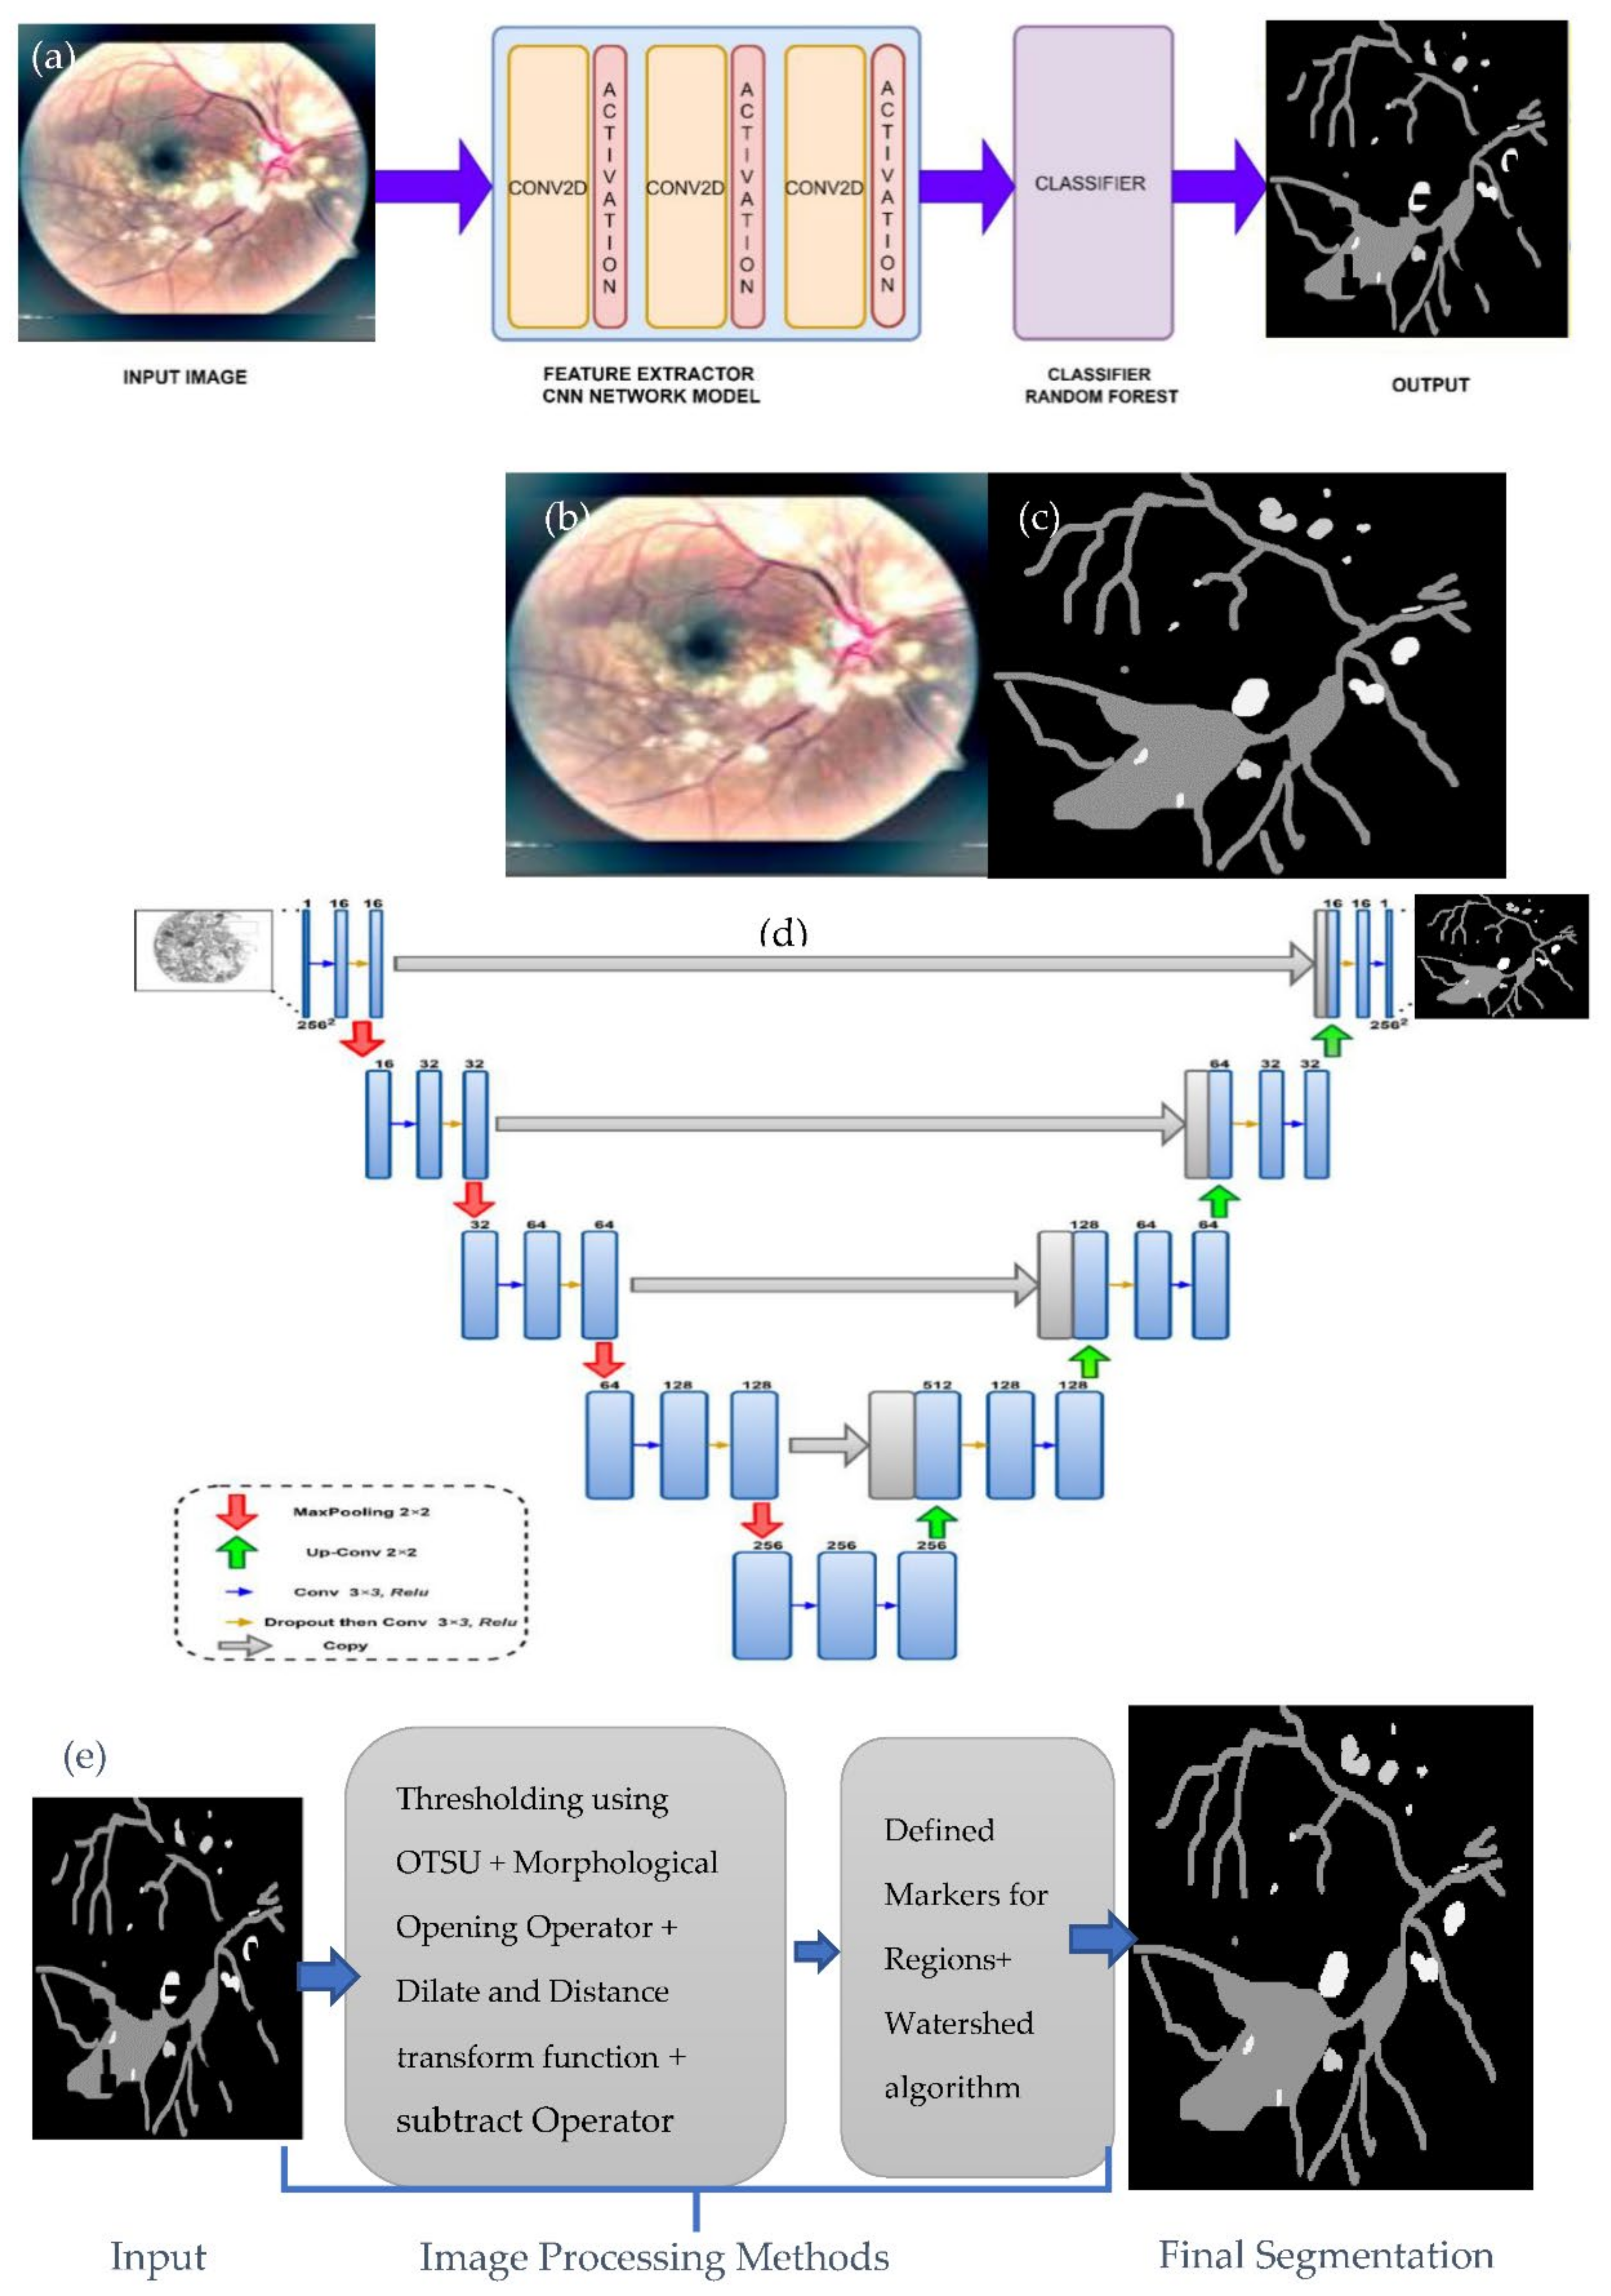
3.2.2. Lesions Detection by Semantic and Instance Based Segmentation
3.2.3. DenseNet Architecture for Classification
4. Experimental Results
5. Discussion
6. Conclusions
Author Contributions
Funding
Institutional Review Board Statement
Informed Consent Statement
Data Availability Statement
Acknowledgments
Conflicts of Interest
References
- Mozaffarian, D.; Benjamin, E.J.; Go, A.S.; Arnett, D.K.; Blaha, M.J.; Cushman, M.; Das, S.R.; De Ferranti, S.; Després, J.P.; Fullerton, H.J.; et al. Executive summary: Heart disease and stroke statistics-2016 update: A report from the American heart association. Circulation 2016, 133, 447–454. [Google Scholar] [CrossRef] [PubMed]
- Rosendorff, C.; Lackland, D.T.; Allison, M.; Aronow, W.S.; Black, H.R.; Blumenthal, R.S.; Gersh, B.J. Treatment of hypertension in patients with coronary artery disease: A scientific statement from the American heart association, American college of cardiology, and american society of hypertension. J. Am. Coll. Cardiol. 2015, 65, 1998–2038. [Google Scholar] [CrossRef] [PubMed] [Green Version]
- Qureshi, I.; Ma, J.; Abbas, Q. Diabetic retinopathy detection and stage classification in eye fundus images using active deep learning. Multimed. Tools Appl. 2021, 80, 11691–11721. [Google Scholar] [CrossRef]
- Bhargava, M.; Ikram, M.K.; Wong, T.Y. How does hypertension affect your eyes? J. Hum. Hypertens. 2012, 26, 71–83. [Google Scholar] [CrossRef] [Green Version]
- Wiharto; Suryani, E. The review of computer aided diagnostic hypertensive retinopathy based on the retinal image processing. IOP Conf. Ser. Mater. Sci. Eng. 2019, 620, 012099. [Google Scholar] [CrossRef]
- Sengupta, S.; Singh, A.; Leopold, H.A.; Gulati, T.; Lakshminarayanan, V. Ophthalmic diagnosis using deep learning with fundus images—A critical review. Artif. Intell. Med. 2020, 102, 101758. [Google Scholar] [CrossRef]
- Akbar, S.; Akram, M.U.; Sharif, M.; Tariq, A.; Yasin, U. Arteriovenous ratio and papilledema based hybrid decision support system for detection and grading of hypertensive retinopathy. Comput. Methods Programs Biomed. 2018, 154, 123–141. [Google Scholar] [CrossRef]
- Abbasi-Sureshjani, S.; Smit-Ockeloen, I.; Bekkers, E.J.; Dashtbozorg, B.; Romeny, B.M. Automatic detection of vascular bifurcations and crossings in retinal images using orientation scores. In Proceedings of the 2016 IEEE 13th International Symposium on Biomedical Imaging (ISBI), Prague, Czech Republic, 13–16 April 2016; pp. 189–192. [Google Scholar]
- Cavallari, M.; Stamile, C.; Umeton, R.; Calimeri, F.; Orzi, F. Novel method for automated analysis of retinal images: Results in subjects with hypertensive retinopathy and CADASIL. BioMed Res. Int. 2015, 2015, 752957. [Google Scholar] [CrossRef]
- Akbar, S.; Akram, M.U.; Sharif, M.; Tariq, A.; Khan, S.A. Decision support system for detection of hypertensive retinopathy using arteriovenous ratio. Artif. Intell. Med. 2018, 90, 15–24. [Google Scholar] [CrossRef]
- Grisan, E.; Foracchia, M.; Ruggeri, A. A novel method for the automatic grading of retinal vessel tortuosity. IEEE Trans. Med. Imaging 2008, 27, 310–319. [Google Scholar] [CrossRef]
- Holm, S.I.; Russell, G.; Nourrit, V.; McLoughlin, N.P. DR HAGIS—A fundus image database for the automatic extraction of retinal surface vessels from diabetic patients. J. Med. Imaging 2017, 4, 014503. [Google Scholar] [CrossRef] [Green Version]
- Tramontan, L.; Ruggeri, A. Computer estimation of the AVR parameter in diabetic retinopathy. In World Congress on Medical Physics and Biomedical Engineering, Munich, Germany, 7–12 September 2009; Dössel, O., Schlegel, W.C., Eds.; Springer: Berlin/Heidelberg, Germany, 2009. [Google Scholar]
- Goswami, S.; Goswami, S.; De, S. Automatic Measurement and analysis of vessel width in retinal fundus image. In Proceedings of the Springer 1st International Conference on Intelligent Computing and Communication; Springer: Singapore, 2017; pp. 451–458. [Google Scholar]
- Ortiz, D.; Cubides, M.; Suarez, A.; Zequera, M.L.; Quiroga, J.; Gómez, J.L.; Arroyo, N. Support system for the preventive diagnosis of Hypertensive Retinopathy. In Proceedings of the 2010 Annual International Conference of the IEEE Engineering in Medicine and Biology, Buenos Aires, Argentina, 31 August–4 September 2010; pp. 5649–5652. [Google Scholar]
- Muramatsu, C.; Hatanaka, Y.; Iwase, T.; Hara, T.; Fujita, H. Automated selection of major arteries and veins for measurement of arteriolar-to-venular diameter ratio on retinal fundus images. Comput. Med. Imaging Graph. 2011, 35, 472–480. [Google Scholar] [CrossRef]
- Manikis, G.C.; Sakkalis, V.; Zabulis, X.; Karamaounas, P.; Triantafyllou, A.; Douma, S.; Zamboulis, C.; Marias, K. An image analysis framework for the early assessment of hypertensive retinopathy signs. In Proceedings of the 2011 E-Health and Bioengineering Conference (EHB), Iasi, Romania, 24–26 November 2011; pp. 1–6. [Google Scholar]
- Saez, M.; González-Vázquez, S.; Penedo, M.G.; Barceló, M.A.; Pena-Seijo, M.; Tuero, G.C.; Pose-Reino, A. Development of an automated system to classify retinal vessels into arteries and veins. Comput. Methods Programs Biomed. 2012, 108, 367–376. [Google Scholar] [CrossRef]
- Narasimhan, K.; Neha, V.C.; Vijayarekha, K. Hypertensive retinopathy diagnosis from fundus images by estimation of AVR. Procedia Eng. 2012, 38, 980–993. [Google Scholar] [CrossRef] [Green Version]
- Noronha, K.; Navya, K.T.; Nayak, K.P. Support system for the automated detection of hypertensive retinopathy using fundus images. In Proceedings of the International Conference on Electronic Design and Signal Processing ICEDSP, Manipal, India, 20–22 December 2012; pp. 1–5. [Google Scholar]
- Nath, M.; Dandapat, S. Detection of changes in color fundus images due to diabetic retinopathy. In Proceedings of the 2012 2nd National Conference on Computational Intelligence and Signal Processing (CISP), Guwahati, India, 2–3 March 2012; pp. 81–85. [Google Scholar]
- Agurto, C.; Joshi, V.; Nemeth, S.C.; Soliz, P.; Barriga, E.S. Detection of hypertensive retinopathy using vessel measurements and textural features. In Proceedings of the 2014 36th Annual International Conference of the IEEE Engineering in Medicine and Biology Society, Chicago, IL, USA, 26–30 August 2014; pp. 5406–5409. [Google Scholar]
- Khitran, S.A.; Akram, M.U.; Usman, A.; Yasin, U. Automated system for the detection of hypertensive retinopathy. In Proceedings of the 2014 4th International Conference on Image Processing Theory, Tools and Applications (IPTA), Paris, France, 14–17 October 2014; pp. 1–6. [Google Scholar]
- Irshad, S.; Akram, M.U.; Salman, M.S.; Yasin, U. Automated detection of cotton wool spots for the diagnosis of hypertensive Retinopathy. In Proceedings of the 2014 Cairo International Biomedical Engineering Conference (CIBEC), Giza, Egypt, 11–13 December 2014; pp. 121–124. [Google Scholar]
- Irshad, S.; Akram, M.U. Classification of retinal vessels into arteries and veins for detection of hypertensive retinopathy. In Proceedings of the 2014 Cairo International Biomedical Engineering Conference (CIBEC), Giza, Egypt, 11–13 December 2014; pp. 133–136. [Google Scholar]
- Fukutsu, K.; Saito, M.; Noda, K.; Murata, M.; Kase, S.; Shiba, R.; Isogai, N.; Asano, Y.; Hanawa, N.; Dohke, M.; et al. A deep learning architecture for vascular area measurement in fundus images. Ophthalmol. Sci. 2021, 1, 100004. [Google Scholar] [CrossRef]
- Fraz, M.M.; Welikala, R.A.; Rudnicka, A.R.; Owen, C.G.; Strachan, D.P.; Barman, S.A. QUARTZ: Quantitative Analysis of retinal vessel topology and size—an automated system for quantification of retinal vessels morphology. Expert Syst. Appl. 2015, 42, 7221–7234. [Google Scholar] [CrossRef] [Green Version]
- Syahputra, M.F.; Amalia, C.; Rahmat, R.F.; Abdullah, D.; Napitupulu, D.; Setiawan, M.I.; Albra, W.; Nurdin; Andayani, U. Hypertensive retinopathy identification through retinal fundus image using backpropagation neural network. J. Phys. Conf. Ser. 2018, 978, 012106. [Google Scholar] [CrossRef] [Green Version]
- Zhu, C.; Zou, B.; Zhao, R.; Cui, J.; Duan, X.; Chen, Z.; Liang, Y. Retinal vessel segmentation in colour fundus images using extreme learning machine. Comput. Med. Imaging Graph. 2017, 55, 68–77. [Google Scholar] [CrossRef]
- Triwijoyo, B.K.; Budiharto, W.; Abdurachman, E. The classification of hypertensive retinopathy using convolutional neural network. Procedia Comput. Sci. 2017, 116, 166–173. [Google Scholar] [CrossRef]
- Abbas, Q.; Ibrahim, M.E.A. DenseHyper: An automatic recognition system for detection of hypertensive retinopathy using dense features transform and deep-residual learning. Multimedia Tools Appl. 2020, 79, 31595–31623. [Google Scholar] [CrossRef]
- Triwijoyo, B.K.; Pradipto, Y.D. Detection of hypertension retinopathy using deep learning and boltzmann machines. J. Phys. Conf. Ser. 2017, 801, 012039. [Google Scholar] [CrossRef]
- Tan, J.H.; Acharya, U.R.; Bhandary, S.V.; Chua, K.C.; Sivaprasad, S. Segmentation of optic disc fovea and retinal vasculature using a single convolutional neural network. J. Comput. Sci. 2017, 20, 70–79. [Google Scholar] [CrossRef] [Green Version]
- AlBadawi, S.; Fraz, F.F. Arterioles and venules classification in retinal images using fully convolutional deep neural network. In Proceedings of the International Conference on Image Analysis and Recognition (ICIAR’18), Póvoa de Varzim, Portugal, 27–29 June 2018; pp. 659–668. [Google Scholar]
- Welikala, R.A.; Foster, P.J.; Whincup, P.; Rudnicka, A.R.; Owen, C.G.; Strachan, D.P.; Barman, S. Automated arteriole and venule classification using deep learning for retinal images from the UK Biobank cohort. Comput. Biol. Med. 2017, 90, 23–32. [Google Scholar] [CrossRef] [Green Version]
- Yao, Z.; Zhang, Z.; Xu, L. Convolutional Neural Network for Retinal Blood Vessel Segmentation. In Proceedings of the 9th International Symposium on Computational Intelligence and Design (ISCID), Hangzhou, China, 10–11 December 2016; Volume 1, pp. 406–409. [Google Scholar]
- Prentasic, P.; Loncaric, S. Detection of exudates in fundus photographs using convolutional neural networks. In Proceedings of the 2015 9th International Symposium on Image and Signal Processing and Analysis (ISPA), Zagreb, Croatia, 7–9 September 2015; pp. 188–192. [Google Scholar]
- Arsalan, M.; Owais, M.; Mahmood, T.; Cho, S.W.; Park, K.R. Aiding the diagnosis of diabetic and hypertensive retinopathy using artificial intelligence-based semantic segmentation. J. Clin. Med. 2019, 8, 1446. [Google Scholar] [CrossRef] [Green Version]
- Kriplani, H.; Patel, M.; Roy, S. Prediction of arteriovenous nicking for hypertensive retinopathy using deep learning. In Computational Intelligence in Data Mining; Springer: Singapore, 2020; pp. 141–149. [Google Scholar]
- Tang MC, S.; Teoh, S.S.; Ibrahim, H.; Embong, Z. Neovascularization detection and localization in fundus images using deep learning. Sensors 2021, 21, 5327. [Google Scholar] [CrossRef]
- Staal, J.; Abràmoff, M.D.; Niemeijer, M.; Viergever, M.A.; Ginneken, B.V. Ridge-based vessel segmentation in color images of the retina. IEEE Trans. Med. Imaging 2004, 23, 501–509. [Google Scholar] [CrossRef]
- Kauppi, T.; Kalesnykiene, V.; Kamarainen, J.-K.; Lensu, L.; Sorri, I.; Raninen, A.; Voutilainen, R.; Uusitalo, H.; Kalviainen, H.; Pietila, J. The diaretdb1 diabetic retinopathy database and evaluation protocol. In Proceedings of the 17th British Machine Vision Conference (BMVC), Coventry, UK, 10–13 September 2007; Volume 1, pp. 1–10. [Google Scholar]
- Pires, R.; Jelinek, H.F.; Wainer, J.; Valle, E.; Rocha, A. Advancing bag-of-visual-words representations for lesion classification in retinal images. PLoS ONE 2014, 9, e96814. [Google Scholar] [CrossRef]
- Kaggle Dataset, Diabetic Retinopathy Detection Identify Signs of Diabetic Retinopathy in Eye Images. Available online: https://kaggle.com/c/diabetic-retinopathy-detection (accessed on 26 April 2019).
- APTOS 2019 Blindness Detection, Detect Diabetic Retinopathy to Stop Blindness before It’s Too Late. Available online: https://www.kaggle.com/c/aptos2019-blindness-detection/overview/aptos-2019 (accessed on 26 January 2019).
- Thwaites, A.; Wingfield, C.; Wieser, E.; Soltan, A.; Marslen-Wilson, W.; Nimmo-Smith, I. Entrainment to the CIECAM02 and CIELAB colour appearance models in the human cortex. Vis. Res. 2018, 145, 1–10. [Google Scholar] [CrossRef]
- Liu, X.; Deng, Z.; Yang, Y. Recent progress in semantic image segmentation. Artif. Intell. Rev. 2019, 52, 1089–1106. [Google Scholar] [CrossRef] [Green Version]
- Shelhamer, E.; Long, J.; Darrell, T. Fully convolutional networks for semantic segmentation. IEEE Trans. Pattern Anal. Mach. Intell. 2017, 39, 640–651. [Google Scholar] [CrossRef]
- MRoy, R.; Ameer, P.M. Segmentation of leukocyte by semantic segmentation model: A deep learning approach. Biomed. Signal Process. Control 2021, 65, 102385. [Google Scholar] [CrossRef]
- Liu, X.; Song, L.; Liu, S.; Zhang, Y. A review of deep-learning-based medical image segmentation methods. Sustainability 2021, 13, 1224. [Google Scholar] [CrossRef]
- Ruiz-Santaquiteria, J.; Bueno, G.; Deniz, O.; Vallez, N.; Cristobal, G. Semantic versus instance segmentation in microscopic algae detection. Eng. Appl. Artif. Intell. 2020, 87, 103271. [Google Scholar] [CrossRef]
- Kandel, I.; Castelli, M. Transfer learning with convolutional neural networks for diabetic retinopathy image classification: A review. Appl. Sci. 2021, 10, 2021. [Google Scholar] [CrossRef] [Green Version]
- Zhang, W.; Zhong, J.; Yang, S.; Gao, Z.; Hu, J.; Chen, Y.; Yi, Z. Automated identification and grading system of diabetic retinopathy using deep neural networks. Knowl.-Based Syst. 2019, 175, 12–25. [Google Scholar] [CrossRef]


| No. | Data Set | SE% | SP% | ACC% | PR% | MCC% | F1% | AUC | E |
|---|---|---|---|---|---|---|---|---|---|
| 1 | Mild | 90.4 | 91 | 91 | 90.4 | 60 | 88 | 0.89 | 0.56 |
| 2 | Moderate | 88.2 | 88.5 | 87.5 | 88.2 | 58 | 89 | 0.92 | 0.60 |
| 3 | Severe | 87 | 89.4 | 89.5 | 89.5 | 61 | 91 | 0.93 | 0.62 |
| 4 | Malignant | 89.7 | 90.8 | 95 | 89.7 | 65 | 93 | 0.90 | 0.57 |
| 5 | Normal | 94 | 93 | 91 | 94 | 60 | 95 | 0.91 | 0.58 |
| Average | 90.5 | 91.5 | 92.6 | 91.7 | 61 | 92 | 0.92 | 0.60 | |
| No. | Data set | SE% | SP% | ACC% | PR% | MCC% | F1% | AUC | E |
|---|---|---|---|---|---|---|---|---|---|
| 1 | 600 × 700 | 93 | 90.5 | 91.5 | 92.6 | 60 | 90 | 0.92 | 0.60 |
| 2 | 512 × 512 | 92.5 | 89 | 88.5 | 89.2 | 59 | 87 | 0.89 | 0.65 |
| 3 | 500 × 500 | 91 | 88 | 87.5 | 86.4 | 58 | 84 | 0.83 | 0.75 |
| 4 | 450 × 450 | 89 | 86 | 86.5 | 85.2 | 56 | 82 | 0.82 | 0.80 |
| 5 | 400 × 400 | 85 | 83 | 83.5 | 80.6 | 54 | 79 | 0.78 | 0.90 |
| 6 | 380 × 380 | 75 | 71.5 | 72.5 | 73.6 | 51 | 71 | 0.70 | 0.905 |
| No. | Architecture | SE% | SP% | ACC% | PR% | MCC% | F1% | AUC | E |
|---|---|---|---|---|---|---|---|---|---|
| 1 | 6-P-ND-M | 91.5 | 89.5 | 90 | 89.3 | 61 | 88 | 0.89 | 0.64 |
| 2 | 6-P-D-A | 89.2 | 88.1 | 88 | 89.2 | 58 | 87 | 0.88 | 0.67 |
| 3 | 7-P-ND-M | 87.3 | 86.5 | 86 | 87.3 | 57 | 86 | 0.87 | 0.69 |
| 4 | 7-P-D-A | 86.4 | 85.2 | 85.4 | 86.4 | 55 | 85 | 0.86 | 0.72 |
| 5 | 8-P-ND-M | 84.1 | 83.5 | 83.1 | 84.1 | 54 | 84 | 0.84 | 0.74 |
| 6 | 8-P-D-A | 80.6 | 79.1 | 79.3 | 80.6 | 53 | 81 | 0.80 | 0.76 |
| 7 | 9-P-ND-M | 78.7 | 76.5 | 77.5 | 78.7 | 51 | 79 | 0.78 | 0.78 |
| 8 | 9-P-D-A | 75.5 | 74.6 | 74.4 | 75.5 | 48 | 75 | 0.75 | 0.80 |
| 9 | 10-P-ND-M | 73.3 | 72.5 | 72.1 | 73.3 | 46 | 72 | 0.73 | 0.83 |
| 10 | 10-P-D-A | 72.2 | 71.1 | 71.6 | 72.2 | 45 | 71 | 0.72 | 0.85 |
| Methods | NR | MLD-HR | MOD-HR | SEV-HR | MLG-HR |
|---|---|---|---|---|---|
| Arsalan-HR [38] | 84.5/83.5/83.5/0.84 | 85.5/85.5/85.5/0.85 | 84.5/85.5/84.5/0.85 | 80.5/81.5/82.5/0.80 | 84.5/83.5/83.5/0.84 |
| Kriplani-AVR [39] | 82.5/81.5/82.5/0.82 | 83.5/82.5/83.5/0.83 | 83.5/82.5/82.5/0.82 | 80.5/81.0/82.0/0.81 | 82.5/81.5/82.5/0.82 |
| Tag-Semantic [40] | 83.1/82.2/81.5/0.83 | 84.1/85.2/84.5/0.84 | 83.1/82.2/81.5/0.82 | 82.1/82.2/81.5/0.82 | 83.1/82.2/81.5/0.83 |
| DenseHyper [31] | 85.5/83.5/83/0.84 | 87.5/84.5/83/0.86 | 85.6/84.5/84/0.85 | 82.5/84.5/84/0.82 | 84.5/83.5/83/0.84 |
| HYPER-RETINO | 94.1/93.4/91/0.92 | 90.0/91.4/91/0.89 | 88.5/88.2/87.5/0.92 | 90.5/93.5/96/0.93 | 89.5/90.5/95/0.90 |
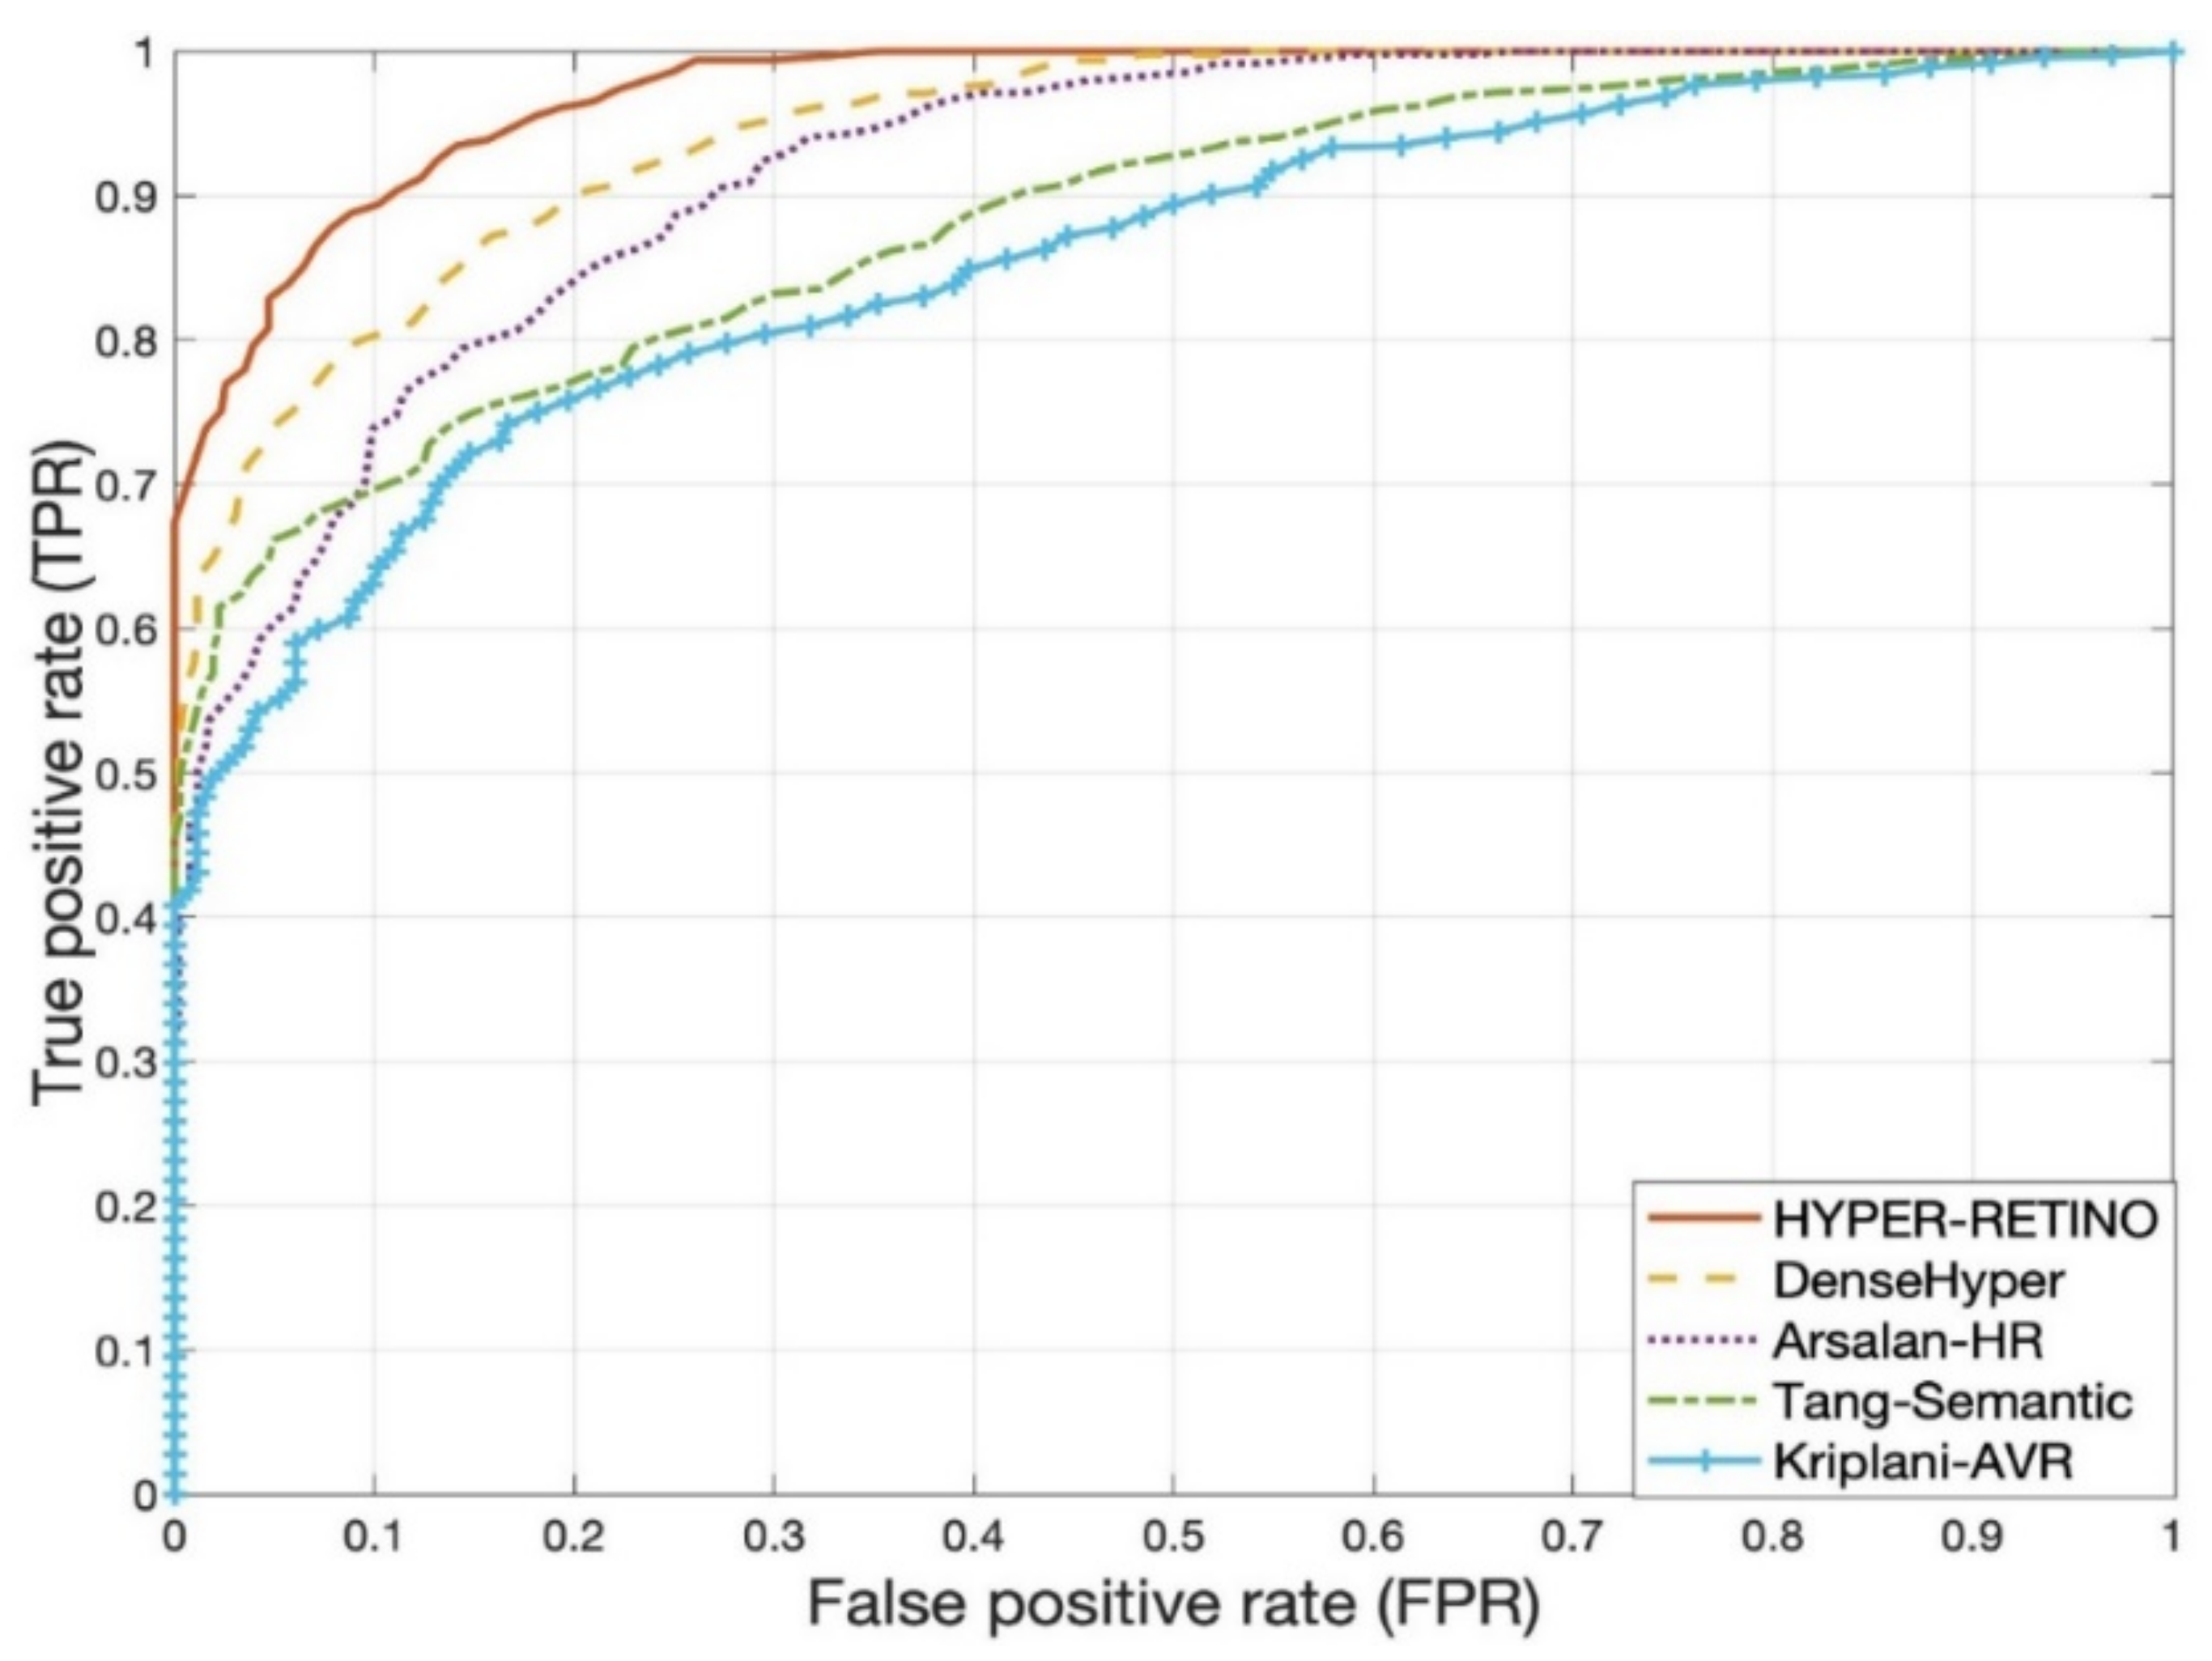
| No. | Methods | SE | SP | ACC | AUC |
|---|---|---|---|---|---|
| 1 | Arsalan-HR [38] | 78.5% | 81.5% | 80% | 0.80 |
| 2 | Kriplani-AVR [39] | 74.5% | 73.5% | 74% | 0.74 |
| 3 | Tang-Semantic [40] | 80.5% | 79.5% | 81% | 0.82 |
| 4 | DenseHyper [31] | 81.5% | 82.5% | 83% | 0.84 |
| 5 | HYPER-RETINO | 93% | 90.5% | 92.5% | 0.92 |
Publisher’s Note: MDPI stays neutral with regard to jurisdictional claims in published maps and institutional affiliations. |
© 2021 by the authors. Licensee MDPI, Basel, Switzerland. This article is an open access article distributed under the terms and conditions of the Creative Commons Attribution (CC BY) license (https://creativecommons.org/licenses/by/4.0/).
Share and Cite
Abbas, Q.; Qureshi, I.; Ibrahim, M.E.A. An Automatic Detection and Classification System of Five Stages for Hypertensive Retinopathy Using Semantic and Instance Segmentation in DenseNet Architecture. Sensors 2021, 21, 6936. https://doi.org/10.3390/s21206936
Abbas Q, Qureshi I, Ibrahim MEA. An Automatic Detection and Classification System of Five Stages for Hypertensive Retinopathy Using Semantic and Instance Segmentation in DenseNet Architecture. Sensors. 2021; 21(20):6936. https://doi.org/10.3390/s21206936
Chicago/Turabian StyleAbbas, Qaisar, Imran Qureshi, and Mostafa E. A. Ibrahim. 2021. "An Automatic Detection and Classification System of Five Stages for Hypertensive Retinopathy Using Semantic and Instance Segmentation in DenseNet Architecture" Sensors 21, no. 20: 6936. https://doi.org/10.3390/s21206936
APA StyleAbbas, Q., Qureshi, I., & Ibrahim, M. E. A. (2021). An Automatic Detection and Classification System of Five Stages for Hypertensive Retinopathy Using Semantic and Instance Segmentation in DenseNet Architecture. Sensors, 21(20), 6936. https://doi.org/10.3390/s21206936