In this set of experiments, the heating and the tap-water systems are individually analyzed to observe their performance independently. These are used to find correlations within the sub-system that are difficult to identify when analyzing an integrated system.
Experiments on the Heating System
This experimental scenario monitors the heating system, which is part of an HVAC&R system. The experiment is designed to help domain experts to better understand how the operational, performance, and contextual characteristics affect each other. The system contains various sensors, which are continuously collecting information. These metrics are classified into three views, representing the operation, performance, and context of the system. Details about the features included in each of these views are presented in
Table 1.
The system’s operational parameters include the secondary supply and return temperatures, and primary heat load. The average valve openness and its standard deviation together with sub-station efficiency are considered for measuring the performance. For the contextual parameters, average outdoor temperature, along with its standard deviation, are considered.
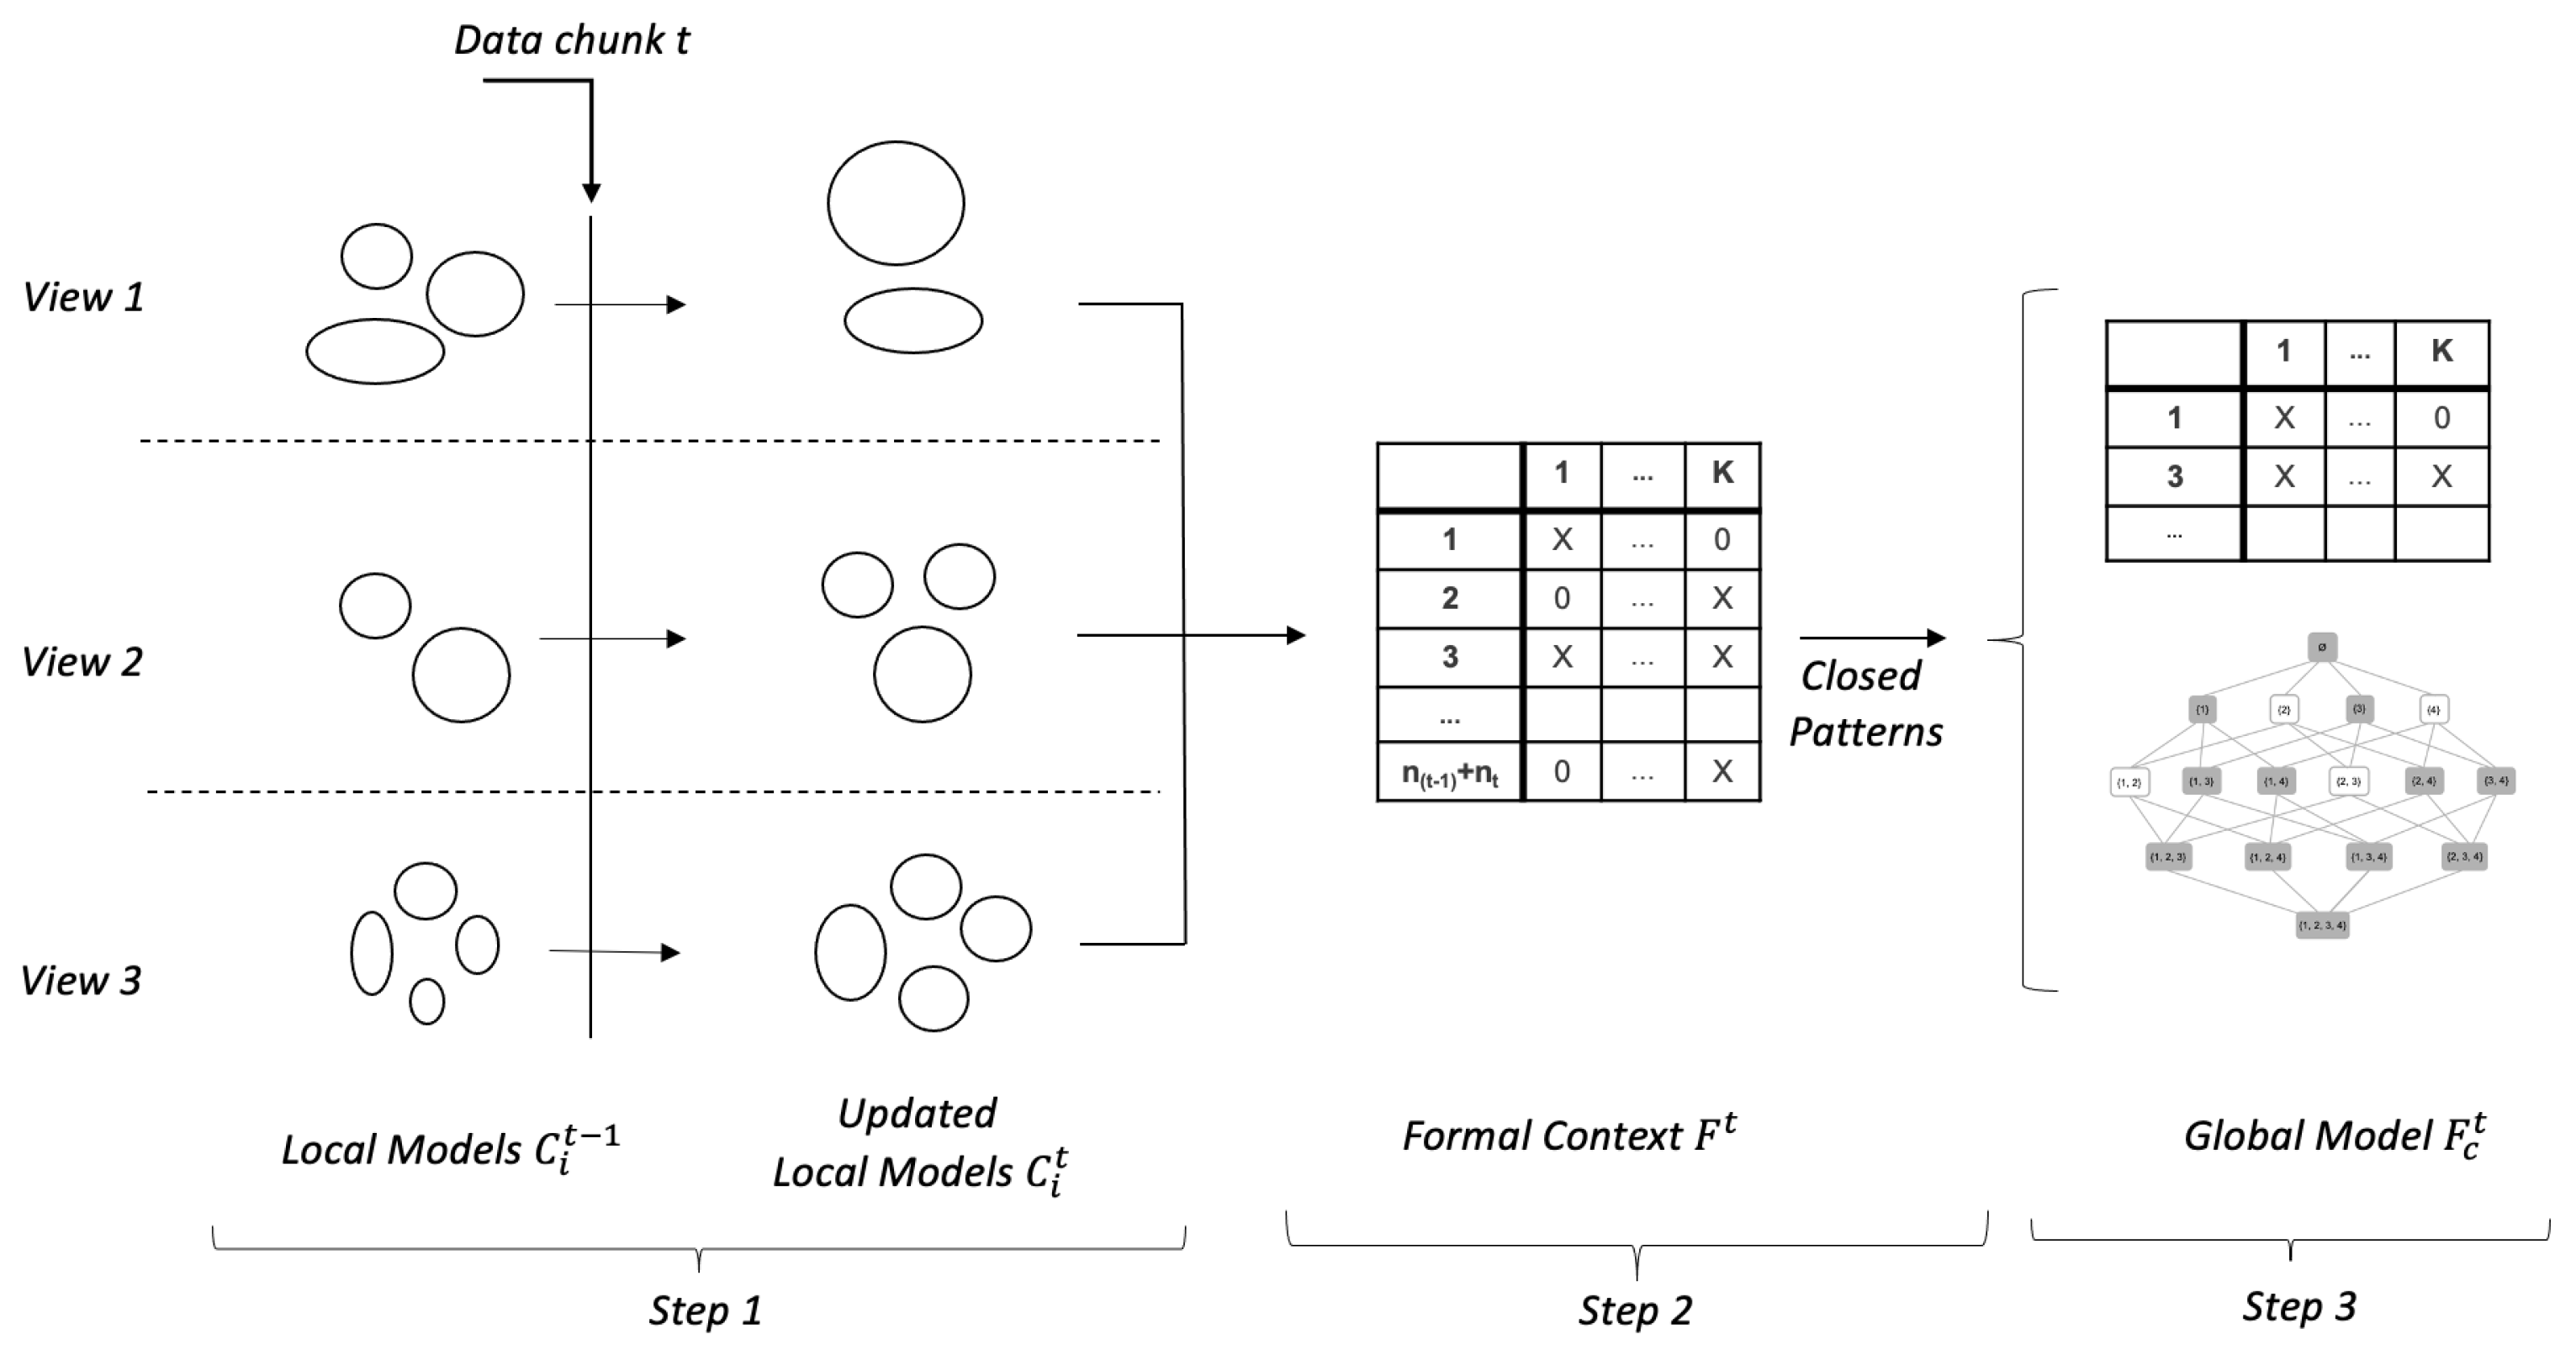
The proposed algorithm requires that the data in each chunk are initially clustered. Initial clustering in the operating and performance views, that is, views 1 and 2, is done using
k-means. The optimal value for
k is identified using SI. For the contextual view (view 3), initial clustering is performed based on the seasons in a year as proposed by [
37]. The data are divided into four clusters, namely winter (December to February), early spring and late summer (March, April, October, and November), late spring and early autumn (May and September), and summer (June to August). Details about the number of initial clusters in each chunk for different views can be seen in
Table 2.
Considering the chronological order in which the data arrive, MV-MIC is initially applied on chunks 1 and 2. First, the local models in each view are updated using the Bi-Correlation MI-Clustering, which produced
and 5 clusters for views 1, 2, and 3, respectively. Overview of each of these clusters from different views can be seen from
Table 3,
Table 4 and
Table 5. As stated in
Section 4.3.1, these tables are colored based on the size of the cluster and can be used for visualizing different working or contextual modes in each of the views.
After building a local model for each view, FCA is used to integrate them and build the global model, which contains a formal context and concept lattice. The concept lattice has 69 non-empty concepts. Among these, only 32 concepts connect all three views. As stated in
Section 4.3.1, visualization of the formal context can be used to compare the system behavior at higher granularity, e.g., a day. To illustrate this, two weeks of data are considered, where week one represents normal system behavior, while week two contains abnormal and sub-optimal behavior. A gap of one week is given in between to make sure that the normal and abnormal behaviors do not coincide.
Table 6 presents two weeks of data, that is, from 1 March 2019 to 7 March 2019 and 15 March 2019 to 21 March 2019, representing the system performance in March-2019. From these tables, it can be observed that during week two, the operating mode is always
, representing the deviating behavior, and a sudden drop in PHL down to
kW (see
Table 3). In comparison, the operating modes for normal behavior during this time are either
with an average PHL equal to
kW or
with an average PHL equal to
kW (the operating modes identified between 1 March 2019 to 7 March 2019). The performance and contextual modes during these weeks are identical. Such tables can help the domain expert identify the issues (here with the features related to the operating mode) and take timely action.
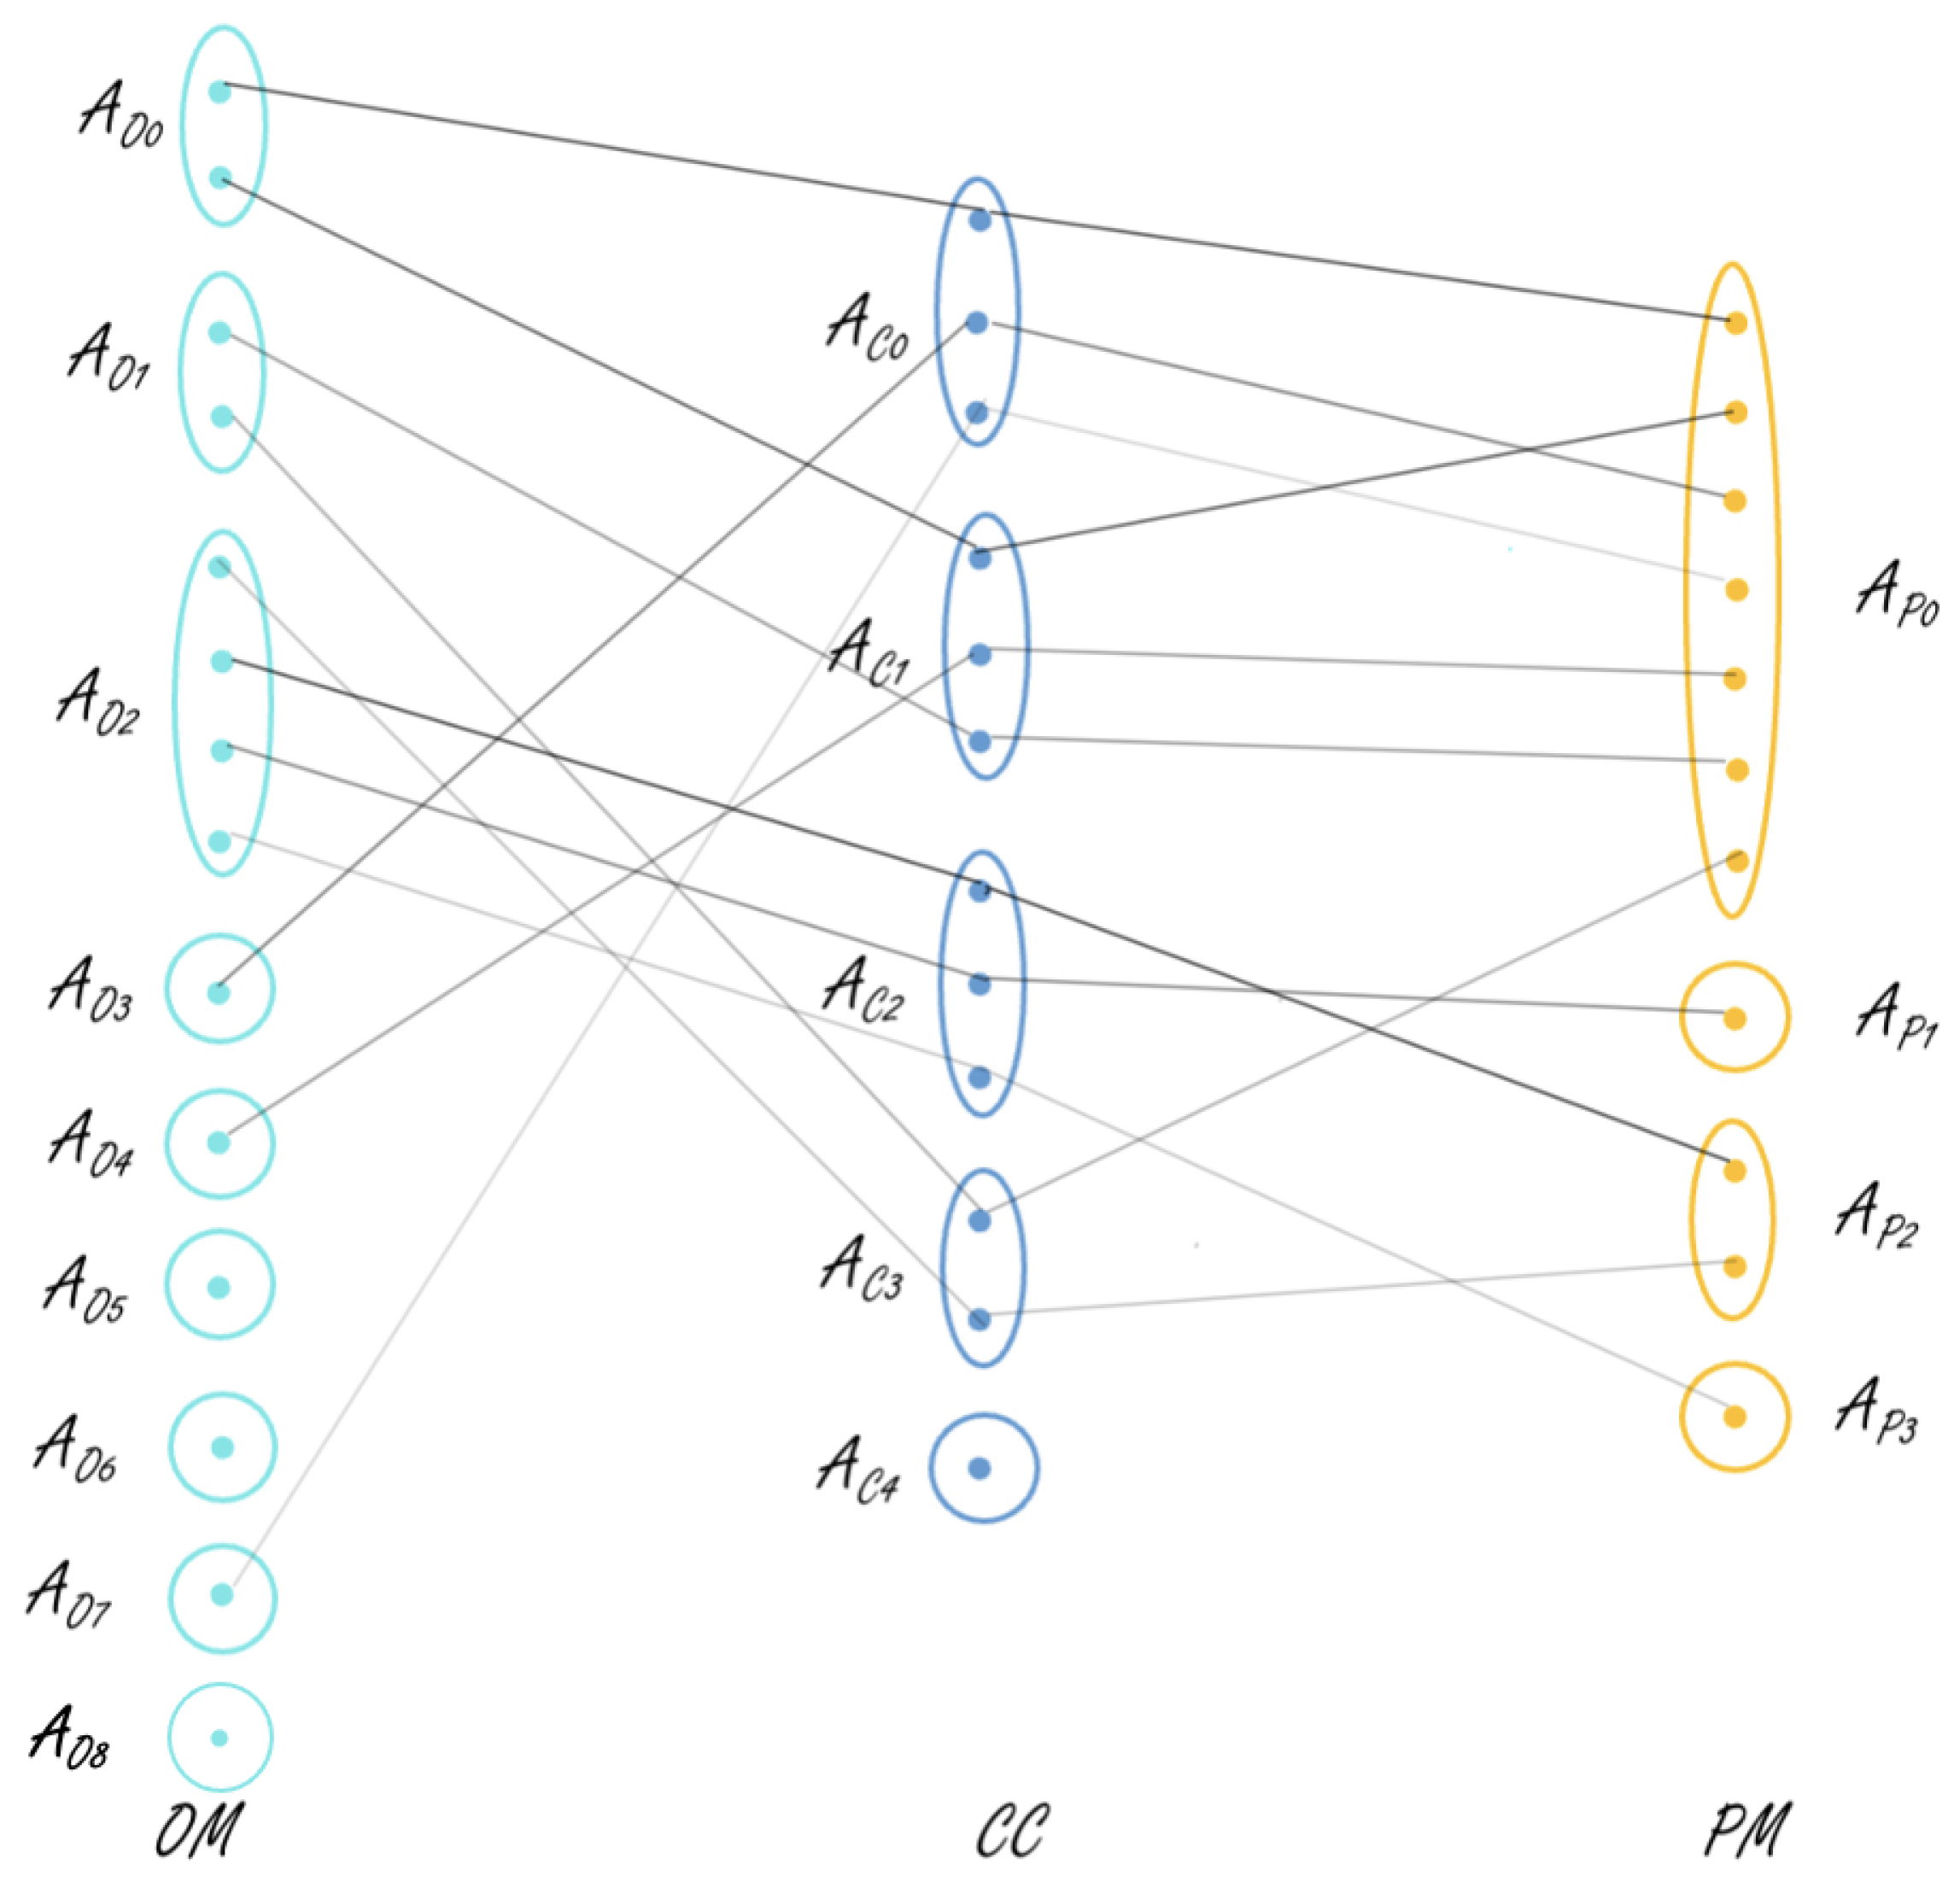
Next, closed patterns are used to extract the most common or frequent behavioral patterns. Support of ≈2.5% is used in this process, i.e., patterns that cover at least 2.5% of the data are considered to be frequent. There are 513 daily profiles in total when both chunks 1 and 2 are considered. That is, concepts with a frequency of at least 13 are considered. This gave us 31 concepts linking any two views and 11 concepts linking all three views. These 11 concepts are represented in
Table 7 and
Figure 4. In
Table 7, the data are sorted based on the OTM.
From
Table 7 it can be observed that there is a sudden drop in the PHL for concept 4, implicating a deviating behavior that matched with the prior information we had regarding issues in the system during March and April 2019. This showcases that the proposed algorithm is capable of detecting abnormal or deviating behaviors. Concepts 9 and 8 are very similar but could have been interpreted as different concepts because of the clustering in view 3, since the months in these concepts belong to different initial clusters.
Figure 4 is a tripartite graph representing all 11 concepts linking three views that are obtained after using closed patterns. This figure showcases the links between all three views and gives the observer an easy understanding of how the views are correlated. The edges of the graph are of varied thickness representing the size of the concept. Concepts with greater size are represented by thicker lines showing a stronger correlation between views, whereas the lighter lines imply that the considered concept is only supported by a few daily profiles, i.e., that the correlation is not strong. For example, the first link in the figure represents a concept linking clusters
,
, and
in views 1, 2, and 3, respectively. This is supported by a size of 60 daily profiles. The link between clusters
,
, and
in views 1, 2, and 3, on the other hand, is supported by a concept of size 14. One can also observe from the tripartite graph that some views’ clusters do not take part in any of the three-view concepts, e.g., clusters
, and
. These might be involved in two-view concepts. It is interesting to notice that
and
are the smallest clusters among the others in their local clustering models.
and
are also of the smallest clusters in view 1.
When chunk 3 arrives, the local clustering models in each view are updated again. The number of clusters in the updated local models are 8, 3, and 6 clusters in views 1, 2, and 3, respectively. These can be viewed in
Table 8,
Table 9 and
Table 10. When comparing the operating modes clusters between
Table 3 and
Table 8, it can be observed that in
Table 3, operating mode
, which represents deviating behavior, can be considered as an additional mode. All the other modes except
from
Table 3 can be compared to one of the modes listed in
Table 8. That is, clusters
,
, and
from
Table 8 are similar to clusters
,
, and
, respectively, from
Table 3. Clusters
,
, and
in
Table 8, on the other hand, are close to clusters
,
, and
, respectively, from
Table 3. It can be stated that when the local models are updated, some clusters are retained while some are updated. For the performance modes, the number of clusters are not evenly distributed, and a majority of the instances are grouped into cluster
(see
Table 9). In view 3, as stated before, the clustering is done based on the seasons of the year, there are some new clusters, some of them are retained while others are updated.
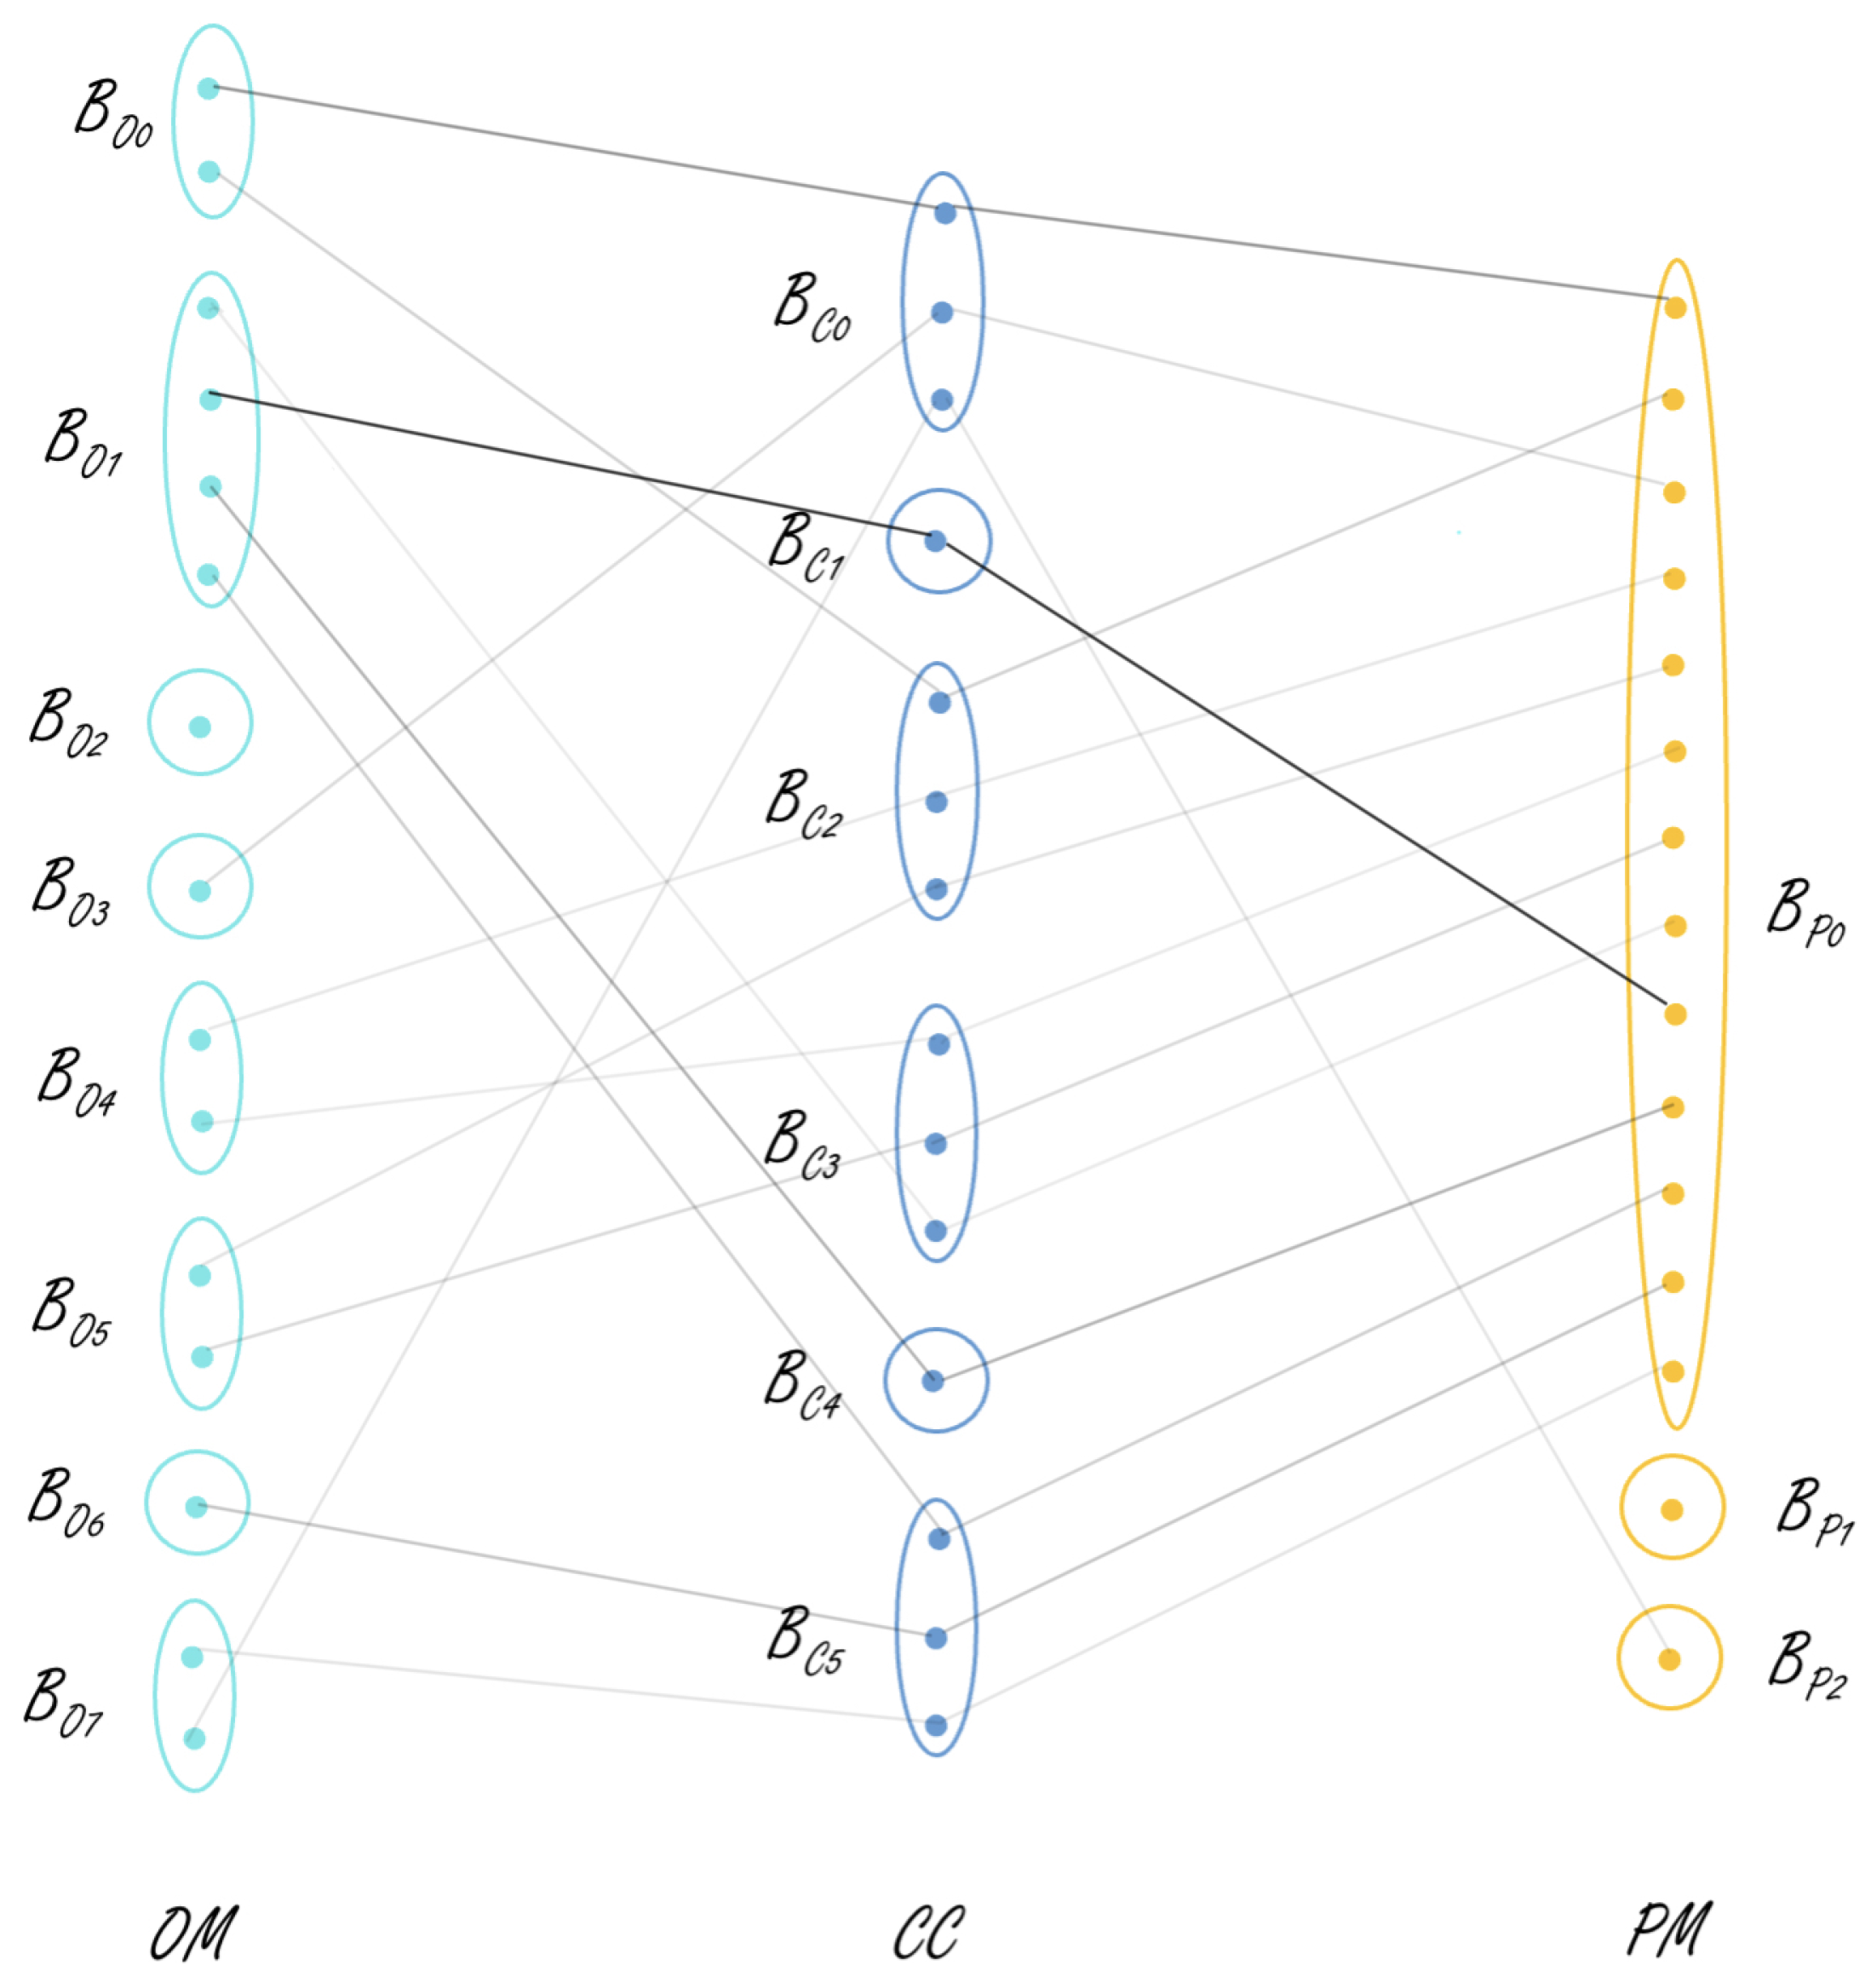
After the global model is built, initially, there are 48 non-empty concepts; among these, 23 concepts connect all the three views. As the number of instances in chunks 2 and 3 combined is 329, support of 8 is used when extracting closed patterns. When closed patterns are used to extract the most frequent patterns, 32 concepts connecting any two views and 14 concepts connecting all the three views are obtained. The latter are represented in
Table 11. From this table, deviating behavior is seen in concepts
, and 10, where the PHL shows a significant difference from its original pattern. Furthermore, it is interesting to note that all these concepts show deviating behavior with respect to SE. As one can observe, SE in concepts 3, 9, and 10 is negative, while in concepts 4 and 11, it has unexpectedly high (2852%) and low (21%) values, respectively. These results were discussed with the domain expert and it was identified that there were in fact some issues in the system from the end of September till mid-December 2020. This once again showcases the potential of the proposed algorithm in identifying new trends in the data, long-term fault within the system in this scenario.
Figure 5 represents the links between different views of the concepts present in
Table 11, which are obtained after using closed patterns. For example, the link between
,
, and
supported by 80 instances is the strongest correlation and represents concept 13.
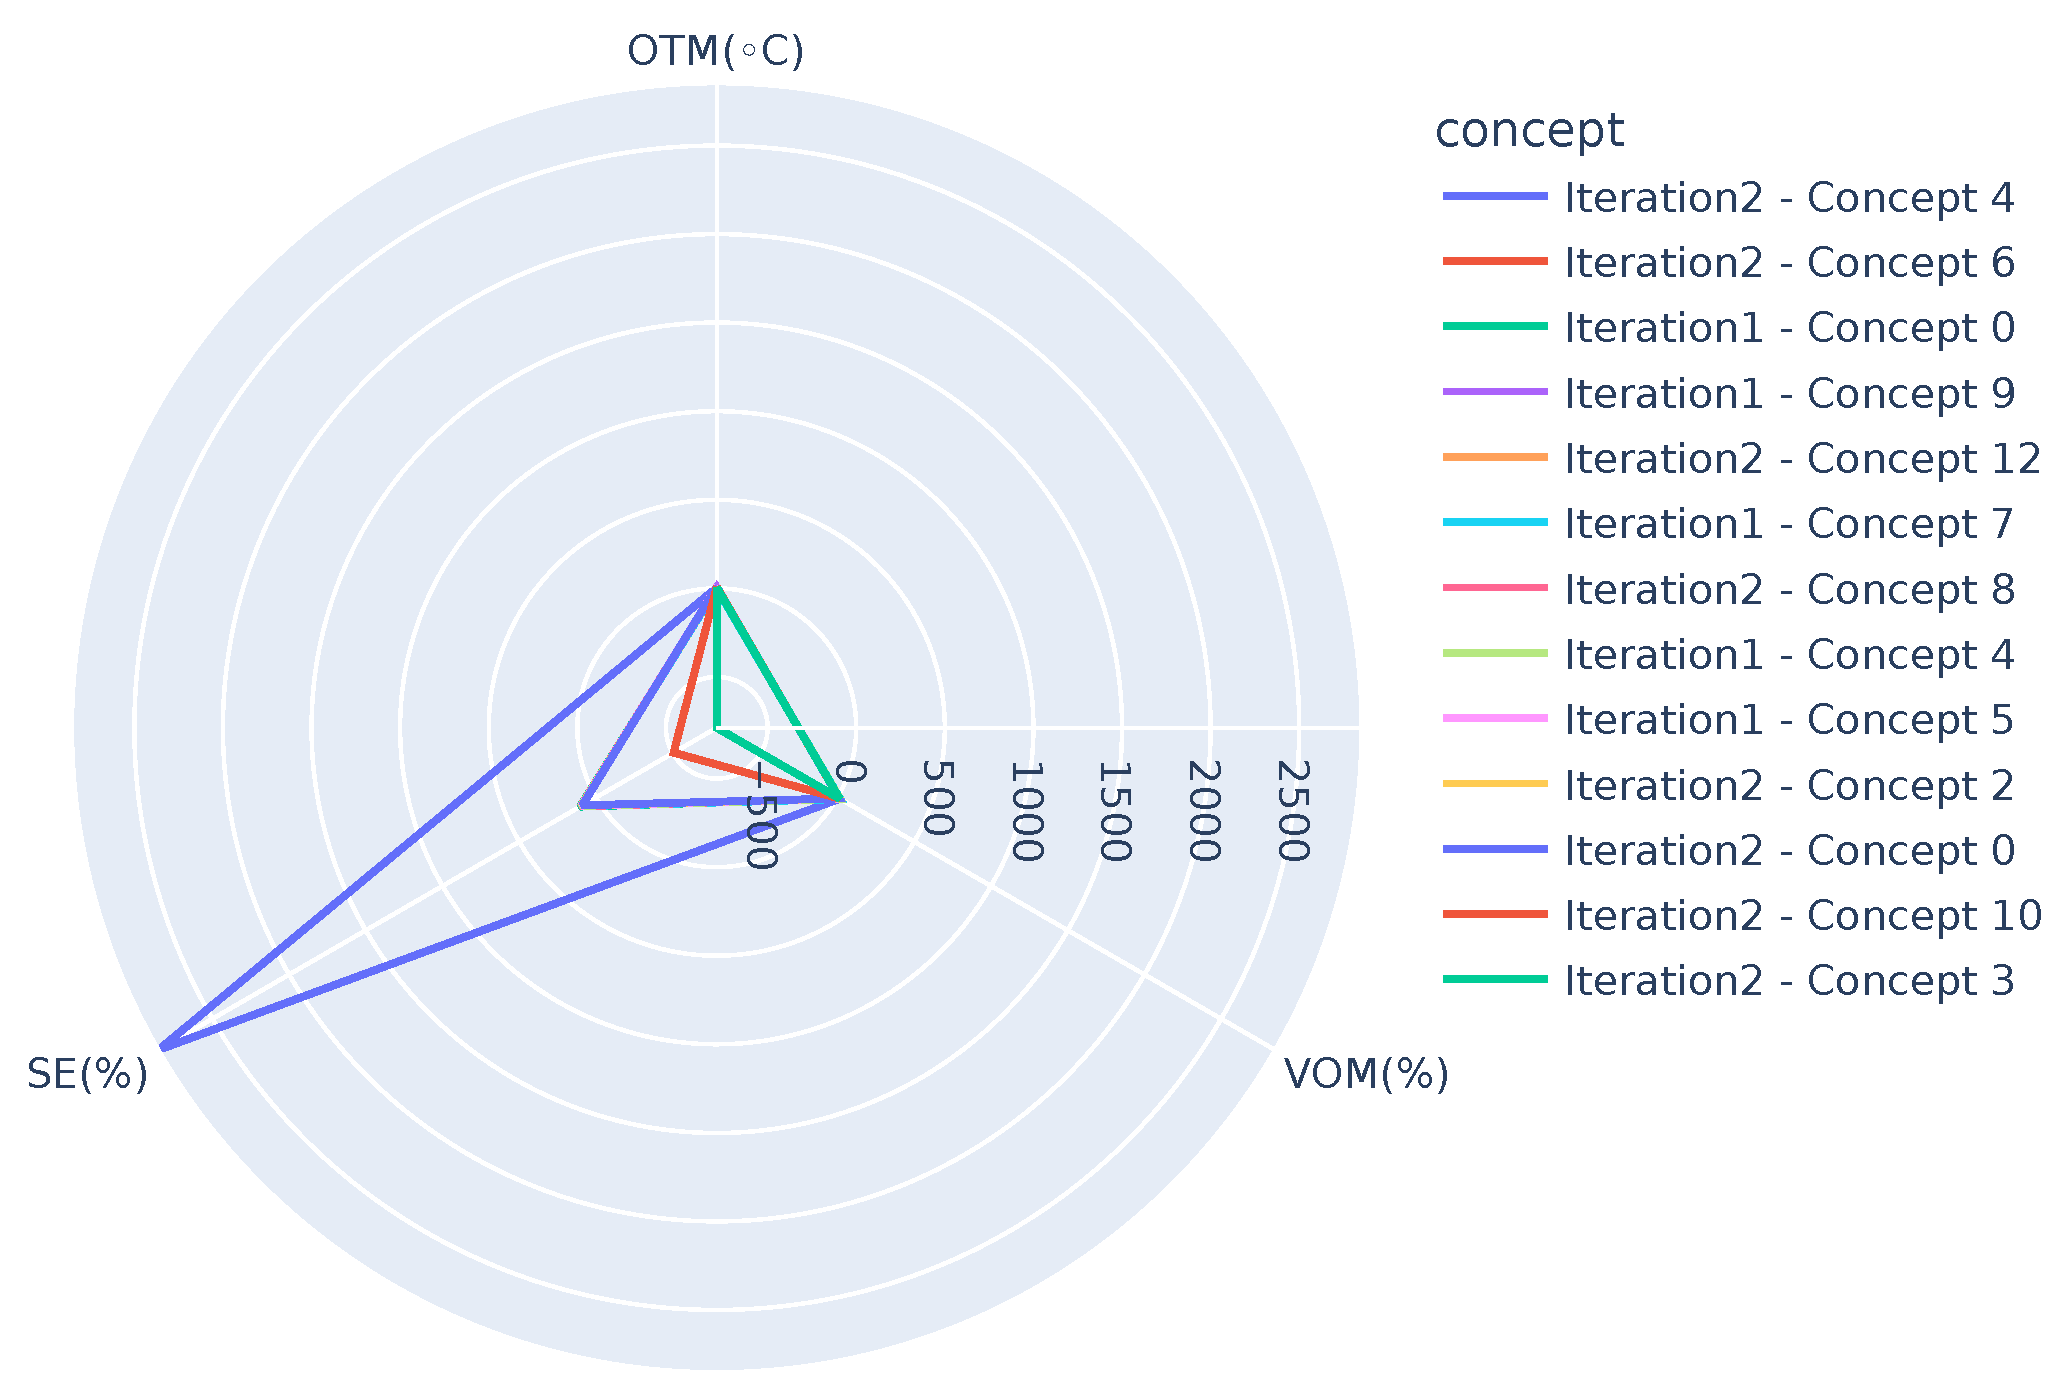
In order to get further insight into the differences between the concepts and/or to track any potential drifts, visualization techniques such as the ones shown in
Figure 6,
Figure 7 and
Figure 8 can be used.
Figure 6 presents concepts from both the iterations, i.e., one after receiving chunk 2 and the other after receiving chunk 3 when OTM is in the range, 10 °C < OTM < 15 °C. It can be observed that the graphs highlight two extremes,
Iteration2-Concept 9 (
) and
Iteration 2-Concept 11 (
), where the SE (SE ranges from 0 up to 100%. However, due to the generation of hot tap water, it can rise up to 120%.) shows deviation from the other concepts. Similarly,
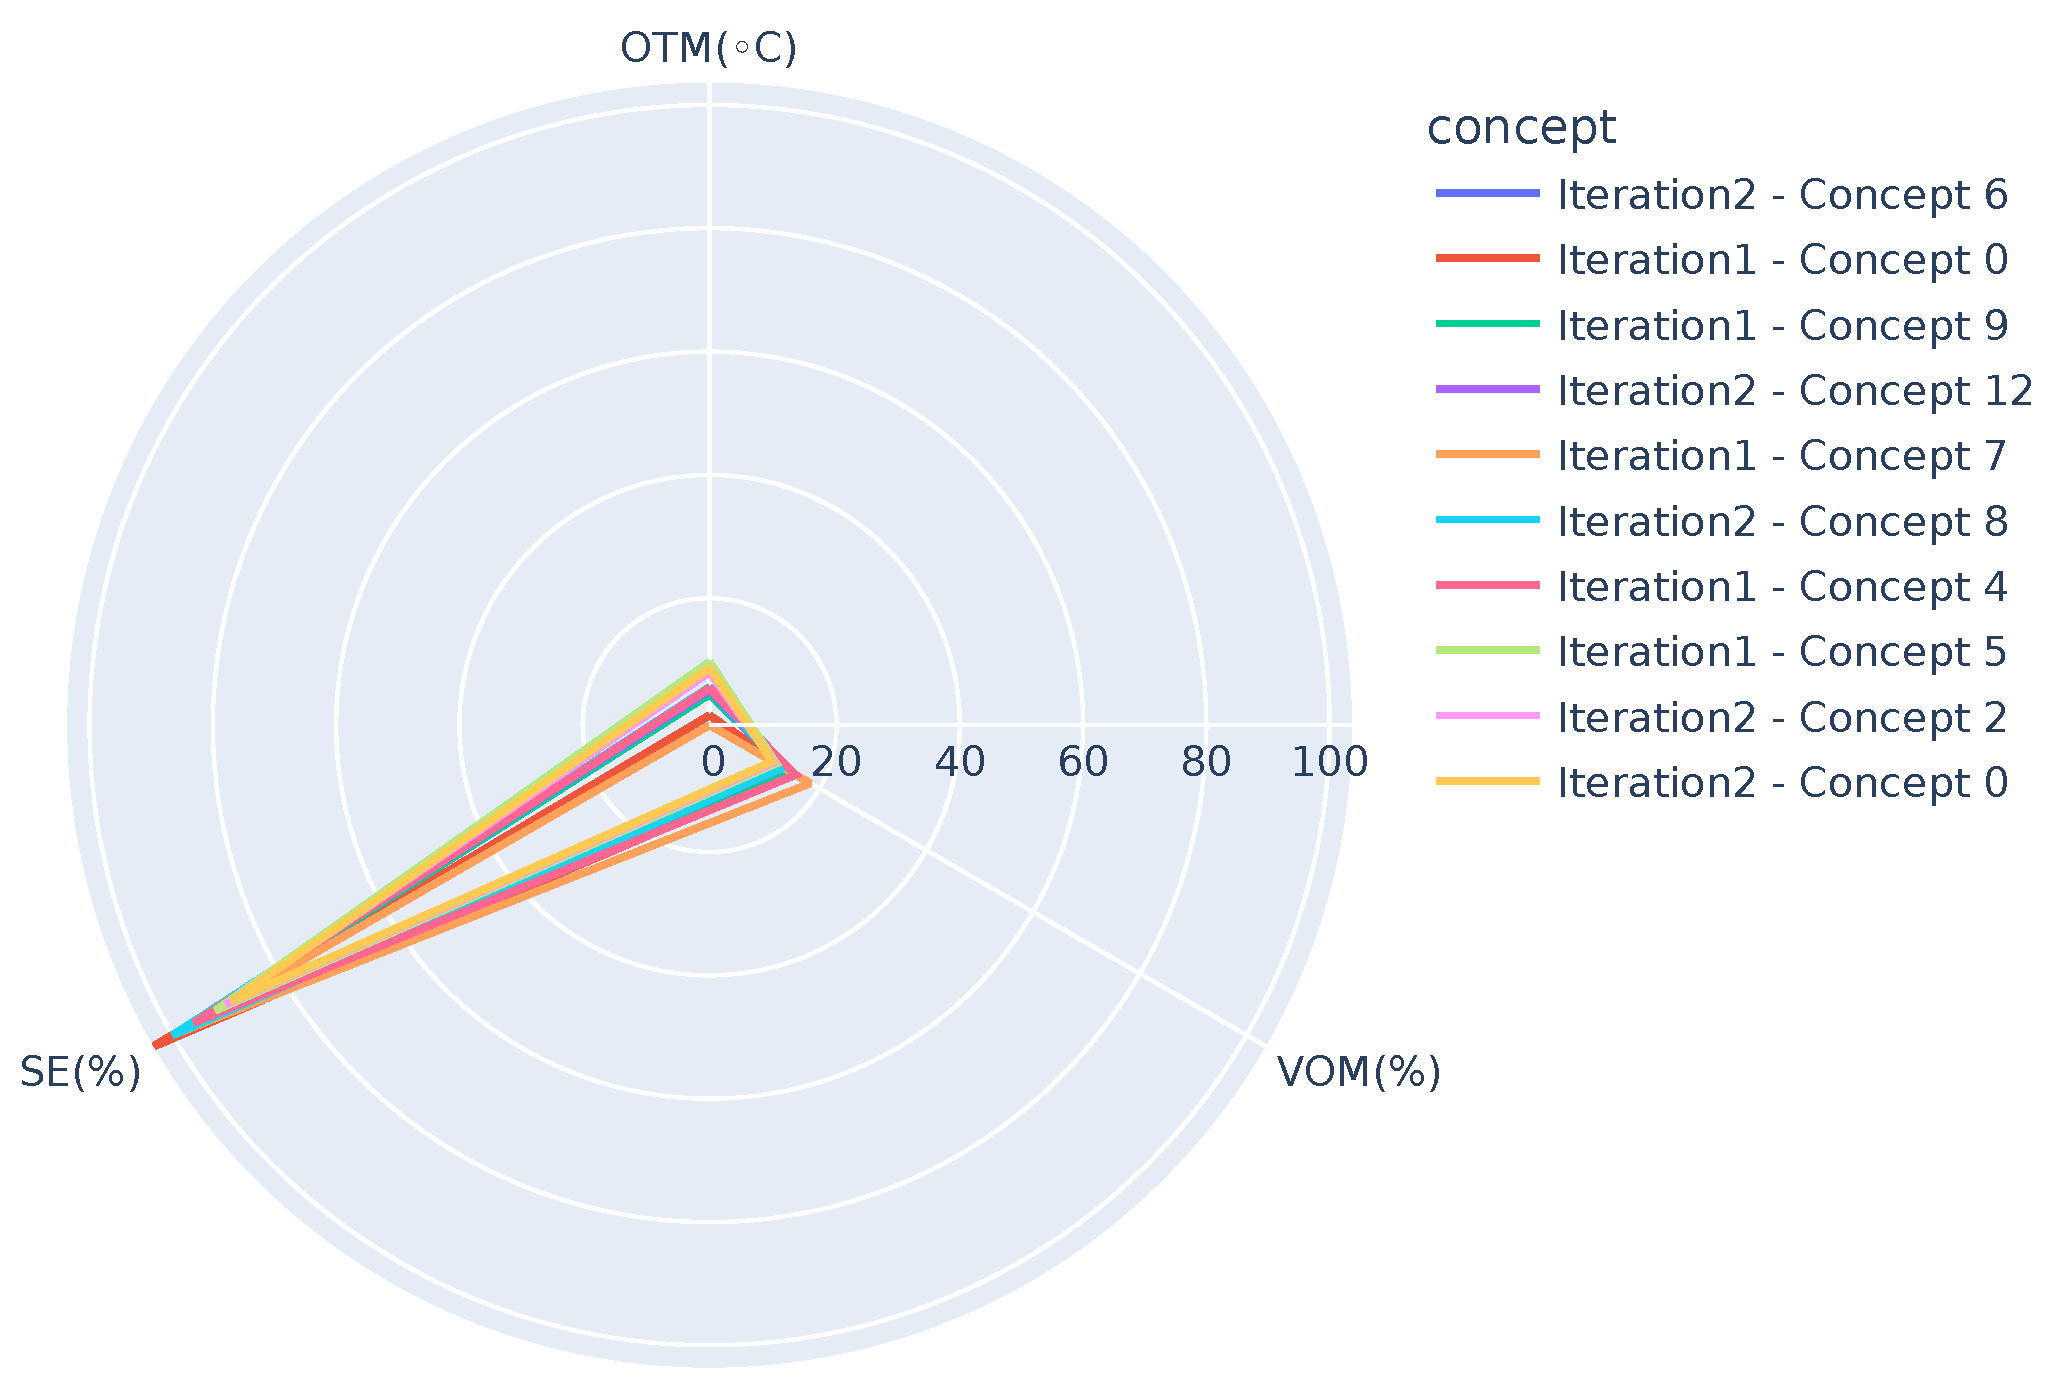
Figure 7 presents concepts when OTM < 10 °C and highlights three deviations,
Iteration 2-Concept 4 (
),
Iteration 2-Concept 3 (
), and
Iteration 2-Concept 10 (
). Note that except for the mentioned concepts, all the others in the figure overlap, showing the similarity among them.
Figure 8 presents concepts of both the iterations after removing the deviating concepts when OTM < 10 °C. It can be clearly observed that all concepts are close to one another. As demonstrated, these graphs can be used by domain experts to see the similarities or changes between different concepts, which can help them to identify the changes in the behavior of the system. In the long run, they can also have one such graph for each smaller temperature range (say, for example, 1 or 2 °C). It is expected that concepts in the same temperature range should be similar, so even a small deviation in behavior (gradual concept drift) can also be observed.
Experiments on the Tap-Water System
Similar to the experiments conducted for the heating system, individual system analysis is also performed on the tap-water system. Based on the discussion and feedback received from the domain expert, the features characterizing the tap-water behavior are divided into three views, namely operation, performance, and context, as shown in
Table 12.
The features measuring the system’s operational parameters include the primary heat load, volume of water used during the day, supply, and return temperatures. For measuring the performance, openness of both the valves used by the tap-water system along with the primary delta (difference between the primary supply and primary return temperatures) are considered. Among the two valves, VOM3, a three-way valve, is responsible for regulating the hot tap-water temperature to be around 60 °C. In order to maintain this temperature, the valve might sometimes allow cold water to be mixed with hot water. Hence, its standard deviation is not considered as it is not varied often. The outdoor temperature and the openness of the valve from the heating system are considered as the contextual parameters. The valve openness of the heating system is included as a contextual parameter as it impacts the tap-water system. The hot water obtained from the primary network first goes through the heating system to heat the room, and after that, the water is used by the tap-water system. The valve in the heating system lets out this water and hence can be considered as a context from the tap-water system point of view. It can also be noted that during the non-heating seasons, that is, when the outdoor temperature is above 17 °C, the heating system valve is completely closed and the heat obtained from the primary network is only used to heat the tap-water.
Initial clustering in all the chunks and for all the three views is done using
k-means clustering, for which SI is used to determine the optimal number of clusters.
Table 13 presents details about the number of initial clusters considered for each of the data chunks.
When the global model is updated after the arrival of chunk 2, the concept lattice generated contained 132 non-empty concepts, of which 59 concepts connected all three views. After using the closed patterns, the model has 48 concepts connecting any two views of the local models and 16 connecting all three views.
Table 14 represents all these 16 concepts.
As explained earlier, VOM3 is the valve openness mean of a three-way valve used in the tap-water system. It has an opening for letting in the cold water when the temperature of the water is above 60 °C. Opening this valve for letting in cold water is not the desired function, as it leads to energy waste, i.e., the water is initially heated and then cooled down. So, in the desired functionality, the valve of VOM3 should be close to 100, representing that the valve only allows hot water to go through. It can be observed from
Table 14 that the model was able to categorize the concepts (10, 13, 14, and 15), where the average values for VOM3 are a lot less than 100, implicating that the valve was opened to let in cold water to maintain the water temperature, which is not desired. This can help the domain experts to analyze the identified situation and detect what went wrong. It is interesting to note that two out of these four (concepts 15 and 14) occurred when hot water consumption was high. All the four concepts occurred during the heating season, that is, when the outdoor temperature is below 15 °C. This reflects the heating system’s impact on the tap-water system as discussed previously when explaining categorizing the features into different views.
The global model is again updated after receiving chunk 3. This time, the generated concept lattice has 63 non-empty concepts, of which 35 concepts link all three views. After the closed patterns are used, there are 35 concepts linking any two views and 18 concepts linking all three views.
Table 15 presents all these 18 concepts. Similar to what is observed for the model generated on the first two chunks (
Table 14), the average VOM3 values are not close to 100 during the heating season in four concepts (0, 12, 16, and 17). This is explainable as there are influences from the heating system when it is running. It can also be observed in these concepts that the supply temperature (
) of the tap-water system is over the natural threshold (55 °C), which is expected. Furthermore, the values for
are high when compared with other values.


 ,
, 


