Article

Autonomous Surface and Underwater Vehicles as Effective Ecosystem Monitoring and Research Platforms in the Arctic—The Glider Project †

by
Lionel Camus
1,*,
Hector Andrade
2,
Ana Sofia Aniceto
3,
Magnus Aune
1,
Kanchana Bandara
4,
Sünnje Linnéa Basedow
5,
Kai Håkon Christensen
6,
Jeremy Cook
7,
Malin Daase
5,
Katherine Dunlop
2,
Stig Falk-Petersen
1,
Peer Fietzek
8,
Gro Fonnes
7,
Peygham Ghaffari
1,
Geir Gramvik
9,
Inger Graves
10,
Daniel Hayes
11,
Tor Langeland
7,
Harald Lura
12,
Trond Kristiansen
13,
Ole Anders Nøst
1,
David Peddie
14,
Joel Pederick
15,
Geir Pedersen
7,
Ann Kristin Sperrevik
6,
Kai Sørensen
13,
Luca Tassara
1,
Sigurd Tjøstheim
9,
Vigdis Tverberg
4 and
Salve Dahle
1
add Show full author list remove Hide full author list
1
Akvaplan-niva AS, 9007 Tromsø, Norway
2
Institute of Marine Research, 9007 Tromsø, Norway
3
The Norwegian College of Fishery Science, Faculty of Fisheries and Bioeconomics, UiT—The Arctic University of Norway, 9037 Tromsø, Norway
4
Faculty for Bioscience and Aquaculture, Nord University, 8026 Bodø, Norway
5
Department of Arctic and Marine Biology, Faculty of Biosciences, Fisheries and Economics, UiT The Arctic University of Norway, 9037 Tromsø, Norway
6
R&D Department, Norwegian Meteorological Institute, 0371 Oslo, Norway
7
NORCE Norwegian Research Center, 5008 Bergen, Norway
8
Kongsberg Maritime Germany GmbH, 22529 Hamburg, Germany
9
Kongsberg Digital, 3616 Kongsberg, Norway
10
Aanderaa Xylem, 5225 Nesttun, Norway
11
Cyprus Sub Sea Consulting & Services, 2326 Nicosia, Cyprus
12
ConocoPhillips Skandinavia AS, 4056 Tananger, Norway
13
Marin Biogeochemistry and Oceanography, NIVA, 0579 Oslo, Norway
14
Offshore Sensing AS, 5072 Bergen, Norway
15
Maritime Robotics AS, 7010 Trondheim, Norway
*
Author to whom correspondence should be addressed.
This paper is an extension version of the conference paper: Camus, L.; Pedersen, G.; Falk-Petersen, S.; Dunlop, K.; Daase, M.; Basedow, S.L.; Bandara, K.; Tverberg, V.; Pederick, J.; Peddie, D.; et al. Autonomous surface and underwater vehicles reveal new discoveries in the Arctic Ocean. In Proceedings of the OCEANS 2019—Marseille, Marseille, France, 17–20 June 2019.
Sensors 2021, 21(20), 6752; https://doi.org/10.3390/s21206752
Submission received: 11 August 2021 / Revised: 4 October 2021 / Accepted: 8 October 2021 / Published: 12 October 2021
(This article belongs to the Section Sensors and Robotics)

Abstract

:
Effective ocean management requires integrated and sustainable ocean observing systems enabling us to map and understand ecosystem properties and the effects of human activities. Autonomous subsurface and surface vehicles, here collectively referred to as “gliders”, are part of such ocean observing systems providing high spatiotemporal resolution. In this paper, we present some of the results achieved through the project “Unmanned ocean vehicles, a flexible and cost-efficient offshore monitoring and data management approach—GLIDER”. In this project, three autonomous surface and underwater vehicles were deployed along the Lofoten–Vesterålen (LoVe) shelf-slope-oceanic system, in Arctic Norway. The aim of this effort was to test whether gliders equipped with novel sensors could effectively perform ecosystem surveys by recording physical, biogeochemical, and biological data simultaneously. From March to September 2018, a period of high biological activity in the area, the gliders were able to record a set of environmental parameters, including temperature, salinity, and oxygen, map the spatiotemporal distribution of zooplankton, and record cetacean vocalizations and anthropogenic noise. A subset of these parameters was effectively employed in near-real-time data assimilative ocean circulation models, improving their local predictive skills. The results presented here demonstrate that autonomous gliders can be effective long-term, remote, noninvasive ecosystem monitoring and research platforms capable of operating in high-latitude marine ecosystems. Accordingly, these platforms can record high-quality baseline environmental data in areas where extractive activities are planned and provide much-needed information for operational and management purposes.

1. Introduction

Oceans cover up to 71% of the earth’s surface, regulate the global climate system, supply more than half the biosphere’s oxygen, and sustain the livelihood of billions of people worldwide [1,2,3,4,5,6]. The ongoing decline in land-based resources is causing increased demand for marine resources such as food and energy and is expanding human marine activities including transportation and recreation, which ultimately threaten the ocean’s health [6,7,8,9]. Effective ocean management requires integrated and sustainable ocean observing systems, which enable us to better understand ocean processes and the impacts of human activities [6,10]. Autonomous subsurface and surface vehicles, here collectively referred to as |“gliders”, are advanced ocean observing systems providing high spatiotemporal resolution [10,11,12,13,14,15]. Equipped with energy-efficient sensors, innovative communication means, and data management systems, these vehicles are commanded remotely, and report results to land in near-real-time, providing a new set of tools to efficiently collect ecological and commercially relevant data from the open ocean and coastal areas. Through the project “Unmanned ocean vehicles, a flexible and cost-efficient offshore monitoring and data management approach”, three different gliders were deployed from March to September 2018, along the Lofoten–Vesterålen (LoVe) shelf-slope-oceanic system in Arctic Norway. This period covered the annual blooms of primary and secondary production, which in turn sustain high fish density aggregations in spawning grounds where cetaceans also feed [11,16,17,18,19]. The highly productive LoVe area is of prime interest to develop the national blue economy, with stakeholders including fisheries, offshore energy, aquaculture, shipping, and tourism. As such, the area is prone to increased anthropogenic pressure and concurrent environmental changes [20]. Current and future ocean-based value creation depends on sustainable use of the ocean’s resources for which environmental monitoring and research are fundamental [20]. There is a need to gain knowledge about the LoVe ecosystem to develop appropriate management approaches to ensure environmental quality, business sustainability [12,21], and good governance. Building this knowledge requires additional and persistent data collection that cannot rely solely on sampling by traditional vessels due to practical and economic reasons. Currently, autonomous continuous long-term in situ monitoring programs exist for the LoVe region thanks to an underwater observatory system that employs crawler and stationary platforms to study ecological processes in the deep sea (https://love.equinor.com/) (accessed on 7 October 2021) [12,22,23,24,25]. The deep sea, however, is a highly dynamic environment where benthic ecosystems are interconnected with the water column and the surface through the exchange of energy, mass, or nutrients [26,27,28]. Thus, knowledge of a wide variety of ecological and biological variables is needed to improve ecosystem monitoring, from the seabed to the surface. To achieve such monitoring capabilities of the entire water column across a wide spatiotemporal spectrum, a spatial hierarchy of clusters and networks should integrate various observation technologies [29,30].
The goal of the GLIDER project was to test three gliders equipped with sensors capable of collecting physical, biogeochemical, and biological data simultaneously, performing an integrated ecosystem survey across different depths and a wide geographical area. At the same time, data collected by the gliders were incorporated in near-real-time into a data assimilative ocean circulation model to test whether the model forecast could be improved for the LoVe region, where geomorphological challenges are brought about by a complex coastline, the presence of fjords, and strong seasonal freshwater input. A data management e-platform was developed to ensure data storage and visualization for researchers and managers.
In this paper, we present the project concept and review some of the initial results achieved after a six-month deployment along the LoVe shelf-slope. These findings, initially presented at the OCEAN 2019 conference (Marseille, 17–20 June) [21] are expanded here and demonstrate the cost-efficient, long-term, low invasive, and autonomous monitoring and research capabilities of gliders in collecting high-quality environmental and biological data simultaneously. Together, gliders and other autonomous robotic seafloor infrastructure offer unique ecosystem monitoring capabilities for the LoVe region.

2. Materials and Methods

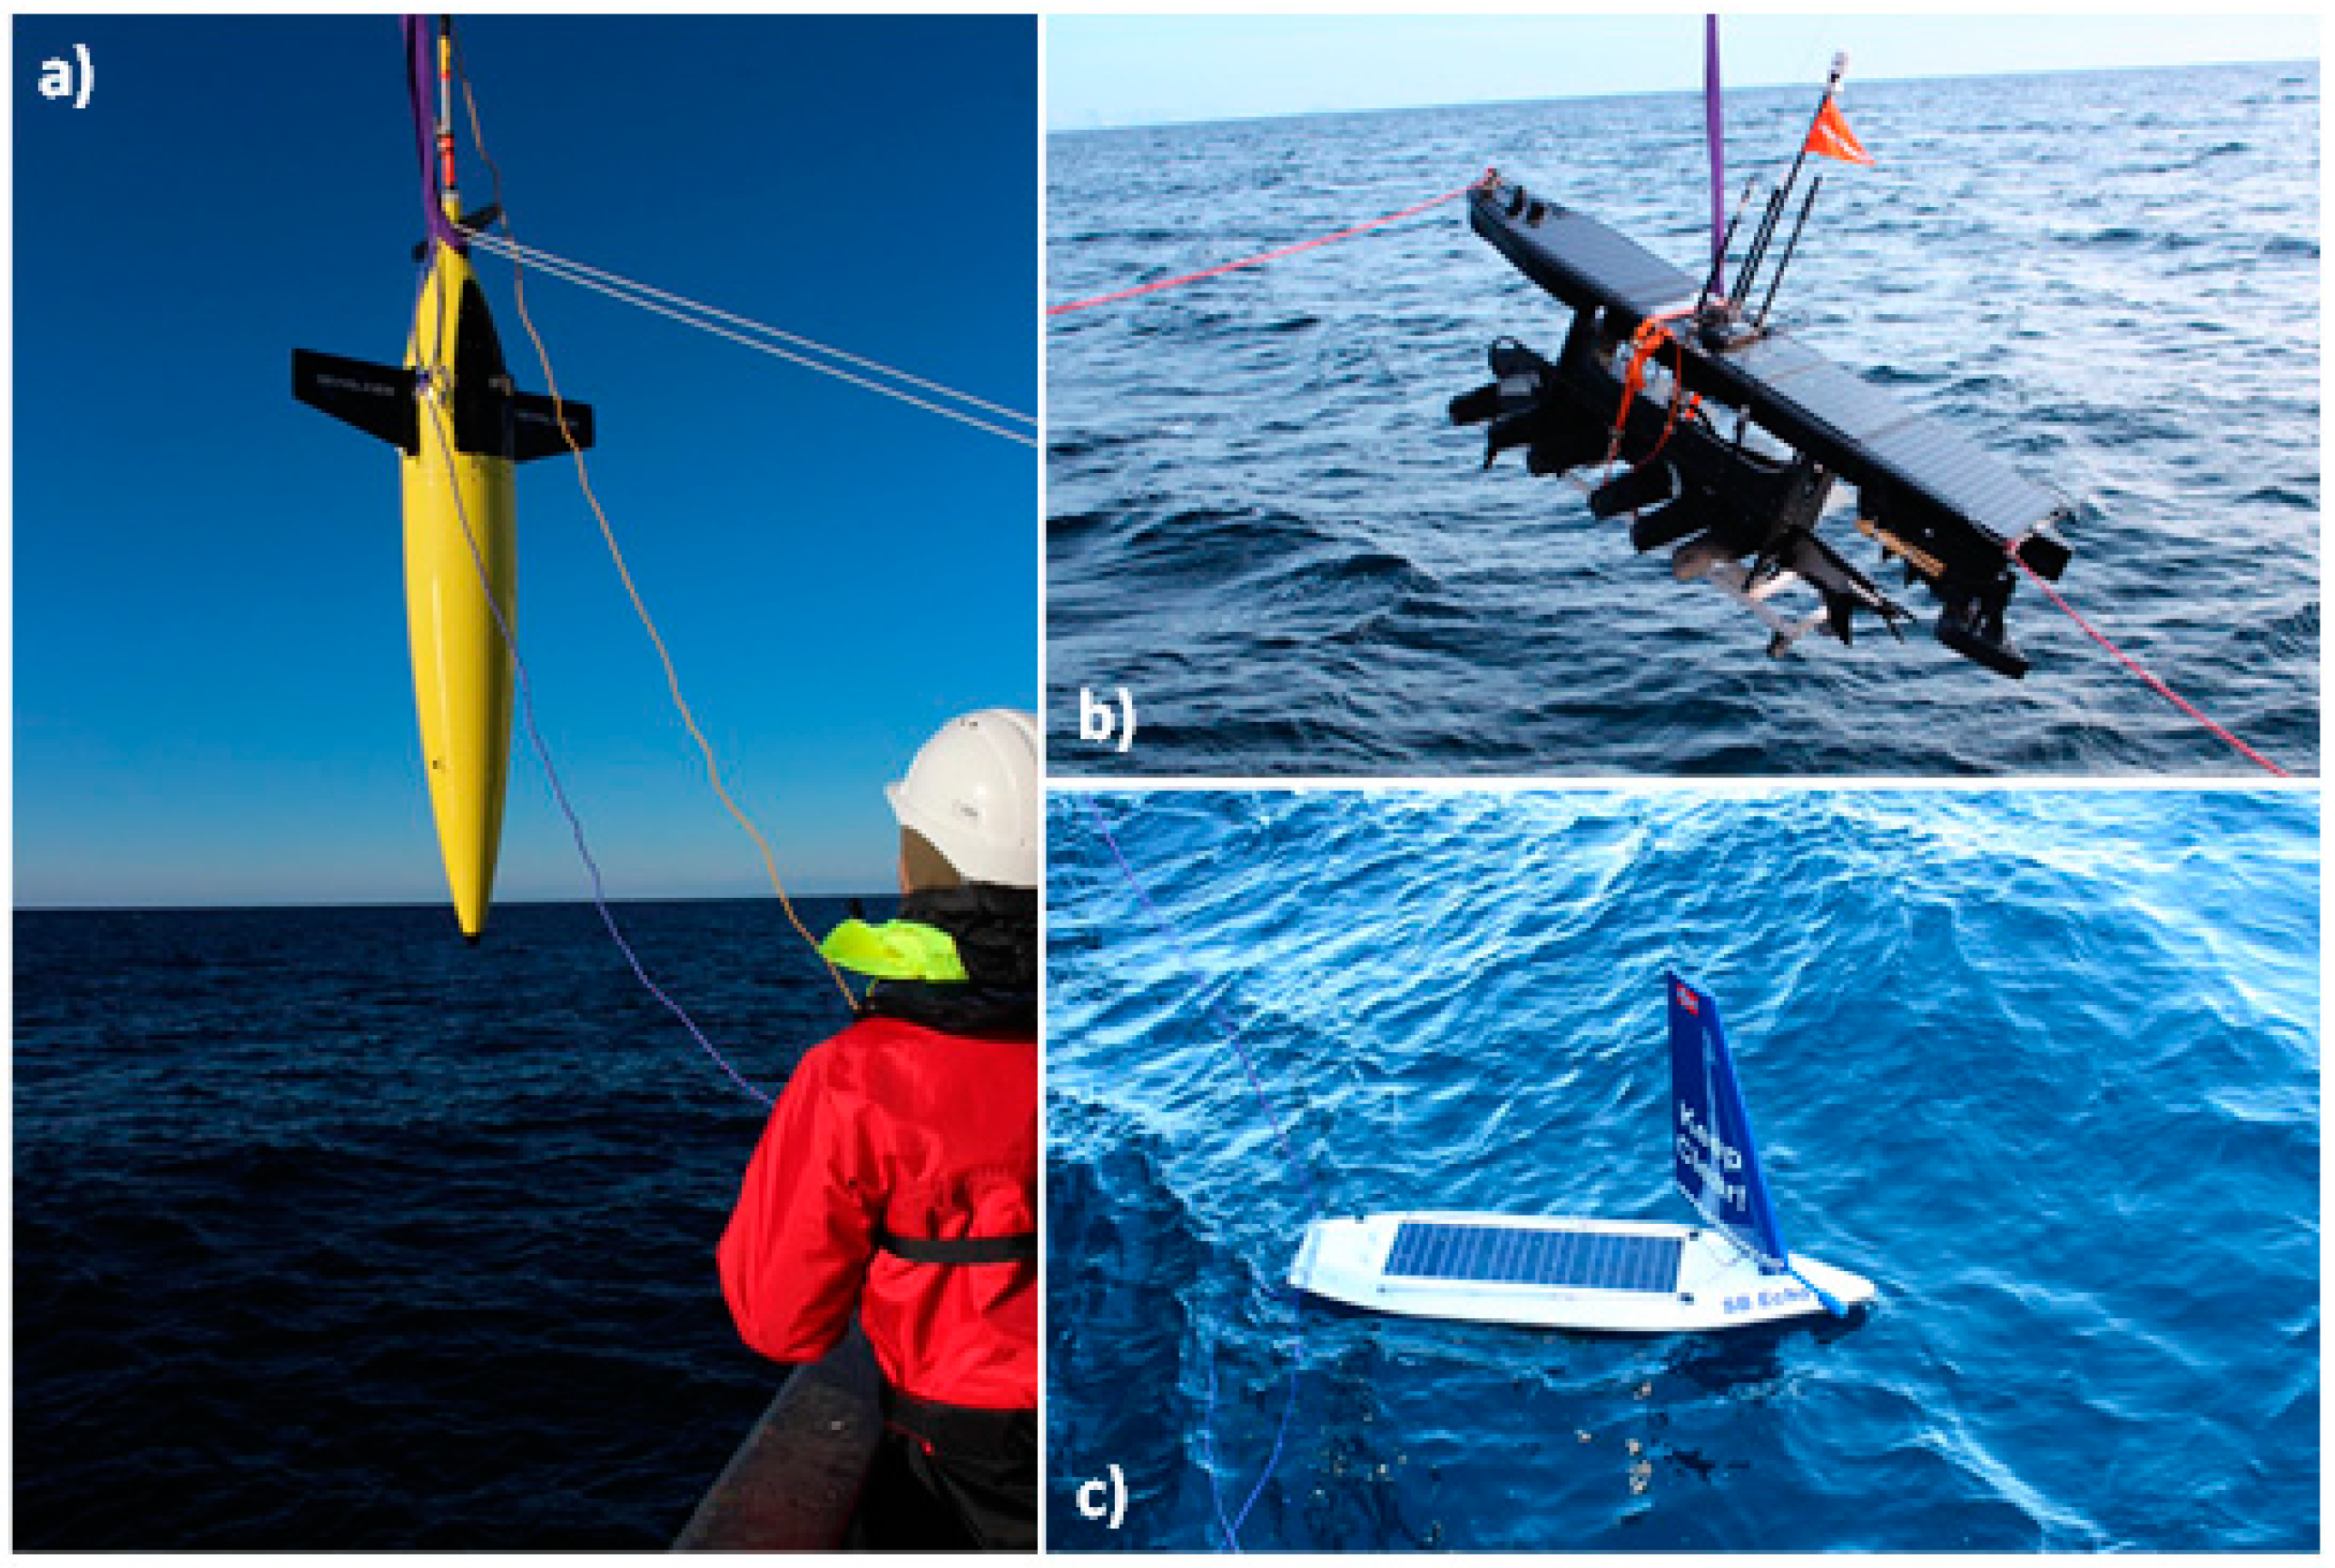
2.1. Surface and Subsurface Vehicles

The GLIDER project deployed three different surface and subsurface platforms: a Seaglider® M1 (Huntington Ingalls Industries Inc.; formerly Kongsberg Maritime), a Wave Glider SV3 (Liquid Robotics), and a Sailbuoy (SB, Offshore Sensing) (Figure 1). The Seaglider® is an autonomous underwater vehicle that uses changes in buoyancy to move through the water column in a sawtooth pattern while collecting data from the ocean surface to a programmed depth and back [31]. The vehicle is powered by Lithium Sulfuryl chloride primary batteries 17 MJ allowing operations in the range of several thousand kilometers and several months depending on configuration and payloads. The operational depth range is between 50 and 1000 m. The vehicle is 1.8–2 m long depending on the configuration and has a maximal diameter of 0.3 m. The wingspan is 1 m, and the antenna mast length varies between 0.43 and 1 m. The typical operation speed is 0.5 knots. A 2-way Iridium communication system was used for navigation and transmitting data (for further details [32]).
The Wave Glider SV3 is a long-duration unmanned surface vehicle utilizing wave energy for propulsion [33]. The Wave Glider consists of a surface float tethered with an 8 m umbilical cable to a subsurface glider. The surface float houses the command-and-control unit for communication, navigation, and power systems, containing a 980 Wh lithium-ion battery pack charged by solar panels (150 W). The maximum payload weight is 59 kg, and the maximum and average water speed are 3 and 1.8 knots, respectively. Additionally, the Wave Glider has an electric propulsion system to increase mobility in challenging ocean conditions. For the current project, a 2-way Iridium communication system for data transmission and navigational instructions was used (for further details [34]).
The Sailbuoy (Offshore Sensing) is a long-duration unmanned surface vehicle using wind for propulsion [35]. The vehicle employed in the GLIDER project was 2 m × 0.5 m × 1.3 m (length, beam, height), with a displacement of 60 kg and payload up to 10 kg. This vehicle may operate for several months with average speeds of 1–3 knots. Navigable wind speeds are 3–30 m/s (tested up to 30 m/s) and the navigable wave height is up to about 15 m. Autopilot and sensor payloads are powered by separate battery packs charged by solar panels (30 W). Two-way Iridium communication was used for navigational instructions and for transmitting data (for further details [36]). In the GLIDER project, the three vehicles were equipped with current state-of-the-art sensors to measure biogeochemical and biological parameters (Table 1).

2.2. GLIDER Deployment and Data Collection
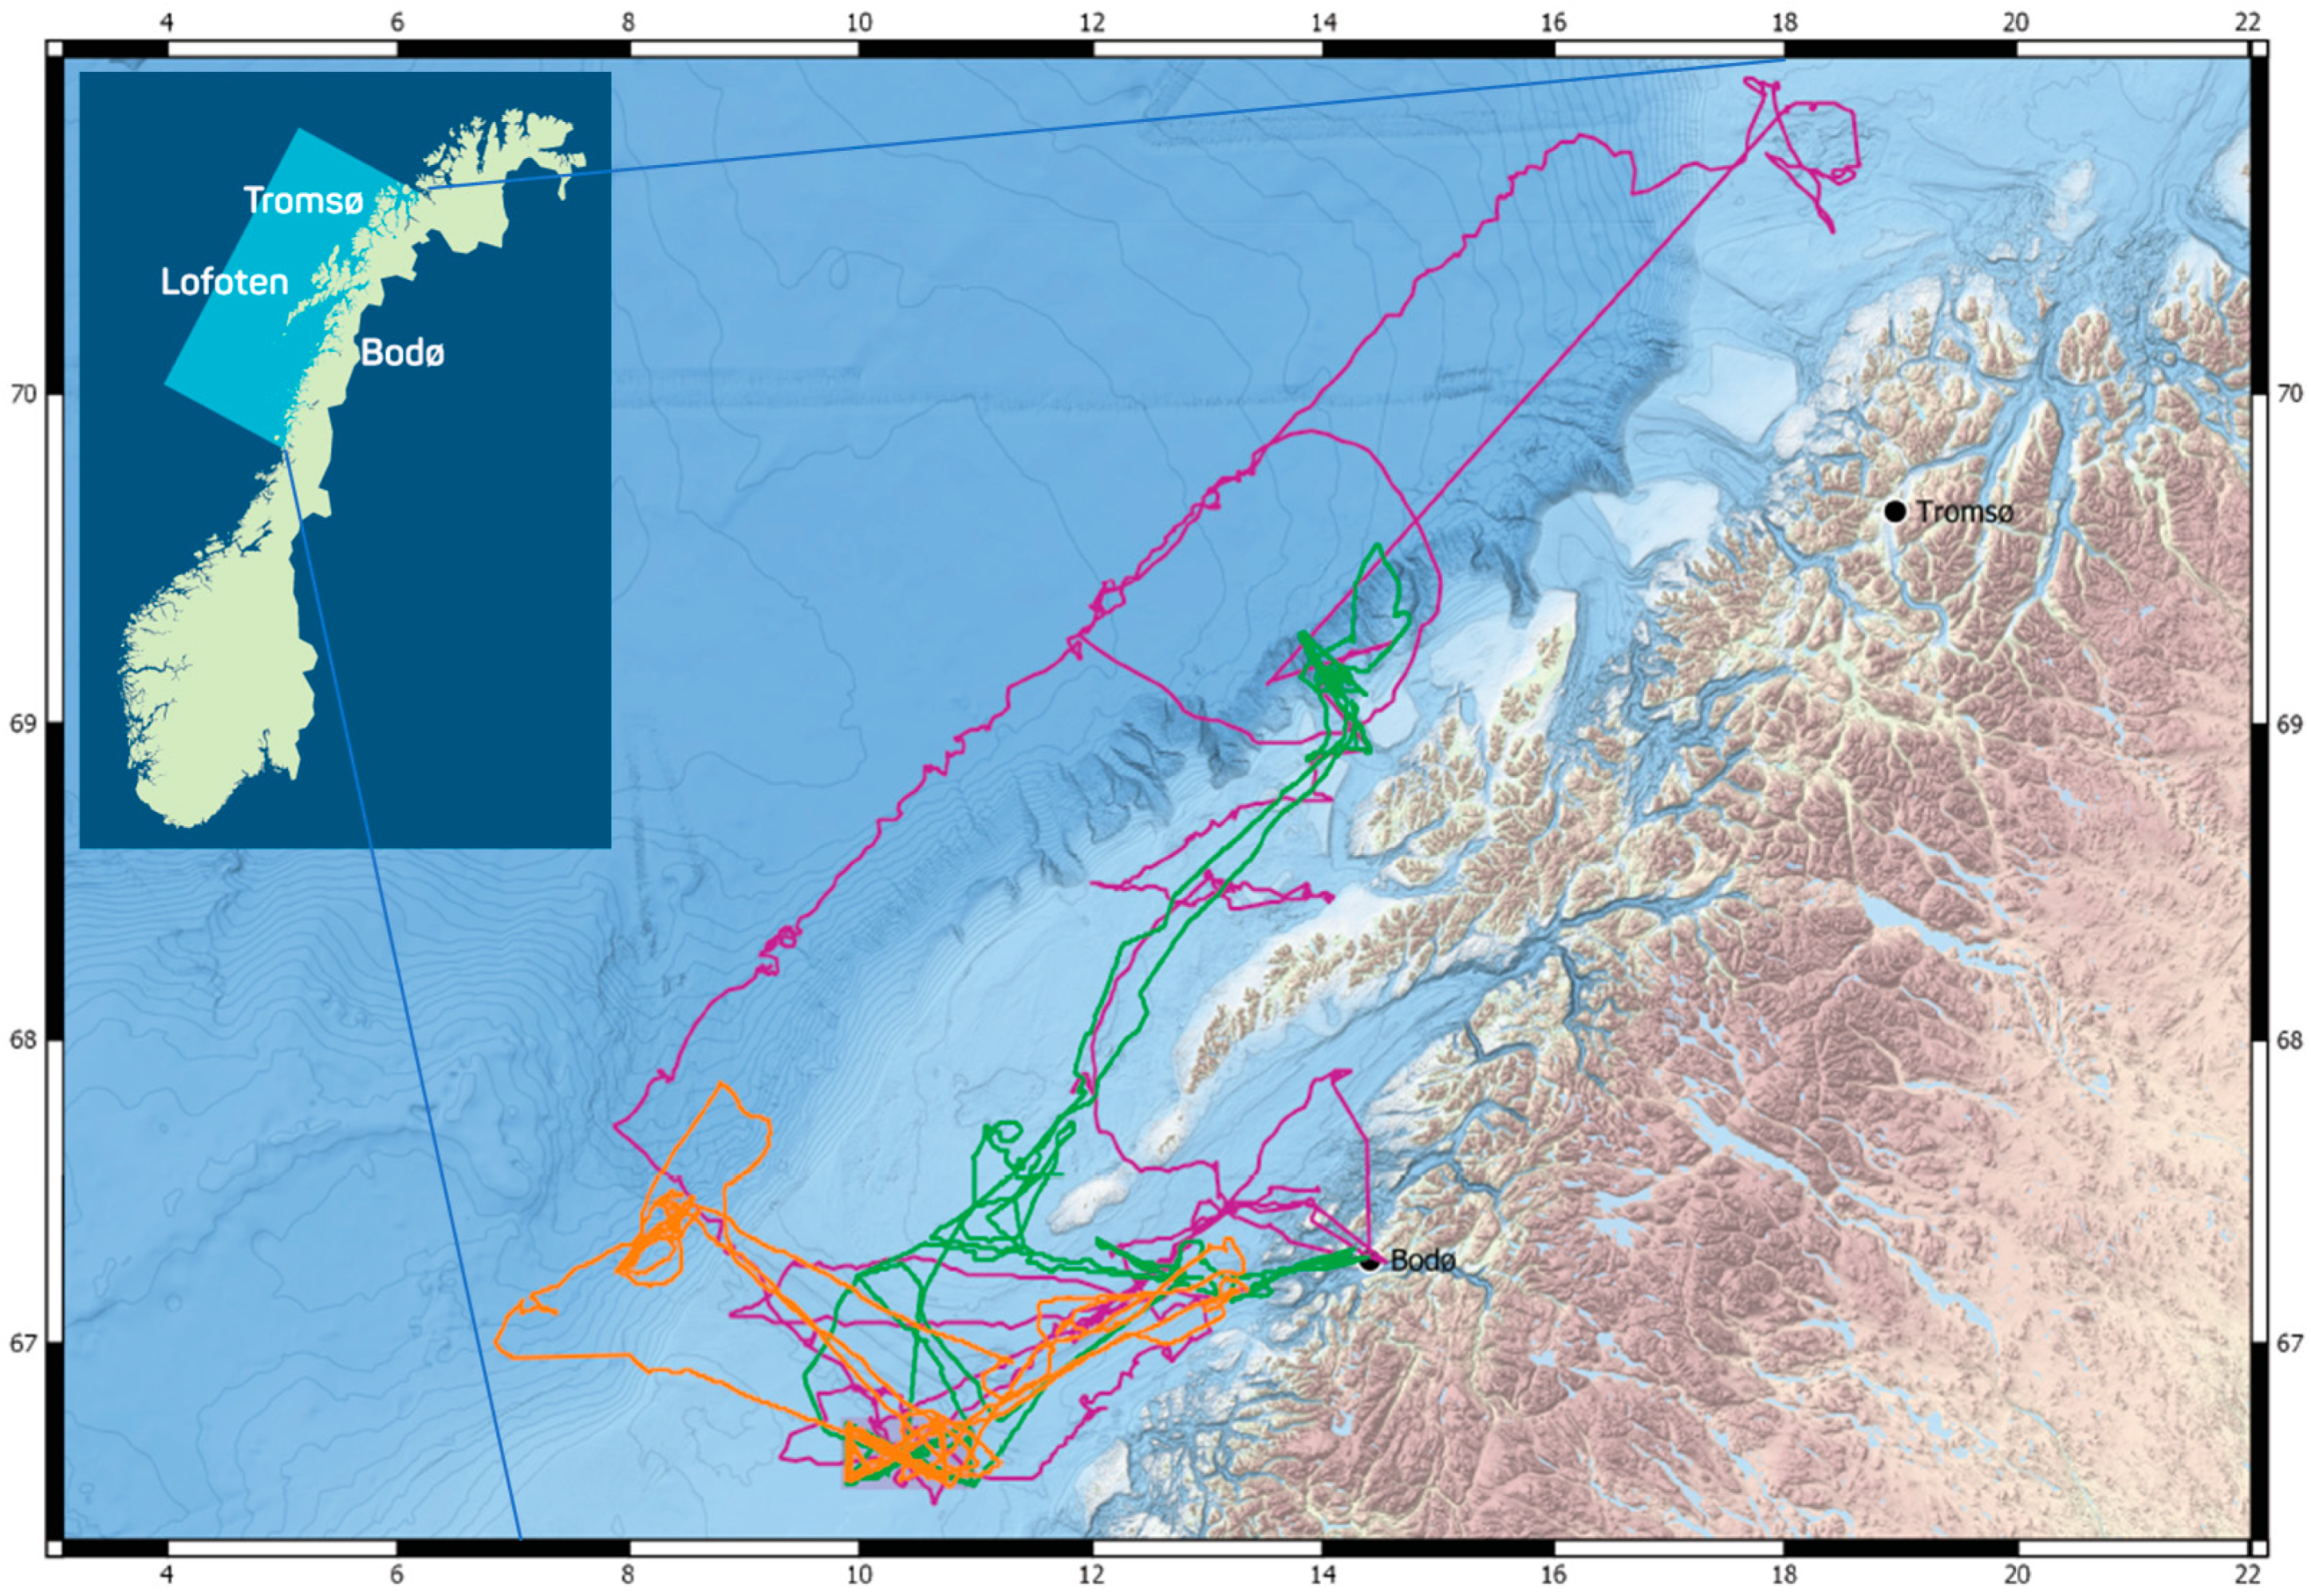
The three vehicles were deployed along LoVe from March to September 2018, a period of high biological activity (see below). The vehicles were piloted by Maritime Robotics (Wave Glider), Offshore Sensing (Sailbuoy), and Cyprus SubSea Consulting and Services (Seaglider®). Initial deployment of the vehicles occurred from the R/V Håkon Mosby, offshore Bodø, Norway. The vehicles were retrieved twice during the survey period to repair a technical problem with the memory storage, and at the same time, offload the acoustic data. A well-known challenge with autonomous acoustic surveys is the identification of the acoustic targets based only their acoustic signal. To identify targets, additional sampling might be performed by trawl, net, or occasionally optical sampling [15,37,38]. Zooplankton composition, abundance, and vertical distribution in an area overlapping with the track of the Sailbuoy in June 2018 (6 stations west of Vesterålen, 10 stations north on Tromsøflaket) was assessed during an independent research cruise aboard RV Helmer Hanssen (see https://lofoten-research.no/ accessed on 7 October 2021) using a Hydrobios Multinet (mesh size 180 µm, opening area 0.25 m2), a Tucker Trawl (1500 µm, 1 m2), a Video Plankton Recorder (Seascan Inc.), and a Laser Optical Plankton Counter (ODIM-Brooke Ocean Rolls Royce Canada Ltd.) following the methods described in [39].

2.2.1. Study Site

The study site was the shelf-slope-oceanic ecosystem of LoVe (Figure 2). The area is considered rich in biological resources and was characterized as “particularly vulnerable” by the Norwegian authorities [20]. In this area, the phytoplankton spring bloom starts in the fjords by the end of March, progresses to the shelf by April–May, and extends to the basin by May–June. The increased primary production enhances biological activity from the seabed and across the entire water column. The increase in chlorophyll concentration prompts polyp activity in corals [23] and is followed by the ascension to the surface of the overwintering copepod Calanus finmarchicus, the most abundant zooplankton in the region. C. finmarchicus feeds on the phytoplankton production and reproduces during spring and summer [19,39,40]. The marine zooplankton community provides important trophic linking between the microalgae community and higher trophic level species, sustaining major fish stocks, including the highly abundant stocks of cod Gadus morhua (i.e., the Northeast Arctic cod), herring Clupea harengus (i.e., the Norwegian spring spawning herring), and blue whiting Micromesistius poutassou [18,41,42,43]. The LoVe region also provides important spawning grounds and larval areas for the commercial fish stocks of the Barents Sea and adjacent waters, including the Northeast Arctic haddock Melanogrammus aeglefinus stock, the Norwegian spring-spawning herring Clupea harengus stock, and the Northeast Arctic cod Gadus morhua stock [43]. Cetaceans were also reported in the area [11,44], with both humpback whale Megaptera novaeangliae and killer whale Orcinus orca feeding on herring aggregations [44]. The Lofoten Basin is the most eddy-rich region in the Norwegian Sea [45]. Mesoscale eddies transport phytoplankton and key ecosystem species, such as C. finmarchicus and mesopelagic fish, across the shelf. Near the shore, tidal currents play a role in transporting cod eggs northward past the Lofoten Peninsula [46], while the Norwegian Coastal Current (NCC) and the Norwegian Atlantic Current (NwAC) play the main role in transporting eggs into the Barents Sea [19,47]. For example, cod spawned in the LoVe region was found later residing in the Svalbard fjords [48].

2.2.2. Echo Sounder Mapping of Shallow Zooplankton Layers

The Wave Glider and the Sailbuoy were equipped with the Simrad WBT Mini (Kongsberg Maritime), a compact and energy-efficient scientific echo sounder in the EK80 family. The Wide Band Transceiver (WBT) Mini can work with continuous wave (CW) and broadband frequency modulated (FM) pulses. Although initially designed for autonomous operations on stationary platforms, it has found widespread use on small and large autonomous mobile vehicles. The Wave Glider was fitted with two split-beam transducers, Simrad ES70-18CD and ES333-7CDK with a center frequency of 70 and 333 kHz, respectively. The Sailbuoy was fitted with one split-beam transducer, the Simrad ES333-7CDK. The center frequencies were chosen to maximize the signal strength from copepods (C. finmarchicus in particular) and to continuously monitor the shallow layers of copepods throughout the duration of the mission. In this mission, control of the echo sounder data collection was available on both vehicles through the vehicles’ two-way Iridium satellite communication (for additional details of the echo sounder integration, operation, and data collected, see [49]).

2.2.3. Sea Mammal Vocalizations and Anthropogenic Noise

To passively scan for marine mammal vocalizations and anthropogenic sound, two of the three automated vehicles were used. The Seaglider® was equipped with an Observer/AMAR G4 from JASCO [11,50,51] and recorded continuously down to 100 m depth. The Wave Glider was equipped with a hydrophone SoundTrap from OceanInstruments. To date, only the Seaglider® data were analyzed. To determine the different types of biological and anthropogenic sounds that occur in the LoVe area, the recordings were inspected visually and aurally using automatic detection and visualization software (i.e., PAMguard [52] and Raven [53]). Ship noise consists of broadband noise depending on the size and speed of the vessels, but most of the energy is at low frequencies (<1 kHz). Typically, the sound of a ship passing by can last for tens of minutes. Automatic detectors and manual spectrogram analysis identified biological sounds as well as weather events, vessel passages, and seismic activities. Ambient noise was defined as all sound recorded, except sound associated with a specified signal and the self-noise produced by the vehicle (e.g., pitch/roll maneuvers, apogee pump activity, etc.). Prior to data analysis, all self-noise was detected and removed from the dataset using template matching [11].

2.2.4. Ocean Modelling

The continental slope off Norway is a transport passage for the warm-saline Norwegian Atlantic Current (NwAC) towards the Arctic Ocean. Here, the current is primarily guided by the continental slope. Hence, mesoscale or sub-mesoscale eddies are considered the primary mechanism in lateral heat transport. Indeed, observations and models indicate strong flow field variability in this region [45,54]. The complex flow field and geometry of coastal and fjord systems entails not only a high spatial resolution of the ocean circulation model but also associated high-resolution observations and forcing fields, e.g., from numerical weather prediction models. Data assimilation (DA) using near-real-time observations is much needed to improve predictive skills in such models. Accordingly, to better understand the physics of the ocean along the coastal zone of the LoVe region, meteorological and oceanographic data collected by the three gliders were assimilated into a regional version of the ROMS model (NorShelf-2.4km). The NorShelf-2.4km model already assimilates data from diverse sources, e.g., sea surface temperature, high-frequency radars, hydrography provided by CTD sections from occasional research cruises, FerryBox data, and ARGO floats. This model runs operationally at the Norwegian Meteorological Institute (MET Norway) using four-dimensional variational data assimilation (4D-Var [55]). ROMS provides several formulations of 4D-Var; NorShelf-2.4km uses the physical space analysis system (PSAS). Within this setup, the assimilation window was two days, which was chosen based on previous 4D-Var experiments on the coast of Norway with a 2.4km resolution [56]. To benefit from the improved hydrography and circulation that the DA in NorShelf-2.4km provides, a very high-resolution unstructured model was nested as a grid into the NorShelf-2.4km [57]. This allowed for the introduction of a large number of rivers (more than 7000 large and small rivers) and positioned them correctly on the coastline. Here, we adopted a 3D version of the Finite-Volume Community Ocean Model (FVCOM [58]) and imposed a variable spatial resolution from 30 m along the coast and straits to 2.4 km at the boundaries. Hence, by imposing high-quality boundary conditions, an enhanced picture of the ambient hydrodynamical processes was achieved. In order to assess the skill of NorShelf-2.4km compared with MET Norway’s high-resolution NorKyst-800m forecast model, which does not employ data assimilation, we compared T-S diagrams.

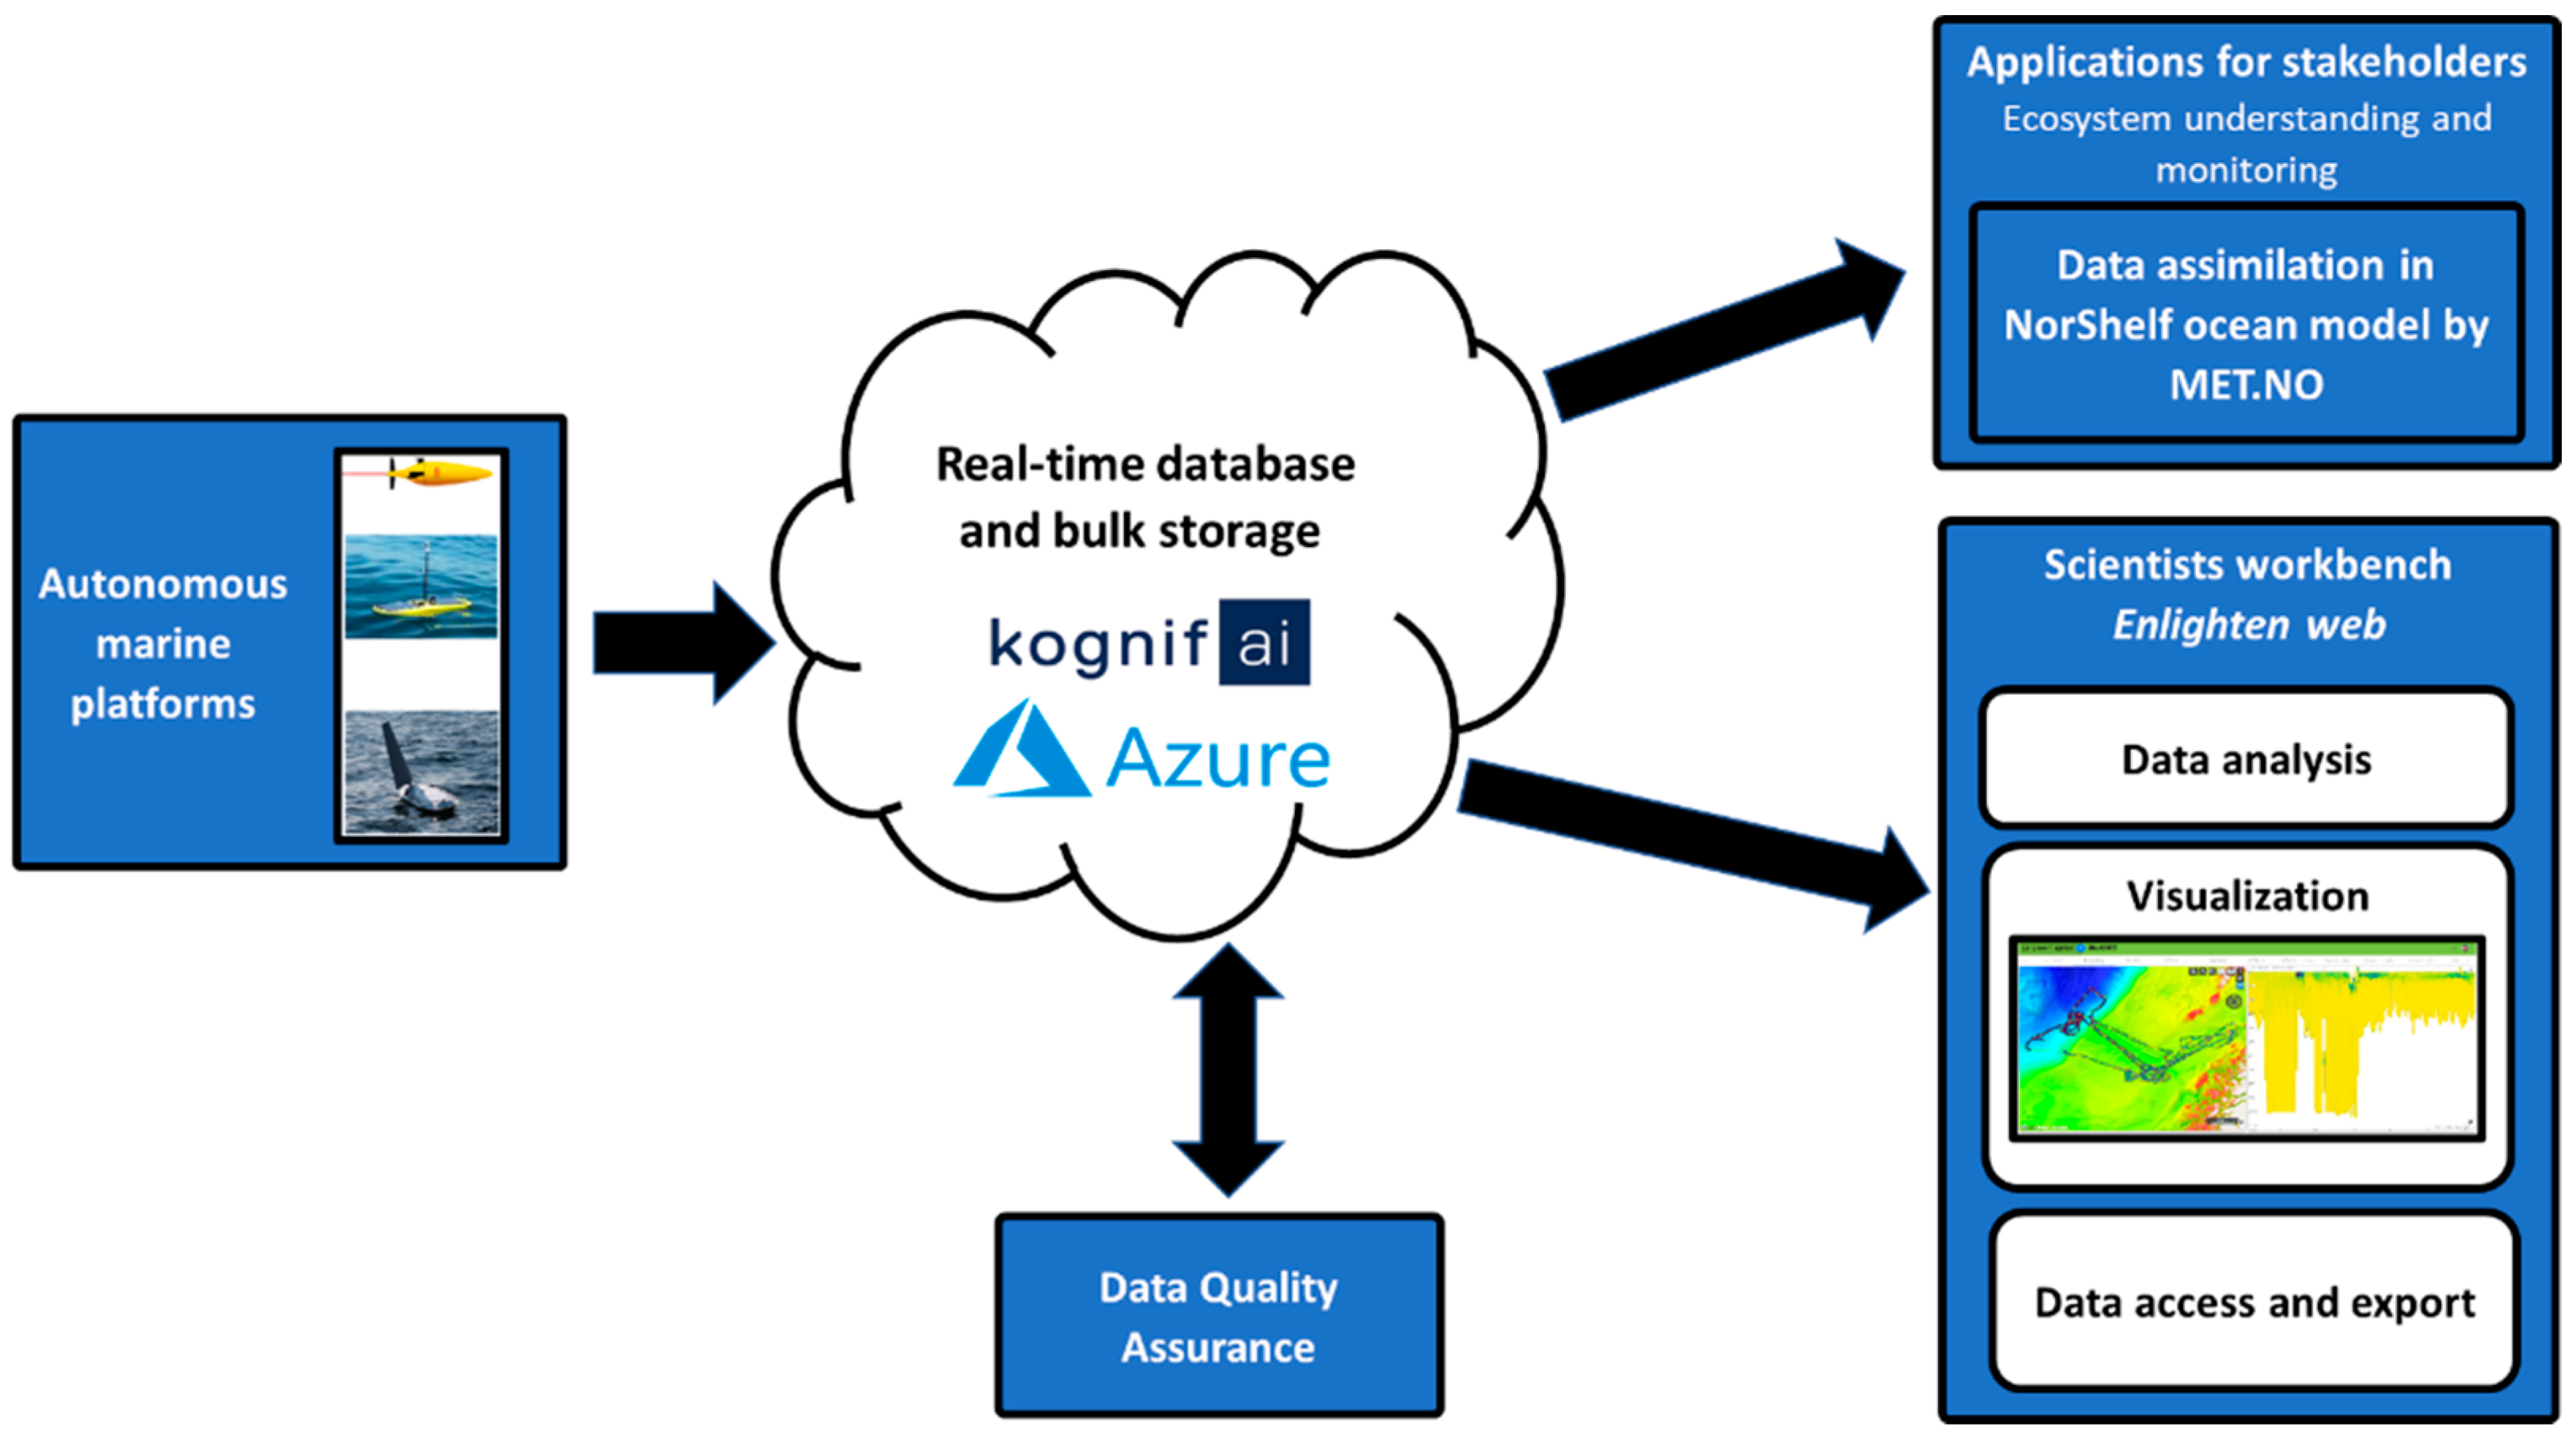
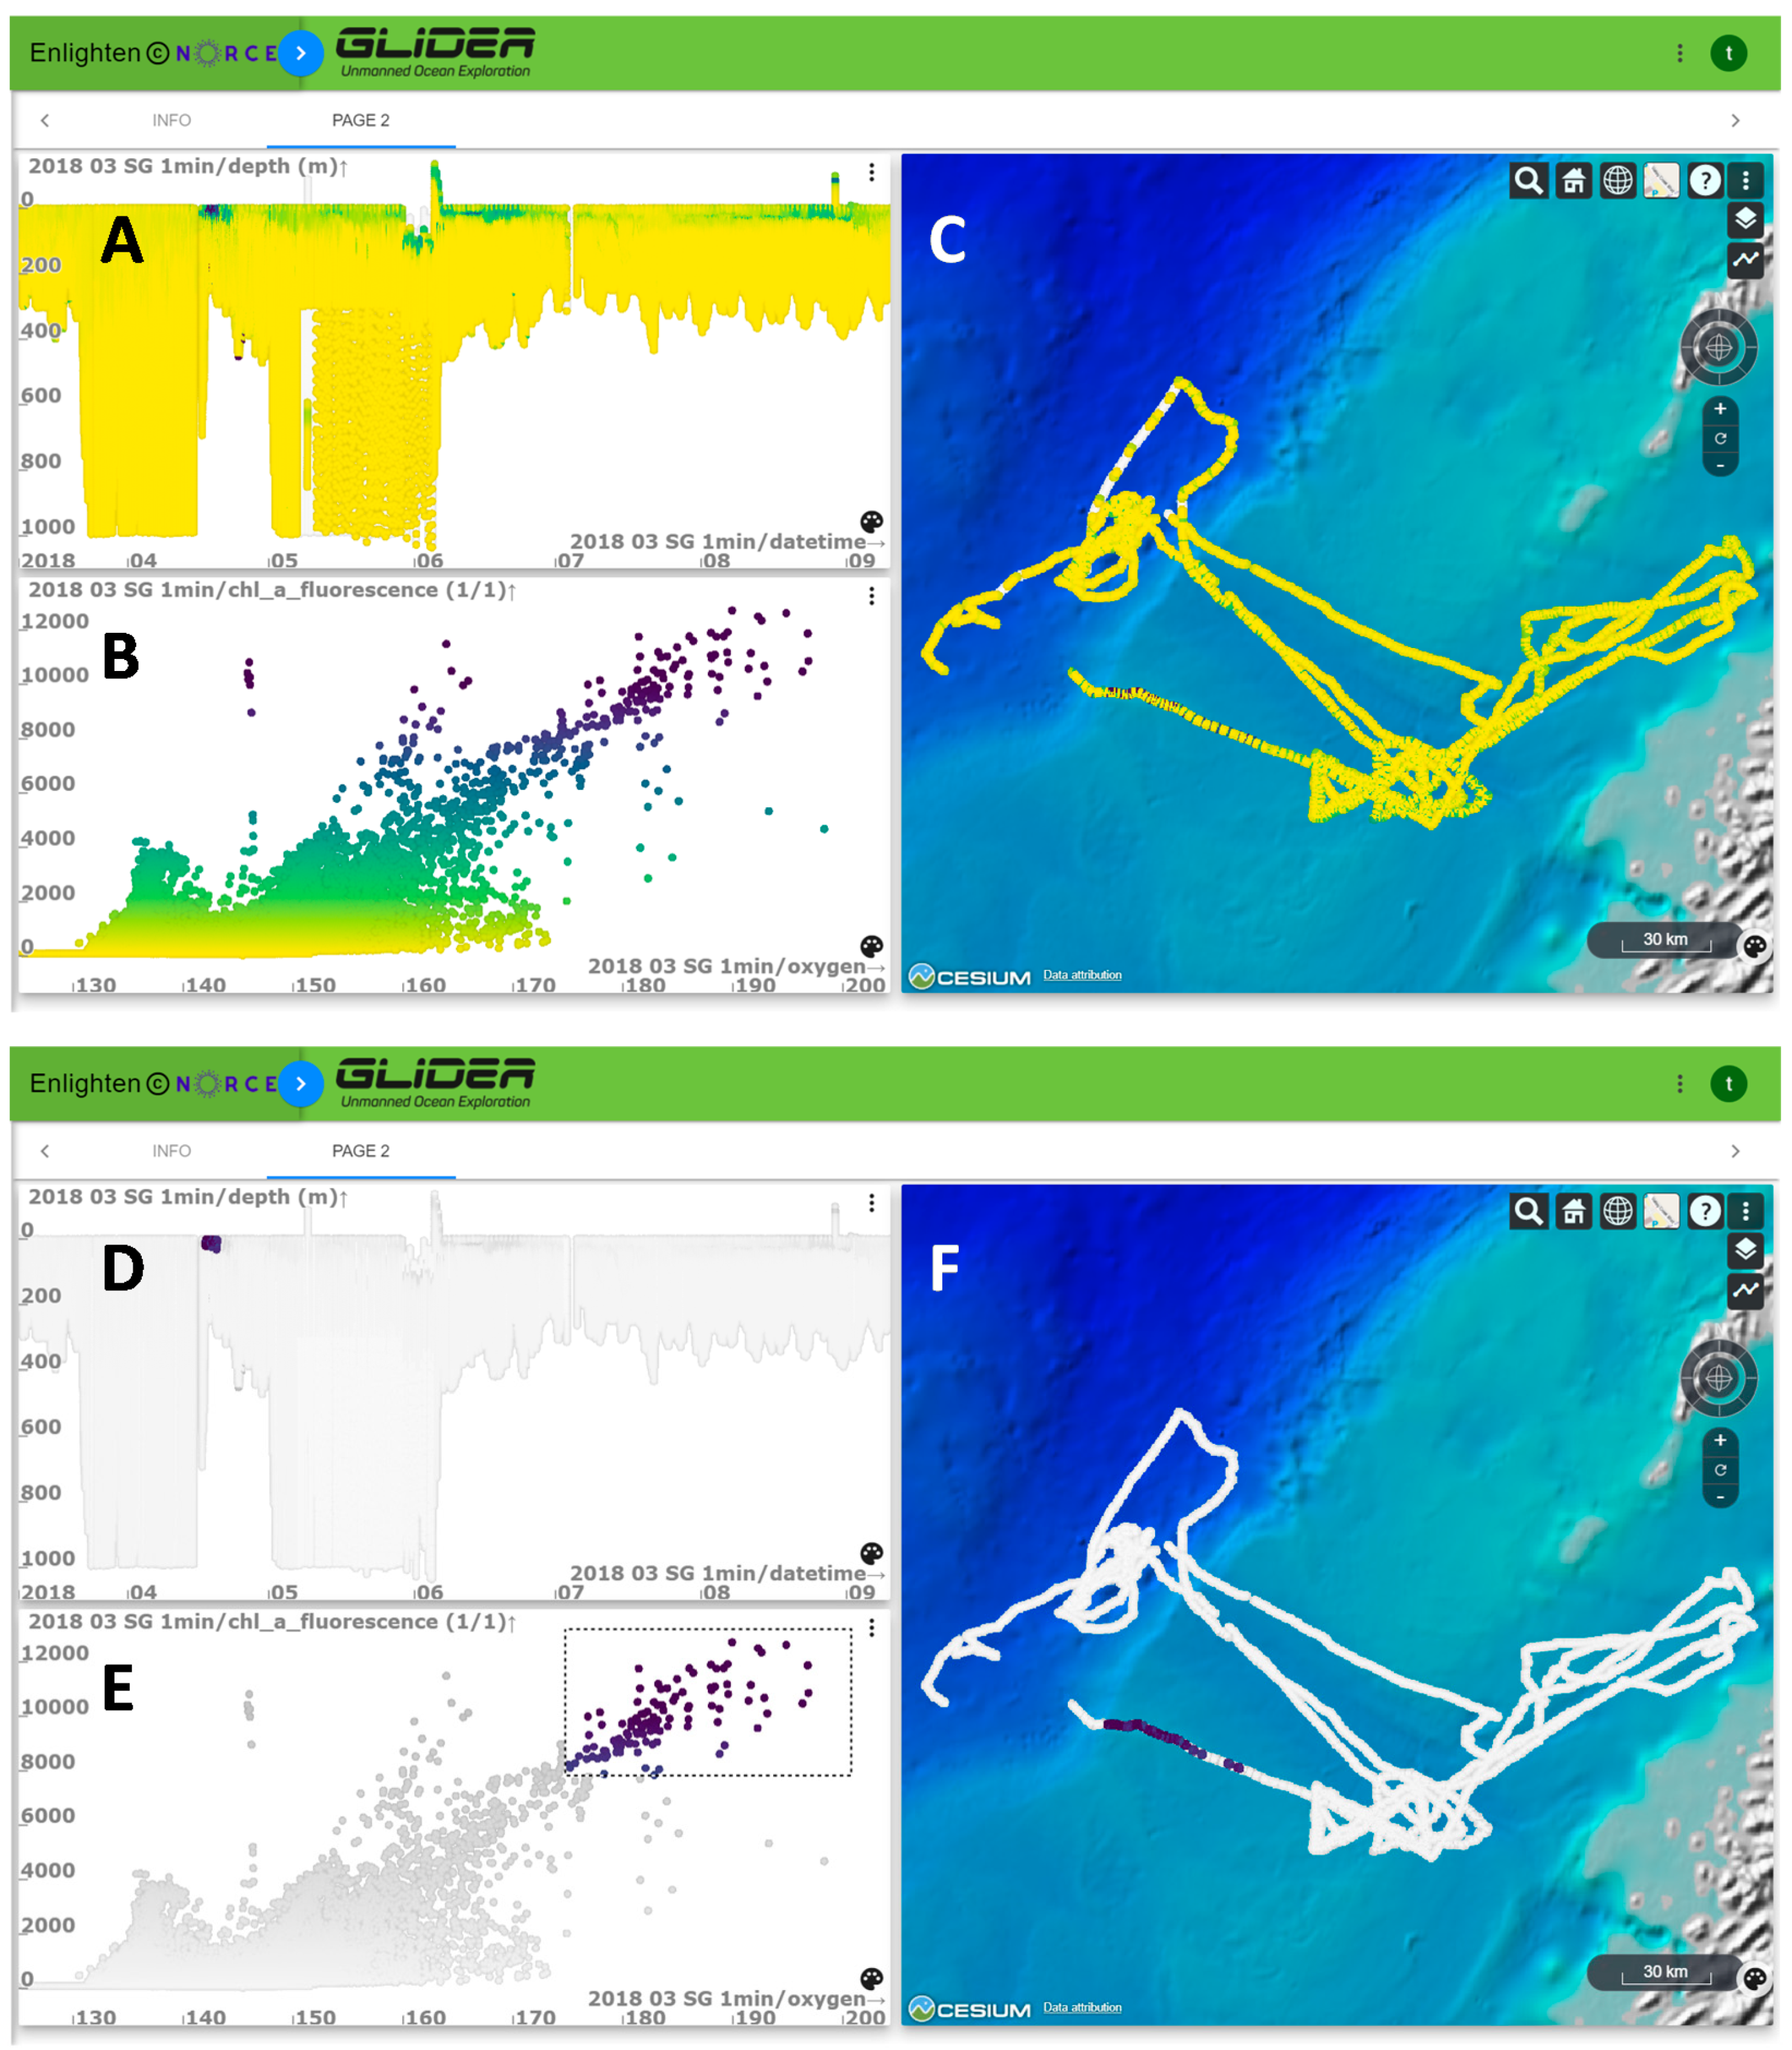
2.3. GLIDER Data Management Platform

To manage the data collected by the gliders, a data management platform “GLIDER” was developed by the Norwegian Research Centre (NORCE), Kongsberg Digital (KDI), and the Norwegian Institute for Water Research (NIVA). The platform was designed to perform quality control through a range of tests, ensuring high-quality data access to researchers and end-users. The data management platform provides continuous tracking of autonomous measurement platforms during surveys with real-time access to time series of measured data (e.g., temperature, salinity, conductivity, and fluorescence). The gliders send time-series data via satellite links (Figure 3). The solution for storing the time series is based on the Kognifai digital ecosystem provided by KDI. The solution consists of an asset database in addition to the time-series database. The metadata for the gliders, instruments, and sensors are stored in the asset database [59].
The GLIDER web portal implements interactive visual analysis and covisualization of large multidimensional datasets for exploration of the collected data, giving scientists access to the data stored in these databases. The portal was implemented by adapting Enlighten-web, a web application developed by NORCE, and supports interactive visual analysis and covisualization of large multidimensional datasets. Predefined plots were prepared to follow the data acquisition in real-time and to see a quick overview of the data. Users can easily create and store their own plots for further analysis. Brushing and linking [60] functionality is provided for exploring complex datasets, to discover correlations and interesting properties hidden in the data (Figure 4). Enlighten-web offers interactive performance in brushing and linking on large datasets by utilizing the graphic processing unit on the user’s computer. Several filters can then be combined using Boolean “AND” operators.
The GLIDER web portal also supports Web Map Services (WMS). This allows the web portal users to contextualize observations by adding map layers from external services, e.g., representing meteorological and oceanographic data.
During a survey, NIVA servers monitor the Kognifai database time series and automatically perform quality control (QC) services. The QC services collect the new data added to the database and perform a set of regionally dependent QC tests. A flag indicating the quality of each data point is written back to the database. The QC tests and algorithms follow the International Copernicus.eu standard [61]. The web portal provides an option to filter and view only good-quality data flagged during the QC process.
Due to bandwidth and cost limitations, echo sounder and hydrophone data were not transmitted to the time series database via satellite link but stored on-board the gliders. These data files were retrieved at the end of the survey and uploaded to Microsoft Azure Blob Storage. Through the brushing and linking functionality, the GLIDER portal supports selecting relevant bulk data for download, which can be readily incorporated into models. For example, MET Norway uses hydrographic data provided by the gliders for near-real-time assimilation in their ocean model [59].

3. Results

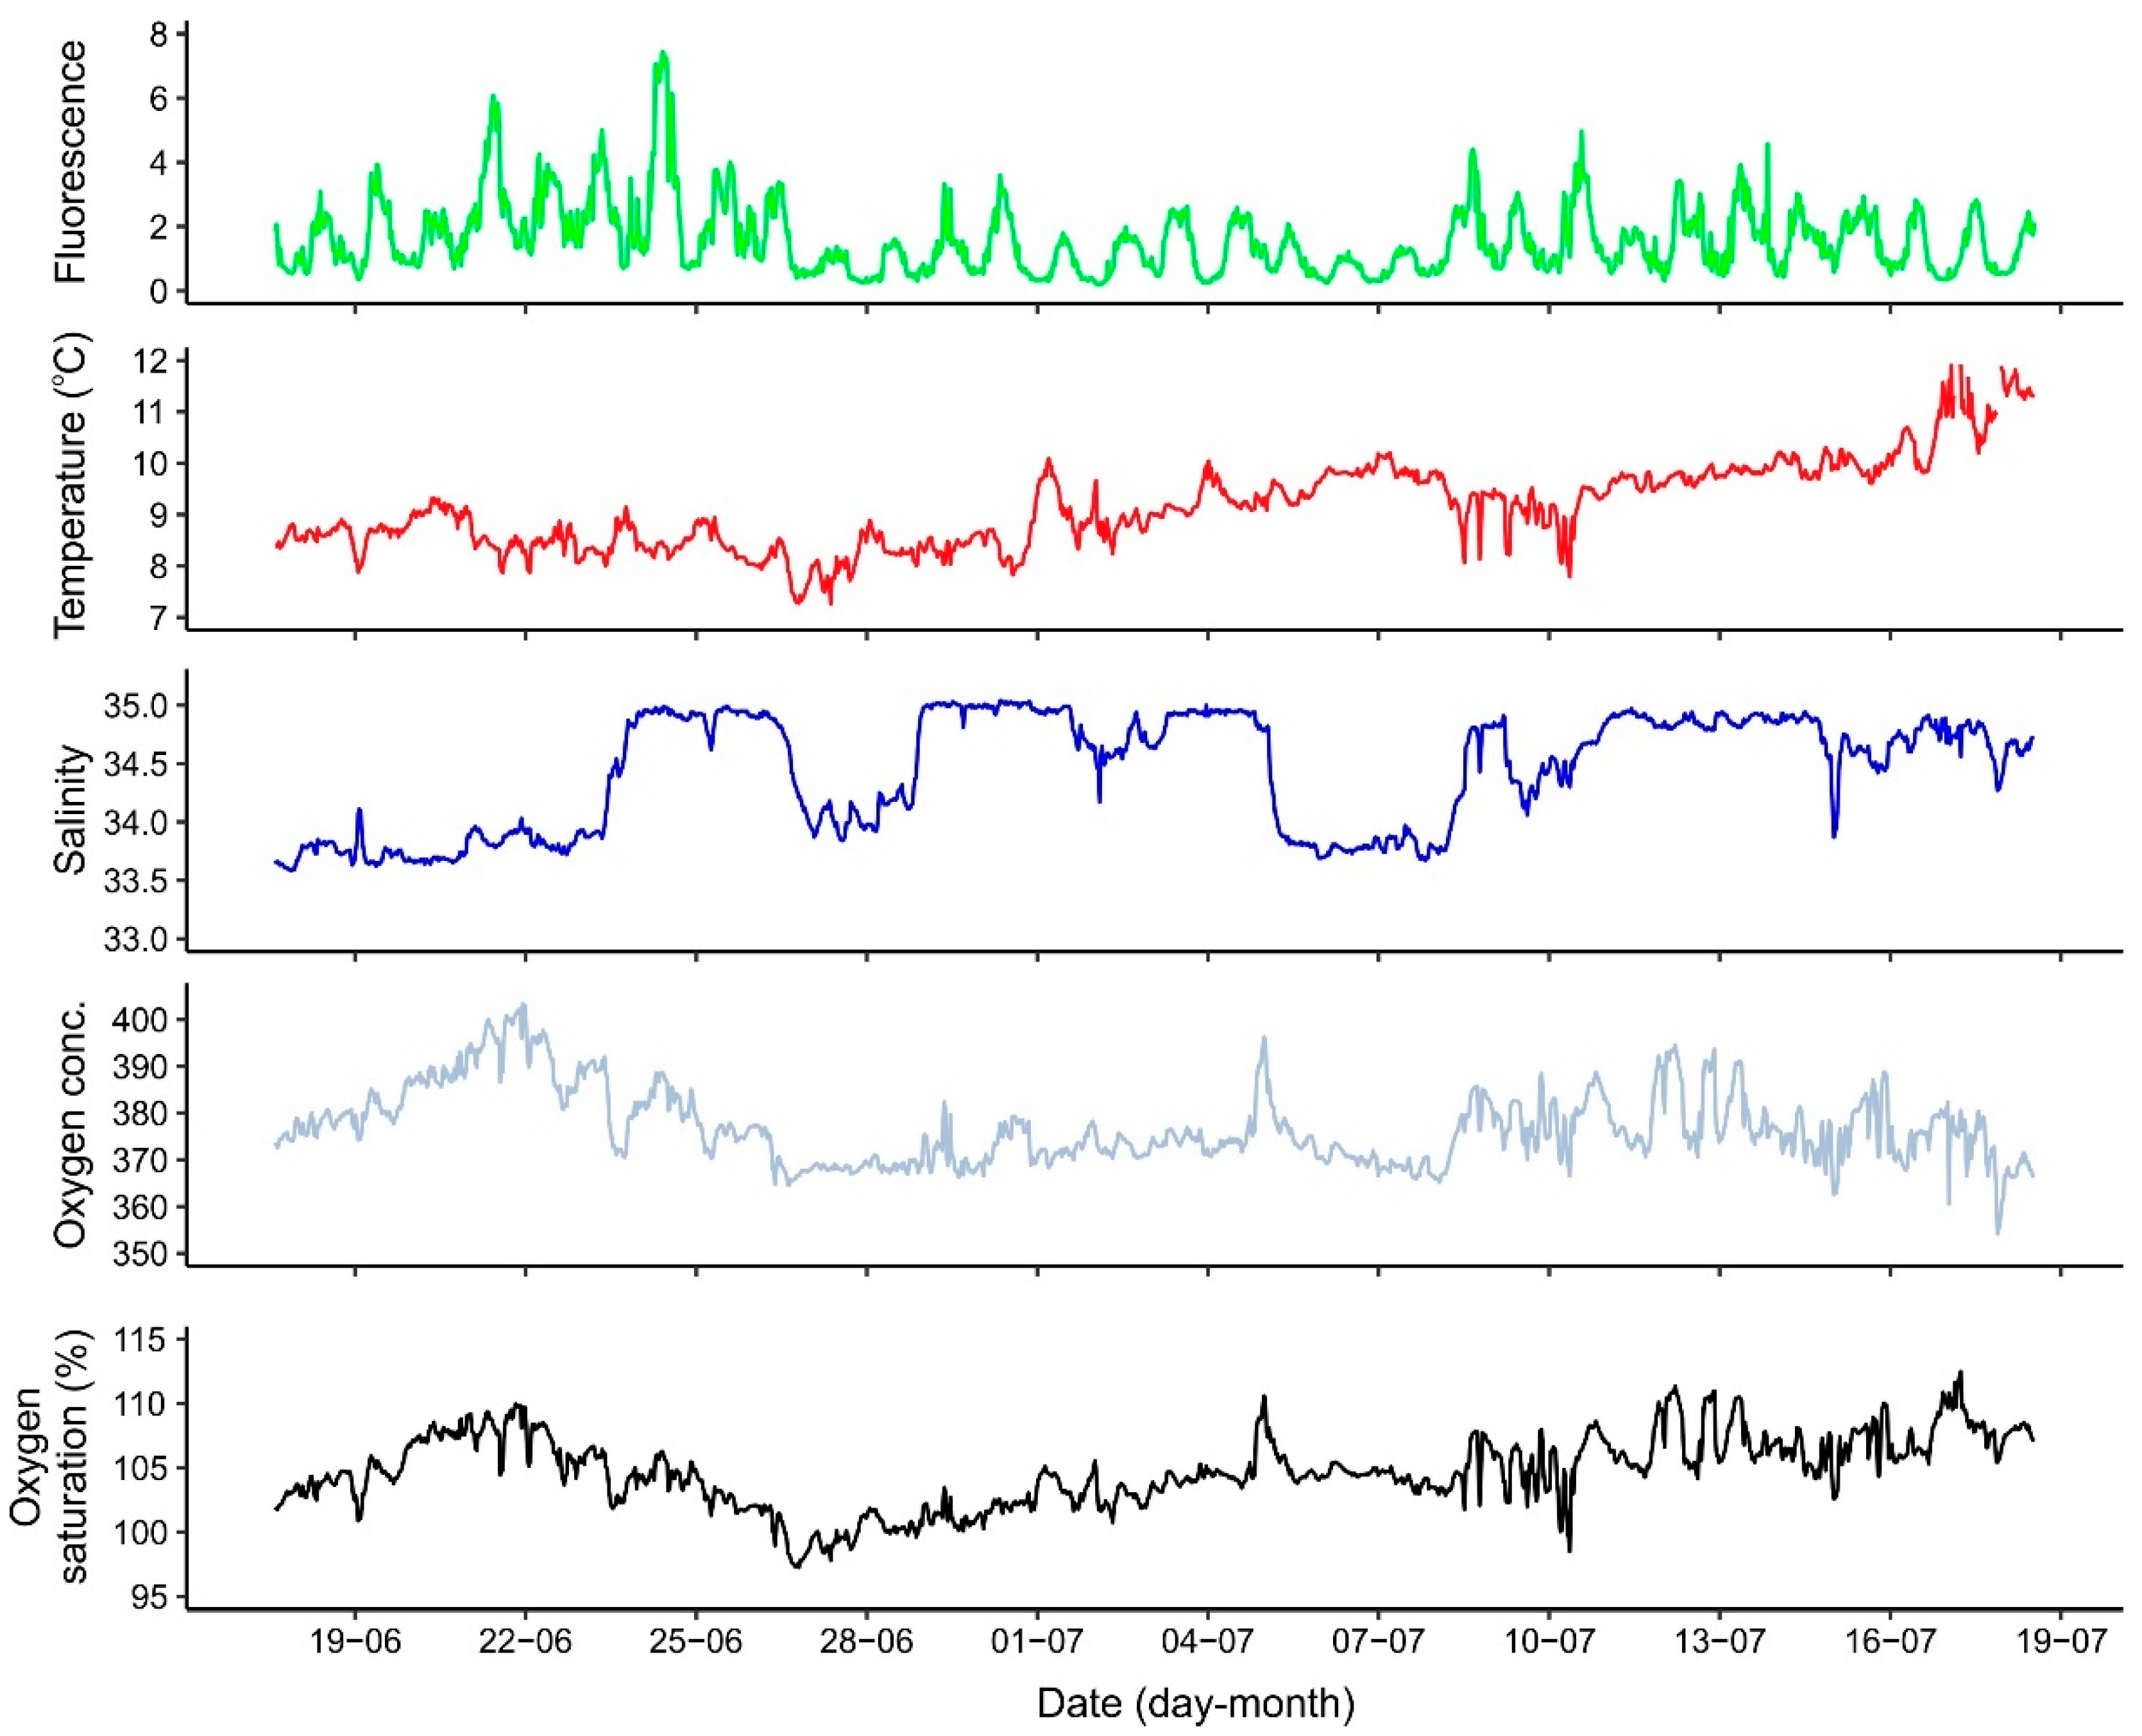
3.1. GLIDER Environmental Data Recordings

The three gliders effectively recorded data across planned transects in the LoVe region. All data were uploaded into the GLIDER data management platform where scientists could access and download the data for further analysis. For instance, a subset of environmental data recorded by the Wave Glider showed temporal variation and trends in surface fluorescence, temperature, salinity and oxygen during the summer (June–July) (Figure 5). These data were further employed to explore relations between environmental parameters and the spatiotemporal distribution of zooplankton and cetaceans, as well as to improve regional ocean models (see below).

3.2. Echo Sounder Mapping of Shallow Zooplankton Layers

The Wave Glider and the Sailbuoy successfully collected good quality echo-sounder data along the Norwegian coast from 66.5 N to 70.9 N, from March to September 2018. The data allowed for mapping of the spatiotemporal and vertical distribution and density of zooplankton down to approximately 100 m depth. Using the WBT Mini echo sounder on the Sailbuoy, dense spring zooplankton concentrations were detected throughout the deployment period (Figure 6).
In early spring (April), when copepods ascend from overwintering depths, weak layers of zooplankton were registered from approximately 20–30 m depth. Later in the season (June), a persistent high-density layer of zooplankton was observed in the upper 10–40 m. In late summer (July–August), the zooplankton layers were distributed across a wider depth range, exhibiting diel vertical migration patterns [49]. Stronger individual scatterers were also observed within, below and above the zooplankton layer, likely fish and fish larvae grazing on the zooplankton layer. Net sampling in April and June in adjacent areas revealed that zooplankton composition comprised mainly the copepod Calanus finmarchicus, a dominant zooplankton species in the area [39].
The Sailbuoy concurrently measured environmental variables, including temperature, salinity, and oxygen saturation. Surface water temperature and salinity increased from April to July/August while the highest oxygen saturation was found in the period of maximum zooplankton surface layer density (Table 2). The fluorescence measurements recorded by the Wave Glider at 0.5 m revealed a diurnal cycle of the fluorescence throughout the study period, with minimum values recorded at noon, and maximum values at night (Figure 5). This was observed in other studies using gliders (e.g., [62,63,64]) and reflects physiological quenching, an adaptation of photosynthetic organisms to avoid photo damage when exposed to excess light that leads to a massive decrease in in situ fluorescence [65].

3.3. Sea Mammal Vocalization and Anthropogenic Noise
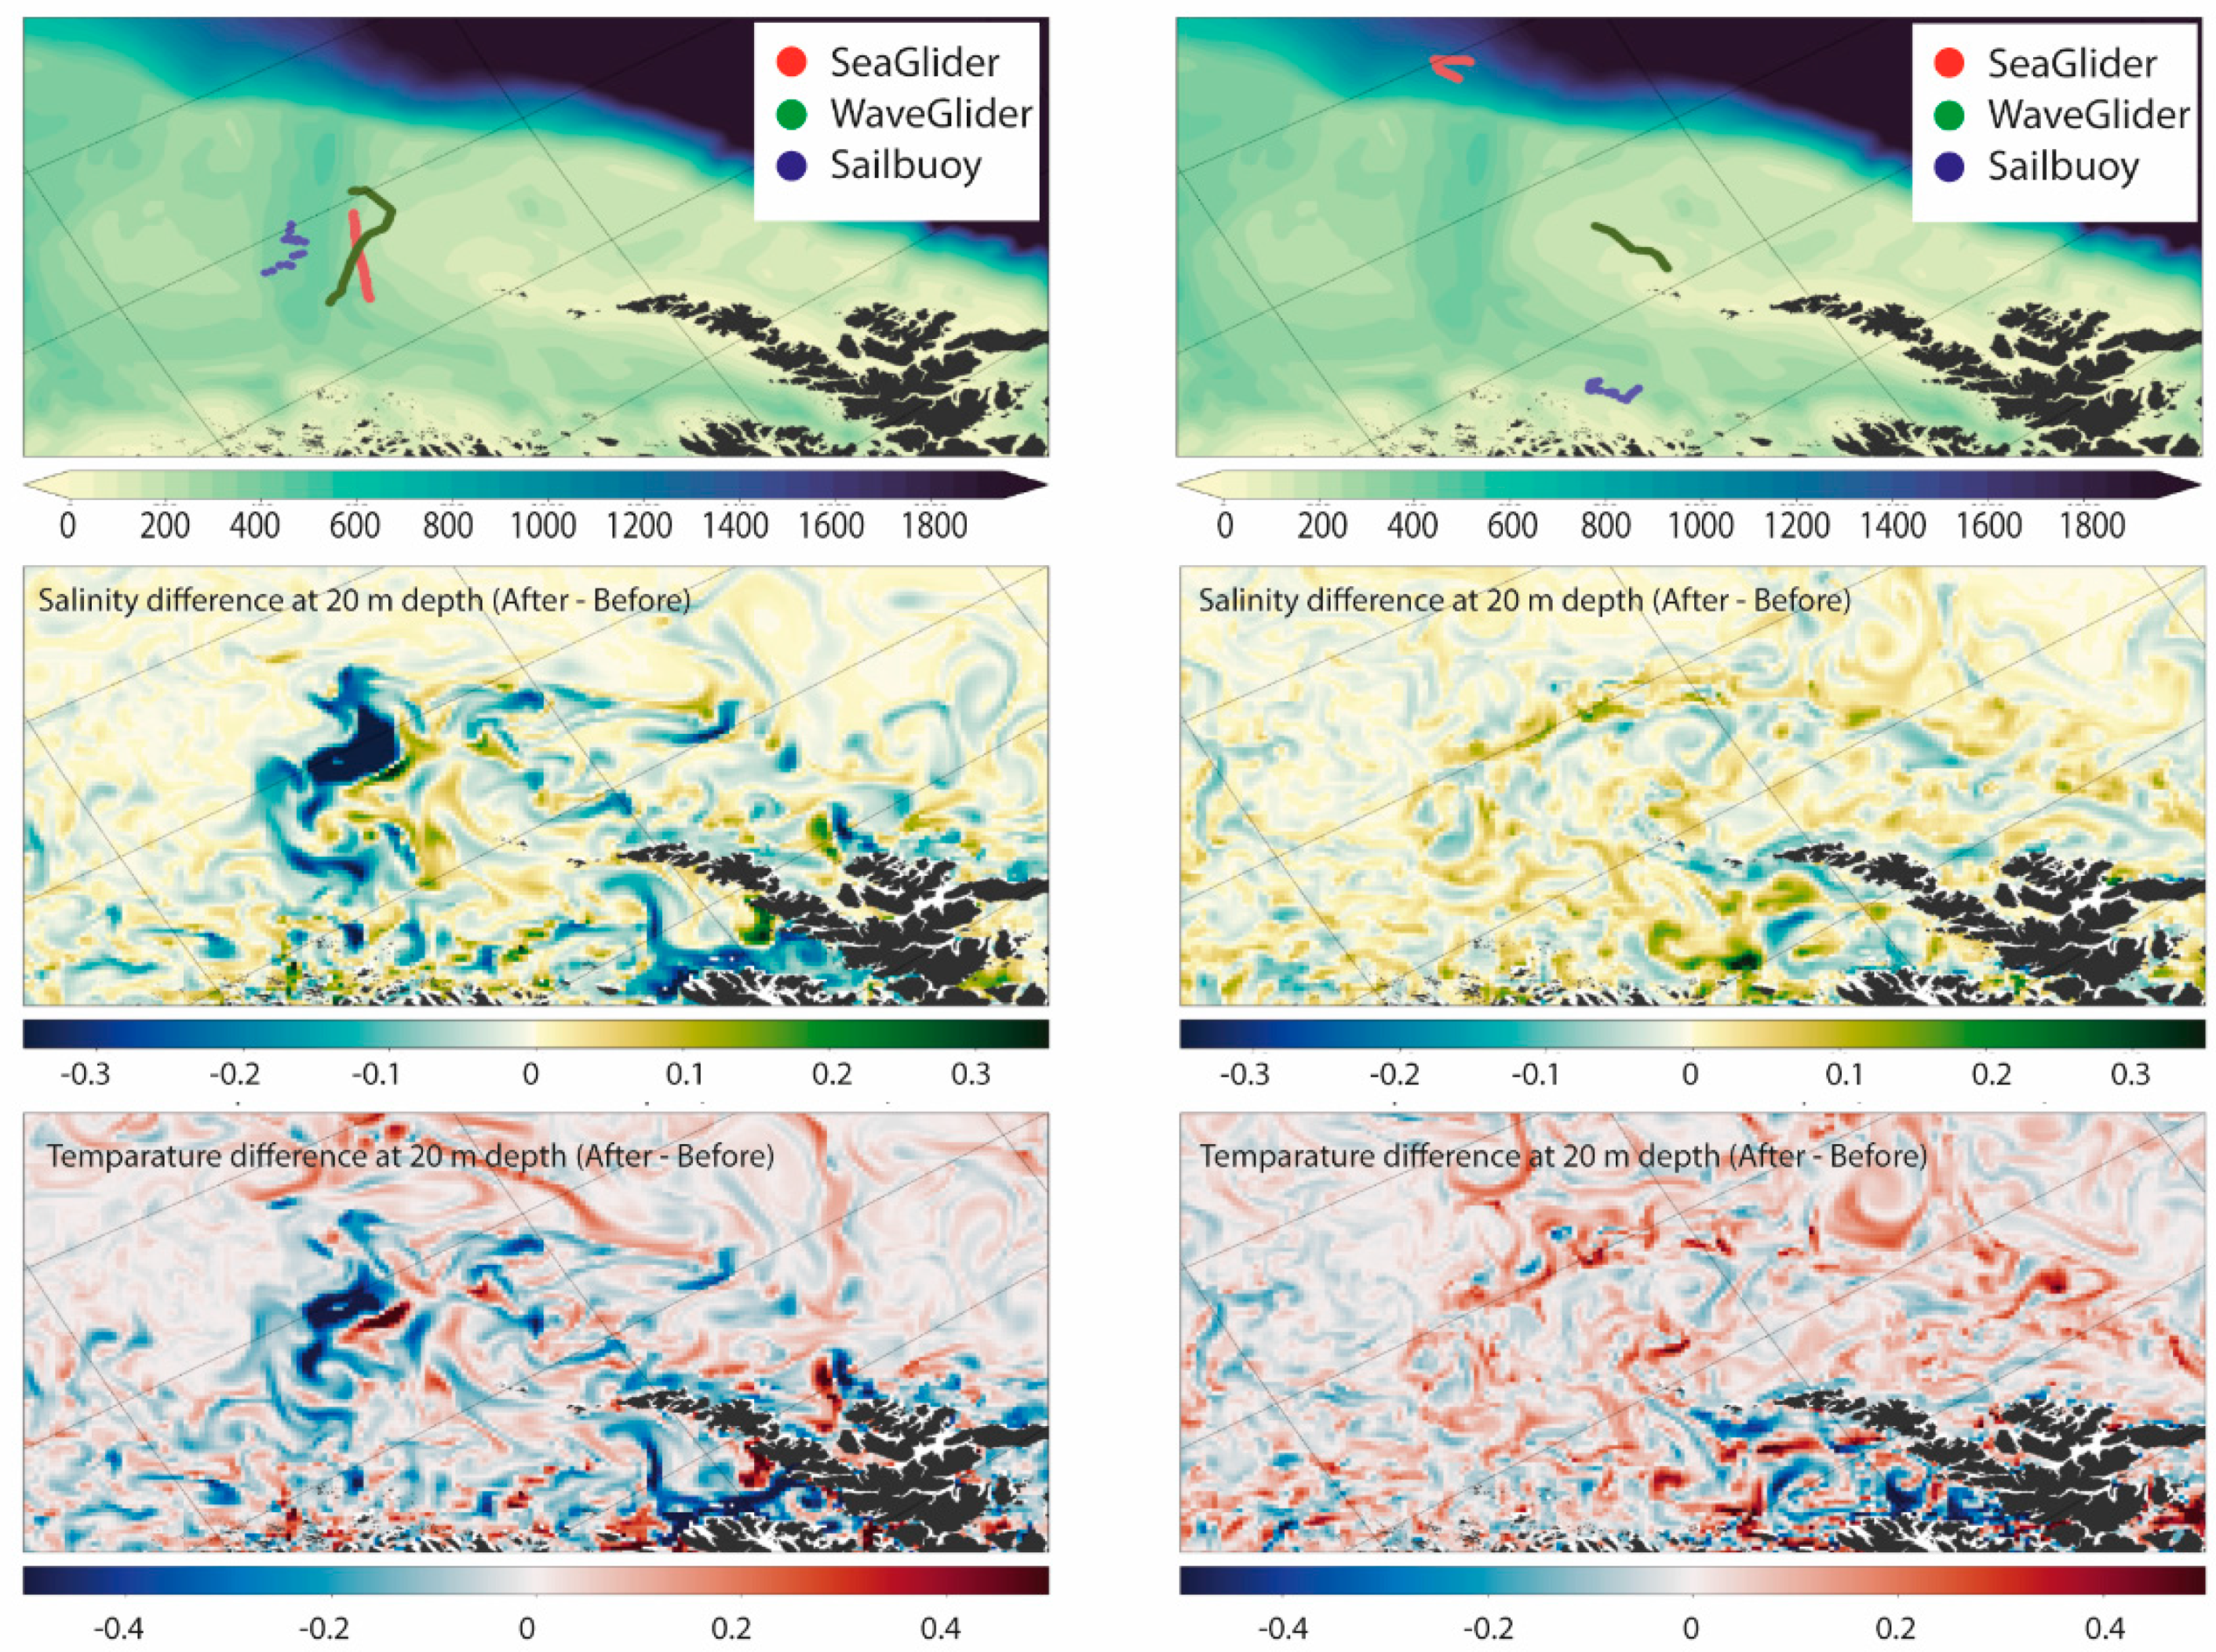
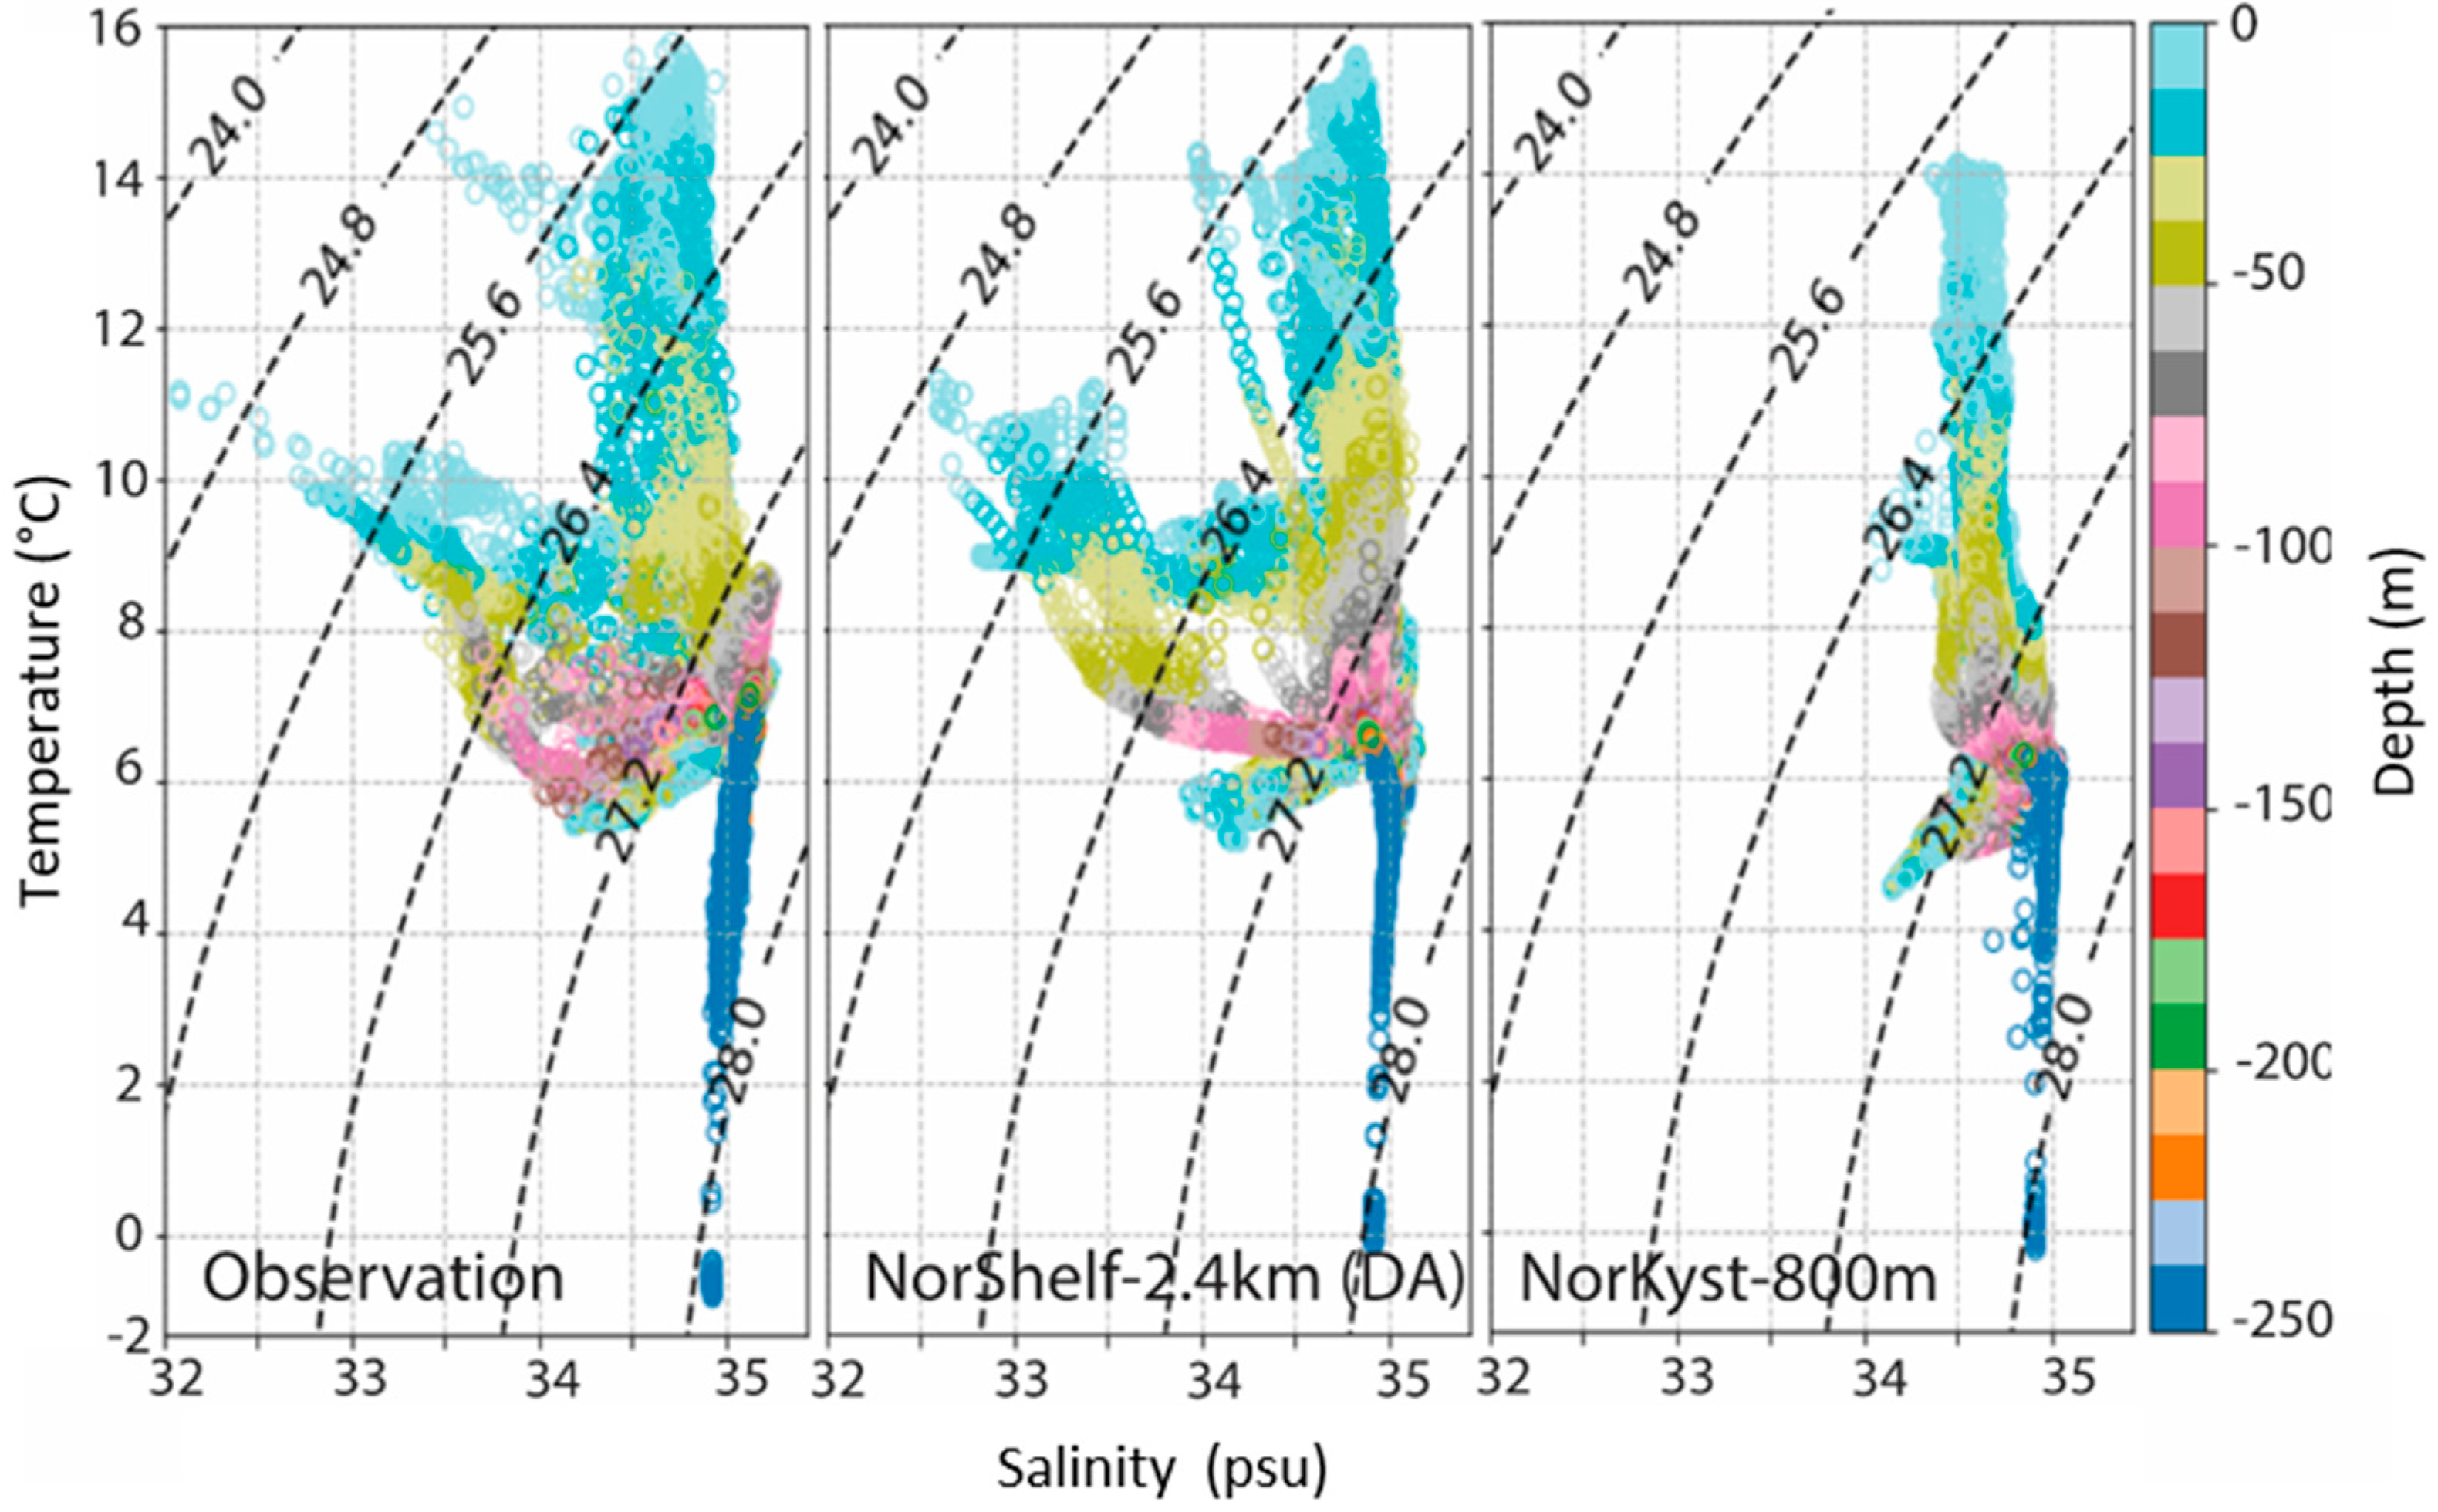
The Observer/AMARG4 hydrophone installed on the Seaglider® was able to record cetacean vocalizations, anthropogenic operations, and weather events across the LoVe continental shelf break and results from the spring records (March–April 2018) were recently published [11]. In short, delphinids, fin whales Balaenoptera physalus, humpback whales Megaptera novaeangliae, and sperm whales Physeter macrocephalus were identified during the deployment. During the first weeks (March), humpback whale calls were dominant on both the shelf and shelf edge, coinciding with the species’ well-known migration patterns toward breeding grounds [66,67]. From mid-April, during the spring phytoplankton bloom, sperm whales and delphinids were mostly recorded. Sperm whales were mostly detected in more open waters and within a 400 m underwater canyon, coinciding with their preferred foraging habitat [11]. This analysis showed seasonal and spatial variability in marine mammal detections.
Manual and automatic detection of anthropogenic noise identified sounds that could be attributed to distinct human activities in the area. The most common anthropogenic noises detected were vessel propellers (maritime traffic), seismic surveys, and offshore operations. A preliminary analysis of the entire survey seems to confirm that ship traffic is the most encountered type of anthropogenic sound. However, while ship traffic represents the most frequently recorded source of anthropogenic disturbance, seismic shooting activities were also detected, with some activities overlapping in both time and frequency with marine mammal vocalizations (Figure 7).

3.4. Ocean Modeling

Seaglider®, Sailbuoy, and Wave Glider observations were assimilated into the NorShelf-2.4km model daily by ingesting data from the past two days to produce improved initial conditions for the ocean forecast and the nested high-resolution ocean model of the LoVe region. The assimilation of glider observations had a significant impact on the model fields. While the maximum analysis increments occurred near the glider’s locations, glider data assimilation also had a considerable effect on adjusting the remote hydrographical field (Figure 8).
The difference between the two models was mainly dominated by salinity (Figure 9). NorShelf-2.4km had a more realistic description of the low-saline water masses associated with the Norwegian Coastal Current and better overall agreement with the observations. Our results indicated that even with relatively limited incorporation of glider observations, the model performance was improved over a larger geographical extent. This functionality of Gliders, in turn, provided a significant gain in adjusting the simulations and may help to constrain small-scale circulation features, such as mesoscale eddies. Gliders can thus be an important complement to the existing observations [57]. The previous ocean model simulation for the LoVe region (METreport-04/2018 ISSN 2387-4201 Oceanography) showed a strong negative bias both in salinity and temperature fields. This could be an indication of an inaccurate freshwater in-flow budget. In the LoVe region, the NwAC meets a narrow continental shelf, where large-scale flow dynamics directly affect the oceanic micro-processes. The multiscale high-resolution setup was helpful in better resolving those processes (for more details, see [57]).

4. Discussion

In this paper, we presented results from the GLIDER project in which two surface and one subsurface vehicle were deployed to collect ecological and environmental data throughout the LoVe region, from March to September 2018. In these months, the gliders recorded data during a period of increased biological activity starting prior to the onset of the spring phytoplankton bloom, zooplankton overwintering ascendance and reproduction, and cetacean migrations. Previously, four operational factors were identified as limiting the use of ocean observatories in ecological and fisheries applications: “(1) limited spatial coverage, (2) limited integration of multiple types of technologies, (3) limitations in the experimental design for in situ studies, and (4) potential unpredicted bias in monitoring outcomes due to the infrastructure’s presence and functioning footprint” [29]. The results presented here demonstrate that gliders can be effectively used as noninvasive ocean observatories for ecosystem monitoring and as research platforms expanding spatial coverage over a wide spatiotemporal scale while integrating multiple types of sensors able to record environmental and biological variables. Gliders thus add to the toolkit of long-term remote noninvasive devices tested in the Norwegian Arctic (e.g., [12,14,68]). Traditionally, autonomous vehicles have mainly been used for collecting physical and chemical data from the oceans. Direct observations of multiple trophic levels have been lacking partly due to the size and power consumption of older scientific echo sounders hampering the deployment onboard autonomous vehicles. The small echo sounders deployed in this project, however, allowed for data collection of zooplankton densities and distribution over the whole deployment period, ensuring detection of the organisms in an undisturbed state. The Sailbuoy survey reliably recorded data over a large spatiotemporal scale and thus provided new insights into plankton distribution patterns and behavior that would not have been possible to observe using traditional ship-based instrumentation alone due to among other issues, the duration and costs of research cruises collecting data daily, over a period of months. Furthermore, while hull-mounted echo sounders generally fail to provide data from the upper 5–20 m of the water column due to strong acoustic reflections from the surface and the ship’s draft that obscures the near-surface region [69], the echo sounder on the Sailbuoy recorded zooplankton densities at shallow depths (2–10 m depth) with little to no negative effects due to mechanical noise [49]. This is because transducers were mounted at a deeper water depth on a surface vessel as compared to gliders. Nevertheless, the quality of the acoustic records in the upper layers did vary with weather conditions as bubble entrainment during periods of strong wind and high wave action disturbed the signal mainly in the upper four meters, but on occasions even down to 25 m. In addition, the acoustic data provided by the Sailbuoy were recorded without introducing light pollution. Recently, it was shown that biological surveys performed in the dark by illuminated ships, may introduce biases on biological sampling, bioacoustic surveys, and possibly stock assessments of commercial and non-commercial species, due to among others, disruption of species diel vertical migration and strong light-escape responses [70,71,72]. This becomes especially problematic in the Arctic polar night, characterized by low irradiance levels day and night.
The glider echo sounder survey aimed at mapping zooplankton densities in the uppermost 50 m of the water column by employing 70 kHz (ES70-18CD) and 333 kHz (ES333-7CDK) center frequency transducers. These are not optimal for the detection and quantification of fish, due to the acoustic frequencies and pulse repetition frequencies employed. However, to expand glider capabilities and perform fish acoustic assessments in the future, a 200 kHz transducer can be adapted. Another potential approach is operating the echo sounder in CW mode (narrowband) and utilizing transducers with a wider beamwidth.
The results presented here corroborate the effectiveness of gliders equipped with passive acoustic monitoring devices in collecting long-term marine mammal data and anthropogenic noise across a wide geographical area, with minimal disturbance to animals [11,37]. The novel Seaglider®-integrated hydrophone used in this study was able to record cetacean vocalizations. The production of time series datasets during periods of unknown animal distribution contributes to the growing body of knowledge on marine mammal distribution in the Norwegian sea outside traditional summer survey periods. Although it is generally known that sperm whales are often found along the continental slope, this fact had not yet been documented in the Norwegian Sea and outside summer months. Furthermore, recordings of humpback whale occurrence beyond the months previously reported in the literature for low-latitude migration shows that not only can gliders equipped with passive acoustic equipment document species distribution, but they can also address gaps in areas and periods of the year for which there is a severe lack of information [44,73]. Advantages of using gliders for recording cetaceans include cost efficiency, the capability of working under adverse weather conditions, and the collection of passive acoustic data over periods of weeks to months (e.g., [11]). Gliders are quiet monitoring platforms with a much lower acoustic impact on the ecosystem compared to traditional ship-based survey systems. As for zooplankton data collection, this is not achievable with traditional research platforms such as research vessels, but it is essential to detect ecosystem changes brought about by anthropogenic or natural disturbances (i.e., storms).
Although both the Seaglider® and Wave Glider were equipped with hydrophones, only the data recorded by the Seaglider® were processed due to the large amount of data collected by each platform and time/budget constraints associated with data processing. Furthermore, considerations would have to be made for sampling that occurred at a single depth (Wave Glider) and sampling across multiple depths of the water column (Seaglider®), which would likely not be comparable due to the latter recording data at a different spatial plane. This study also showed the potential of gliders to detect and record anthropogenic noise, and when overlapping with cetacean vocal activity, how noise may represent a potential stressor for marine mammals. Underwater noise radiated by ships was previously recorded in LoVe and is one of the main sources of anthropogenic marine noise [74,75]. On the technical side, the placement of acoustic sensors onboard autonomous vehicles will influence the quality of the data obtained. In the first Wave Glider deployment, the hydrophone was installed on the keel of the surface float, resulting in the sound of the wave breaking on the keel saturating the spectrogram for the duration of the survey. Yet, we observed that installing the hydrophone on a towed cable attached to the subsurface glider decreased drastically the recording of the self-noise produced by the float.
Regarding ocean modeling, our results showed the importance and complementary role of gliders in increasing the accuracy of the ocean circulation models. We noted that by assimilating a few sporadic glider observations, our model’s performance was greatly improved. A systematic glider-based observing system can be an important complement to better constrain small-scale circulation features [53]. Additionally, our experiments demonstrated that high-resolution observations combined with an eddy-resolving multi-scale model could improve simulation skills towards capturing multiscale flow dynamics, which is fundamental in the understanding of mass and energy transport mechanisms in the oceanic environment. The GLIDER project demonstrated that a suite of autonomous vehicles can collect physical oceanographic parameters alongside biological data across multiple ecosystem components in the coastal Arctic. The productive waters of the LoVe region are shared by ecological important low (phytoplankton and zooplankton) and high (marine mammals) trophic groups and an increasing number of human stakeholders. High spatial and temporal resolution data collected with a small environmental footprint and made available by the GLIDER data management platform make it possible to capture ecosystem dynamics, important towards the realization of an ecosystem-based management approach in the region and elsewhere. The integration between the current underwater observatory system in LoVe and gliders should be prioritized to form an ecosystem observatory module network able to provide unique marine research and monitoring capabilities.

Author Contributions

Conceptualization, L.C., S.L.B., K.H.C., J.C., M.D., K.D., S.F.-P., P.F., P.G., G.G., I.G., D.H., D.P., J.P., G.P., K.S., A.K.S., S.T., V.T. and S.D.; methodology, L.C., A.S.A., M.A., K.B., S.L.B., K.H.C., M.D., K.D., S.F.-P., P.F., P.G., G.G., I.G., D.H., T.K., J.P., G.P., K.S., A.K.S., L.T., S.T. and V.T.; software, K.B., J.C., G.F., P.G., G.G., T.L., O.A.N., J.P., G.P., K.S., A.K.S., S.T. and V.T.; validation, K.B., S.L.B., K.H.C., M.D., S.F.-P., P.F., P.G., G.G., D.H., T.K., J.P., G.P., K.S., A.K.S. and V.T.; formal analysis, A.S.A., M.D., P.G., G.P. and L.T.; investigation, A.S.A., M.A., K.B., S.L.B., K.H.C., M.D., S.F.-P., P.G. and L.T.; resources, I.G., D.H. and D.P.; data curation, A.S.A., G.P., K.S., A.K.S., L.T. and S.T.; writing—original draft preparation, L.C., H.A., M.D., P.G. and A.K.S.; writing—review and editing, L.C., H.A., A.S.A., M.A., K.B., S.L.B., K.H.C., J.C., M.D., K.D., S.F.-P., P.F., G.F., P.G., G.G., I.G., D.H., T.K., T.L., O.A.N., D.P., J.P., G.P., K.S., A.K.S., L.T., S.T., V.T., H.L. and S.D.; visualization, L.C., H.A., M.D., G.F., P.G., T.L., J.P., G.P. and A.K.S.; supervision, G.P.; project administration, L.C., M.A., K.D. and S.D.; funding acquisition, L.C., I.G. and S.D. All authors have read and agreed to the published version of the manuscript.

Funding

This research was carried out as part of the GLIDER project, which was funded by the DEMO2000 research program (Norwegian Research Council and ConocoPhillips Skandinavia AS, project 269188, “Unmanned ocean vehicles, a flexible and cost-efficient offshore monitoring and data management approach”).

Conflicts of Interest

The authors declare that this study received partial funding from ConocoPhillips Skandinavia AS. This funder was not involved in the study design, collection, analysis, interpretation of data, or the decision to submit this article for publication.

References

  1. Bigg, G.R.; Jickells, T.D.; Liss, P.S.; Osborn, T.J. The role of the oceans in climate. Int. J. Climatol. 2003, 23, 1127–1159. [Google Scholar] [CrossRef]
  2. FAO. The State of World Fisheries and Aquaculture 2020. Sustainability in Action; FAO: Rome, Italy, 2020. [Google Scholar]
  3. Field, C.B.; Behrenfeld, M.J.; Randerson, J.T.; Falkowski, P. Primary production of the biosphere: Integrating terrestrial and oceanic components. Science 1998, 281, 237–240. [Google Scholar] [CrossRef] [PubMed] [Green Version]
  4. IOC-UNESCO. Global Ocean Science Report 2020—Charting Capacity for Ocean Sustainability; UNESCO Publishing: Paris, France, 2020. [Google Scholar]
  5. Schmitt, R.W. The ocean’s role in climate. Oceanography 2018, 31, 32–40. [Google Scholar] [CrossRef] [Green Version]
  6. Visbeck, M. Ocean science research is key for a sustainable future. Nat. Commun. 2018, 9, 4. [Google Scholar] [CrossRef]
  7. Costello, C.; Cao, L.; Gelcich, S.; Cisneros-Mata, M.Á.; Free, C.M.; Froehlich, H.E.; Golden, C.D.; Ishimura, G.; Maier, J.; Macadam-Somer, I.; et al. The future of food from the sea. Nature 2020, 588, 95–100. [Google Scholar] [CrossRef]
  8. Jouffray, J.-B.; Blasiak, R.; Norström, A.V.; Österblom, H.; Nyström, M. The blue acceleration: The trajectory of human expansion into the ocean. One Earth 2020, 2, 43–54. [Google Scholar] [CrossRef] [Green Version]
  9. Winther, J.-G.; Dai, M.; Rist, T.; Hoel, A.H.; Li, Y.; Trice, A.; Morrissey, K.; Juinio-Meñez, M.A.; Fernandes, L.; Unger, S.; et al. Integrated ocean management for a sustainable ocean economy. Nature Ecol. Evol. 2020, 4, 1451–1458. [Google Scholar] [CrossRef]
  10. Testor, P.; de Young, B.; Rudnick, D.L.; Glenn, S.; Hayes, D.; Lee, C.M.; Pattiaratchi, C.; Hill, K.; Heslop, E.; Turpin, V.; et al. OceanGliders: A component of the integrated GOOS. Front. Mar. Sci. 2019, 6, 32. [Google Scholar] [CrossRef] [Green Version]
  11. Aniceto, A.S.; Pedersen, G.; Primicerio, R.; Biuw, M.; Lindstrøm, U.; Camus, L. Arctic marine data collection using oceanic gliders: Providing ecological context to cetacean vocalizations. Front. Mar. Sci. 2020, 7, 983. [Google Scholar] [CrossRef]
  12. Aguzzi, J.; Albiez, J.; Flögel, S.; Godø, O.R.; Grimsbø, E.; Marini, S.; Pfannkuche, O.; Rodriguez, E.; Thomsen, L.; Torkelsen, T.; et al. A flexible autonomous robotic observatory infrastructure for bentho-pelagic monitoring. Sensors 2020, 20, 1614. [Google Scholar] [CrossRef] [Green Version]
  13. Davis, R.E.; Eriksen, C.C.; Jones, C.P. Autonomous buoyancy-driven underwater gliders. In Technology and Applications of Autonomous Underwater Vehicles; Griffiths, G., Ed.; Taylor & Francis: London, UK, 2002; pp. 37–58. [Google Scholar]
  14. Lee, C.M.; Thomson, J.; Marginal Ice Zone and Arctic Sea State Teams. An autonomous approach to observing the seasonal ice zone in the Western Arctic. Oceanography 2017, 30, 56–68. [Google Scholar] [CrossRef] [Green Version]
  15. Whitt, C.; Pearlman, J.; Polagye, B.; Caimi, F.; Muller-Karger, F.; Copping, A.; Spence, H.; Madhusudhana, S.; Kirkwood, W.; Grosjean, L.; et al. Future vision for autonomous ocean observations. Front. Mar. Sci. 2020, 7, 24. [Google Scholar] [CrossRef]
  16. Höffle, H.; Solemdal, P.; Korsbrekke, K.; Johannessen, M.; Bakkeplass, K.; Kjesbu, O.S. Variability of northeast Arctic cod (Gadus morhua) distribution on the main spawning grounds in relation to biophysical factors. ICES J. Mar. Sci. 2014, 71, 1317–1331. [Google Scholar] [CrossRef]
  17. Melle, W.; Runge, J.; Head, E.; Plourde, S.; Castellani, C.; Licandro, P.; Pierson, J.; Jonasdottir, S.; Johnson, C.; Broms, C.; et al. The North Atlantic Ocean as habitat for Calanus finmarchicus: Environmental factors and life history traits. Prog. Oceanogr. 2014, 129, 244–284. [Google Scholar] [CrossRef] [Green Version]
  18. Opdal, A.F.; Vikebo, F.B. Long-term stability in modelled zooplankton influx could uphold major fish spawning grounds on the Norwegian continental shelf. Can. J. Fish. Aquat. Sci. 2016, 73, 189–196. [Google Scholar] [CrossRef]
  19. Weidberg, N.; Basedow, S.L. Long-term variability in overwintering copepod populations in the Lofoten Basin: The role of the North Atlantic oscillation and trophic effects. Limnol. Oceanogr. 2019, 64, 2044–2058. [Google Scholar] [CrossRef] [Green Version]
  20. Ministry of Climate and Environment. Norway’s Integrated Ocean Management Plans. Barents Sea–Lofoten Area; the Norwegian Sea; and the North Sea and Skagerrak. Meld. St. 20 (2019–2020) 2020. Available online: https://www.regjeringen.no/contentassets/5570db2543234b8a9834606c33caa900/en-gb/pdfs/stm201920200020000engpdfs.pdf (accessed on 7 October 2021).
  21. Camus, L.; Pedersen, G.; Falk-Petersen, S.; Dunlop, K.; Daase, M.; Basedow, S.L.; Bandara, K.; Tverberg, V.; Pederick, J.; Peddie, D.; et al. Autonomous surface and underwater vehicles reveal new discoveries in the Arctic Ocean. In Proceedings of the OCEANS 2019 Conference, Marseille, France, 17–20 June 2019; pp. 1–8. [Google Scholar]
  22. Aguzzi, J.; Chatzievangelou, D.; Company, J.B.; Thomsen, L.; Marini, S.; Bonofiglio, F.; Juanes, F.; Rountree, R.; Berry, A.; Chumbinho, R.; et al. The potential of video imagery from worldwide cabled observatory networks to provide information supporting fish-stock and biodiversity assessment. ICES J. Mar. Sci. 2020, 77, 2396–2410. [Google Scholar] [CrossRef]
  23. Zuazo, A.; Grinyó, J.; López-Vázquez, V.; Rodríguez, E.; Costa, C.; Ortenzi, L.; Flögel, S.; Valencia, J.; Marini, S.; Zhang, G.; et al. An automated pipeline for image processing and data treatment to track activity rhythms of paragorgia arborea in relation to hydrographic conditions. Sensors 2020, 20, 6281. [Google Scholar] [CrossRef]
  24. Osterloff, J.; Nilssen, I.; Järnegren, J.; Van Engeland, T.; Buhl-Mortensen, P.; Nattkemper, T.W. Computer vision enables short- and long-term analysis of Lophelia pertusa polyp behaviour and colour from an underwater observatory. Sci. Rep. 2019, 9, 6578. [Google Scholar] [CrossRef] [PubMed]
  25. Osterloff, J.; Nilssen, I.; Nattkemper, T.W. A computer vision approach for monitoring the spatial and temporal shrimp distribution at the LoVe observatory. Methods Oceanogr. 2016, 15–16, 114–128. [Google Scholar] [CrossRef]
  26. Chatzievangelou, D.; Bahamon, N.; Martini, S.; del Rio, J.; Riccobene, G.; Tangherlini, M.; Danovaro, R.; De Leo, F.C.; Pirenne, B.; Aguzzi, J. Integrating diel vertical migrations of bioluminescent deep scattering layers into monitoring programs. Front. Mar. Sci. 2021, 8, 615. [Google Scholar] [CrossRef]
  27. Griffiths, J.R.; Kadin, M.; Nascimento, F.J.A.; Tamelander, T.; Törnroos, A.; Bonaglia, S.; Bonsdorff, E.; Brüchert, V.; Gårdmark, A.; Järnström, M.; et al. The importance of benthic–pelagic coupling for marine ecosystem functioning in a changing world. Global Change Biol. 2017, 23, 2179–2196. [Google Scholar] [CrossRef] [PubMed] [Green Version]
  28. Thomsen, L.; Aguzzi, J.; Costa, C.; De Leo, F.; Ogston, A.; Purser, A. The oceanic biological pump: Rapid carbon transfer to depth at Continental Margins during Winter. Sci. Rep. 2017, 7, 10763. [Google Scholar] [CrossRef] [Green Version]
  29. Rountree, R.; Aguzzi, J.; Marini, S.; Fanelli, E.; De Leo, F.; del Rio, J.; Juanes, F. Towards an optimal design for ecosystem-level ocean observatories. In Oceanography and Marine Biology: An Annual Review; Hawkins, S.J., Allcock, A.L., Bates, A.E., Evans, A.J., Firth, L.B., McQuaid, C.D., Russell, B.D., Smith, I.P., Swearer, S.E., Todd, P.A., Eds.; Taylor & Francis: Milton Park, UK, 2020; Volume 58, pp. 79–105. [Google Scholar]
  30. Danovaro, R.; Aguzzi, J.; Fanelli, E.; Billett, D.; Gjerde, K.; Jamieson, A.; Ramirez-Llodra, E.; Smith, C.R.; Snelgrove, P.V.R.; Thomsen, L.; et al. An ecosystem-based deep-ocean strategy. Science 2017, 355, 452–454. [Google Scholar] [CrossRef] [PubMed]
  31. Eriksen, C.C.; Osse, T.J.; Light, R.D.; Wen, T.; Lehman, T.W.; Sabin, P.L.; Ballard, J.W.; Chiodi, A.M. Seaglider: A long-range autonomous underwater vehicle for oceanographic research. IEEE J. Ocean. Eng. 2001, 26, 424–436. [Google Scholar] [CrossRef] [Green Version]
  32. Konsberg Seaglider. Available online: https://www.kongsberg.com/globalassets/maritime/km-products/documents/seaglider_product_specification.pdf (accessed on 7 October 2021).
  33. Manley, J.; Willcox, S. The Wave Glider: A persistent platform for ocean science. In Proceedings of the OCEANS’10 Conference, Sydney, NSW, Australia, 24–27 May 2010; pp. 1–5. [Google Scholar]
  34. Robotics, L. The Wave Glider Spec Sheet. Available online: https://www.info.liquid-robotics.com/wave-glider-spec-sheet (accessed on 7 October 2021).
  35. Ghani, M.H.; Hole, L.R.; Fer, I.; Kourafalou, V.H.; Wienders, N.; Kang, H.; Drushka, K.; Peddie, D. The SailBuoy remotely-controlled unmanned vessel: Measurements of near surface temperature, salinity and oxygen concentration in the Northern Gulf of Mexico. Methods Oceanogr. 2014, 10, 104–121. [Google Scholar] [CrossRef] [Green Version]
  36. Offshore Sensing AS. The Sailbuoy. Available online: www.sailbuoy.no/images/datasheet/Sailbuoy_datasheet.pdf (accessed on 7 October 2021).
  37. Fregosi, S.; Harris, D.V.; Matsumoto, H.; Mellinger, D.K.; Barlow, J.; Baumann-Pickering, S.; Klinck, H. Detections of whale vocalizations by simultaneously deployed bottom-moored and deep-water mobile autonomous hydrophones. Front. Mar. Sci. 2020, 7, 18. [Google Scholar] [CrossRef]
  38. Boss, E.; Waite, A.; Muller-Karger, F.; Yamazaki, H.; Wanninkhof, R.; Uitz, J.; Thomalla, S.; Sosik, H.; Sloyan, B.; Richardson, A.; et al. Beyond chlorophyll fluorescence: The time is right to expand biological measurements in ocean observing programs. Limnol. Oceanogr. Bull. 2018, 27, 89–90. [Google Scholar] [CrossRef] [Green Version]
  39. Basedow, S.L.; McKee, D.; Lefering, I.; Gislason, A.; Daase, M.; Trudnowska, E.; Egeland, E.S.; Choquet, M.; Falk-Petersen, S. Remote sensing of zooplankton swarms. Sci. Rep. 2019, 9, 686. [Google Scholar] [CrossRef]
  40. Slagstad, D.; Tande, K.S. The importance of seasonal vertical migration in across shelf transport of Calanus finmarchicus. Ophelia 1996, 44, 189–205. [Google Scholar] [CrossRef]
  41. Bachiller, E.; Skaret, G.; Nøttestad, L.; Slotte, A. Feeding ecology of Northeast Atlantic mackerel, Norwegian spring-spawning herring and blue whiting in the Norwegian Sea. PLoS ONE 2016, 11, e0149238. [Google Scholar] [CrossRef] [Green Version]
  42. Eiane, K.; Espinasse, M.; Espinasse, B. Environmental effects on zooplankton abundance on a sub-Arctic shelf off northern Norway. Aquat. Biol. 2018, 27, 75–86. [Google Scholar] [CrossRef]
  43. Olsen, E.; Aanes, S.; Mehl, S.; Holst, J.C.; Aglen, A.; Gjøsæter, H. Cod, haddock, saithe, herring, and capelin in the Barents Sea and adjacent waters: A review of the biological value of the area. ICES J. Mar. Sci. 2009, 67, 87–101. [Google Scholar] [CrossRef]
  44. Jourdain, E.; Vongraven, D. Humpback whale (Megaptera novaeangliae) and killer whale (Orcinus orca) feeding aggregations for foraging on herring (Clupea harengus) in Northern Norway. Mamm. Biol. 2017, 86, 27–32. [Google Scholar] [CrossRef]
  45. Koszalka, I.; LaCasce, J.H.; Andersson, M.; Orvik, K.A.; Mauritzen, C. Surface circulation in the Nordic Seas from clustered drifters. Deep-Sea Res. Part I 2011, 58, 468–485. [Google Scholar] [CrossRef]
  46. Børve, E.; Isachsen, P.E.; Nøst, O.A. Rectified tidal transport in Lofoten-Vesterålen, Northern Norway. Ocean Sci. Discuss. 2021, 2021, 1–33. [Google Scholar]
  47. Raj, R.P.; Johannessen, J.A.; Eldevik, T.; Nilsen, J.E.Ø.; Halo, I. Quantifying mesoscale eddies in the Lofoten Basin. J. Geophys. Res. Ocean. 2016, 121, 4503–4521. [Google Scholar] [CrossRef]
  48. Andrade, H.; van der Sleen, P.; Black, B.A.; Godiksen, J.A.; Locke, W.L.; Carroll, M.L.; Ambrose, W.G.; Geffen, A. Ontogenetic movements of cod in Arctic fjords and the Barents Sea as revealed by otolith microchemistry. Polar Biol. 2020, 43, 409–421. [Google Scholar] [CrossRef]
  49. Pedersen, G.; Falk-Petersen, S.; Dunlop, K.; Camus, L.; Daase, M.; Basedow, S.L.; Bandara, K.; Tverberg, V.; Pederick, J.; Peddie, D. Autonomous surface vehicles for persistent acoustic monitoring of zooplankton in a highly productive shelf area. In Proceedings of the OCEANS 2019 Conference, Marseille, France, 17–20 June 2019; pp. 1–7. [Google Scholar]
  50. Moloney, J.; Cole, A.; Hillis, C.; Kowarski, K.; MacDonald, B.; Pedersen, G.; Tassara, L.; Camus, L. Observer/amar g4 passive acoustic monitoring system for autonomous maritime observation. In Proceedings of the 2018 IEEE/OES Autonomous Underwater Vehicle Workshop (AUV), Porto, Portugal, 6–9 November 2018; pp. 1–9. [Google Scholar]
  51. Mordy, C.W.; Cokelet, E.D.; De Robertis, A.; Jenkins, R.; Kuhn, C.E.; Lawrence-Slavas, N.; Berchok, C.L.; Crance, J.L.; Sterling, J.T.; Cross, J.N.; et al. Advances in ecosystem research: Saildrone surveys of oceanography, fish, and marine mammals in the Bering Sea. Oceanography 2017, 30, 113–115. [Google Scholar] [CrossRef]
  52. Gillespie, D.; Mellinger, D.K.; Gordon, J.; McLaren, D.; Redmond, P.; McHugh, R.; Trinder, P.; Deng, X.Y.; Thode, A. PAMGUARD: Semiautomated, open source software for real-time acoustic detection and localization of cetaceans. J. Acoust. Soc. Am. 2009, 125, 2547. [Google Scholar] [CrossRef]
  53. Bioacoustics, C.f.C. Raven Pro: Interactive Sound Analysis Software; The Cornell Lab of Ornithology: Ithaca, NY, USA, 2019. [Google Scholar]
  54. Ghaffari, P.; Isachsen, P.E.; Nøst, O.A.; Weber, J.E. The influence of topography on the stability of the Norwegian Atlantic Current off Northern Norway. J. Phys. Oceanogr. 2018, 48, 2761–2777. [Google Scholar] [CrossRef]
  55. Röhrs, J.; Sperrevik, A.; Christensen, K. NorShelf: A Reanalysis and Data-Assimilative Forecast Model for the Norwegian Shelf Sea; Norwegian Metheorogical Institute: Oslo, Norway, 2018. [Google Scholar]
  56. Sperrevik, A.K.; Christensen, K.H.; Röhrs, J. Constraining energetic slope currents through assimilation of high-frequency radar observations. Ocean Sci. 2015, 11, 237–249. [Google Scholar] [CrossRef] [Green Version]
  57. Ghaffari, P.; Sperrevik, A.; Nøst, O.A.; Christensen, K.H.; Camus, L. Complementary role of Glider data on the modelling of multi-scale dynamics in the Norwegian coastal and fjord regions. In Proceedings of the OCEANS 2019 Conference, Marseille, France, 17–20 June 2019; pp. 1–6. [Google Scholar]
  58. Chen, C.; Liu, H.; Beardsley, R.C. An unstructured grid, finite-volume, three-dimensional, primitive equations ocean model: Application to coastal ocean and estuaries. J. Atmos. Ocean. Technol. 2003, 20, 159–186. [Google Scholar] [CrossRef]
  59. Langeland, T.; Cook, J.; Tjøstheim, S.; Kristiansen, T.; Fonnes, G.; Lampe, O.D.; Pedersen, G.; Camus, L. A data management platform for data harvesting and analysis from autonomous marine measurement platforms. In Proceedings of the OCEANS 2019 Conference, Marseille, France, 17–20 June 2019; pp. 1–5. [Google Scholar]
  60. Buja, A.; McDonald, J.A.; Michalak, J.; Stuetzle, W. Interactive data visualization using focusing and linking. In Proceedings of the 2nd conference on Visualization ‘91, San Diego, CA, USA, 22–25 October 1991; IEEE Computer Society Press: San Diego, CA, USA, 1991; pp. 156–163. [Google Scholar]
  61. Pierre, J.; Oystein, H.D.; Jani, R.; Birgitta, L.A.; Sabine, M.; Trond, K.; Seppo, K.; Antoine, M. Quality Control of Biogeochemical Measurements within Copernicus in situ TAC. Available online: https://archimer.ifremer.fr/doc/00251/36232/ (accessed on 25 January 2021).
  62. Böhm, E.; Riminucci, F.; Bortoluzzi, G.; Colella, S.; Acri, F.; Santoleri, R.; Ravaioli, M. Operational use of continuous surface fluorescence measurements offshore Rimini to validate satellite-derived chlorophyll observations. J. Oper. Oceanogr. 2016, 9 (Suppl. 1), s167–s175. [Google Scholar] [CrossRef] [Green Version]
  63. Thomalla, S.J.; Moutier, W.; Ryan-Keogh, T.J.; Gregor, L.; Schütt, J. An optimized method for correcting fluorescence quenching using optical backscattering on autonomous platforms. Limnol. Oceanogr. Methods 2018, 16, 132–144. [Google Scholar] [CrossRef]
  64. Xing, X.; Claustre, H.; Blain, S.; D’Ortenzio, F.; Antoine, D.; Ras, J.; Guinet, C. Quenching correction for in vivo chlorophyll fluorescence acquired by autonomous platforms: A case study with instrumented elephant seals in the Kerguelen region (Southern Ocean). Limnol. Oceanogr. Methods 2012, 10, 483–495. [Google Scholar] [CrossRef] [Green Version]
  65. Maxwell, K.; Johnson, G.N. Chlorophyll fluorescence—A practical guide. J. Exp. Bot. 2000, 51, 659–668. [Google Scholar] [CrossRef]
  66. Broms, F.; Wenzel, F.; Suarez, P.L.; Stevick, P.; Biuw, M.; Jann, B.; Bouveret, L.; Rikardsen, A.; Ryan, C.; Berrow, S. Recent research on the migratory destinations of humpback whales (Megaptera novaeangliae) from a mid-winter feeding stop-over area in Northern Norway. In Proceedings of the 29th ECS Conference, St. Julian’s, Malta, 23–25 March 2015. [Google Scholar]
  67. Horton, T.W.; Zerbini, A.N.; Andriolo, A.; Danilewicz, D.; Sucunza, F. Multi-decadal humpback whale migratory route fidelity despite oceanographic and geomagnetic change. Front. Mar. Sci. 2020, 7, 414. [Google Scholar] [CrossRef]
  68. Andrade, H.; Massabuau, J.-C.; Cochrane, S.; Ciret, P.; Tran, D.; Sow, M.; Camus, L. High frequency non-invasive (HFNI) bio-sensors as a potential tool for marine monitoring and assessments. Front. Mar. Sci. 2016, 3, 187. [Google Scholar] [CrossRef]
  69. Scalabrin, C.; Marfia, C.; Boucher, J. How much fish is hidden in the surface and bottom acoustic blind zones? ICES J. Mar. Sci. 2009, 66, 1355–1363. [Google Scholar] [CrossRef] [Green Version]
  70. Berge, J.; Geoffroy, M.; Daase, M.; Cottier, F.; Priou, P.; Cohen, J.H.; Johnsen, G.; McKee, D.; Kostakis, I.; Renaud, P.E.; et al. Artificial light during the polar night disrupts Arctic fish and zooplankton behaviour down to 200 m depth. Commun. Biol. 2020, 3, 102. [Google Scholar] [CrossRef] [PubMed] [Green Version]
  71. Ludvigsen, M.; Berge, J.; Geoffroy, M.; Cohen, J.H.; De La Torre, P.R.; Nornes, S.M.; Singh, H.; Sørensen, A.J.; Daase, M.; Johnsen, G. Use of an autonomous surface vehicle reveals small-scale diel vertical migrations of zooplankton and susceptibility to light pollution under low solar irradiance. Sci. Adv. 2018, 4, eaap9887. [Google Scholar] [CrossRef] [PubMed] [Green Version]
  72. Peña, M. Mesopelagic fish avoidance from the vessel dynamic positioning system. ICES J. Mar. Sci. 2018, 76, 734–742. [Google Scholar] [CrossRef]
  73. Ramm, T. Hungry during Migration? Humpback Whale Movement from the Barents Sea to a Feeding Stopover in Northern Norway Revealed by Photo-ID Analysis; UiT Norges Arktiske Universitet: Tromsø, Norway, 2020. [Google Scholar]
  74. Hildebrand, J.A. Anthropogenic and natural sources of ambient noise in the ocean. Mar. Ecol. Prog. Ser. 2009, 395, 5–20. [Google Scholar] [CrossRef] [Green Version]
  75. Zhang, G.; Forland, T.N.; Johnsen, E.; Pedersen, G.; Dong, H. Measurements of underwater noise radiated by commercial ships at a cabled ocean observatory. Mar. Pollut. Bull. 2020, 153, 110948. [Google Scholar] [CrossRef]
Figure 1. Surface and subsurface platforms employed in the GLIDER project: (a) Seaglider® (Huntington Ingalls Industries; formerly Kongsberg Maritime); (b) Wave Glider SV3 (Liquid Robotics); and (c) Sailbuoy (Offshore Sensing).
Sensors 21 06752 g001
Figure 2. Extended Lofoten–Vesterålen (LoVe) region (insert) and tracks of surface and subsurface platforms deployed in the GLIDER project, from March to September 2018 (Orange: Seaglider®, Green: Wave Glider, Purple: Sailbuoy).
Sensors 21 06752 g002
Figure 3. Overview of the e-infrastructure implemented in the GLIDER project. The gliders send time-series data via satellite links, which are stored in the Kognifai digital ecosystem. Here, servers at Niva automatically perform data quality control and the data are available through a web portal. The NorShelf ocean model also assimilates data, improving ocean predictions. Satellite links are a potential communication resource not used in their presented work due to high costs.
Sensors 21 06752 g003
Figure 4. Example plots from the GLIDER web portal showing down-sampled data collected by the Seaglider® in the 2018 survey. In all plots, color on data points corresponds to the level of chlorophyll-a (CHl-a, fluorescence). (A) Depth along the Seaglider® path (x-axis is time, y-axis is depth). (B) Correlation between oxygen (x-axis) and CHl-a (y-axis). (C) Path travelled by Seaglider® for which data are displayed. Bottom panel shows the depth (D) and CHl-a-oxygen correlation (E) along the Seaglider® path (F) after the user applied a filter highlighting high CHl-a and oxygen values.
Sensors 21 06752 g004
Figure 5. Subset of environmental variables (fluorescence, temperature, salinity, and oxygen) recorded by the Wave Glider during a 1-month period (June–July 2018) across a transect in the LoVe region.
Sensors 21 06752 g005
Figure 6. Three examples of echograms of volume backscattering strength (SV) at 333 kHz collected by WBT Mini on the Sailbuoy in the upper 100 m and integrated over a 24 h period. The echograms display differences in zooplankton aggregation during the three periods and regions of the 2018 deployment. (A) April, deep and thin registrations in Vestfjord, (B) June, persistent dense layer in the upper 10–30 m, along the western coast of Vesterålen, (C) August, wide vertical distribution with indications of diel vertical migration, along the shelf break.
Sensors 21 06752 g006
Figure 7. Spectrogram showing the narrow frequency of a humpback whale (red) and a fin whale (orange) vocalization (A) and airgun shots from a seismic survey (B). Color represents sound from low (dark blue) to high intensity (yellow–red). Data collected with the Seaglider® equipped with an Observer/AMAR G4 from JASCO.
Sensors 21 06752 g007
Figure 8. Snapshots (left column: 20 March 2018, right column: 3 April 2018) of glider data assimilation influence on the NorShelf-2.4km model salinity and temperature fields. Upper panel: topography and gliders’ positions, middle panel: salinity difference at 20 m depth, lower panel: temperature difference at 20 m depth [57].
Sensors 21 06752 g008
Figure 9. Temperature–salinity diagrams (T-S) comparing observations collected by the gliders (left panel), the NorShelf-2.4km model (DA, central panel), and the NorKyst-800m model (right panel).
Sensors 21 06752 g009
Table 1. Sensors integrated on the gliders for the 2018 LoVe deployment.
ManufacturerSensorVariables
Wave Glider
Kongsberg MaritimeWBT Mini echo sounder (ES70-18CD, ES333-7CDK splitAcoustic backscatter
LiCorLight Sensor Li1500Photosynthetically active radiation in air
SAIVSAIV-SD204Salinity, temperature, density
Seapoint (on SAIV CTD)Seapoint Turbidity MeterTurbidity
Seapoint (on SAIV CTD)Seapoint Chlorophyll FluorometerCHl-a
Aanderaa XylemOptode 4831Oxygen
Aanderaa XylemSubmersible CO2 4797pCO2
AirmarAirmar 200WXWind speed and direction, air temperature, barometric pressure
Ocean InstrumentsSoundtrap HF hydrophone (parts of the deployment)Underwater sound
Sailbuoy
Kongsberg MaritimeWBT Mini echo sounder
(ES333-7CDK split)
Acoustic backscatter
Neil Brown Ocean SensorsNBOSI Cabled CT sensorSalinity, temperature, density
Aanderaa XylemOptode 4831Oxygen, temperature
Seaglider®
Sea-Bird ScientificSeaBird CT-SailTemperature, conductivity
Discontinued (formerly Kongsberg Maritime Contros)CONTROS HydroFlash® O2 optodeOxygen
Sea-Bird ScientificSeaOWL UV-ATotal particulate concentration
Sea-Bird ScientificSeaOWL UV-ACHl-a
Sea-Bird ScientificSeaOWL UV-AFDOM fluorescence
JASCOObserver/AMARG4Underwater sound
Table 2. Average and standard deviation of monthly temperature, salinity, and oxygen saturation measured from the Sailbuoy glider, from April to July 2018.
MonthTemperature (°C)Salinity (ppt)O2 Saturation (%)
April4.5 +/− 0.733.6 +/− 0.2101.2 +/− 2.1
May8.6 +/− 0.433.5 +/− 0.0110.0 +/− 1.6
July14.1 +/− 0.134.5 +/− 0.0104.7 +/− 0.6
Publisher’s Note: MDPI stays neutral with regard to jurisdictional claims in published maps and institutional affiliations.

